Article

The Resilience of a Resettled Flood-Prone Community: An Application of the RABIT Framework in Pasig City, Metro Manila

by
Nikko Torres Ner
1,*,
Seth Asare Okyere
2,
Matthew Abunyewah
3,
Louis Kusi Frimpong
4 and
Michihiro Kita
1
1
Division of Global Architecture, Graduate School of Engineering, Osaka University, Suita 565-0871, Osaka, Japan
2
School of Landscape Architecture and Planning, University of Arizona, Tucson, AZ 85721, USA
3
The Australasian Centre for Resilience Implementation for Sustainable Communities, Charles Darwin University, Darwin, NT 0810, Australia
4
Department of Geography and Earth Science, University of Environment and Sustainable Development, PMB, Somanya EY0329-2478, Eastern Region, Ghana
*
Author to whom correspondence should be addressed.
Sustainability 2023, 15(8), 6953; https://doi.org/10.3390/su15086953
Submission received: 16 February 2023 / Revised: 19 April 2023 / Accepted: 19 April 2023 / Published: 20 April 2023
(This article belongs to the Special Issue Advances in Urban Green Development and Resilient Cities)

Abstract

:
Resilience measurement is an emerging topic in the field of disaster risk reduction. However, its application in Global South cities has proven to be a challenge due to the uniqueness of southern urbanisms and data challenges. As a result, the Resilience Benchmarking Assessment and Impact Toolkit (RABIT) framework has recently been developed to support resilience assessment in informal, marginalized, and disaster-prone contexts of southern cities. This paper asserts the relevance of the RABIT framework and uses it to assess the resilience of Manggahan residences, a resettled marginalized community in Pasig City, Metro Manila. Drawing on a quantitative approach and using exploratory factor analysis (EFA), the study revealed that scale, robustness, and learning attributes of the RABIT framework are strong contributors to the community’s resilience. Self-organization, diversity, and redundancy have similar levels of contribution. Equality and rapidity were found to have the weakest relative contribution. The study findings emphasize the need to view resilience in resettled communities holistically and adopt an integrated and comprehensive approach that considers the multiple aspects of everyday life to proactively build adaptive and future resilient capacities.

1. Introduction

According to the Intergovernmental Panel on Climate Change (IPCC) [1], cities in the developing world are at the forefront of major hazards. These cities continue to remain major hotspots of disaster risks and vulnerabilities [2,3]. Climate change impacts, in combination with rapid urbanization and infrastructural lags, have increased the exposure of developing cities to numerous risks, such as floods [4]. Indeed, reports from EM-DAT point to an increasing trend in the frequency and intensity of flood risks [5], causing severe economic, social, and psychological stress to local people and disproportionally impacting the poor and the most vulnerable in many cities in developing countries. This situation is well-recognized and has led to an emerging consensus across the global and national levels to build the resilience of communities vulnerable to disaster risks [6,7]. Several global frameworks are in collective unison on the call to strengthen resilience at all levels. One of the foremost global frameworks for disaster risk reduction, the Sendai Framework, articulates the need to protect and strengthen the resilience of people, communities, and countries by planning for and reducing disaster risk [8]. Similarly, the Sustainable Development Goals (SDGs) explicitly call for resilience-building on multiple scales. Specifically, SDG 11 commits to ensuring cities are safe, inclusive, sustainable, and resilient. The New Urban Agenda also calls for strengthening the resilience of cities, with a particular focus on risk-prone areas such as informal settlements [9].
A key step towards strengthening resilience is by measuring it. Measuring resilience at different spatial scales to understand contextual situations, develop interventional strategies to mitigate disaster impacts, and strengthen communities’ ability to recover from and successfully adapt to adverse events is a key aspect of the resilience agenda. Over the years, the concept of resilience has extensively evolved across many disciplines, including disaster management [10,11]. The etymological and conceptual changes in the concept have resulted in a proliferation of disaster resilience assessment tools and indexes with different indicators [12]. For instance, the place-based composite resilience indices illustrate the important facets of resilience [13]. In addition, the baseline resilience indicators for community resilience (BRIC), the community disaster-resilience index (CDRI), Foster’s resilience-capacity index (RCI), and the disaster resilience of place (DROP) are employed to measure resilience at the provincial level [14,15,16,17]. All these resilience assessment tools have a similar objective of equipping communities to proactively adapt to, cope with, and thrive in the face of disaster events [18,19]. However, each assessment tool has its limitations.
According to Dianat et al. [20], most resilience-assessment tools do not measure all attributes of resilience. Marzi et al. [21] indicated that using a composite-index approach provides a clear picture only at the higher administrative levels and neglects the inherent variability of performance at the lower levels. Most importantly, the BRIC was developed considering context-specific issues in the United States, which makes generalization and application to Global South cities difficult [22,23]. Global South cities are characterized by informal settlements, defined as areas with locational characteristics that include flood-prone areas, poor infrastructure, and low socio-economic profiles [24,25]. Even though informal settlements are a major hotspot for disaster, few resilience assessment tools apply to this context. One resilience assessment tool that considers informal settlement characteristics is the Resilience Assessment Benchmarking and Impact Toolkit (RABIT) framework. The RABIT framework was developed based on an informal context of disaster vulnerability and works within the data and skill set limitations in informal areas [26]. This study, therefore, employs the RABIT framework in a low-income resettled housing community to ascertain its resilience. Specifically, it seeks to understand from a localized informal context and with reference to the dimensions of the RABIT framework which areas are contributing better to the community’s resilience and where improvements are needed to enhance resilient capacities and futures.
This research makes three major contributions. Although the RABIT framework has been used in informal contexts in Africa and Latin America, this is the first study to employ it within Southeast Asia—specifically, Manila. This helps to ascertain its relevance in disaster-hotspot regions such as Southeast Asia [27] and its role in supporting community-level resilience. Second, resilience measures often do not consider resettled areas, as if to implicitly assume the automatic transition of post-resettlement areas to resilient communities. Third, applying the RABIT framework allows a localized lens into so-called disaster-risk-improved communities to contextually understand areas that need further improvement. This allows a localized and situated perspective of previously flood-vulnerable but resettled communities as “evolutionary sites,” where resilience is not static or fixed in time but rather a dynamic process of continuous adjustment [28] that needs to be constantly supported and strengthened to ensure holistic and adaptive responses to present and future risks. Fundamentally, the study contributes to ongoing policy and scholarly discussions about the relationship between housing resettlement as a disaster risk reduction strategy and community resilience.
The present study was undertaken in Manggahan Residences (colloquially referred to as Manggahan LRB) in Pasig City, one of the most flood-prone cities in Metro Manila [29]. The work proceeds as follows. Following the introduction, a literature review on resilience and resilience measurement methodologies is discussed in Section 2. Section 3 provides the context and description of the study area. Section 4 details the methodology and analysis employed in the study. Section 5 presents the results of the analysis. The last section of the paper focuses on the discussion, implications, and conclusion.

2. Resilience and the RABIT Framework: An Overview

2.1. Overview of Resilience

In recent years, the concept of resilience has been gaining currency and attention across multiple academic fields [30]. This is because it provides a workable framework for examining the way in which systems adapt, transform, and persist despite facing serious disturbance [31]. However, there continues to be debate among scholars on its definition, policy applicability, and practice [32,33]. The widely accepted definition put forth by the IPCC [34] (p. 5) defines it as “the ability of a system and its component parts to anticipate, absorb, accommodate, or recover from the effects of a hazardous event in a timely and efficient manner.” Keating et al. [35] (p. 26) define it as “the ability of a system, community, or society to pursue its social, ecological, and economic development and growth objectives while managing its disaster risk over time, in a mutually reinforcing way.”
Recent conceptualizations of resilience proffer a non-equilibrium or evolutionary model [32,36,37,38]. Clark-Ginsberg et al. [39] succinctly encapsulate the evolutionary perspective of resilience as the system’s capacity to be able to weather external shocks while still maintaining normal functions and eventually moving into a state of adaptation and transformation. They summarize it as resilience meaning “bouncing forward” instead of “bouncing back” [39].
For the purposes and scope of this study, we examined resilience at the community level. There are two strands of academic literature on community resilience: first, as described by Holling [40] in the socio-ecological context, and second, in the psychosocial context, as explored by Alexander [41]. Community resilience is defined as a concept that enables the community to plan, prepare for, and more successfully adapt to actual or potentially detrimental scenarios efficiently and effectively [42] (p. 148). Magis [43] describes it as the community’s ability to engage, develop, and generate community resources to cope and persist in situations where there is a high degree of uncertainty and unpredictability.

2.2. Measuring Resilience

Resilience measurement has been progressively considered an essential step towards reducing disaster risk and facilitating adaptation to disasters [44,45]. The Sendai Framework has advocated for the application of scientific knowledge and evidence-based approaches in disaster risk reduction [8]. As such, methods to measure and monitor resilience have become abundant in recent years [2,42,46]. Jones [47] summarizes the scientific and evidence-based approaches to resilience measuring into objective and subjective. The objective approach to resilience measuring relies on self-assessed judgements and observations outside of those being measured [48,49]. In contrast, subjective resilience measurement frameworks involve the self-assessment of the cognitive and affective capabilities of individuals or households in responding to risk [50,51]. The objective resilience approach has numerous advantages over the subjective. For instance, the objective resilience approach adopts a fixed and transparent definition of the concept of resilience [49], allows for the comparison of different areas or groups [52], and relies on indicators that government agencies routinely collect [53].
Cutter’s [15] DROP framework utilizes a system of quantifiable indicators in six dimensions: community competence, ecological, economic, social, infrastructure, and institutional dimensions. This type of assessment has focused on the county scale, as it was developed in United States [23]. Similarly, the Baseline Resilience Indicators for Communities (BRIC), which is adapted from the DROP model, is among the most consistently cited frameworks for the measurement of resilience [54]. It includes 49 indicators of community resilience [13]. Despite it being one of the few to examine resilience metrics at the community level [55], implementation in Global South contexts would be a significant challenge, as it relies on secondary data [46], where data access and availability is a major setback.
Most of these resilience measurement methodologies are reliant on existing secondary data, such as census data and statistics [56]. Unfortunately, the adoption of these resilience frameworks presents challenges to developing countries due to the paucity of such data [57,58]. Furthermore, factors that determine resilience in measurement methodologies vary between and among geographical scales, and as such, translation, for example, from the national to community level tends to be cumbersome [54,57]. Extant studies conducted at the national and regional levels seem to be inadequate for resilience analysis at the local level [23]. Moreover, Keating et al. [59] note that few community disaster resilience measurement frameworks have been implemented in the field, with none empirically validated. Departing from this, we turn to the RABIT framework.

2.3. RABIT Framework

The RABIT framework was conceptualized and developed by researchers from the University of Manchester to tackle the issues of knowledge gaps from current resilience-measurement tools. It was designed to address the lack of robust tools for measuring the baseline metrics of resilience and the evaluation of the impact of development interventions on the level of resilience [60]. The framework was designed specifically with the context of developing countries in mind. It also offers a holistic and in-depth understanding of resilience at the community level [61].
Ospina and Heeks [60] identified eight attributes as properties that communities have to a lesser or greater degree (see Table 1). These include robustness, self-organization, and learning, considered core characteristics of resilient systems and referred to as foundational attributes. The other five characteristics are redundancy, rapidity, scale, diversity and flexibility, and equality, which are enabling attributes and facilitate the operationalization of the foundational attributes [60]. The framework has already been piloted in two separate case studies involving marginalized communities in Africa and Latin America [26,61]. The two pilot studies utilized a small sample size in their assessment but nevertheless yielded emergent findings that were not brought to light in previous resilience evaluations in marginalized urban communities [26]. Surprisingly, the framework has yet to be used in Southeast Asia—a region that, according to the latest World Risk Report [62], hosts some of the cities that face the highest disaster risks. In this regard, this study hopes to contribute and extend its application in the Southeast Asia region, specifically the Philippines. More importantly, it seeks to contribute to a better understanding of community resilience and generate insights for disaster risk reduction for resilience planners and practitioners.

3. Study Context

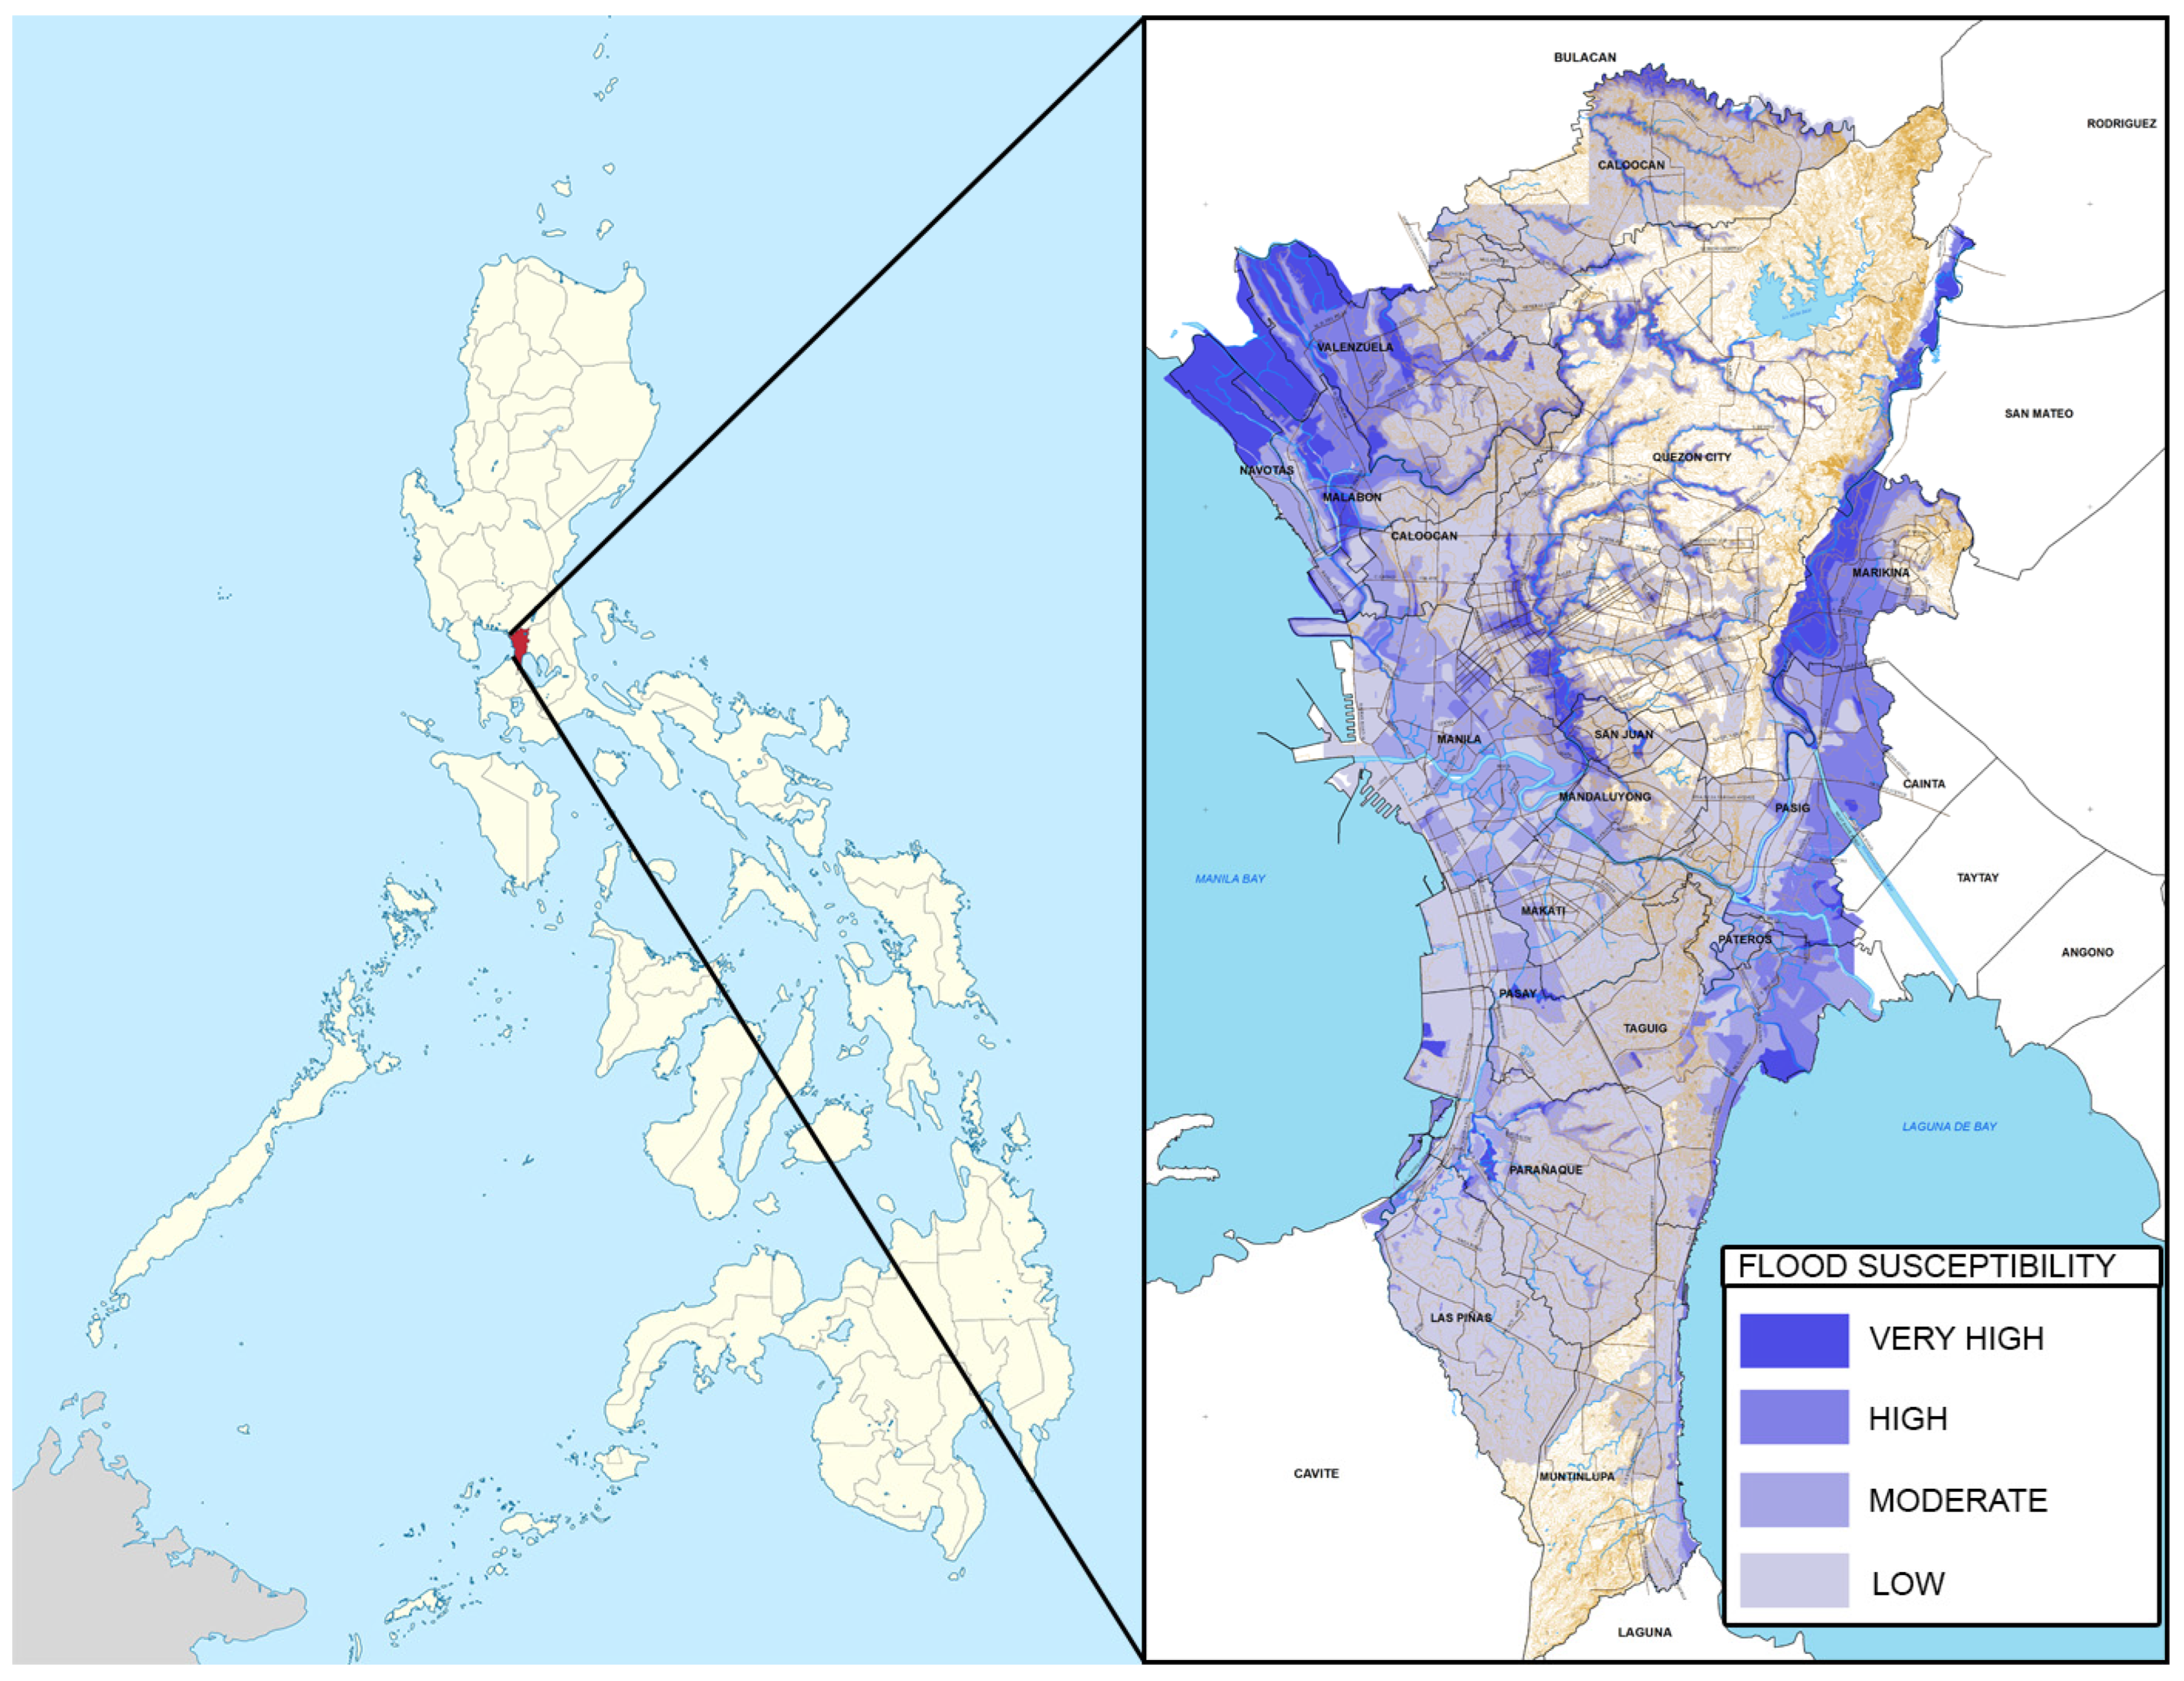
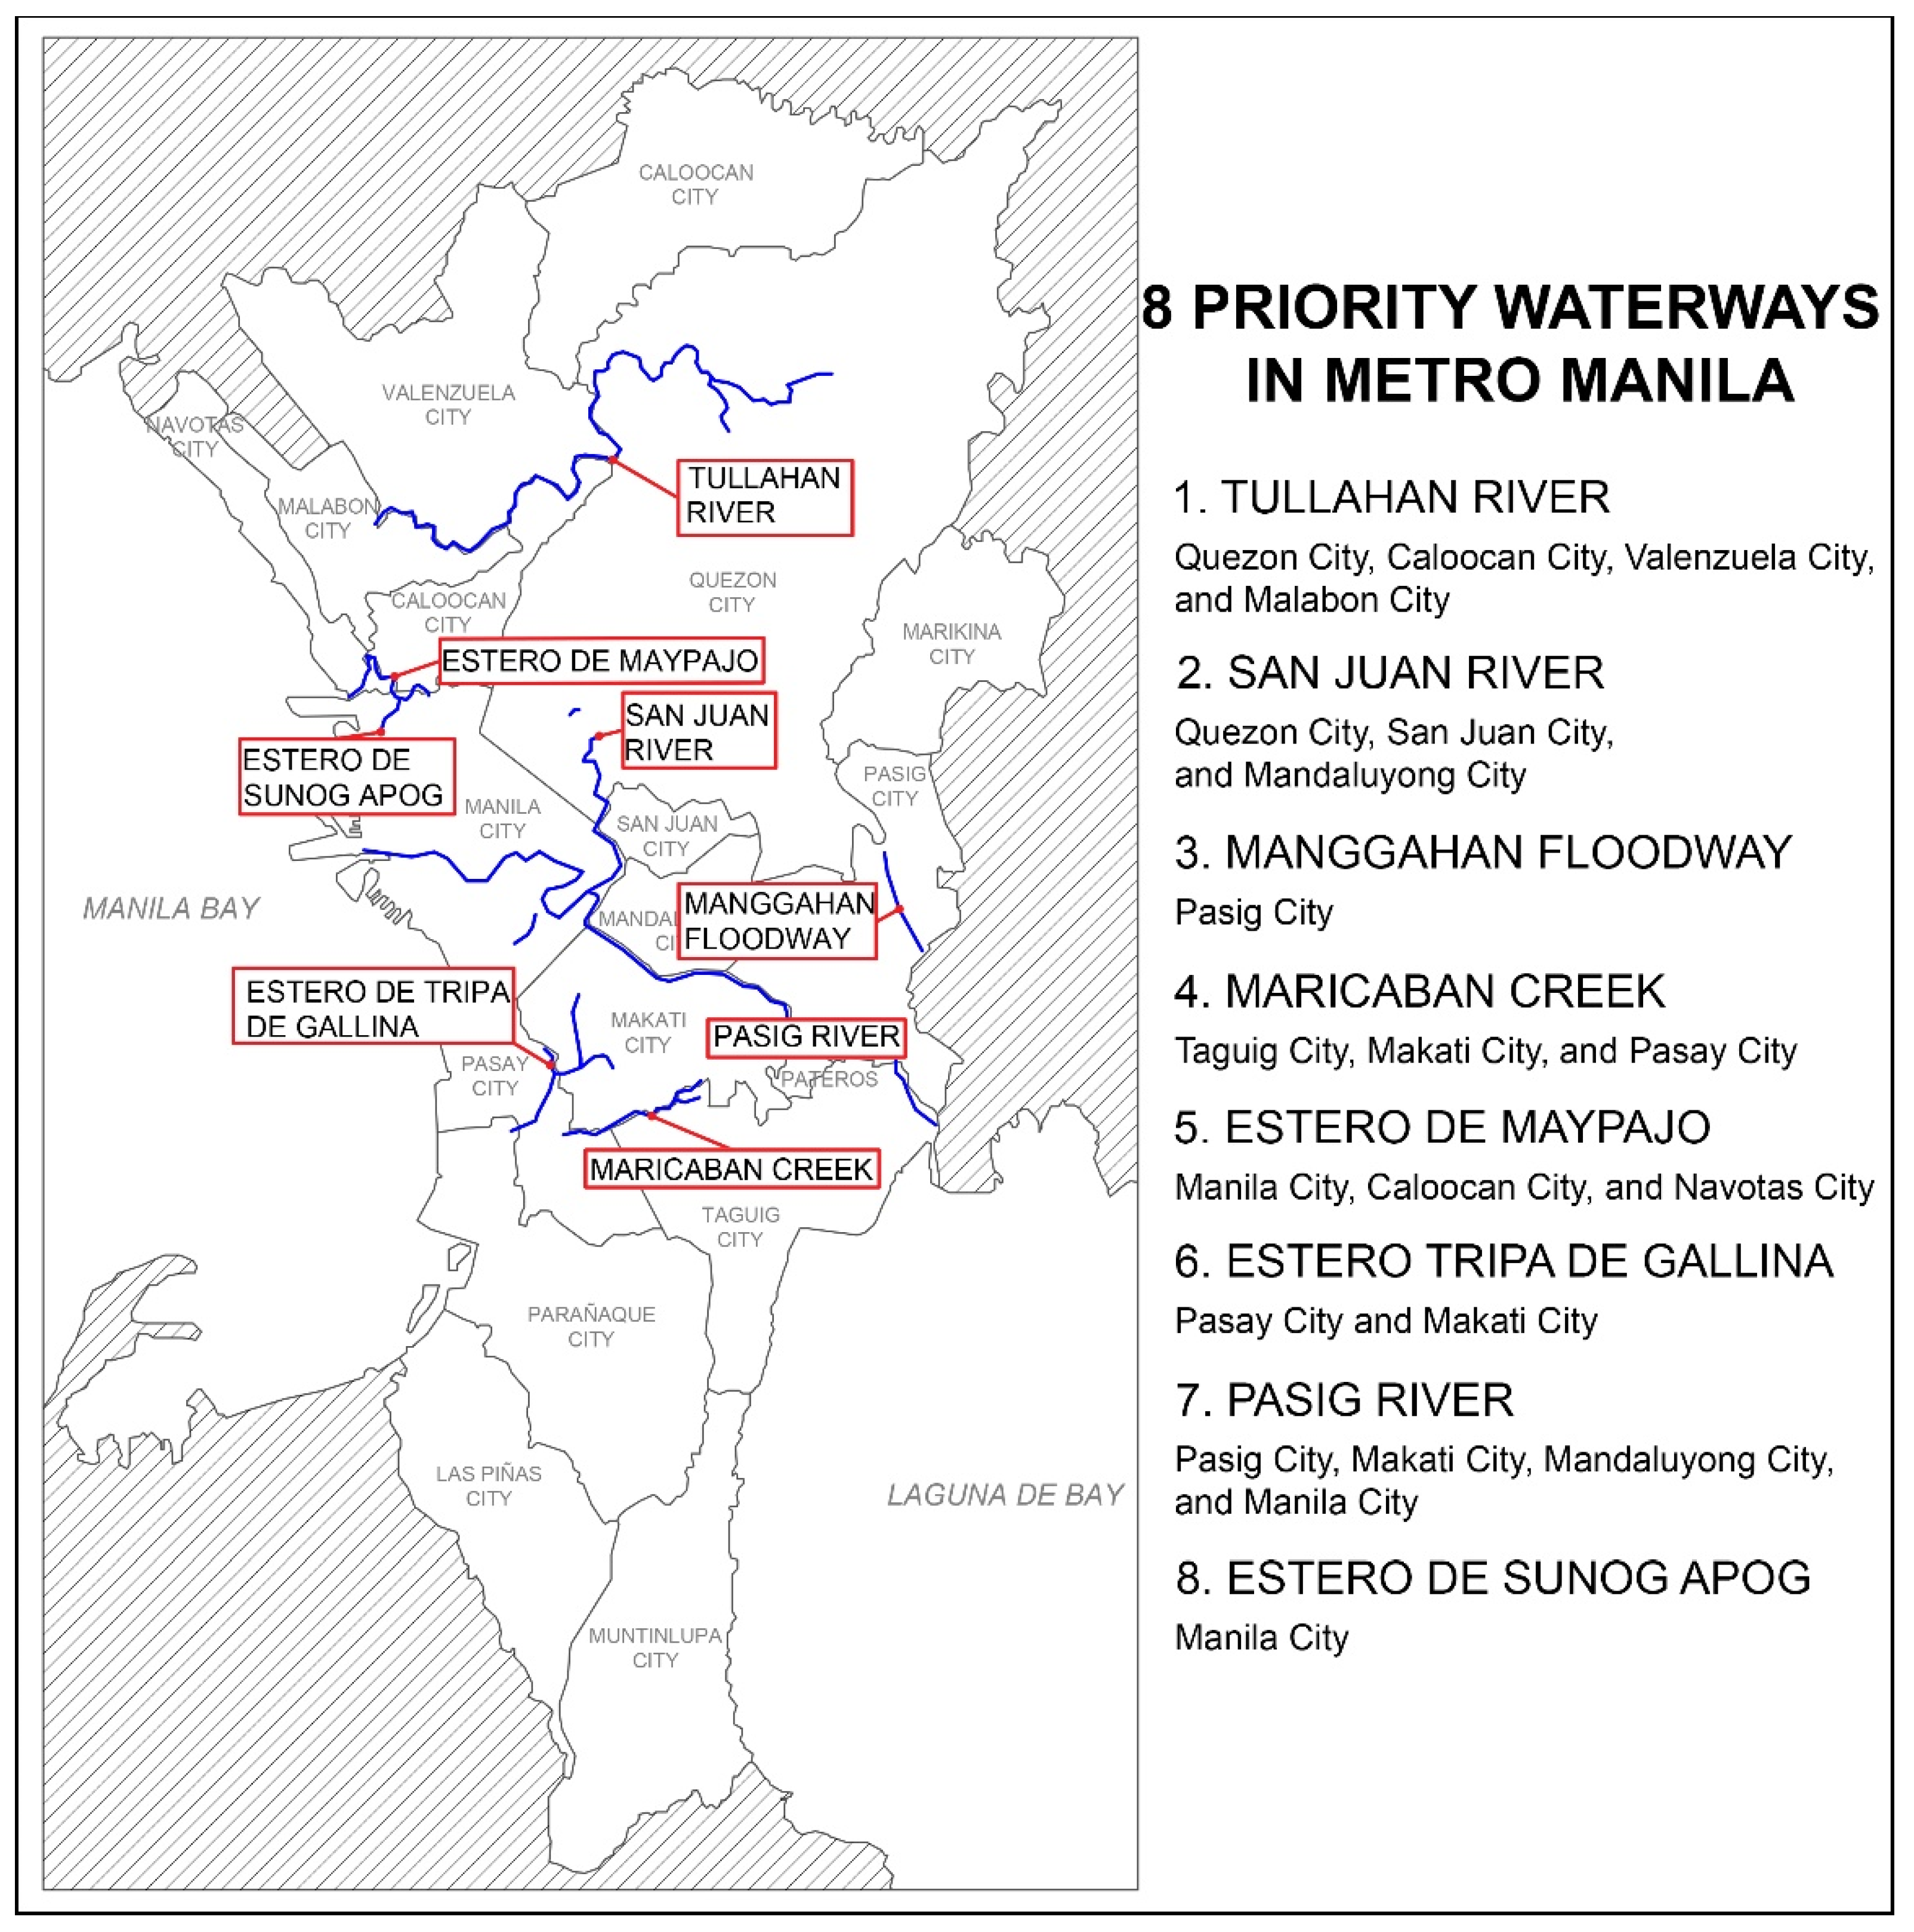
3.1. Disaster Risk and Vulnerability Context of Metro Manila

According to the World Risk Report 2022, the Philippines is ranked first in terms of risk among 193 countries worldwide, with a score of 46.82 out of 100. It is a global risk hotspot, which is reflected in its high-risk values, owing to a risk profile characterized by multiple exposures and high intensities [62].
Metro Manila, an agglomeration of 17 local government units and the nation’s capital, is home to more than 13 million inhabitants [63]. Megacities such as Metro Manila are characterized by high urban density and rapid population growth, which exacerbates environmental degradation and contributes to low-quality housing and poor quality of life [24,64,65]. A report by the National Economic and Development Authority (NEDA) [66] estimates that there are approximately 556,526 informal settler families (ISFs) in the city. This translates to 1 out of every 4 Metro Manila residents currently residing in informal housing [67]. Of these, 104,000 ISFs are situated in environmentally hazardous zones such as dump sites, railways, and along waterways [66]. Flooding is a perennial threat, as an average of 20 typhoons occur in the region each year, which makes these ISFs highly vulnerable to the detrimental effects of flooding [68]. Figure 1 shows the location of Metro Manila and the areas of flood susceptibility.

3.2. Post-Disaster Resettlement and the People’s Plan

On 26 September 2009, unprecedented rainfall and subsequent flooding caused by tropical storm Ketsana (known locally as “Ondoy”) submerged 34% of Metro Manila. The effects were devasting for approximately 4.9 million residents, including 464 casualties, 37 missing persons, and an estimated USD 240 million in damage to property and infrastructure [71]. Following the aftermath, the national government set aside PHP 50 billion to relocate ISFs living within 3 meters of eight priority waterways across Metro Manila (Figure 2) and provide them with safer housing [72]. To gain access to the funds, affected communities were tasked to prepare and submit a community-based resettlement plan called the People’s Plan [73].
The People’s Plan is a blueprint for empowering communities and marks a shift in the conventional top-down process typically employed by the government in their resettlement programs [75]. The community is tasked to handle several responsibilities on their own, such as site selection for resettlement and negotiations with builders regarding the design and costs of the construction [73]. The process takes a considerable amount of time, with completion taking an average of six years, the bulk of which is spent on site selection, whereas only a short period of time is allocated to its design phase [76].

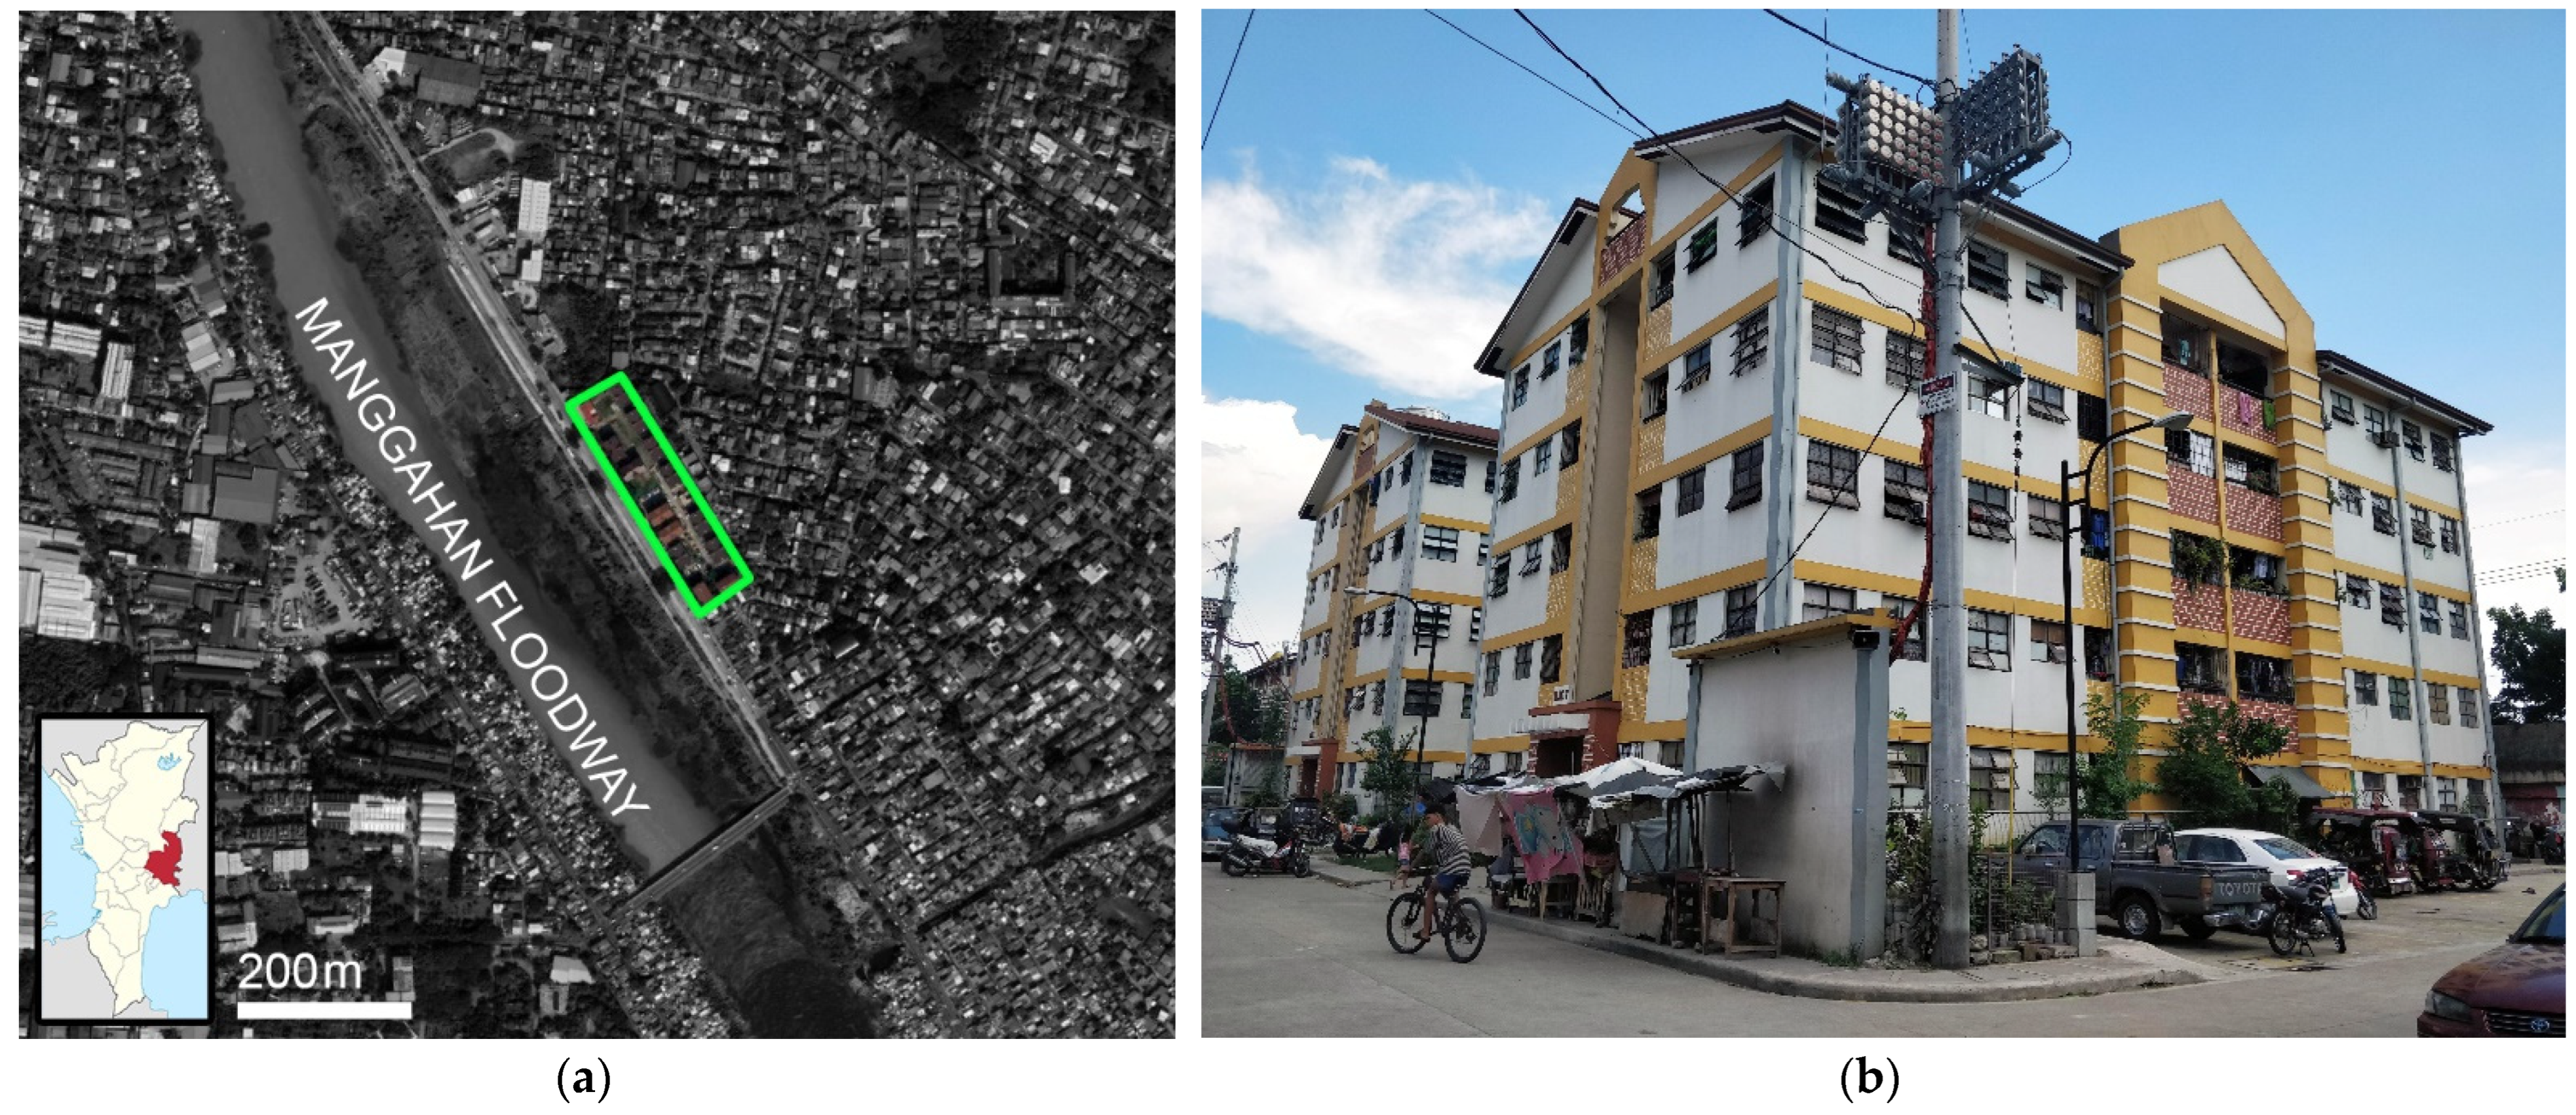
3.3. Study Site: The Manggahan Floodway Resettlement Project (LRB)

The Manggahan Floodway in Pasig City was constructed in 1986 to alleviate flooding in Metro Manila. Shortly thereafter, informal settlers then began occupying its embankments [75]. A Supreme Court ruling in 2008 mandated the clearing of waterways that feed into Manila Bay [72]. The catastrophic floods in the following year only served to solidify efforts to evict communities living along waterways, as the public sector looked to blame them for clogging the floodway [75,77,78].
Under the threat of eviction, 11 community organizations formed the Alliance of People’s Organizations Along Manggahan Floodway (APOAMF) in 2010 with support from a local non-government organization (NGO), Community Organizers Multiversity (COM). With the help of COM, APOAMF was able to follow through with the People’s Plan, navigate the complicated and lengthy bureaucratic process, and negotiate with various state actors [78]. This community-embedded process of resettlement informed the selection of the site for the case study. Specifically, the Manggahan LRB resettlement project is one of the first to employ community participation and developed along the lines of deeper engagement and dialogue with the affected residents in flood-prone areas. This provides an opportunity to empirically ascertain how so-called community-based resettlement programs shape resilient outcomes in informal settings.
Further, it needs to be mentioned that, from the government side, the project was framed around building disaster risk reduction through the resettlement [77]. It is noteworthy that in spite of the seemingly successful resettlement program, there have been some challenges, such as halted construction of the remaining buildings due to problems with the sub-contractor, the ongoing technical problems with the project’s sewage treatment plant [75], and the lack of play spaces for the children in the community, which had not been planned for due to the short design phase allotted for the project [79].
At the time of this study, the project had housed some 573 households. These households were resettled from the nearby east and west embankments of the floodway, which are severely vulnerable to floods (Figure 3). The project has a total of 15 planned buildings, of which only 10 have been completed. Each building has a total of five floors, with each floor containing 12 units. A community member is elected to serve as a representative for their building. The building representative is also supported by five leaders, each in charge of one floor. It is through this community structure that functions such as information dissemination and rule enforcement are enabled [80]. The Manggahan LRB community also has an established organizational structure with committees assigned to deal with issues and concerns within the resettlement project. A Disaster Risk Reduction (DRR) committee, for example, is tasked to facilitate DRR drills and training conducted in the community. These drills and training are provided by the local government as part of their DRR capacity-building mandate [63]. Due to the COVID-19 pandemic, however, these drills have been suspended.

4. Methodology

4.1. Data and Sample Collection

To test the resilience of the study area to multiple hazards (typhoon, fire, flood, and earthquake), survey data were collected from 236 participants in the Manggahan LRB community in Pasig City, Philippines, using the simple random-sampling technique. The questionnaire was administered with a combination of face-to-face and pen-and-paper methods. The data field study was conducted from July to August 2022, spanning a period of 2 months. Before data collection, the researchers conducted a reconnaissance survey (5–11 July 2022) to become familiar with the topography of the study area and build a good rapport with members of the community and leaders. With the help of the community leaders, a reference group was formed to help create awareness about the study and encourage the residents to voluntarily take part. In addition, the community reference group evaluated the questionnaire and made recommendations for the structure and wording of the survey instruments. This helped to improve the readability of the questionnaire survey. The questionnaire was then pretested (12–15 July 2022) using 10 respondents who were conveniently sampled from the study area as a further step to improve and finetune the questions. Collection of survey data was conducted over the course of one month (20 July–18 August 2022).
The target sample size was determined using Slovin’s formula based on the total households (573) in the community. Based on the total households, a confidence level of 95%, and a margin error of 5%, 231 households were determined to be the optimal sample size. Survey collection was implemented based on 10 clusters, corresponding to the existing 10 low-rise buildings currently occupied in the study area and using a simple random-sampling method to select participants/households.
The questionnaire surveys employed for the study comprised three sections. The first section was made up of the inclusion criteria, participant information sheet, and consent form. The second part of the questionnaire entailed respondents’ demographic information, such as gender, age, education, employment status, marital status, and monthly income. Section 3 of the survey instrument consisted of adopted questions underpinning the variables of the RABIT Framework.

4.2. Measures

A validated survey instrument from Haley et al. [26], which conceives resilience as eight attributes, was adapted for this study. These resilience attributes include learning, robustness, rapidity, scale, diversity, flexibility, equality, and redundancy. Each attribute was measured using a Likert scale of 1–5 (1 = strongly disagree and 5 = strongly agree). This instrument provides a holistic and measurable approach to resilience and design to fit the characteristics of marginalized and informal communities—high-risk locations, high population density, and economic and political marginalization. Appendix A provides details of the instrument employed in this study.

4.3. Data Analysis

Prior to data entry, the questionnaires were screened to ensure the data for further analysis was error-free and inconsistencies were rectified. Preliminary analysis was undertaken to check for missing variables and outliers. Descriptive statistics were run for the demographic data using percentages, means, and standard deviation. This was followed by exploratory factor analysis (EFA) and construct validity and reliability tests. The EFA was used to summarize the variables and identify the factors (attributes of resilience based on the RABIT framework) and their contribution to resilience. The contribution of the factors to the overall resilience was based on the eigenvalues and percentage of variance of each factor.

5. Results

The socio-demographic characteristics of the study participants are summarized in Table 2. In this study, 79.2% of the respondents were females, whereas the remaining 20.8% were males. Concerning the age cohort of the sampled population, the majority, comprising 35.6%, were aged 45–54. The results also show that 52.5% of respondents were married, whereas 52.1% had secondary high school education and more than one-third were employed.

5.1. Exploratory Factor Analysis

In most cases, researchers do not perform exploratory factor analysis (EFA), particularly when the instrument employed in the study is an adapted scale. In this study, the researchers conducted EFA to identify variables that adequately explain the construct in the Philippines context. This was based on Juliawati et al.’s [81] assertion that a scale previously validated is not necessarily valid in a different location, time, and context.
Table 3 and Table 4 show the results for the exploratory factor analysis (EFA). Before coming to that, the Kaiser–Meyer–Olkin test indicated that the sample was adequate for the analysis, as evidenced by the score of 0.910, which is higher than the suggested threshold point of 0.6 [82]. The Bartlett test of sphericity was also significant (X2 = 4856.270, df = 741, p = 0.000), indicating that the correlation between the variables was not equal and, consequently, fit for a factor analysis. Table 3 shows the proportion of variance explained by the factors. Only factors with eigenvalues above 1 were retained, which is the acceptable level used for EFA [83]. In all, eight factors were reported to have the eigenvalues above 1. Out of this, the first component had an eigenvalue of 12.918, which corresponds to 33.12% of the total proportion of variance explained.
In all, the eight factors accounted for 63% of the total variance that explained the resilience, which is above the 50% criterion that Samuels [84] and Streiner [85] recommend as the minimum threshold. Table 3 also reports on the rotation sums of squared loadings, which represent the distribution of the variance after the varimax rotation. According to Costello and Osborne [86], the varimax rotation adds another layer to EFA by clarifying the relationship among the factors. The rotation seeks to maximize the variance shared among the component by increasing the squared correlation of items and decreasing the correlation of items that are dissimilar. Here, we observed that the proportion of the variance explained by the first component was 16.66%. The remaining component showed more even variances.
Table 4 reports on the factor loadings of the individual items on the eight factors reported in this study. In line with arguments made by Pantouvakis and Psomas [87], we removed coefficients of items that were below 0.6 and reported only items with a coefficient above 0.6. Table 4 shows that the reported items with coefficients above 0.6 for factor 1 corresponded to the scale attribute of resilience. Further, Table 4 shows that the reported items with coefficients above 0.6 for factor 2 corresponded to the robustness attribute of resilience. Similarly, items with coefficients above 0.6 for factor 3 corresponded to the learning attribute of resilience. However, items such as “We have access to drills and other training activities and take part in them” (learning 3) had items below 0.6 and therefore were excluded (Table 4). Items with coefficients of more than 0.6 in factor 4 corresponded to the self-organization attribute of resilience. However, the item “I am ready to assist my neighbors during emergencies and trust that they will do the same for me” (self-organization 1) was excluded because it had a coefficient below 0.6.
Further, items with coefficients above 0.6 in factor 5 corresponded with the diversity attribute of resilience; however, similar to those items in the other highlighted attributes, the item “Our community is made up of members with a diverse set of skills and training” (diversity 4) was excluded from the list of items in factor 5 because it did not meet the 0.6 threshold. In summing up Table 3, after careful analysis of the factor loadings for factors 6, 7, and 8, we concluded that these factors represent the redundancy, equality, and rapidity attributes, respectively, of resilience based on the items loaded in these factors. Therefore, the various attributes of resilience can be ranked by their contribution to resilience in the following manner: scale, robustness, learning, self-organization, diversity, redundancy, equality, and rapidity.

5.2. Reliability and Validity

In this study, we used Cronbach’s alpha and composite reliability to measure the internal reliability of all the constructs. As depicted in Table 5, Cronbach’s alpha for all eight constructs was between 0.83 and 0.87, which meets Hair et al.’s [88] recommendation of 0.70. Moreover, the composite reliability for the eight constructs was found to be between 0.82 and 0.87 f, aligning with the widely accepted minimum criteria of a composite reliability greater than or equal to 0.70. We also computed the constructs’ convergent validity, utilizing the recommended standards by Hair et al. [88]. First, the factor loadings and significance levels of each construct were assessed. All factor loadings were higher than 0.60 and significant at 0.01. The average variance extracted (AVE) was measured, and the results demonstrated that the AVE of all the constructs exceeded the 0.50 threshold.
We utilized the Fornell–Larcker criterion to assess the discriminant validity of the constructs. According to Fornell and Larcker [89], when the square root of the AVE is higher than each construct’s correlation (diagonal values in bold), a discriminant validity has been achieved, as shown in Table 6.

6. Discussion

The results generated and the analytical framework provide insight into the study area’s resilience. First, the reliability and validity tests show that the RABIT framework is a valid and suitable method for assessing the resilience of the Manggahan LRB community. As a result, the study supports the assertions made by Heeks and Ospina [90] that the RABIT framework is suitable for low-income and marginalized contexts. The EFA result reveals that each of the eight attributes contributed to resilience, although there were both variations and similarities among the attributes in terms of the strength of their overall contribution, which was basically assessed using the eigenvalues and percentage variance of each attribute. Indeed, the findings indicate that when ranked from the largest to smallest contributor to resilience, the attributes can be ranked as follows: scale, robustness, learning, self-organization, diversity, redundancy, equality, and rapidity. Further, the findings from the EFA also show that the scale attribute contributed largely to resilience in the study area relative to the other attributes. This finding is informative and shows that, depending on the study context, the contributions from the eight resilience attributes may not be the same. For instance, utilizing the RABIT framework, Haley et al. [26] found that in Masiphumelele, a low-income community in South Africa, the strength of resilience was based on the contribution of self-organization and scale. Understanding why some of the attributes play a more significant impact in fostering resilience in different low-income communities is an interesting issue to explore.
In our study, scale was identified as the most important contributor to resilience in the study area. Scale, according to Folke et al. [91], borders on the breadth of resources that is available and can be utilized by a community to effectively overcome the impact of a disaster or disturbances. Resources can take varied forms and may include natural, physical, financial, and social capital, as well as other support systems available to the community. In the context of the current study, it can be argued that the community’s long-standing relationship and support received from COM has been beneficial to the Manggahan LRB community, as they have been able to foster multiple partnerships and leverage these support systems to overcome threats of eviction and call for support from the local and national governments. One of the results of these partnerships is the People’s Plan, which provides an opportunity for broader engagement to promote resilience. Thus, strong partnership with NGOs is instrumental to the resilience building of the Manggahan LRB community, and it is therefore not surprising that a stronger coefficient was reported for items such as such as scale 2 (“The community has strong collaborations with the local and national government”) and scale 4 (“The community has regular interactions with NGOs, academic organizations, etc. on disaster preparation and response”). Similarly, several studies have pointed to the importance of community–institutional collaborations as a form of social capital (bridging networks) in building community resilience [92,93,94,95,96]. This highlights the need to not only invest in physical infrastructure but also to foster collaboration and strong partnerships to provide opportunities for exchanges and flows of ideas, expertise, and resources that can be leveraged in times of difficulties. These collaborations and partnerships, as a form of social infrastructure, can help resettled communities to better anticipate and overcome future disasters [97].
The next attributes that made an almost similar contribution to resilience in the Manggahan LRB community after scale were robustness and learning. Robustness essentially refers to the ability of the community to sustain itself from shocks and disruptions and ensure some level of stability [26]. Robustness undoubtedly requires essential infrastructure and collaboration with state and non-state actors. Indeed, the government implementation of the resettlement plan has been instrumental in reducing the vulnerability of the resettled community, since it provides safe housing and essential services and infrastructure required for improved living [98]. Though opposed at the initial stages, the plan came to fruition due to the successful engagement with stakeholders such as the government and NGOs. The strong coefficient for robustness items highlights the relevance of improved housing and infrastructure in resilience building. Learning as an attribute of resilience has been found to have strong links with access to DRR-related drills and training. Cui and Han [99] argue that by participating in drills, training, and other forms of capacity building, the community can improve its resilience and recover from systemic disturbances. In the study area’s case, the COVID-19 pandemic led to the suspension of DRR-related drills and training in the community for the past two years. Nonetheless, the influence of past learning experiences had some level of impact on residents, given the contribution it made towards building the resilience of residents. Indeed, there were high coefficients for items such as learning 2 (“I have received and shared lessons from past experiences with flooding from other members”) and learning 4 (“The community leverages past experiences to anticipate and plan differently in the future”), which clearly indicate that residents’ learning experiences with past disasters have been instrumental in shaping their preparedness for future disaster occurrences.
The next attributes that made almost similar contributions to resilience were self-organization, diversity, and redundancy. Beginning with self-organization, it highlights how a community can adjust itself and its practices under serious threats or pending disturbances. The community partnership forged between other organizations such as COM and APOAMF to follow through with the People’s Plan and effectively mobilize themselves and work with their leaders to negotiate and implement the resettlement program is a clear case in point. Indeed, items with a strong coefficient for self-organization indicate strong trust in leadership, participation, and mobilization. This finding corresponds to previous studies on self-organization in similar low-income, informal, and marginalized communities in Accra, where community adjustments are made possible through collaboration, network building, and trust in community structures [100,101].
In the case of diversity, it can be argued that the community made efforts to increase the range of options to press home their demands for more support and engagement. It is not surprising, therefore, that there were strong coefficients for diversity 2 (“I am able to identify potential opportunities emerging from change”) and diversity 3 (“The community comes up with innovative and creative solutions to problems that arise in times of emergency”). Despite the point made for diversity, there were difficulties that the community faced that limit their ability to take action to promote its interests. For instance, its status as a resettled community means that they still must depend on the government for many of the services they need. In the case of redundancy, it can be argued that the support gained from external bodies such as livelihood programs from women-led international NGO Huairou Commission [102] could also have contributed to building the community’s resilience. Nonetheless, it needs to be mentioned that although the community has been able to leverage the support they received from COM to fight against the eviction orders, they are still dependent on the government resettlement project for infrastructure and basic amenities. The challenges highlighted for diversity and redundancy explain why they did not contribute much to resilience in the community.
The two attributes that made the smallest contribution to resilience were equality and rapidity. Equality entails the fair distribution of opportunities and capacity-building programs and fostering participation among all members of the community. Promoting inclusivity and participation among members of the community has been found to be instrumental in quick and effective outcomes for improvement [103,104]. In the context of this study, delays in resettling all the disaster-prone households (only 573 have been resettled out of 900 households) and lags in providing infrastructure facilities, such as issues with the sewage-treatment plant for the entire community [78] and the lack of public spaces and playgrounds for children [79], might explain the comparatively limited contribution of equality to the resilience in the study area.
Rapidity, or swift access to assets such as disaster-related information and resources, is the factor that contributed the least to the community’s resilience. Although early warning systems (EWS) are already in place to disseminate disaster-related information [71] in the community, previous studies indicate that access to disaster risk information and communication channels embedded in existing social structures and timely updates improve preparedness and adaptive capacities [100]. Moreover, this points to the importance of an information system that leverages community trust and leadership to further enhance the community’s receptiveness and alertness towards disaster risk information and therefore influences their intentions to prepare for present and future risks [105,106].

7. Conclusions

This study contributes to the emerging research on resilience measurement at the community level. It applied the RABIT framework, a community-level resilience measurement tool, to assess the resilience of a resettled informal settler community displaced because of the catastrophic 2009 floods in Metro Manila. The study also demonstrates its utility and relevance in evaluating resilience at the community level, focusing on marginalized urban communities. Resilience attributes were assessed and validated regarding whether they were statistically significant factors in the community’s resilience. Analysis of the survey data revealed that although all attributes are statistically relevant, their contributions towards the community’s resilience vary. The results show that the attributes of scale, robustness, and learning proved to be relatively strong contributors to the community’s resilience. Self-organization, diversity, and redundancy were found to have similar levels of contributions. The attributes of equality and rapidity were found to be relatively weaker and thus require more attention. The study has shown that although the Manggahan LRB community and its resettlement as a DRR approach is seemingly trending towards a resilient outcome, there remain some challenges to be revisited that merit closer scrutiny.
This research provides a case study for the practical measurability of the attributes of community resilience as prescribed in the RABIT framework. However, the study is limited in its scope of generalization and application for three reasons. First, the RABIT framework used does not account for mental or psychological attributes of resilience [107,108] in post-resettlement situations. Measuring mental outlook or psychological aspects in future studies is important to understand how resettlement communities view their future and are prepared for future uncertainties and risks, as evidenced by the stresses of the current pandemic in informal communities. Second, the current study only provides a snapshot of the community’s resilience through a quantitative lens. Further research is needed to support the quantitative results with qualitative data (e.g., interviews and focus group discussions) to provide more holistic depth in the assessment of resilience attributes. Finally, focusing on a single case without a comparative or experimental analysis with another community limits the generalizability of the present study. Future experimental or comparative analysis might provide more insight and allow for generalization. Nevertheless, this study puts forth its contribution towards testing community resilience measurements in the understanding that these measurement tools do not necessarily translate to instantly shaping a particular community to be resilient but can be considered a decision-making tool for disaster risk reduction and resilience managers to prioritize and direct resources to critical areas necessary for building adaptive and resilient capacities of marginalized communities in Metro Manila and other Global South cities.

Author Contributions

Conceptualization, N.T.N., S.A.O., M.K. and M.A.; methodology, N.T.N., M.A., L.K.F. and S.A.O.; validation, M.A., L.K.F. and N.T.N.; formal analysis, M.A., L.K.F. and N.T.N.; investigation, N.T.N.; writing—original draft preparation, N.T.N., S.A.O., L.K.F. and M.A.; writing—review and editing, N.T.N., S.A.O., L.K.F., M.A. and M.K.; supervision, S.A.O. and M.K. All authors have read and agreed to the published version of the manuscript.

Funding

This research received no external funding.

Institutional Review Board Statement

Not applicable.

Informed Consent Statement

Informed consent was obtained from all subjects involved in the study.

Data Availability Statement

Data cannot be publicly shared due to the confidentiality and privacy agreement with participants. However, instruments and redacted tools may be considered upon request to the corresponding author.

Acknowledgments

Special thanks to the community members and leaders for sharing their time and knowledge during the data-collection exercise.

Conflicts of Interest

The authors declare no conflict of interest.

Appendix A

1. Survey-Respondent Profile
1.1 Name: _____________________
1.2 Sex
Female
Male
1.3 Age
15–24 y/o
25–34 y/o
35–44 y/o
45–54 y/o
55–64 y/o
More than 65 y/o
1.4 Marital Status
Single
Domestic partnership
Divorced
Widowed
1.5 How many are you in the household?
1
2–3
4–5
More than 5
1.6 Educational Background
No formal education
Primary/JHS
Secondary/SHS/vocational
Tertiary
1.7 Occupation
Unemployed
Student
Housewife
Self-employed
Private company employee
Government employee
Retired
1.8 Monthly household income
Less than 11,000
11,001–22,000
22,001–44,000
44,001–77,000
77,001–132,000
More than 132,000
Prefer not to answer
1.9 How long have you been living in this community?
Less than a year
1–2 years
3–4 years
5–6 years
More than 7 years
1.10 Which type of natural hazard have you experienced? (You may select more than one.)
Floods
Earthquakes
Typhoons
Fires
2. Resilience Attributes
2.1 Robustness
I do the necessary preparations to anticipate and respond to flood disasters/emergencies.
 
Strongly
Disagree
 
Disagree
 
Neutral
 
Agree
 
Strongly
Agree
The building I live in is safe against hazards such as flooding.
 
Strongly
Disagree
 
Disagree
 
Neutral
 
Agree
 
Strongly
Agree
The building I live in is safe against typhoons.
 
Strongly
Disagree
 
Disagree
 
Neutral
 
Agree
 
Strongly
Agree
The building I live in is safe against earthquakes.
 
Strongly
Disagree
 
Disagree
 
Neutral
 
Agree
 
Strongly
Agree
The building I live in is safe against fires.
 
Strongly
Disagree
 
Disagree
 
Neutral
 
Agree
 
Strongly
Agree
Lifeline utilities such as electricity and water are easily restored following a disruption.
 
Strongly
Disagree
 
Disagree
 
Neutral
 
Agree
 
Strongly
Agree
Assistance from the government (e.g., rescue, fire brigade) is accessible to the community during emergency situations.
 
Strongly
Disagree
 
Disagree
 
Neutral
 
Agree
 
Strongly
Agree
Community infrastructure is strong to prevent or mitigate impacts from disasters such as flooding.
 
Strongly
Disagree
 
Disagree
 
Neutral
 
Agree
 
Strongly
Agree
2.2 Self-Organization
I am ready to assist my neighbors during emergencies and trust that they will do the same for me.
 
Strongly
Disagree
 
Disagree
 
Neutral
 
Agree
 
Strongly
Agree
Local leaders are highly capable and are able to perform their duties responsibly during emergencies.
 
Strongly
Disagree
 
Disagree
 
Neutral
 
Agree
 
Strongly
Agree
I regularly participate in disaster-prevention and -response programs initiated in the community.
 
Strongly
Disagree
 
Disagree
 
Neutral
 
Agree
 
Strongly
Agree
Local groups (e.g., DRM) actively participate in disaster preparation and response.
 
Strongly
Disagree
 
Disagree
 
Neutral
 
Agree
 
Strongly
Agree
We adopt technology to mobilize resources for disaster preparedness and response.
 
Strongly
Disagree
 
Disagree
 
Neutral
 
Agree
 
Strongly
Agree
2.3 Learning
I am knowledgeable of the severity and places of high flood risk in our area.
 
Strongly
Disagree
 
Disagree
 
Neutral
 
Agree
 
Strongly
Agree
I have received and shared lessons from past experiences with flooding from other members.
 
Strongly
Disagree
 
Disagree
 
Neutral
 
Agree
 
Strongly
Agree
We have access to drills and other training activities and take part in them.
 
Strongly
Disagree
 
Disagree
 
Neutral
 
Agree
 
Strongly
Agree
The community leverages past experiences to anticipate and plan differently in the future.
 
Strongly
Disagree
 
Disagree
 
Neutral
 
Agree
 
Strongly
Agree
2.4 Redundancy
We maintain an emergency fund just in case of serious disruption to our livelihood.
 
Strongly
Disagree
 
Disagree
 
Neutral
 
Agree
 
Strongly
Agree
I have diversified income sources to sustain me in times of emergency.
 
Strongly
Disagree
 
Disagree
 
Neutral
 
Agree
 
Strongly
Agree
I have access to financial instruments such as insurance or informal group credit.
 
Strongly
Disagree
 
Disagree
 
Neutral
 
Agree
 
Strongly
Agree
I receive support from family, friends, and neighbors in times of emergency.
 
Strongly
Disagree
 
Disagree
 
Neutral
 
Agree
 
Strongly
Agree
2.5 Rapidity
I have access to early-warning and up-to-date information on upcoming flood hazards and other emergency events.
 
Strongly
Disagree
 
Disagree
 
Neutral
 
Agree
 
Strongly
Agree
Emergency information is rapidly disseminated among members of the community.
 
Strongly
Disagree
 
Disagree
 
Neutral
 
Agree
 
Strongly
Agree
We are able to swiftly implement evacuation protocols should a disaster occur.
 
Strongly
Disagree
 
Disagree
 
Neutral
 
Agree
 
Strongly
Agree
We are able to promptly receive emergency aid and/or food after a disaster has occurred.
 
Strongly
Disagree
 
Disagree
 
Neutral
 
Agree
 
Strongly
Agree
Local leaders and institutions effectively coordinate emergency-preparation and -response activities.
 
Strongly
Disagree
 
Disagree
 
Neutral
 
Agree
 
Strongly
Agree
2.6 Scale
The community has various partnerships with NGOs, academic organizations, and even international agencies.
 
Strongly
Disagree
 
Disagree
 
Neutral
 
Agree
 
Strongly
Agree
The community has strong collaborations with the local and national government.
 
Strongly
Disagree
 
Disagree
 
Neutral
 
Agree
 
Strongly
Agree
We have received aid (e.g., scholarships, skills training, health services, etc.) as a result of these types of partnerships.
 
Strongly
Disagree
 
Disagree
 
Neutral
 
Agree
 
Strongly
Agree
The community has regular interactions with NGOs, academic organizations, etc., on disaster preparation and response.
 
Strongly
Disagree
 
Disagree
 
Neutral
 
Agree
 
Strongly
Agree
2.7 Diversity and Flexibility
I have several options or courses of action available to me in case of emergencies.
 
Strongly
Disagree
 
Disagree
 
Neutral
 
Agree
 
Strongly
Agree
I am able to identify potential opportunities emerging from change.
 
Strongly
Disagree
 
Disagree
 
Neutral
 
Agree
 
Strongly
Agree
The community comes up with innovative and creative solutions to problems that arise in times of emergency.
 
Strongly
Disagree
 
Disagree
 
Neutral
 
Agree
 
Strongly
Agree
Our community is made up of members with a diverse set of skills and training.
 
Strongly
Disagree
 
Disagree
 
Neutral
 
Agree
 
Strongly
Agree
2.8 Equality
I feel my needs and opinions are considered in the decision-making process of our community.
 
Strongly
Disagree
 
Disagree
 
Neutral
 
Agree
 
Strongly
Agree
The decision-making process on disaster management in our community association is transparent.
 
Strongly
Disagree
 
Disagree
 
Neutral
 
Agree
 
Strongly
Agree
Resources on disaster management such as aid are distributed fairly among members of the community.
 
Strongly
Disagree
 
Disagree
 
Neutral
 
Agree
 
Strongly
Agree
Capacity-building programs and opportunities are available to all, including marginalized groups (e.g., PWD, youth, elderly).
 
Strongly
Disagree
 
Disagree
 
Neutral
 
Agree
 
Strongly
Agree
I am involved in making decisions about steps to undertake against the effects of natural hazards such as flooding, typhoons, etc., that affect me.
 
Strongly
Disagree
 
Disagree
 
Neutral
 
Agree
 
Strongly
Agree

References

  1. IPCC. Climate Change 2022: Impacts, Adaptation and Vulnerability; Intergovernmental Panel on Climate Change: Geneva, Switzerland, 2022. [Google Scholar]
  2. Borie, M.; Pelling, M.; Ziervogel, G.; Hyams, K. Mapping Narratives of Urban Resilience in the Global South. Glob. Environ. Change 2019, 54, 203–213. [Google Scholar] [CrossRef]
  3. Fatemi, M.N.; Okyere, S.A.; Diko, S.K.; Abunyewah, M.; Kita, M.; Rahman, T. Flooding in Mega-Cities: Using Structural Equation Modeling to Assess Flood Impact in Dhaka. Int. J. Disaster Resil. Built Environ. 2021, 12, 500–514. [Google Scholar] [CrossRef]
  4. Okyere, S.A.; Diko, S.K.; Abunyewah, M.; Kita, M. Toward Citizen-Led Planning for Climate Change Adaptation in Urban Ghana: Hints from Japanese ‘Machizukuri’ Activities. In The Geography of Climate Change Adaptation in Urban Africa; Cobbinah, P.B., Addaney, M., Eds.; Springer International Publishing: Cham, Switzerland, 2019; pp. 391–419. ISBN 978-3-030-04872-3. [Google Scholar]
  5. Shen, G.; Hwang, S.N. Spatial–Temporal Snapshots of Global Natural Disaster Impacts Revealed from EM-DAT for 1900-2015. Geomat. Nat. Hazards Risk 2019, 10, 912–934. [Google Scholar] [CrossRef]
  6. Erdiaw-Kwasie, M.O.; Abunyewah, M.; Yamoah, O. ‘After the Disaster Comes Destination Thoughts’: A Review and Conceptualization of Consolidative Disaster Adaptive Capacity Model. Int. J. Disaster Risk Reduct. 2019, 35, 101098. [Google Scholar] [CrossRef]
  7. Wilkin, J.; Biggs, E.; Tatem, A. Measurement of Social Networks for Innovation within Community Disaster Resilience. Sustainability 2019, 11, 1943. [Google Scholar] [CrossRef]
  8. UNISDR. Sendai Framework for Disaster Risk Reduction 2015–2030; UNISDR: Geneva, Switzerland, 2015; 37p. [Google Scholar]
  9. UN-Habitat. The New Urban Agenda; UN-Habitat: Nairobi, Kenya, 2020. [Google Scholar]
  10. Graveline, M.-H.; Germain, D. Disaster Risk Resilience: Conceptual Evolution, Key Issues, and Opportunities. Int. J. Disaster Risk Sci. 2022, 13, 330–341. [Google Scholar] [CrossRef]
  11. Manyena, S.B. The Concept of Resilience Revisited: The Concept of Resilience Revisited. Disasters 2006, 30, 434–450. [Google Scholar] [CrossRef]
  12. Marzi, S.; Mysiak, J.; Essenfelder, A.H.; Amadio, M.; Giove, S.; Fekete, A. Constructing a Comprehensive Disaster Resilience Index: The Case of Italy. PLoS ONE 2019, 14, e0221585. [Google Scholar] [CrossRef]
  13. Cutter, S.L.; Ash, K.D.; Emrich, C.T. The Geographies of Community Disaster Resilience. Glob. Environ. Change 2014, 29, 65–77. [Google Scholar] [CrossRef]
  14. Bakkensen, L.A.; Fox-Lent, C.; Read, L.K.; Linkov, I. Validating Resilience and Vulnerability Indices in the Context of Natural Disasters. Risk Anal. 2017, 37, 982–1004. [Google Scholar] [CrossRef]
  15. Cutter, S.L.; Barnes, L.; Berry, M.; Burton, C.; Evans, E.; Tate, E.; Webb, J. A Place-Based Model for Understanding Community Resilience to Natural Disasters. Glob. Environ. Change 2008, 18, 598–606. [Google Scholar] [CrossRef]
  16. Gao, J.; Barzel, B.; Barabási, A.-L. Universal Resilience Patterns in Complex Networks. Nature 2016, 530, 307–312. [Google Scholar] [CrossRef] [PubMed]
  17. Peacock, W.G. Advancing the Resilience of Coastal Localities: Developing, Implementing and Sustaining the Use of Coastal Resilience Indicators: A Final Report; Hazard Reduction and Recovery Center: College Station, TX, USA, 2010. [Google Scholar] [CrossRef]
  18. Jiang, T.; Sun, T.; Liu, G.; Li, X.; Zhang, R.; Li, F. Resilience Evaluation and Enhancement for Island City Integrated Energy Systems. IEEE Trans. Smart Grid 2022, 13, 2744–2760. [Google Scholar] [CrossRef]
  19. Khazai, B.; Bendimerad, F.; Cardona, O.; Carreño, M.-L.; Barbat, A.; Burton, C. A Guide to Measuring Urban Risk Resilience: Principles, Tools and Practice of Urban Indicators; Earthquakes and Megacities Initiative: Quezon City, Philippines, 2015. [Google Scholar]
  20. Dianat, H.; Wilkinson, S.; Williams, P.; Khatibi, H. Choosing a Holistic Urban Resilience Assessment Tool. Int. J. Disaster Risk Reduct. 2022, 71, 102789. [Google Scholar] [CrossRef]
  21. Marzi, S.; Mysiak, J.; Santato, S. Comparing Adaptive Capacity Index across Scales: The Case of Italy. J. Environ. Manag. 2018, 223, 1023–1036. [Google Scholar] [CrossRef]
  22. Cutter, S.L.; Burton, C.G.; Emrich, C.T. Disaster Resilience Indicators for Benchmarking Baseline Conditions. J. Homel. Secur. Emerg. Manag. 2010, 7, 1–22. [Google Scholar] [CrossRef]
  23. Frazier, T.G.; Thompson, C.M.; Dezzani, R.J.; Butsick, D. Spatial and Temporal Quantification of Resilience at the Community Scale. Appl. Geogr. 2013, 42, 95–107. [Google Scholar] [CrossRef]
  24. Abunyewah, M.; Gajendran, T.; Maund, K. Profiling Informal Settlements for Disaster Risks. Procedia Eng. 2018, 212, 238–245. [Google Scholar] [CrossRef]
  25. Okyere, S.A.; Kita, M. Rethinking Urban Informality and Informal Settlements Growth in Urban Africa: A Literature Discussion. J. Sustain. Dev. Afr. 2015, 17, 101–124. [Google Scholar]
  26. Haley, J.; Heeks, R.; Van Belle, J.-P. Measuring Resilience in Marginalised Urban Communities: A South African Township Pilot Study. SSRN Electron. J. 2021, 1–31. [Google Scholar] [CrossRef]
  27. Marks, D.; Pulliat, G. Urban Climate Governance in Southeast Asian Small and Mid-Sized Cities: Undermining Resilience and Distributing Risks Unevenly. J. Integr. Environ. Sci. 2022, 19, 141–160. [Google Scholar] [CrossRef]
  28. Béné, C.; Wood, R.G.; Newsham, A.; Davies, M. Resilience: New Utopia or New Tyranny? Reflection about the Potentials and Limits of the Concept of Resilience in Relation to Vulnerability Reduction Programmes. IDS Work. Pap. 2012, 2012, 1–61. [Google Scholar] [CrossRef]
  29. Porio, E. Climate Change Vulnerability and Adaptation in Metro Manila. Asian J. Soc. Sci. 2014, 42, 75–102. [Google Scholar] [CrossRef]
  30. Moser, S.; Meerow, S.; Arnott, J.; Jack-Scott, E. The Turbulent World of Resilience: Interpretations and Themes for Transdisciplinary Dialogue. Clim. Change 2019, 153, 21–40. [Google Scholar] [CrossRef]
  31. Vaneeckhaute, L.E.; Vanwing, T.; Jacquet, W.; Abelshausen, B.; Meurs, P. Community Resilience 2.0: Toward a Comprehensive Conception of Community-Level Resilience. Community Dev. 2017, 48, 735–751. [Google Scholar] [CrossRef]
  32. Meerow, S.; Newell, J.P.; Stults, M. Defining Urban Resilience: A Review. Landsc. Urban Plan. 2016, 147, 38–49. [Google Scholar] [CrossRef]
  33. Berkes, F.; Ross, H. Community Resilience: Toward an Integrated Approach. Soc. Nat. Resour. 2013, 26, 5–20. [Google Scholar] [CrossRef]
  34. Field, C.B.; Barros, V.; Stocker, T.F.; Dahe, Q. (Eds.) Managing the Risks of Extreme Events and Disasters to Advance Climate Change Adaptation: Special Report of the Intergovernmental Panel on Climate Change, 1st ed.; Cambridge University Press: Cambridge, UK, 2012; ISBN 978-1-107-02506-6. [Google Scholar]
  35. Keating, A.; Campbell, K.; Mechler, R.; Michel-Kerjan, E.; Mochizuki, J.; Kunreuther, H.; Bayer, J.; Hanger, S.; McCallum, I.; See, L.; et al. Operationalizing Resilience against Natural Disaster Risk: Opportunities, Barriers, and a Way Forward; Zurich Flood Resilience Alliance: Zurich, Switzerland, 2014; p. 43. [Google Scholar]
  36. Amirzadeh, M.; Sobhaninia, S.; Sharifi, A. Urban Resilience: A Vague or an Evolutionary Concept? Sustain. Cities Soc. 2022, 81, 103853. [Google Scholar] [CrossRef]
  37. Berkes, F.; Ross, H. Panarchy and Community Resilience: Sustainability Science and Policy Implications. Environ. Sci. Policy 2016, 61, 185–193. [Google Scholar] [CrossRef]
  38. Wardekker, A. Contrasting the Framing of Urban Climate Resilience. Sustain. Cities Soc. 2021, 75, 103258. [Google Scholar] [CrossRef]
  39. Clark-Ginsberg, A.; McCaul, B.; Bremaud, I.; Cáceres, G.; Mpanje, D.; Patel, S.; Patel, R. Practitioner Approaches to Measuring Community Resilience: The Analysis of the Resilience of Communities to Disasters Toolkit. Int. J. Disaster Risk Reduct. 2020, 50, 10. [Google Scholar] [CrossRef] [PubMed]
  40. Holling, C.S. Resilience and Stability of Ecological Systems. Annu. Rev. Ecol. Syst. 1973, 4, 1–23. [Google Scholar] [CrossRef]
  41. Alexander, D.E. Resilience and Disaster Risk Reduction: An Etymological Journey. Nat. Hazards Earth Syst. Sci. 2013, 13, 2707–2716. [Google Scholar] [CrossRef]
  42. Asadzadeh, A.; Kötter, T.; Salehi, P.; Birkmann, J. Operationalizing a Concept: The Systematic Review of Composite Indicator Building for Measuring Community Disaster Resilience. Int. J. Disaster Risk Reduct. 2017, 25, 147–162. [Google Scholar] [CrossRef]
  43. Magis, K. Community Resilience: An Indicator of Social Sustainability. Soc. Nat. Resour. 2010, 23, 401–416. [Google Scholar] [CrossRef]
  44. Khazai, B.; Anhorn, J.; Burton, C.G. Resilience Performance Scorecard: Measuring Urban Disaster Resilience at Multiple Levels of Geography with Case Study Application to Lalitpur, Nepal. Int. J. Disaster Risk Reduct. 2018, 31, 604–616. [Google Scholar] [CrossRef]
  45. Saravanan, V.; Garren, S.J. Baseline Framework for Assessing Community Resilience Using a Balanced Index Approach and Spatial Autocorrelation in the Mill River Watershed, Nassau County, New York. Int. J. Disaster Risk Reduct. 2021, 66, 102621. [Google Scholar] [CrossRef]
  46. Sharifi, A. A Critical Review of Selected Tools for Assessing Community Resilience. Ecol. Indic. 2016, 69, 629–647. [Google Scholar] [CrossRef]
  47. Jones, L. Resilience Isn’t the Same for All: Comparing Subjective and Objective Approaches to Resilience Measurement. WIREs Clim. Change 2019, 10, e552. [Google Scholar] [CrossRef]
  48. Beauchamp, E.; Abdella, J.; Fisher, S.; McPeak, J.; Patnaik, H.; Koulibaly, P.; Cissé, D.; Touré, M.; Bocoum, A.; Ndao, M.; et al. Resilience from the Ground up: How Are Local Resilience Perceptions and Global Frameworks Aligned? Disasters 2019, 43, S295–S317. [Google Scholar] [CrossRef]
  49. Clare, A.; Graber, R.; Jones, L.; Conway, D. Subjective Measures of Climate Resilience: What Is the Added Value for Policy and Programming? Glob. Environ. Change 2017, 46, 17–22. [Google Scholar] [CrossRef]
  50. Adger, W.N. Social and Ecological Resilience: Are They Related? Prog. Hum. Geogr. 2000, 24, 347–364. [Google Scholar] [CrossRef]
  51. Twigg, J. Characteristics of a Disaster-Resilient Community; DFID Disaster Risk Reduction NGO Interagency Group: Teddington, UK, 2009. [Google Scholar]
  52. COSA. Simpler Resilience Measurement: Tools to Diagnose and Improve How Household Fare in Difficult Circumstances from Conflict to Climate Change; The Committee on Sustainability Assessment: Philadelphia, PA, USA, 2017. [Google Scholar]
  53. Schipper, L.; Langston, L. A Comparative Overview of Resilience Measurement Frameworks: Analyzing Indicators and Approaches; Analyzing Indicators and Approaches; Overseas Development Institute: London, UK, 2015. [Google Scholar] [CrossRef]
  54. Derakhshan, S.; Blackwood, L.; Habets, M.; Effgen, J.F.; Cutter, S.L. Prisoners of Scale: Downscaling Community Resilience Measurements for Enhanced Use. Sustainability 2022, 14, 6927. [Google Scholar] [CrossRef]
  55. Cutter, S.L.; Ash, K.D.; Emrich, C.T. Urban–Rural Differences in Disaster Resilience. Ann. Am. Assoc. Geogr. 2016, 106, 1236–1252. [Google Scholar] [CrossRef]
  56. Tariq, H. Measuring Community Disaster Resilience at Local Levels: An Adaptable Resilience Framework. Int. J. Disaster Risk Reduct. 2021, 62, 102358. [Google Scholar] [CrossRef]
  57. Ainuddin, S.; Routray, J.K. Community Resilience Framework for an Earthquake Prone Area in Baluchistan. Int. J. Disaster Risk Reduct. 2012, 2, 25–36. [Google Scholar] [CrossRef]
  58. Mehmood, H. Data Drought in the Global South—Our World. Available online: https://ourworld.unu.edu/en/data-drought-in-the-global-south (accessed on 9 November 2022).
  59. Keating, A.; Campbell, K.; Szoenyi, M.; McQuistan, C.; Nash, D.; Burer, M. Development and Testing of a Community Flood Resilience Measurement Tool. Nat. Hazards Earth Syst. Sci. 2017, 17, 77–101. [Google Scholar] [CrossRef]
  60. Ospina, A.; Heeks, R. Resilience Assessment Benchmarking and Impact Toolkit (RABIT) Implementation Handbook; Centre for Development Informatics Global Development Institute, SEED: Manchester, UK, 2016. [Google Scholar]
  61. Ospina, A.V.; Heeks, R.; Camacho, K.; Calvo, M.; Zúñiga, V.; Barrios, P.; Marin, K.; Rojas, I. Benchmarking Urban Community Resilience; Centre for Development Informatics (CDI): Manchester, UK, 2016. [Google Scholar]
  62. Atwii, F.; Sandvik, K.B.; Kirch, L.; Paragi, B.; Radtke, K.; Schneider, S.; Weller, D. World Risk Report 2022; Bündnis Entwicklung Hilft: Berlin, Germany, 2022. [Google Scholar]
  63. Philippine Statistics Authority 2020 Census of Population and Housing (2020 CPH) Population Counts Declared Official by the President. Philippine Statistics Authority. Available online: https://psa.gov.ph/content/2020-census-population-and-housing-2020-cph-population-counts-declared-official-president (accessed on 14 November 2022).
  64. Ner, N.T.; Okyere, S.A.; Abunyewah, M.; Kita, M. Integrating Resilience Attributes into Local Disaster Management Plans in Metro Manila: Strengths, Weaknesses, and Gaps. Prog. Disaster Sci. 2022, 16, 14. [Google Scholar] [CrossRef]
  65. World Bank Philippines. Urbanization Review: Fostering Competitive, Sustainable and Inclusive Cities; World Bank Philippines: Taguig, Philippines, 2017. [Google Scholar]
  66. NEDA. Philippine Development Plan 2017–2022; NEDA: Pasig Cuty, Philipines, 2017. [Google Scholar]
  67. Singh, G.; Gadgil, G. Navigating Informality: Perils and Prospects in Metro Manila’s Slums; International Bank for Reconstruction and Development/The World Bank: Washington, DC, USA, 2017. [Google Scholar]
  68. Holden, W.N. Chapter 24—Climate Change and Typhoons in the Philippines: Extreme Weather Events in the Anthropocene. In Integrating Disaster Science and Management. Global Case Studies in Mitigation and Recovery; Elsevier: Amsterdam, The Netherlands, 2018; 15p. [Google Scholar] [CrossRef]
  69. Milenioscuro English: Locator Map of XYZ Province in the Philippines. 2020. Available online: https://commons.wikimedia.org/wiki/File:Metro_Manila_in_Philippines.svg (accessed on 15 November 2022).
  70. NAMRIA. Flood Hazard Map of Metro Manila; NAMRIA: Taguig City, Philipines, 2013. [Google Scholar]
  71. Gilbuena, R.; Kawamura, A.; Medina, R.; Amaguchi, H.; Nakagawa, N. Gap Analysis of the Flood Management System in Metro Manila, Philippines: A Case Study of the Aftermath of Typhoon Ondoy. In Floods: From Risk to Opportunity; IAHS Press: Wallingford, UK, 2013; Volume 10, pp. 32–40. [Google Scholar]
  72. Doberstein, B.; Tadgell, A.; Rutledge, A. Managed Retreat for Climate Change Adaptation in Coastal Megacities: A Comparison of Policy and Practice in Manila and Vancouver. J. Environ. Manag. 2020, 253, 109753. [Google Scholar] [CrossRef]
  73. Tadgell, A.; Mortsch, L.; Doberstein, B. Assessing the Feasibility of Resettlement as a Climate Change Adaptation Strategy for Informal Settlements in Metro Manila, Philippines. Int. J. Disaster Risk Reduct. 2017, 22, 447–457. [Google Scholar] [CrossRef]
  74. Vallarta, B.B. Flooding along Major Waterways Can Be Alleviated by Relocating Informal Settlers. Available online: https://www.gmanetwork.com/news/topstories/specialreports/313881/flooding-along-major-waterways-can-be-alleviated-by-relocating-informal-settlers/story/ (accessed on 13 November 2022).
  75. Galuszka, J. Adapting to Informality: Multistory Housing Driven by a Co-Productive Process and the People’s Plans in Metro Manila, Philippines. Int. Dev. Plan. Rev. 2020, 1–29. [Google Scholar] [CrossRef]
  76. Shiraishi, R.; Tanoue, K. Participatory planning and design of social housing for informal settler families: Diverse community-led resettlement practices and collaborations in Metropolitan Manila. J. Archit. Plan. Trans. AIJ 2022, 87, 260–271. [Google Scholar] [CrossRef]
  77. Alvarez, M.K. Benevolent Evictions and Cooperative Housing Models in Post-Ondoy Manila. Radic. Hous. J. 2019, 1, 49–68. [Google Scholar]
  78. Maningo, R.M. Examining Urban Poor Voices: Displacement and Resettlement of Informal Settlers in Metro Manila. Soc. Transform. J. Glob. South 2022, 9, 125–156. [Google Scholar] [CrossRef]
  79. David, J. Lack of Public Spaces within LRB Community Remains Unresolved. Upward up APO AMF. Available online: https://upwardupapoamf.org/en/post/kakulangan-ng-mga-public-space-sa-lrb-community-hindi-pa-naireresolba (accessed on 5 December 2022).
  80. Maningo, R.M. Agency and Everyday Politics of the Urban Poor: Development-Induced Displacement and Resettlement in Metro Manila, Philippines; Nagoya University: Nagoya, Japan, 2022. [Google Scholar]
  81. Juliawati, M.; Darwita, R.R.; Adiatman, M.; Lestari, F. Patient Safety Culture in Dentistry Analysis Using the Safety Attitude Questionnaire in DKI Jakarta, Indonesia: A Cross-Cultural Adaptation and Validation Study. J. Patient Saf. 2022, 18, 486–493. [Google Scholar] [CrossRef]
  82. Smith, L. A Tutorial on Principal Components Analysis. 2002. Available online: https://ourarchive.otago.ac.nz/bitstream/handle/10523/7534/OUCS-2002-12.pdf?sequence=1&isAllowed=y (accessed on 16 February 2023).
  83. Hayton, J.C.; Allen, D.G.; Scarpello, V. Factor Retention Decisions in Exploratory Factor Analysis: A Tutorial on Parallel Analysis. Organ. Res. Methods 2004, 7, 191–205. [Google Scholar] [CrossRef]
  84. Samuels, P. Advice on Exploratory Factor Analysis; Birmingham City University: Birmingham, UK, 2017. [Google Scholar]
  85. Streiner, D.L. Figuring Out Factors: The Use and Misuse of Factor Analysis. In A Guide for the Statistically Perplexed; University of Toronto Press: Toronto, ON, Canada, 2012; pp. 110–122. [Google Scholar]
  86. Costello, A.B.; Osborne, J. Best Practices in Exploratory Factor Analysis: Four Recommendations for Getting the Most from Your Analysis. Pract. Assess. Res. Eval. 2005, 10, 7. [Google Scholar] [CrossRef]
  87. Pantouvakis, A.; Psomas, E. Exploring Total Quality Management Applications under Uncertainty: A Research Agenda for the Shipping Industry. Marit. Econ. Logist. 2016, 18, 496–512. [Google Scholar] [CrossRef]
  88. Hair, J.F.; Ringle, C.M.; Sarstedt, M. Partial Least Squares: The Better Approach to Structural Equation Modeling? Long Range Plann. 2012, 45, 312–319. [Google Scholar] [CrossRef]
  89. Fornell, C.; Larcker, D.F. Evaluating Structural Equation Models with Unobservable Variables and Measurement Error. J. Mark. Res. 1981, 18, 39–50. [Google Scholar] [CrossRef]
  90. Heeks, R.; Ospina, A.V. Analysing Urban Community Informatics from a Resilience Perspective. J. Community Inform. 2015, 11. [Google Scholar] [CrossRef]
  91. Folke, C.; Carpenter, S.R.; Walker, B.; Scheffer, M.; Chapin, T.; Rockström, J. Resilience Thinking: Integrating Resilience, Adaptability and Transformability. Ecol. Soc. 2010, 15, art20. [Google Scholar] [CrossRef]
  92. Aldrich, D.P. How Social Infrastructure Saves Lives: A Quantitative Analysis of Japan’s 3/11 Disasters. Jpn. J. Polit. Sci. 2023, 24, 1–11. [Google Scholar] [CrossRef]
  93. Aldrich, D.P.; Meyer, M.A. Social Capital and Community Resilience. Am. Behav. Sci. 2015, 59, 254–269. [Google Scholar] [CrossRef]
  94. Carmen, E.; Fazey, I.; Ross, H.; Bedinger, M.; Smith, F.M.; Prager, K.; McClymont, K.; Morrison, D. Building Community Resilience in a Context of Climate Change: The Role of Social Capital. Ambio 2022, 51, 1371–1387. [Google Scholar] [CrossRef]
  95. Kerr, S.E. Social Capital as a Determinant of Resilience. In Resilience; Elsevier: Amsterdam, The Netherlands, 2018; pp. 267–275. ISBN 978-0-12-811891-7. [Google Scholar]
  96. Lucini, B. Social Capital and Sociological Resilience in Megacities Context. Int. J. Disaster Resil. Built Environ. 2013, 4, 58–71. [Google Scholar] [CrossRef]
  97. Aldrich, D.P. The Importance of Social Capital in Building Community Resilience. In Rethinking Resilience, Adaptation and Transformation in a Time of Change; Yan, W., Galloway, W., Eds.; Springer International Publishing: Cham, Switzerland, 2017; pp. 357–364. ISBN 978-3-319-50169-7. [Google Scholar]
  98. Fayazi, M.; Lizarralde, G. The role of low-cost housing in the path from vulnerability to resilience. Int. J. Archit. Res. 2013, 7, 146–167. [Google Scholar]
  99. Cui, K.; Han, Z. Cross-Cultural Adaptation and Validation of the 10-Item Conjoint Community Resiliency Assessment Measurement in a Community-Based Sample in Southwest China. Int. J. Disaster Risk Sci. 2019, 10, 439–448. [Google Scholar] [CrossRef]
  100. Abunyewah, M.; Okyere, S.A.; Diko, S.K.; Kita, M.; Erdiaw-Kwasie, M.O.; Gajendran, T. Flooding in Informal Communities: Residents’ Response Strategies to Flooding and Their Sustainability Implications in Old Fadama, Accra. In Disaster Risk Reduction for Resilience: Disaster Risk Management Strategies; Springer International Publishing: Cham, Switzerland, 2022; pp. 435–461. ISBN 978-3-030-72195-4. [Google Scholar]
  101. Amoako, C.; Cobbinah, P.B.; Mensah Darkwah, R. Complex Twist of Fate: The Geopolitics of Flood Management Regimes in Accra, Ghana. Cities 2019, 89, 209–217. [Google Scholar] [CrossRef]
  102. Igup, I.; Belgira, M.L.; Tapel, M. APOAMF’s Women Livelihood Recovery Program, a Boon for Its Beneficiaries. 2021. Available online: https://upwardupapoamf.org/en/posts/t/kuwento/women-livelihood-recovery-program-ng-apoamf-naiaahon-ang-kabuhayan-ng-mga-kababaihan (accessed on 15 February 2023).
  103. Nakhaei, M.; Khankeh, H.R.; Masoumi, G.R.; Hosseini, M.A.; Parsa-Yekta, Z. Participation a Key Factor for Life Recovery After Disaster: A Grounded Theory Study in an Iranian Context. Iran. Red Crescent Med. J. 2016, 18, e25050. [Google Scholar] [CrossRef]
  104. Ntontis, E.; Drury, J.; Amlôt, R.; Rubin, G.J.; Williams, R. Community Resilience and Flooding in UK Guidance: A Critical Review of Concepts, Definitions, and Their Implications. J. Contingencies Crisis Manag. 2019, 27, 2–13. [Google Scholar] [CrossRef]
  105. Abunyewah, M.; Gajendran, T.; Maund, K.; Okyere, S.A. Strengthening the Information Deficit Model for Disaster Preparedness: Mediating and Moderating Effects of Community Participation. Int. J. Disaster Risk Reduct. 2020, 46, 101492. [Google Scholar] [CrossRef]
  106. Okyere, S.A.; Frimpong, L.K.; Abunyewah, M.; Diko, S.K.; Fatemi, M.N.; Mensah, S.L.; Enning, S.B.; Kita, M. The Moderating Role of Covid-19-Related Support on Urban Livelihood Capitals: Evidence from Suburban Accra. Urban Gov. 2023, S2664328623000311. [Google Scholar] [CrossRef]
  107. Patel, S.S.; Rogers, M.B.; Amlôt, R.; Rubin, G.J. What Do We Mean by “Community Resilience”? A Systematic Literature Review of How It Is Defined in the Literature. PLoS Curr. 2017, 9, ecurrentsdisdb775aff25efc5ac4f0660ad9c9f7db2. [Google Scholar]
  108. Chapman, D.A.; Trott, C.D.; Silka, L.; Lickel, B.; Clayton, S. Psychological Perspectives on Community Resilience and Climate Change. In Psychology and Climate Change; Elsevier: Amsterdam, The Netherlands, 2018; pp. 267–288. ISBN 978-0-12-813130-5. [Google Scholar]
Figure 1. Metro Manila location and flood-susceptibility map (adapted from [69,70]).
Sustainability 15 06953 g001
Figure 2. Waterways in Metro Manila identified as priority areas with the cities they cross (adapted from [74]).
Sustainability 15 06953 g002
Figure 3. (a) Location of the resettlement project (source: Google Earth); (b) multi-story housing units in the resettlement project (source: author).
Sustainability 15 06953 g003
Table 1. The RABIT Resilience Framework (adapted from [26]).
Resilience
Attribute
DefinitionIndicators
RobustnessThe ability of a community to sustain a level of stability amid environmental shocks and disruptions
  • Physical infrastructure
  • Coordination between the community and local authorities in the area
Self-organizationThe ability of a community to adjust itself and its protocols under the threat of serious disturbances without external influence
  • Level of trust between community members
  • Collaboration networks
  • Trust in community leaders
LearningThe ability of the community to leverage past experiences to strengthen current skills and innovate and plan creatively for the future
  • Awareness of present risks
  • Access to drills and training
  • Knowledge-sharing between members
RedundancyThe degree to which resources and functions are diversified in the event of a major emergency or disruption
  • Contingency options
  • Diversified income sources
  • External support
RapidityThe capacity of a community to act swiftly and access resources efficiently in emergency situations
  • Access to early warning systems
  • Swift action in response to emergency events
  • Immediate support from external networks during emergencies
ScaleAccess to a wide range of assets and support to facilitate recovery and overcome the deleterious effects of serious disruptions
  • Contact between the community and organizations or institutions that operate at a higher level
  • Collaborations between the community and the private and public sector
  • Cross-scale relationships
DiversityAvailability of a wide variety of courses of action and opportunities to the community and its ability to innovate and improvise given the circumstances
  • Variety of options available to the community
  • Implementation of innovative methods
  • Perception of change as opportunity, as opposed to a threat
EqualityDegree to which the community distributes its resources and opportunities to members of the community equally
  • Participation and enhanced competencies
  • Inclusivity and transparency
Table 2. Characteristics of respondents.
Demographic FactorsComponentsPercentage (%)
GenderFemale79.2
Male20.8
Age15–246.8
25–3413.1
35–4422.5
45–5435.6
55–6418.2
65+3.8
Marital statusSingle13.6
Married74.1
Separated4.2
Widowed8.1
Employment statusEmployed39.4
Unemployed16.5
Retired3.0
Student4.7
Housewife36.4
Educational backgroundPrimary school/junior high school19.9
Senior high school52.1
Vocational (post-SHS)15.7
Tertiary (undergraduate and postgraduate)11.4
No formal education0.8
Level of income (PHP)11,001–22,00025.8
22,001–44,0004.2
44,001–77,0002.1
Less than 11,00062.3
Prefer not to answer5.5
Table 3. Proportion of total variance explained.
FactorsInitial EigenvaluesExtracted Sums of Squared LoadingsRotation Sums of Squared Loadings
Total% of VarCumm%Total% of VarCumm%Total% of VarCumm%
112.91833.12433.12412.91833.12433.1246.49816.66316.663
22.4566.29839.4232.4566.29839.4233.0867.91324.575
32.2975.88945.3122.2975.88945.3122.9327.51932.094
41.8124.64549.9571.8124.64549.9572.6506.79538.889
51.7164.39954.3561.7164.39954.3562.6006.66745.556
61.3273.40257.7581.3273.40257.7582.4686.32851.884
71.1472.94160.6991.1472.94160.6992.2935.88057.764
81.0992.81863.5171.0992.81863.5172.2445.75363.517
90.9712.49066.008
100.9592.45968.467
110.8962.29670.763
120.8072.07072.833
130.7381.93374.766
140.6861.89376.659
150.6461.75978.419
Table 4. Rotated-components matrix of dimensions of resilience.
Variables Factor 1 Factor 2 Factor 3 Factor 4 Factor 5 Factor 6 Factor 7 Factor 8
Scale 1 0.781
Scale 2 0.791
Scale 3 0.754
Scale 4 0.819
Robustness 4 0.718
Robustness 5 0.704
Robustness 6 0.752
Robustness 7 0.681
Robustness 8 0.658
Learning 1 0.857
Learning 2 0.794
Learning 4 0.684
Self-organization 2 0.881
Self-organization 3 0.797
Self-organization 4 0.689
Diversity 1 0.872
Diversity 2 0.759
Diversity 3 0.747
Redundancy 1 0.776
Redundancy 2 0.867
Redundancy 3 0.759
Equality 1 0.840
Equality 3 0.755
Equality 4 0.790
Rapidity 1 0.878
Rapidity 2 0.781
Rapidity 3 0.697
Table 5. Descriptive, reliability, and validity statistics.
Construct DescriptiveReliabilityAVE
MeanStandard
Deviation
Cronbach’s
Alpha
Composite
Robustness 2.39 0.73 0.840.830.50
Self-organization 2.64 0.89 0.830.830.63
Learning 2.22 0.86 0.840.820.61
Redundancy 2.63 0.86 0.870.850.66
Rapidity 2.36 0.97 0.840.830.62
Scale 2.31 1.11 0.880.870.62
Diversity 2.42 0.89 0.850.840.63
Equality 2.54 0.93 0.840.840.63
Table 6. Correlation matrix and square root of AVE.
Factors12345678
Robustness0.71
Self-organization0.530.79
Learning0.130.130.78
Redundancy0.440.100.160.81
Rapidity0.110.310.190.210.79
Scale0.090.140.100.260.140.79
Diversity0.020.060.250.130.050.280.79
Equality0.040.130.020.050.030.100.100.71
NB: square root of AVE (diagonal) in bold.
Disclaimer/Publisher’s Note: The statements, opinions and data contained in all publications are solely those of the individual author(s) and contributor(s) and not of MDPI and/or the editor(s). MDPI and/or the editor(s) disclaim responsibility for any injury to people or property resulting from any ideas, methods, instructions or products referred to in the content.

