Article

Exploration of Coupling Effects in the Digital Economy and Eco-Economic System Resilience in Urban Areas: Case Study of the Beijing-Tianjin-Hebei Urban Agglomeration

1
School of Management, Tianjin University of Technology, Tianjin 300384, China
2
Division of Science and Technology, Tianjin University of Technology, Tianjin 300384, China
3
School of Public Affairs, Xiamen University, Xiamen 361005, China
4
School of Economics and Management, Tsinghua University, Beijing 100084, China
*
Author to whom correspondence should be addressed.
Sustainability 2023, 15(9), 7258; https://doi.org/10.3390/su15097258
Submission received: 3 April 2023 / Revised: 23 April 2023 / Accepted: 24 April 2023 / Published: 27 April 2023
(This article belongs to the Special Issue Advances in Urban Green Development and Resilient Cities)

Abstract

:
Exploring the interaction and coupling effects within the digital economy and eco-economic system resilience in urban agglomeration areas is conducive to promoting high-quality sustainable urban development. Based on the coupling effect perspective, we construct a coupling coordination and development system with multiple elements, information, and interaction flow. The JJJ urban agglomeration from 2010 to 2019 was used as the study sample. The spatiotemporal differences and spatial effects of the coupled coordination were evaluated by combining the tools of combined weight model, coupled coordination model, nuclear density estimation, and exploratory spatial data analysis. The main results can be summarized as follows. (1) From 2010 to 2019, the digital economic index and eco-economic system resilience index of JJJ urban agglomeration maintained an upward trend, and the time series characteristics of the two sides showed a significant positive correlation. Additionally, the overall digital economic development index is better than the resilience development index of the urban eco-economic system. (2) In terms of the type of coupling coordination, the JJJ region has experienced a dynamic evolution process from the imbalance in 2010 to the primary coordination in 2019. The coupling and coordinated development levels of Beijing and Tianjin are obviously better than those of Hebei Province as a whole. (3) The coupling coordination of the system shows certain characteristics of spatial agglomeration and distribution. The overall spatial pattern presents a development pattern with Beijing and Tianjin as the core, and the gap between the north and the south is gradually narrowing. (4) Spatial spillovers and diffusion effects are evident. However, the influential factors have significant differences in the coupling and coordinated development between this region and neighboring regions. The results may provide theoretical support for the continuous improvement of ecological environment quality and green sustainable economic efficiency in urban agglomeration. It provides decision-making reference for promoting regional synergistic development strategy and optimizing spatial pattern of regional integration.

1. Introduction

1.1. Background

The report of the 19th CPC National Congress pointed out that China’s economy has changed from the stage of rapid growth to the stage of high-quality development. In the context of entering the new stage of development and the “double carbon” target, the quality and sustainability of economic development is receiving increasing attention in China [1]. As a major carrier of economic, social, and environmental development, a variety of uncertain risks have become barriers to urban security and sustainable development, including natural disasters such as floods and earthquakes. The term also refers to terrorist attacks, political instability, ecological degradation, environmental pollution, lack of resources, and human-caused disasters that threaten the quality of the environment and human health. Therefore, cities with the carrier of human social development must constantly enhance their adaptability and resilience to resist these shocks to promote the healthy and orderly development of cities [2]. Research on the resilience of the urban eco-economic system will be of great importance for the sustainable and high-quality development of the economy and the enhancement of the performance of human ecological wellbeing [3,4]. Digital economics will gradually become a new engine of future economic growth, and the promotion of deep integration and coordinated development between the digital economy and the ecological environment will be the major theme of future development [5]. The digital economy as a new economic form will undoubtedly affect the economy, society, and the environment. Additionally, by virtue of its strong infiltrative attributes, it continues to broaden the scope and depth of integration with China’s economic, social, scientific and technological, cultural, and other spheres of activity [6]. This will result in the transformation of China’s economic development model through cloud computing, big data, artificial intelligence, and other frontier digital technologies. New economic conditions and green innovative development patterns have been brought into being, bringing great opportunities for China’s urban construction and high-quality economic development [7,8]. Under this background, it will play an important role in the implementation of China’s high-quality sustainable development strategy to study the coupling and coordination relationship between urban digital economy and eco-economic system, as well as to clarify the internal coupling and coordination rules and mechanisms between them.
Under the impetus of the new normal and the new urbanization development strategy, urban agglomeration has become an important supporting structure of China’s economic and social development [9]. The Beijing-Tianjin-Hebei (the abbreviation JJJ, the same as below) urban agglomeration is the largest urban agglomeration in north China, with a land area of 216,800 square kilometres (2.3 percent of the country’s land area) and a population of 113 million people (eight per cent of the country’s total population) in the region. As of 2019, it accounts for nine per cent of China’s GDP. It is one of China’s fastest growing, most open, and innovative urban agglomerations. It has become an important driving force in sustaining China’s participation in the global market, but it is also prone to environmental constraints and resource issues [10,11,12].
The digital and ecological economies are the most important topics in the current economic and environmental policy agenda [13,14]. The ecological economy provides the opportunity for transformation [15], and the digital economy is the new engine and driving force for achieving economic growth and social change [16,17]. Undoubtedly, the two are highly related. However, most of the current academics are carrying out research on both independently. Their studies include research into the digital economy, mainly focusing on promoting carbon emission reduction [18,19], digital finance [20], risk management [21], sharing economy development [22,23], promoting high-quality and resilient economic development [24,25,26,27], promoting industrial structure upgrading [28], and circular economy development content [29,30]. The eco-economy is mainly concerned with improving resource efficiency [31,32], green technology innovation [33], industrial eco-economy [34], and reconciling environmental and economic sustainability [35,36,37]. Only a few institutions and scholars have started to reflect on the compatibility of the digital economy ecosystem with the carbon footprint and the transformation of the green and ecological economic system [38,39,40]. At present, our country is in the process of constructing a new development pattern of “double cycle”, exploring the high-quality integration of ecological economy and digital economy, and building a sustainable digital age. This is an inevitable requirement to implement the new development concept, realize the organic unity of “economic, social and ecological effects”, and an important strategic decision to realize the international commitment of “30.60” [29].
The innovation of this research may be mainly reflected in the following points: first, based on value creation and urban resilience development perspective, it is important to investigate the transmission mechanism, dynamic evolution, and spatio-temporal differentiation characteristics of the regional digital economy and the resilience of eco-economic system. The second objective is to incorporate spatial effects into the research framework in order to explore the spatial heterogeneity of coupling and coordination between the two in the urban agglomeration of JJJ. Thirdly, in order to enhance the level of coupling and coordination between the two and to promote the balanced and synergistic development of the JJJ cluster of cities, after refining the search units, we take the 13 prefecture-level cities in the JJJ cluster of cities as our search objects. This is performed to better explore the spatiotemporal differences and spatial effects of their coupled and coordinated development.

1.2. Literature Review

Digitization and sustainable development are the main trends of economic and social development [41,42,43]. By harnessing the power of the internet and inclusive finance to bring technological innovation effects and resource allocation effects into play, the digital economy enhances the rational sharing and equitable distribution of the wellbeing outcomes of economic development [44,45,46,47,48]. The scale, technology, and structural effects of digital economy development are amplified in terms of their impact on the resource environment [7,49,50,51,52,53,54,55]. The digital economy reduces ecological pollution through the green development effect and innovation development effect, which in turn promotes eco-economic efficiency [56,57,58].
The connotation, measurement methods, theoretical studies, and empirical studies on the resilience of urban eco-economic systems have also been enriched by scholars [59]. In terms of connotation and definition, some scholars have proposed four dimensions of urban economic resilience, namely, resilience, recovery, reorganization, and renewal [60], but most scholars define it as the ability of cities to achieve economic recovery and to create new economic development paths through reconfiguration after effectively coping with external disturbance shocks [61]. At present, there is not a uniform method for measurement. According to the focus of the study, various methods have been designed, including the single-core variable method, the composite index method, the toughness maturity model, the social network model, and the scenario analysis method [62]. At the research scale, it involves counties, municipalities, and specific regions [63]. In terms of theoretical perspectives, scholars mainly sorted out urban adaptive governance, climate change, sustainable management of natural resources, disaster prevention, and urban resilience, which laid the foundation for in-depth research on urban resilience [64]. The empirical research is mainly formulated from the perspectives of urban system resilience operating mechanism, effectiveness evaluation, design planning, and other dimensions [65]. It is important to discuss the influence mechanism and action mechanism on urban eco-economic development based on industrial structure, industrial agglomeration, economic density, entrepreneurial vigor, social security, etc. [66].

1.3. Problem Statement and Objectives

In summary, firstly, the scale of research is concentrated in the country, provinces and other macro categories, and there is a paucity of research on the micro and meso level, such as urban agglomeration. The second problem is the lack of related research on the law of two-way interactions, the dynamical evolution of the degree of interrelated coupling coordination, and the characteristics of spatiotemporal differentiation. Thus, these considerations are based on consideration of regional representativeness and regional economic impacts. In this paper, we focus on the exploratory dynamic analysis of the index coupling coordination relationship and the spatio-temporal evolution pattern of the digital economy and the resilience of urban eco-economic systems. Additionally, these processes reveal their developmental features and the law of coordination of coupling.
Given this, after combing through a large body of studies, the interaction mechanism between infrastructure, structural optimization, technological innovation, and the resource allocation effect of the digital economy and resilient eco-system development forms the basis of this study. Motivated by the combination weight assessment model, the degree of coupling model, kernel density analysis, and the spatial econometric model, the goals of our paper are to address the following questions:
(1)
Overall, what is the time series change and the evolution of the spatiotemporal pattern of resilient coupling and coordinated development of digital economy and eco-economic system resilience in JJJ urban agglomeration?
(2)
What is the distribution law of spatial agglomeration, and what is the evolutionary trend of their coupling and coordinated development?
(3)
Are there any spatial spillover effects, and what are the influencing factors of both?
(4)
Given the above findings, how can differentiated policy recommendations for high quality digital economy development and eco-system resilience be advanced?
The purpose of this paper is to provide a reference for the relevant decisions on the coupling and coordinated development of digital economy and resilience of eco-economic system in China and other countries or regions with similar conditions. The results of the study will help to overcome the contradiction between economic development and ecological environment. Additionally, these results will simultaneously increase people’s wellbeing in the coordinated development process. Promoting high quality economic and social development and forming a new development model are very important.

2. Research and Design

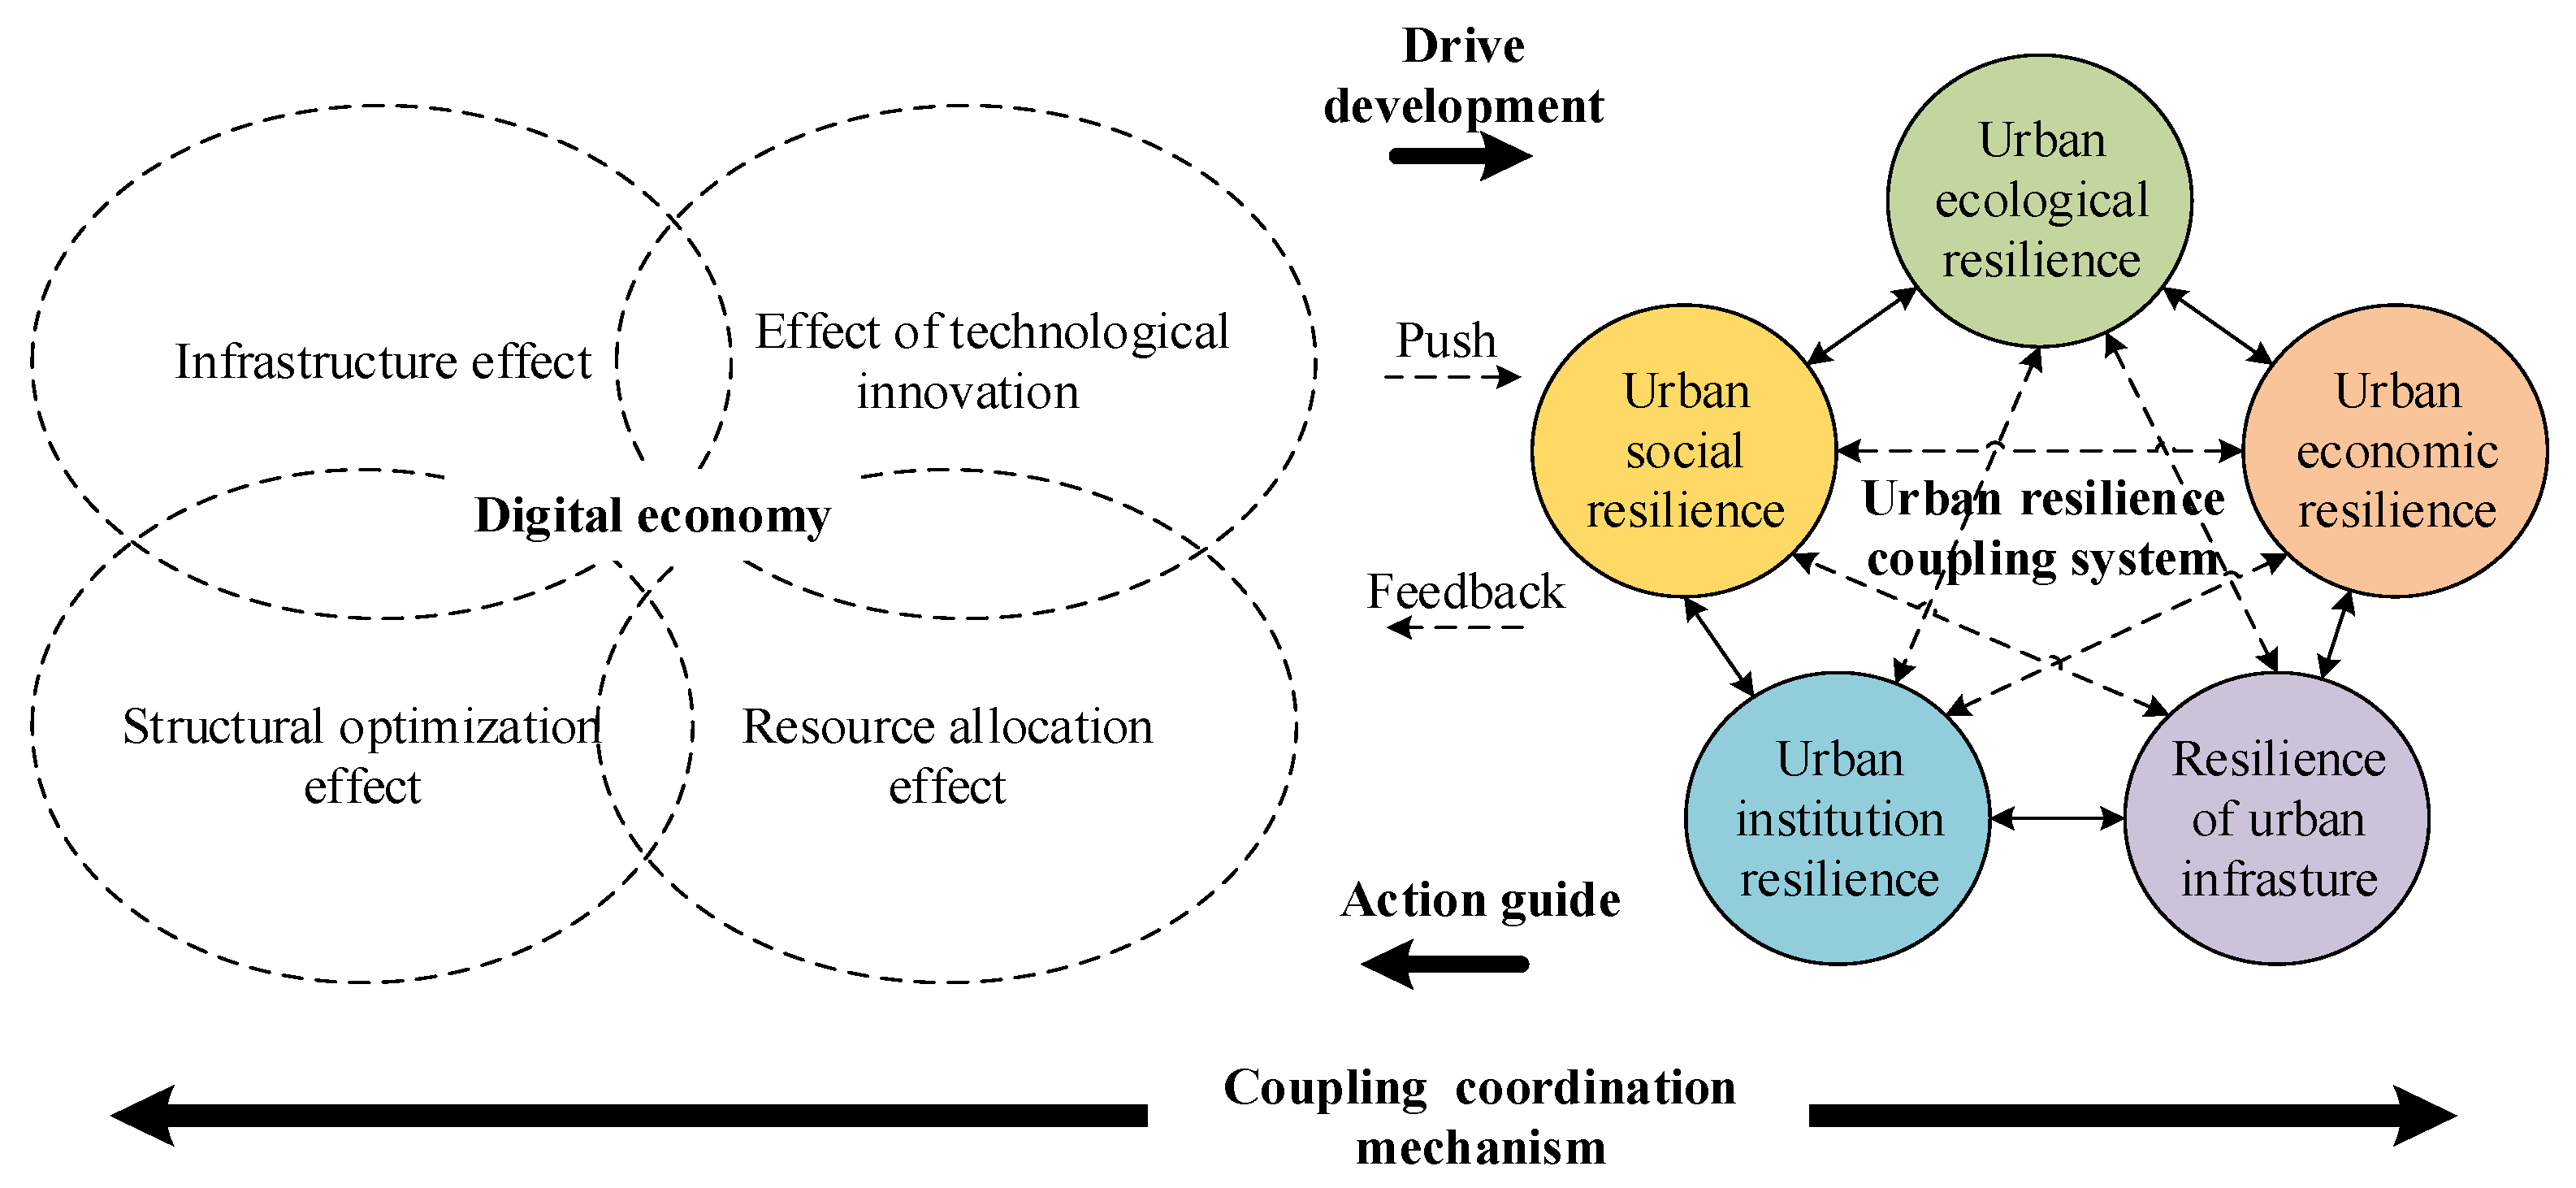
2.1. Theoretical Framework
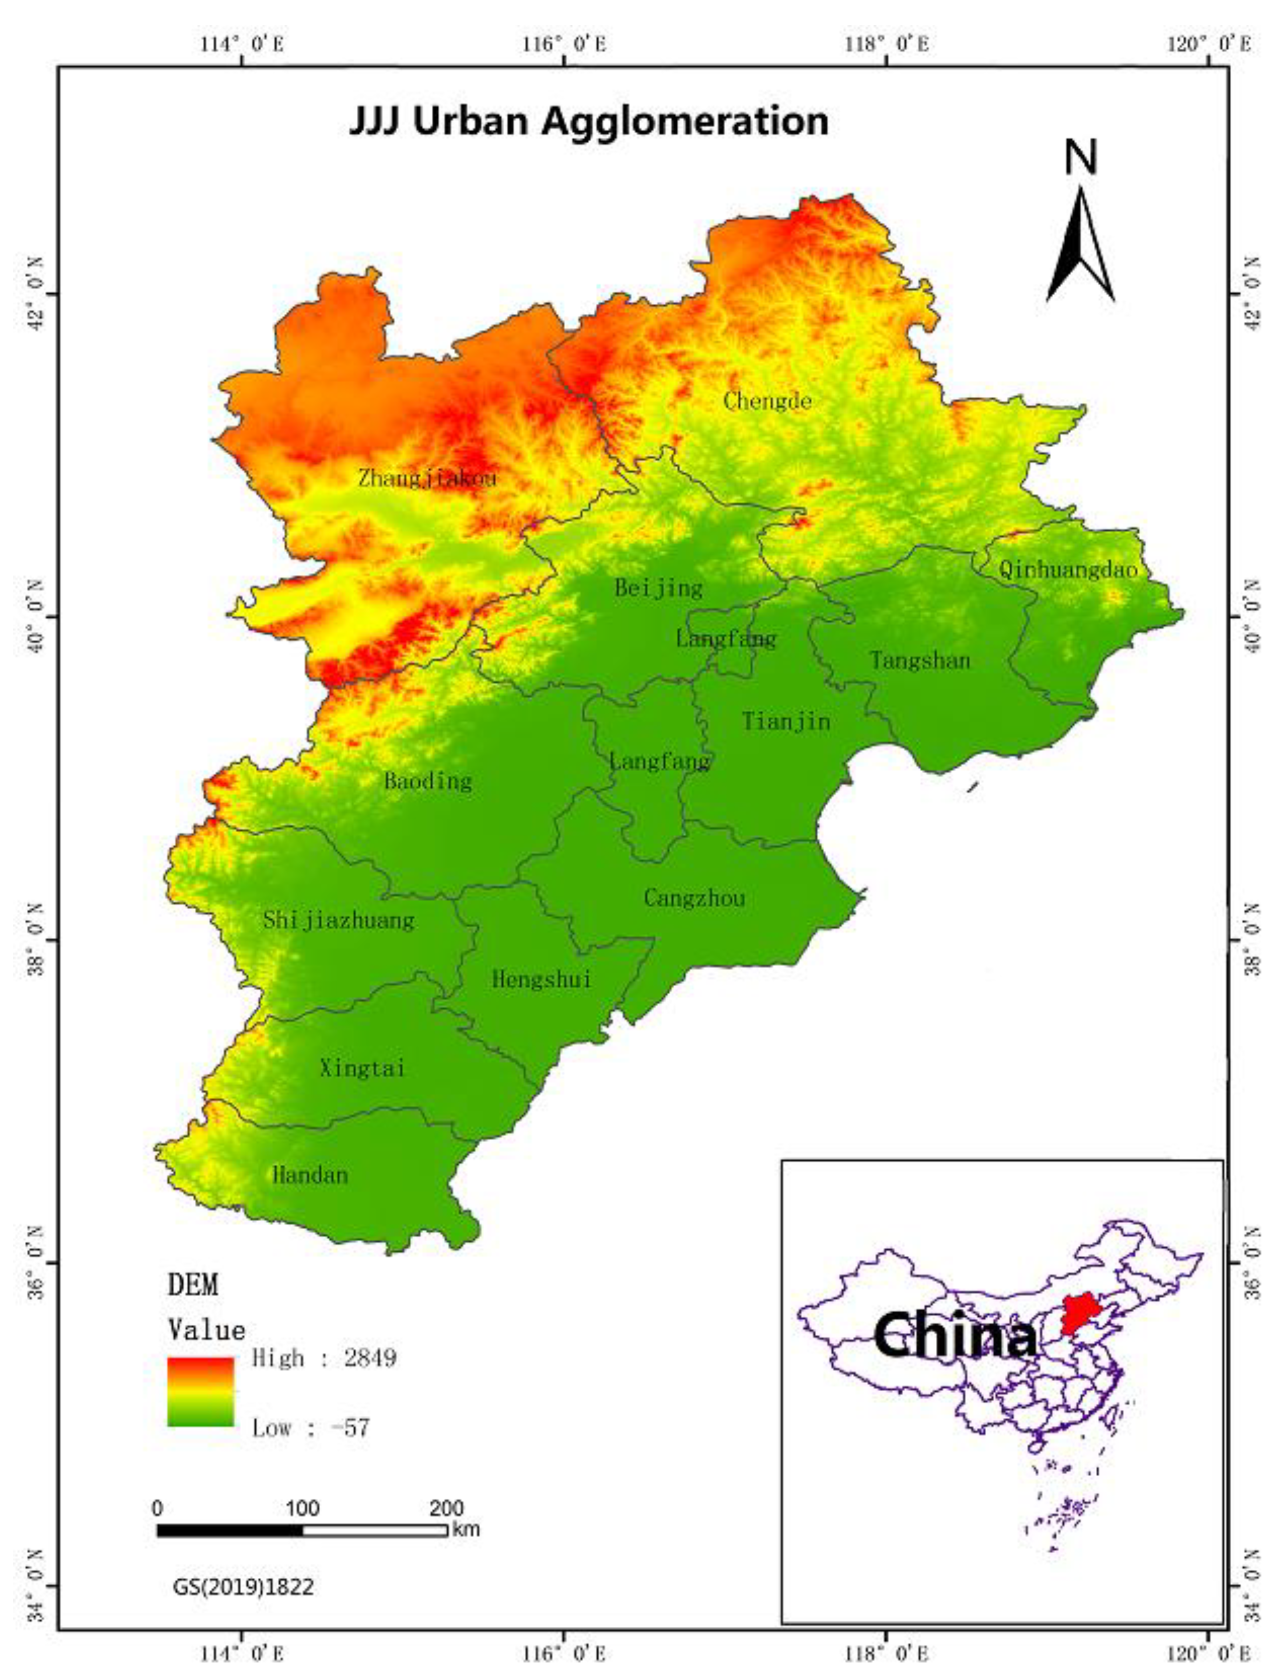
As a facilitator of high-quality economic development, the digital economy provides new technical conditions and a social environment for resilient construction and development of urban eco-systems through digital technologies [67,68]. This improves the total green factor productivity of the socioeconomic system by reducing information asymmetry and optimizing the efficiency of resource allocation [30,69,70], thereby improving the level of resilience of the urban eco-economic system. Consequently, enhancing the resilience of urban eco-economic systems will also feed back into the field of digital economy development. This will boost the solid development of the digital economy in cities and create environmental policies and economic foundations for digital economy development [71]. Specifically, the digital economy improves the matching accuracy of resources, energy efficiency, information symmetry among market players, information communication efficiency, and overcomes the disadvantages of market failure by virtue of its highly permeable properties. It is important to improve the operation and supply efficiency of the economic system and strengthen the endogenous drive of economic development. The digital economy can enhance the ecological efficiency of cities by building a feedback mechanism of ecological protection and propagating the positive concept of green living [72]. The digital economy enhances the informationization and intelligentized level of cities through technology embedding. These promote the transformation and upgrading of urban industrial structure and rapidly accumulate a large number of innovative resources [30]. This deep integration of the digital economy and the real economy allows for the reconstruction of the value creation model, developing a new industrial ecology, as well as promoting the advancement of green technology in China’s “three-high” industries. On the other hand, building and developing the resilience of urban eco-economic systems provides new opportunities for development and economic foundations for the digital economy [73,74]. The development and construction of new infrastructure, smart cities, and other major urban strategic projects align with the digital economy, which results in the deep integration of digital economy development and the resilience building of urban eco-economic systems. This results in interacting with one another to achieve synergy and giving full play to the multiplier effect and the value co-creation effect between one another [75]. Figure 1 illustrates the mechanism of the role of coupling and co-ordinate development.

2.2. Study Area

According to the outline of Beijing-Tianjin-Hebei Cooperative Development Plan (2015.04), the planning area includes two municipalities directly under the central government of Beijing and Tianjin and 11 prefecture-level cities in Hebei Province, forming a spatial layout pattern of 11 + 2 [76]. It is an important part of the Bohai region, plays an important role in the economic development of the Bohai region, and plays an important strategic role in national development [77]. Therefore, this paper takes the Beijing-Tianjin-Hebei (the abbreviation JJJ) urban agglomeration as the research object. Figure 2 is a graph of vector map data for the JJJ urban agglomeration (http://ngcc.sbsm.gov.cn, accessed on 10 January 2022).

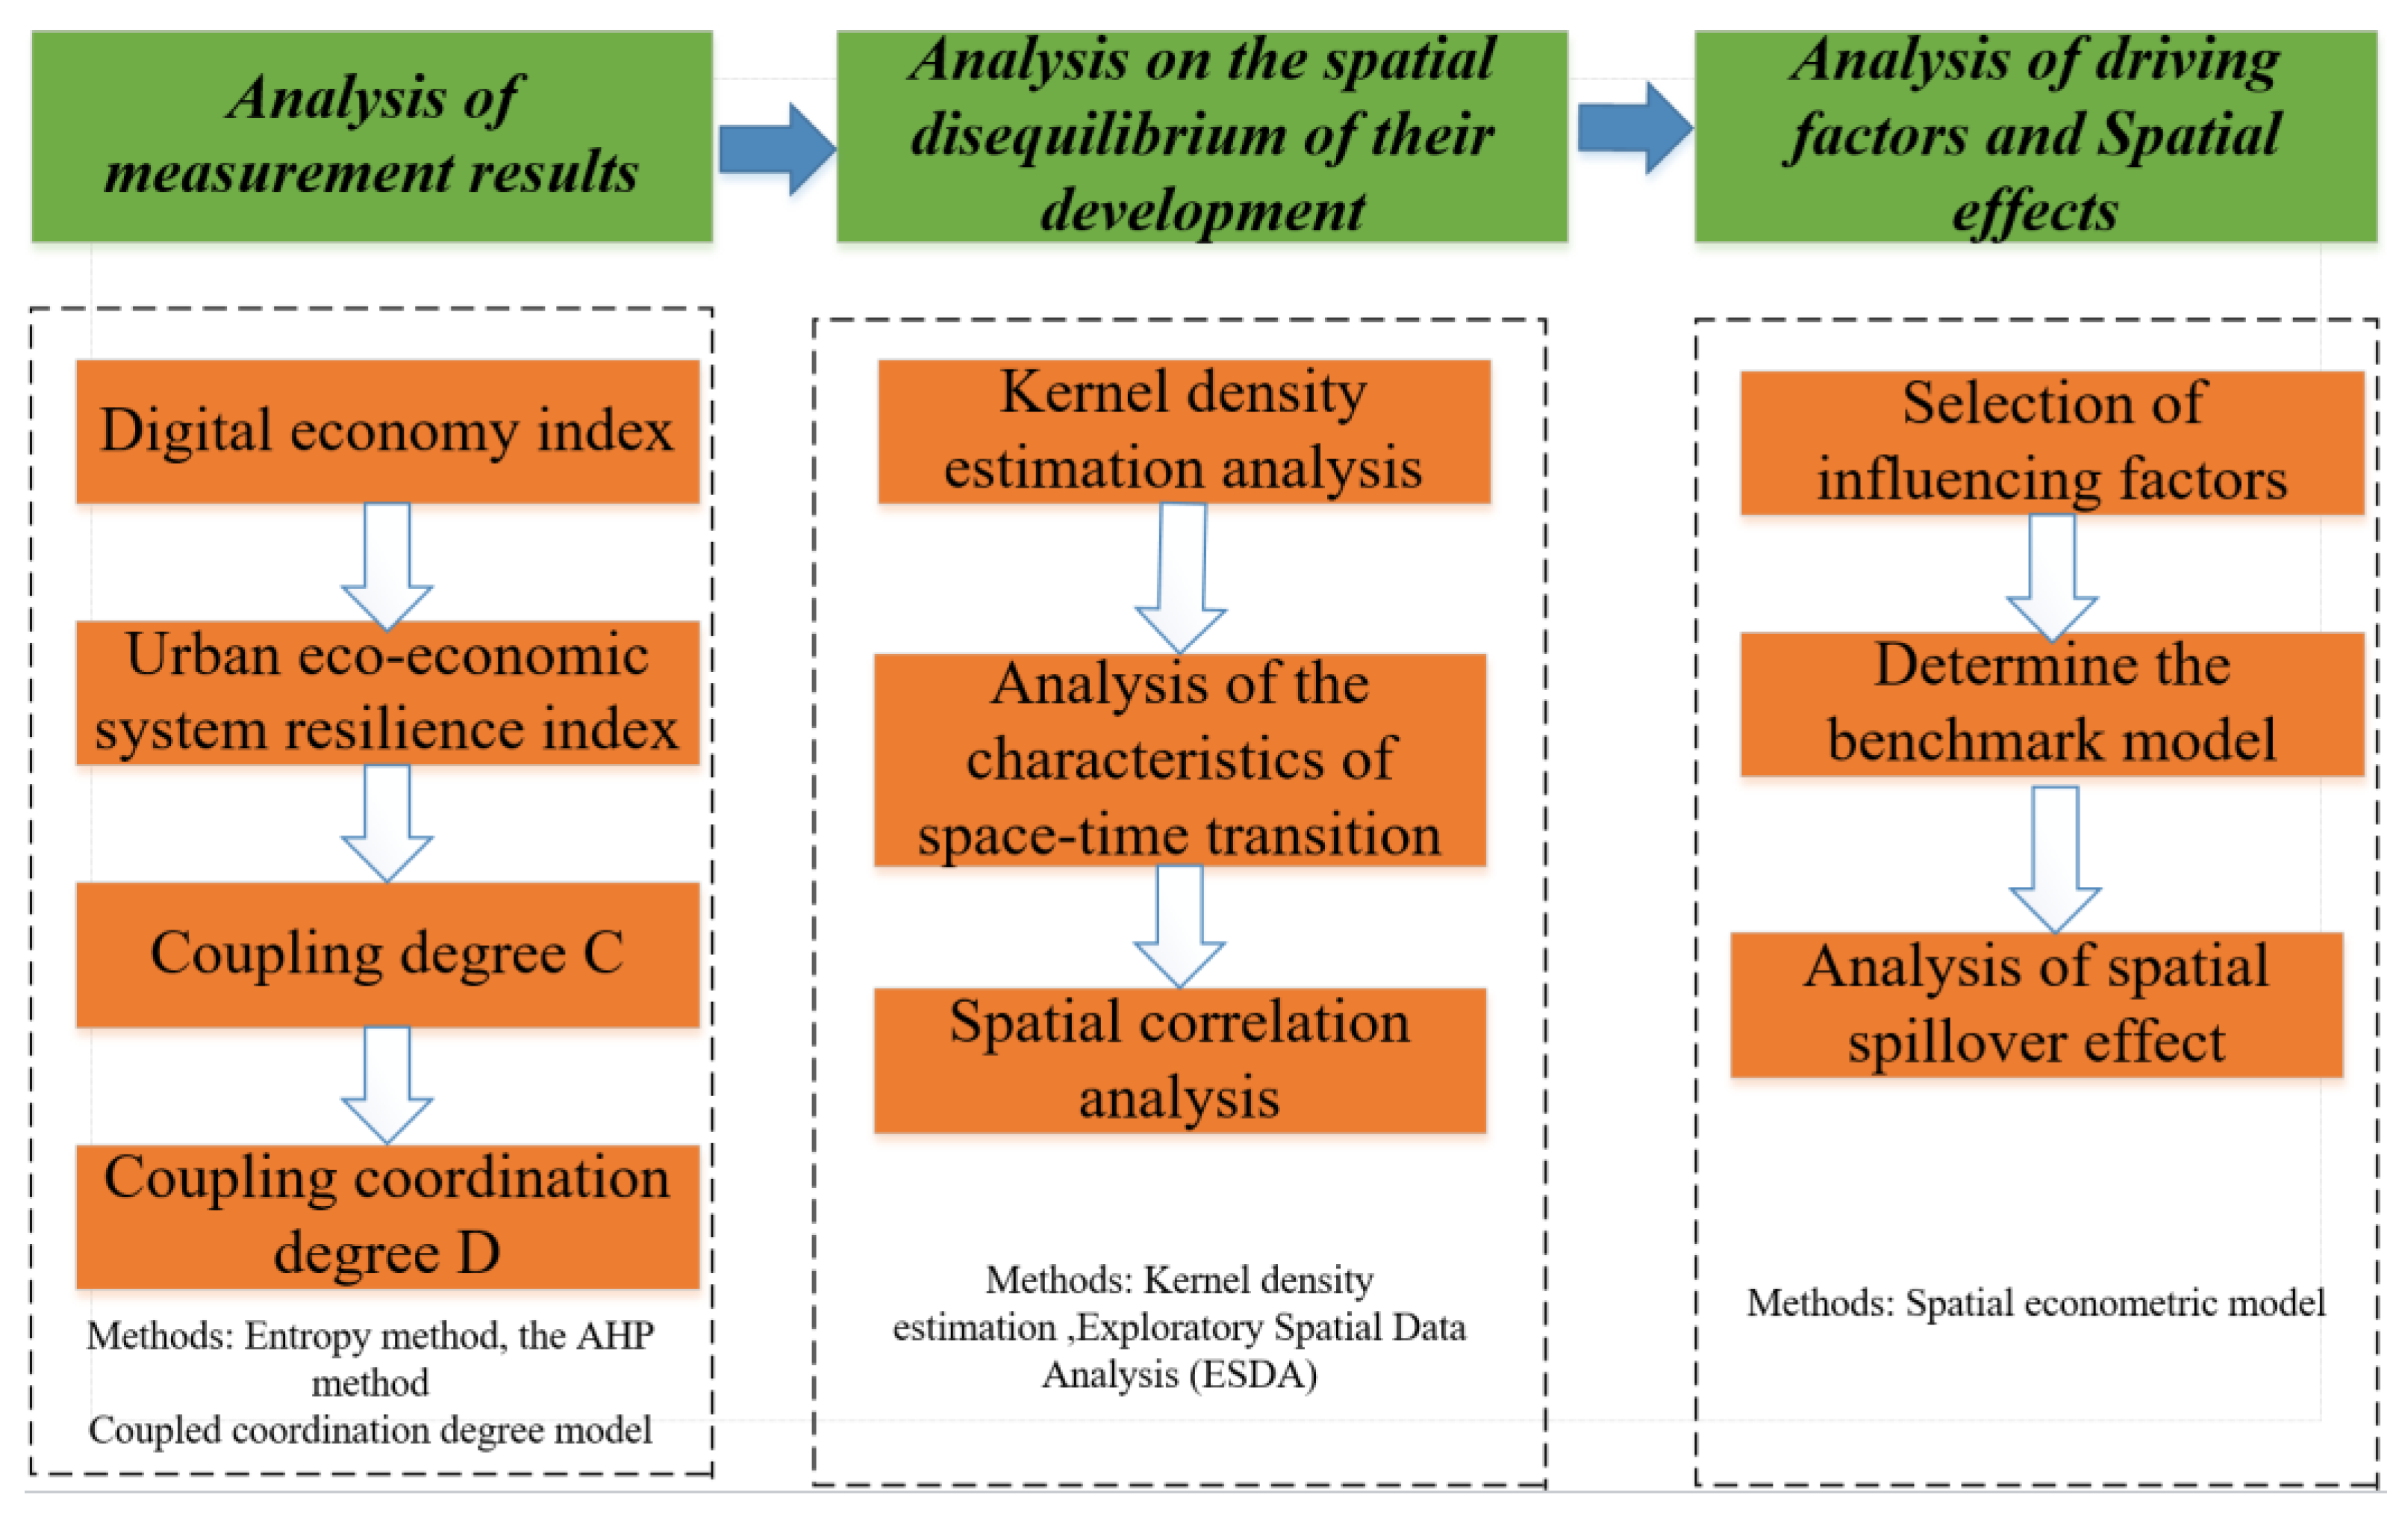
2.3. Research Methods

In this study, an evaluation system was constructed for the coupling and coordinated development of the digital economy and eco-system resilience (Figure 3). The framework consists of three stages: (1) quantifying the assessment of resilience development of digital economy and eco-economic system and analyzing their related data according to the measurement results, including evaluation index, coupling degree, and coupling coordination degree. (2) The next step is visualization of a non-equilibrium spatial analysis of the coupling and coordinated development of the regional digital economy and eco-economic system resilience, including kernel density estimation, the spatiotemporal transition characteristics of their degree of coupling coordination, and spatial correlation. (3) The selection of possible driving factors for both coupling and coordinated development, and the determination of the spatial landmark regression model, are important. Additionally, one should perform a spatial analysis of the spillover effect.

2.3.1. Evaluation Model Based on Combinatorial Weights

In order to determine the weight, it is necessary to choose the corresponding weighting method, and the weight determined by different weighting methods is not the same. The combination of subjective and objective weighting is a method of weighting between subjective and objective values. Weight determination has both subjective qualitative components and quantitative computation of the data [78]. In an effort to reduce the influence of subjective factors and fully explore the original data, to weight the evaluation index, we use the subjective and objective combination weighting method that combines AHP and entropy.
Analytic hierarchy process (AHP) is a hierarchical weight decision analysis method put forward by American operations researcher T.L. Saaty [79]. This method combines quantitative analysis with qualitative analysis to solve multi-objective complex problems. With the advantages of its flexible and concise system, it has been widely valued and applied in all fields of social economy, such as engineering planning, resource allocation, programme sequencing, policy development, performance evaluation, energy systems analysis, marine systems analysis, and urban planning [80,81,82,83,84].
This method uses the experience of decision makers to judge the relative importance of the criteria for measuring whether the goals can be achieved or not, and it reasonably gives the weight of each decision-making scheme. The rules for defining the scale of the judgment matrix are as follows: compared with the two factors, if they have the same importance, the scale is 1; when the current one is slightly more important than the latter, the scale is 3; when the former is obviously more important than the latter, the scale is 5; when the former is stronger more important than the latter, the scale is 7; when the former is most important in relation to the latter, the scale is 9, and the scales of 2, 6, and 8 represent the intermediate value in the above judgment.
Specific methods include: 50 experts are asked to assign the index using the 1 to 9 scale method, and then this is applied to computing the scaled mapping value of the entropy enhanced method. Once the judgment matrix is established, the weight of the index is computed according to the root method. Finally, a one-tailed test was performed.
(1)
Once the initial index data are normalized by the range method, the difference coefficients for each index are calculated by the ordinary entropy method.
g j = 1 1 l n   m i = 1 m p i j   l n   p i j ,   p i j   =   x i j i = 1 m x i j
(2)
The AHP weighting method is used to calculate the scale mapping value of 1 to 9 in the improved entropy method.
First of all, find the maximum difference coefficient ratio D:
D = max g j min g j
Secondly, find the mapping ratio R of 1–9 scale:
R = D a a 1
Finally, the mapping value of the 1–9 scale is calculated.
(3)
The mapping value of 1–9 scale is obtained by multiplying the original scale value of R by 1–9 scale in AHP weighting method, and the result is shown in Table 1. Of these, 0–8 corresponds to a subtraction of 1 on a scale of 1–9 in the AHP method.
(4)
Construct the judgment matrix of the improved entropy method and calculate the weight.
Calculate the difference coefficient ratio of the index r j k = g j g k g j > g k . The difference between the improved entropy method and the one with the smallest difference of the mapping value of the 1–9 scale is the result of comparing the relative importance of the two indexes, so as to construct the judgment matrix.
(5)
Calculate the weight value and evaluation value of the index.
According to the judgment matrix, the eigenvector corresponding to the maximum eigenvalue of the matrix is solved and normalized, and thus the weight is obtained. Finally, the evaluation value of each index can be obtained.

2.3.2. Nuclear Density Analysis

Kernel density estimation is a nonparametric testing method. In comparison to other estimation methods, this method does not use prior knowledge of data distribution and does not attach any assumptions to data distribution. Given its weak model dependence and excellent statistical properties, this method has been used extensively in the exploration of the spatial distribution imbalance problem [85].
The formula is as follows:
f n x = 1 n h n i = 1 n K x i x h n K x = 1 2 π exp x 2 2
In the form, f n x is a for probability density function; K x is a for Gaussian kernel density function; n represent number of samples; h n represent broadband; and x is the mean value. In general, the wider the broadband, the smoother the density function and the lower the estimated precision.

2.3.3. Coupled Coordination Degree Model

The calculation model of the coupling and coordinated development of regional digital economy and urban eco-economic system resilience is as follows [86]:
C = 2 U 1 U 2 / U 1 + U 2 U 1 + U 2 1 / 2
where: the coupling degree value C ∈ [0,1], and, the larger the C value, the higher the level of resonance coupling between the two systems, and vice versa.
The coupling degree reflects the similarity level of the system elements and does not represent the overall level of factor development and the synergistic effect of the two. It cannot well characterize the regional digital economy and the level of resilient urban eco-economic system development and its coordination or further construct the coupling coordination degree model. The formula is as follows:
D = ( C T ) 1 / 2 ,   T = α U 1 + β U 2
where: D it is the coupling coordination degree; T it is the comprehensive coordination index of the digital economy and the urban eco-economic system resilience; α and β are the degree of contribution of the digital economy and the urban eco-economic system resilience development to the economy and society, respectively. Considering that the contribution degree of the two is not distinguished from each other [81], here, take α = β = 0.5. According to D, the size of coupling coordination rrefers to previous research [87,88]. Establish the grade evaluation standard of coupling coordination degree, as shown in Table 2.

2.3.4. Exploratory Spatial Data Analysis (ESDA)

(1)
Global autocorrelation analysis
The global spatial autocorrelation analysis method is used to identify the spatial agglomeration of digital economy and urban eco-economic system resilience development level in the JJJ.
I = i = 1 n j = 1 n w i j x i x x j x / i = 1 n x i x 2 i = 1 n j = 1 n w i j
where n is the number of spatial units in the study area; x i and x j represent the coupled coordination index of cities I and city j; x represents the average of the study object; w i j is the adjacent spatial weights matrix. I ∈ [−1,1], and, if I > 0, this indicates that the degree of coupling and coordination of the digital economy and the urban eco-economic system resilience index in the JJJ region is spatially clustered and has a positive spatial correlation.
(2)
Local autocorrelation analysis
The local Moran’s I index is usually used to measure and draw the LISA aggregation map to measure the spatial correlation characteristics between this region and adjacent regions, including HH, LL, HL, and LH [89]. The calculation formula is as follows:
I = x i x j = 1 n w i j x j x 2 / i = 1 n x i x 2
In the form, x i , x j , and w i j are related to the definition of symbols, which is the same as (7); I is a local Moran’s I index, with a range of values [−1, 1], and a positive value indicates the spatial agglomeration of similarity around the regional unit.

2.3.5. Spatial Econometric Model

Due to the existence of technical diffusion and spillover effects in the region, spatial factors need to be considered [90]. The commonly used models include (SEM), (SAR), and (SDM) in the following forms:
(1)
Spatial Error Model (SEM)
γ = β i x i + μ i + η i + ϕ i , t ϕ i , t = λ ω ϕ i , t + ε i , t
where: ω represents the adjacent spatial weights matrix; μ i and η i represent the individual and time fixed effects, respectively; x i represents explanatory variables; ε i , t represents the random interference term; and λ represents the error spatial correlation coefficient.
(2)
Spatial lag model (SAR)
γ = ρ ω γ i , t + β i x i + μ i + η i + ε i , t
where: ρ represents the coefficient of the spatial hysteresis term.
(3)
Spatial Durbin Model (SDM)
γ = ρ ω γ i , t + ω x i , t β + μ i + η i + ϕ i , t
where: β indicates the spatial autoregressive coefficient of the explanatory variable, and the meaning of other variables is unchanged.
(4)
Build spatial weight matrix
Construct adjacency matrix (W), inverse distance matrix (D), and economic distance matrix (E) to test the robustness of spatial metrology results. If the city of i and the city of j are adjacent W i j = 1 , the other takes 0; considering that the spatial effect L i j decays with the increase in distance, an inverse distance matrix, based on the square reciprocal, is established, and, if i j, the D i j = 1 L i j 2 , other takes 0; the economic weight matrix is constructed using GDP per capita, and, if i j, the weight is taken as E i j = 1 g i g j , and the other is 0.

2.4. Indicator Selection and Data Sources

Combined with the analysis of coupling coordination mechanism (Figure 1) and related research results in [31,32,33,34,35,36,37,38,39,40], this paper decomposes the urban eco-economic system resilience index into five dimensions: economic level resilience, social level resilience, institutional resilience, infrastructure resilience, and ecological environment resilience, and it constructs 21 evaluation indicators to measure them. Among them, urban economic level is the basis and driving force of urban resilience regulation and control [15], which directly affects urban ecological, environmental, and social levels, mainly including urban economic structure, urban economic efficiency, and urban economic innovation capacity, etc. The urban social level is the guarantee of urban resilience and sustainable development [36]. We enhance the resilience of urban social development by providing labor for urban economic development, technical support for enterprise development, and solutions for resource utilization and environmental management. Urban institutional factors are an important guarantee for strengthening urban resilience and help break down various barriers between urban resources (people, money, materials, information, processes, etc.) so that resources are rationally allocated and information is effectively communicated between various urban sectors [39]. Infrastructure is the artificial environment of the city, which is a key factor in ensuring the resilience of human and urban environmental systems [91], similar to the “meridian skeleton” of the body, and it plays an important role in ensuring sustainable urban development [61]. The ecological environment is the spatial carrier of sustainable urban development, mainly including the regional natural environment and urban landscape green space, which can provide various ecosystem services based on natural ecological processes to enhance the ecological resilience of cities [92].
On the basis of the mechanism analysis and previous research findings [18,19,20,21,22,23,24], in this study, we intend to measure the level of development of the digital economy from four levels: digital infrastructure, digital industry development, capacity for digital innovation, and digital financial inclusion. Digital infrastructure is the guarantee, and this study is mainly concerned with broadband internet infrastructure and mobile internet infrastructure, which are two indicators to measure. They were characterized by the number of internet users per 10,000 people and the number of mobile phone users per 10,000 people, respectively. Digital industry development is the core of digital economy development, and this study mainly measures the development of e-commerce industry, the foundation of information industry and the output of telecommunication industry. They were characterized by the number of urban e-commerce parks, the number of employees in the information transmission, computer services and software industries, and the total number of telecommunications services. Digital innovation ability is the key to the development of digital economy. This research mainly measures digital innovation from the support of digital innovation elements, digital innovation output level, and digital high-tech penetration. It is characterized by the expenditure of science and technology, the number of patents related to the digital economy per 10,000 people, and the penetration of digital high-tech applications in listed companies. Finance is the hub of resource allocation and an important driving force for the development of the real economy. Digital inclusion finance is an essential component of digital life, which is measured in part by the breadth of coverage, depth of use, and digitization of digital inclusion finance.
Lastly, multiple collinearities may exist among the index variables chosen in this study. For this reason, prior to the empirical analysis, this study uses the variance expansion factor (VIF) to analyze whether multicollinearity exists in all of the index variables. This shows that the VIF for each index variable is less than 10, i.e., there is no problem of multicollinearity between the variables. As shown in Table 3.
The research data come from the statistical bulletins of official websites, such as the China Statistical Yearbook, the China Science and Technology Statistical Yearbook, and the China Environmental Statistical Yearbook and the Statistical Yearbooks of Beijing, Tianjin and Hebei Province from 2011 to 2020. The missing data of individual years are supplemented by linear interpolation, and the macro variables are adjusted for the base period of 2010. The distribution data of e-commerce parks come from the e-commerce industrial park development alliance (http://cyylm.ec.com.cn/, accessed on 10 January 2022), and the patents related to digital economy come from the patent search website of the State intellectual property Office (http://pss-system.cnipa.gov, accessed on 10 January 2022 ), the penetration degree of digital high-tech applications in listed companies comes from the China Digital economy Research Database (https://cn.gtadata.com/, accessed on 10 January 2022) provided by CSMAR, and the digital inclusive financial data comes from the China Digital inclusive Financial Index (https://tech.antfin.com/research/data, accessed on 10 January 2022), measured by the Digital Finance Research Center of Peking University and Ant Financial Services Group. ( The penetration level of high technology is mainly reflected by calculating the frequency of artificial intelligence technology, blockchain technology, cloud computing technology, and big data technology. The digital technology application in the listed companies reports the frequency of the breakdown of indicators, and then the average aggregation to the city scale is used to reflect the penetration level of new and high technology).

3. Result Analysis

3.1. Analysis of Measurement Results

According to the above methods and the comprehensive evaluation index system, the resilience index, coupling degree, and coordination degree of digital economy and urban eco-economic system in Beijing, Tianjin and Hebei Province from 2010 to 2019 are calculated (Figure 4).
(1)
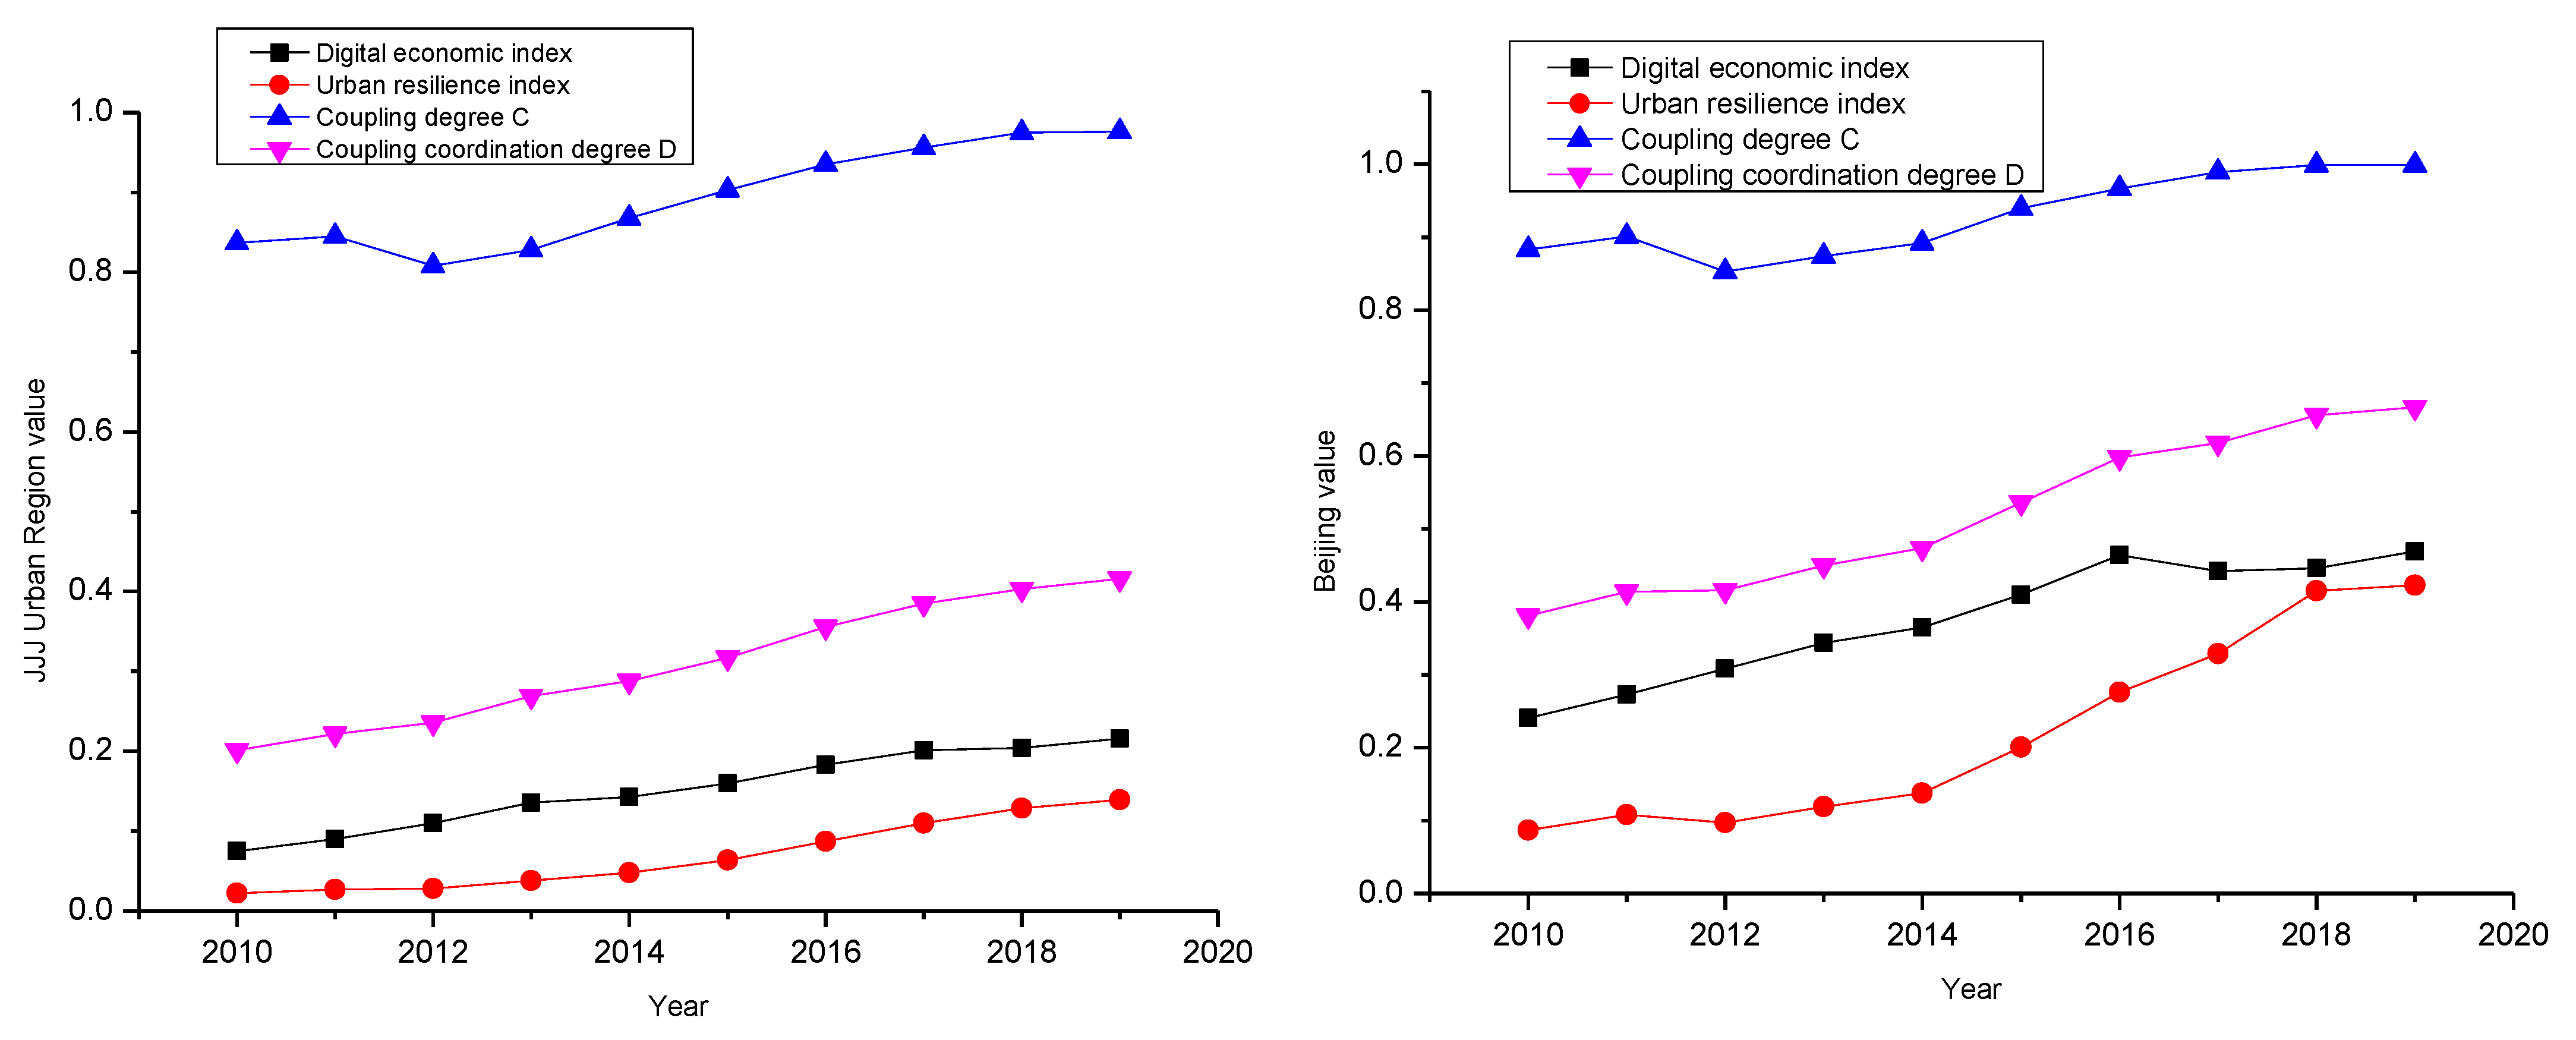
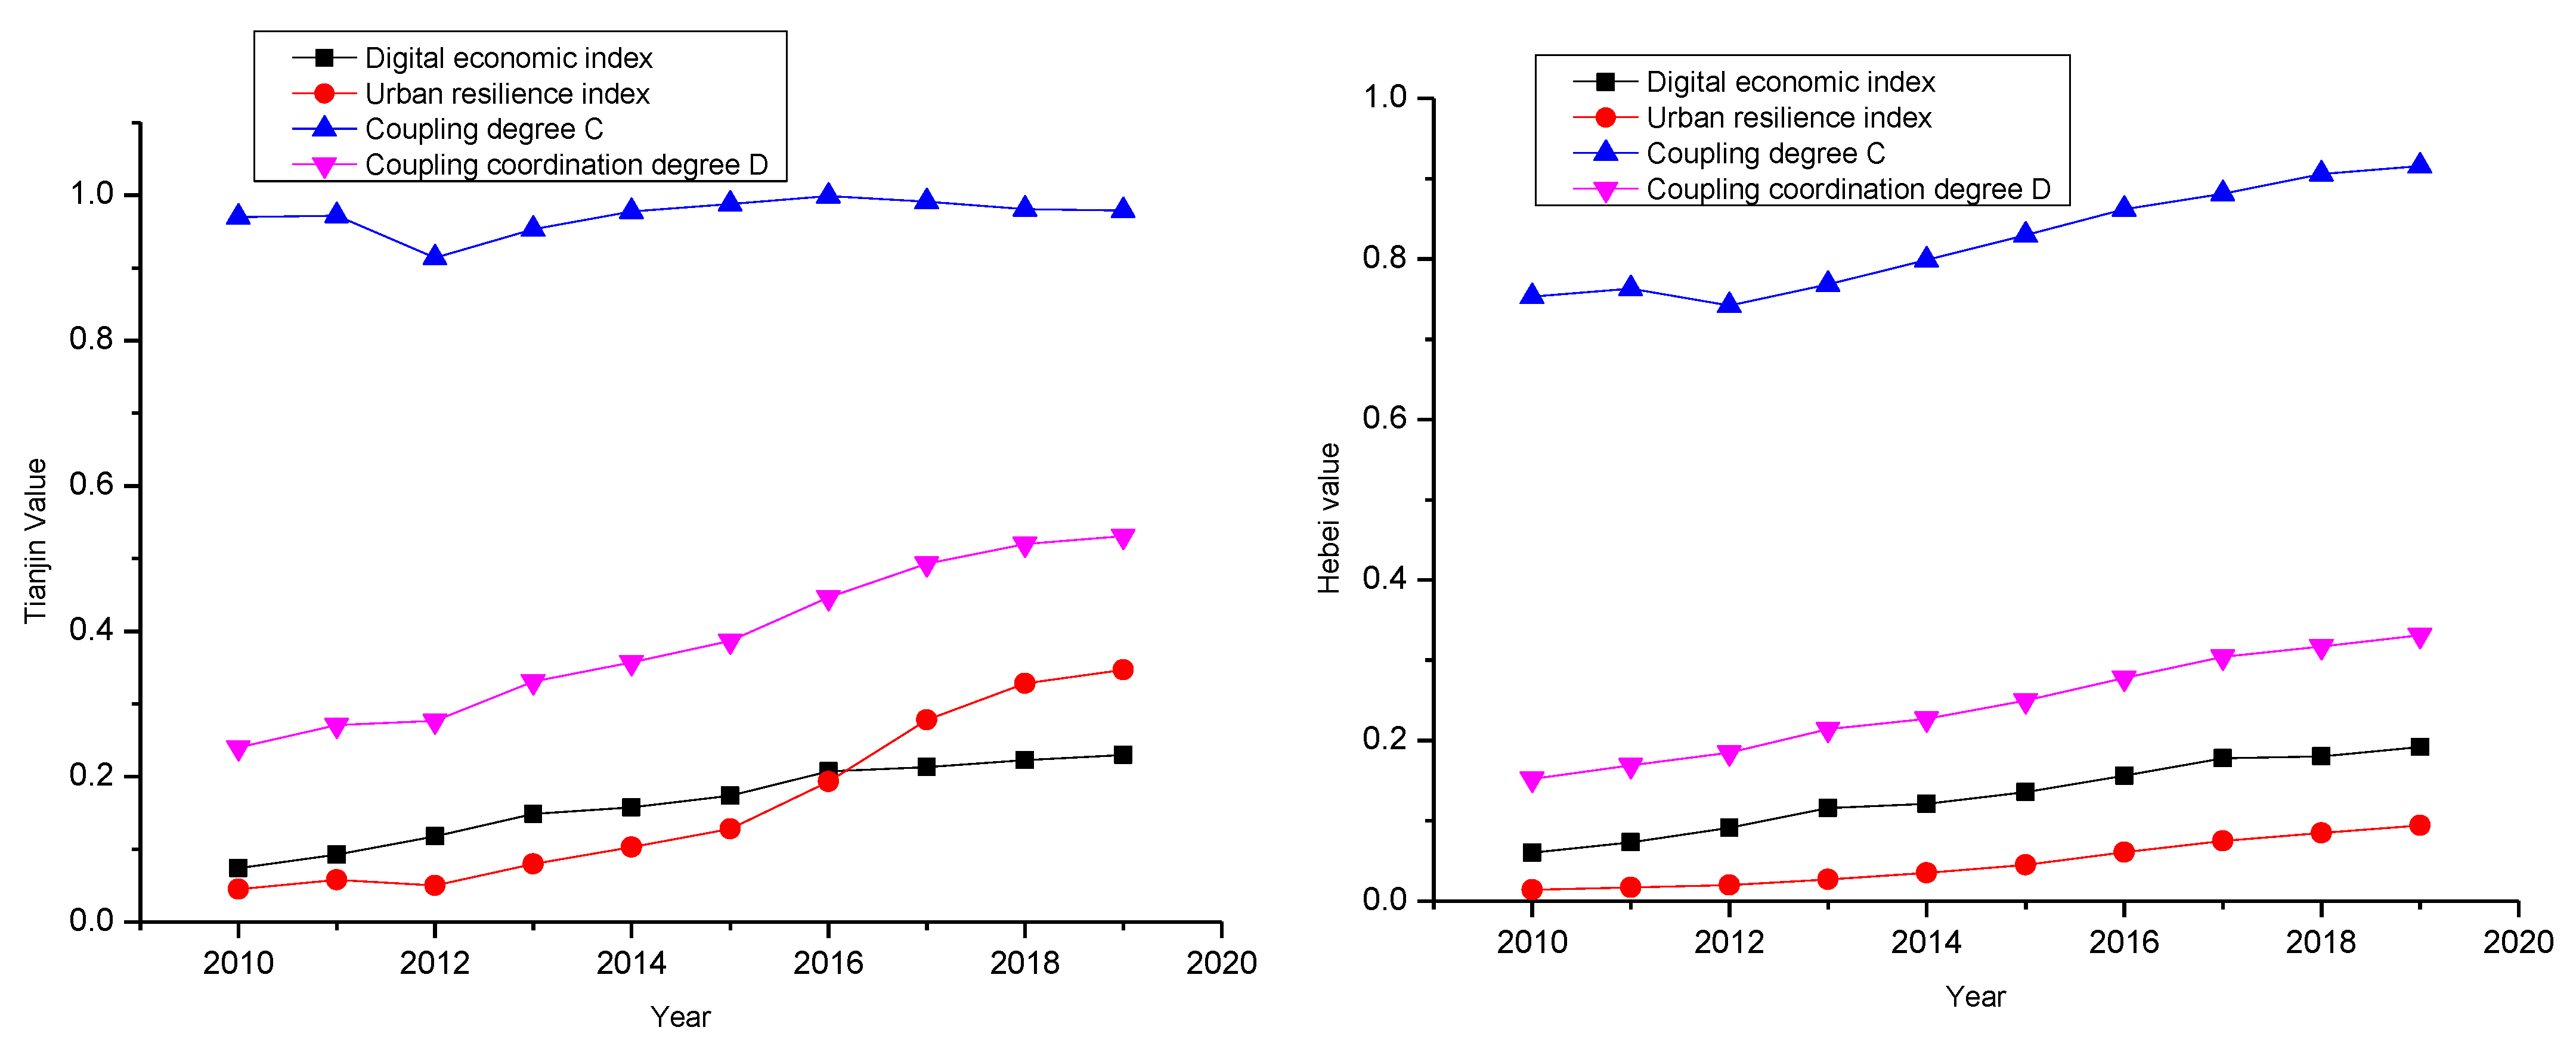
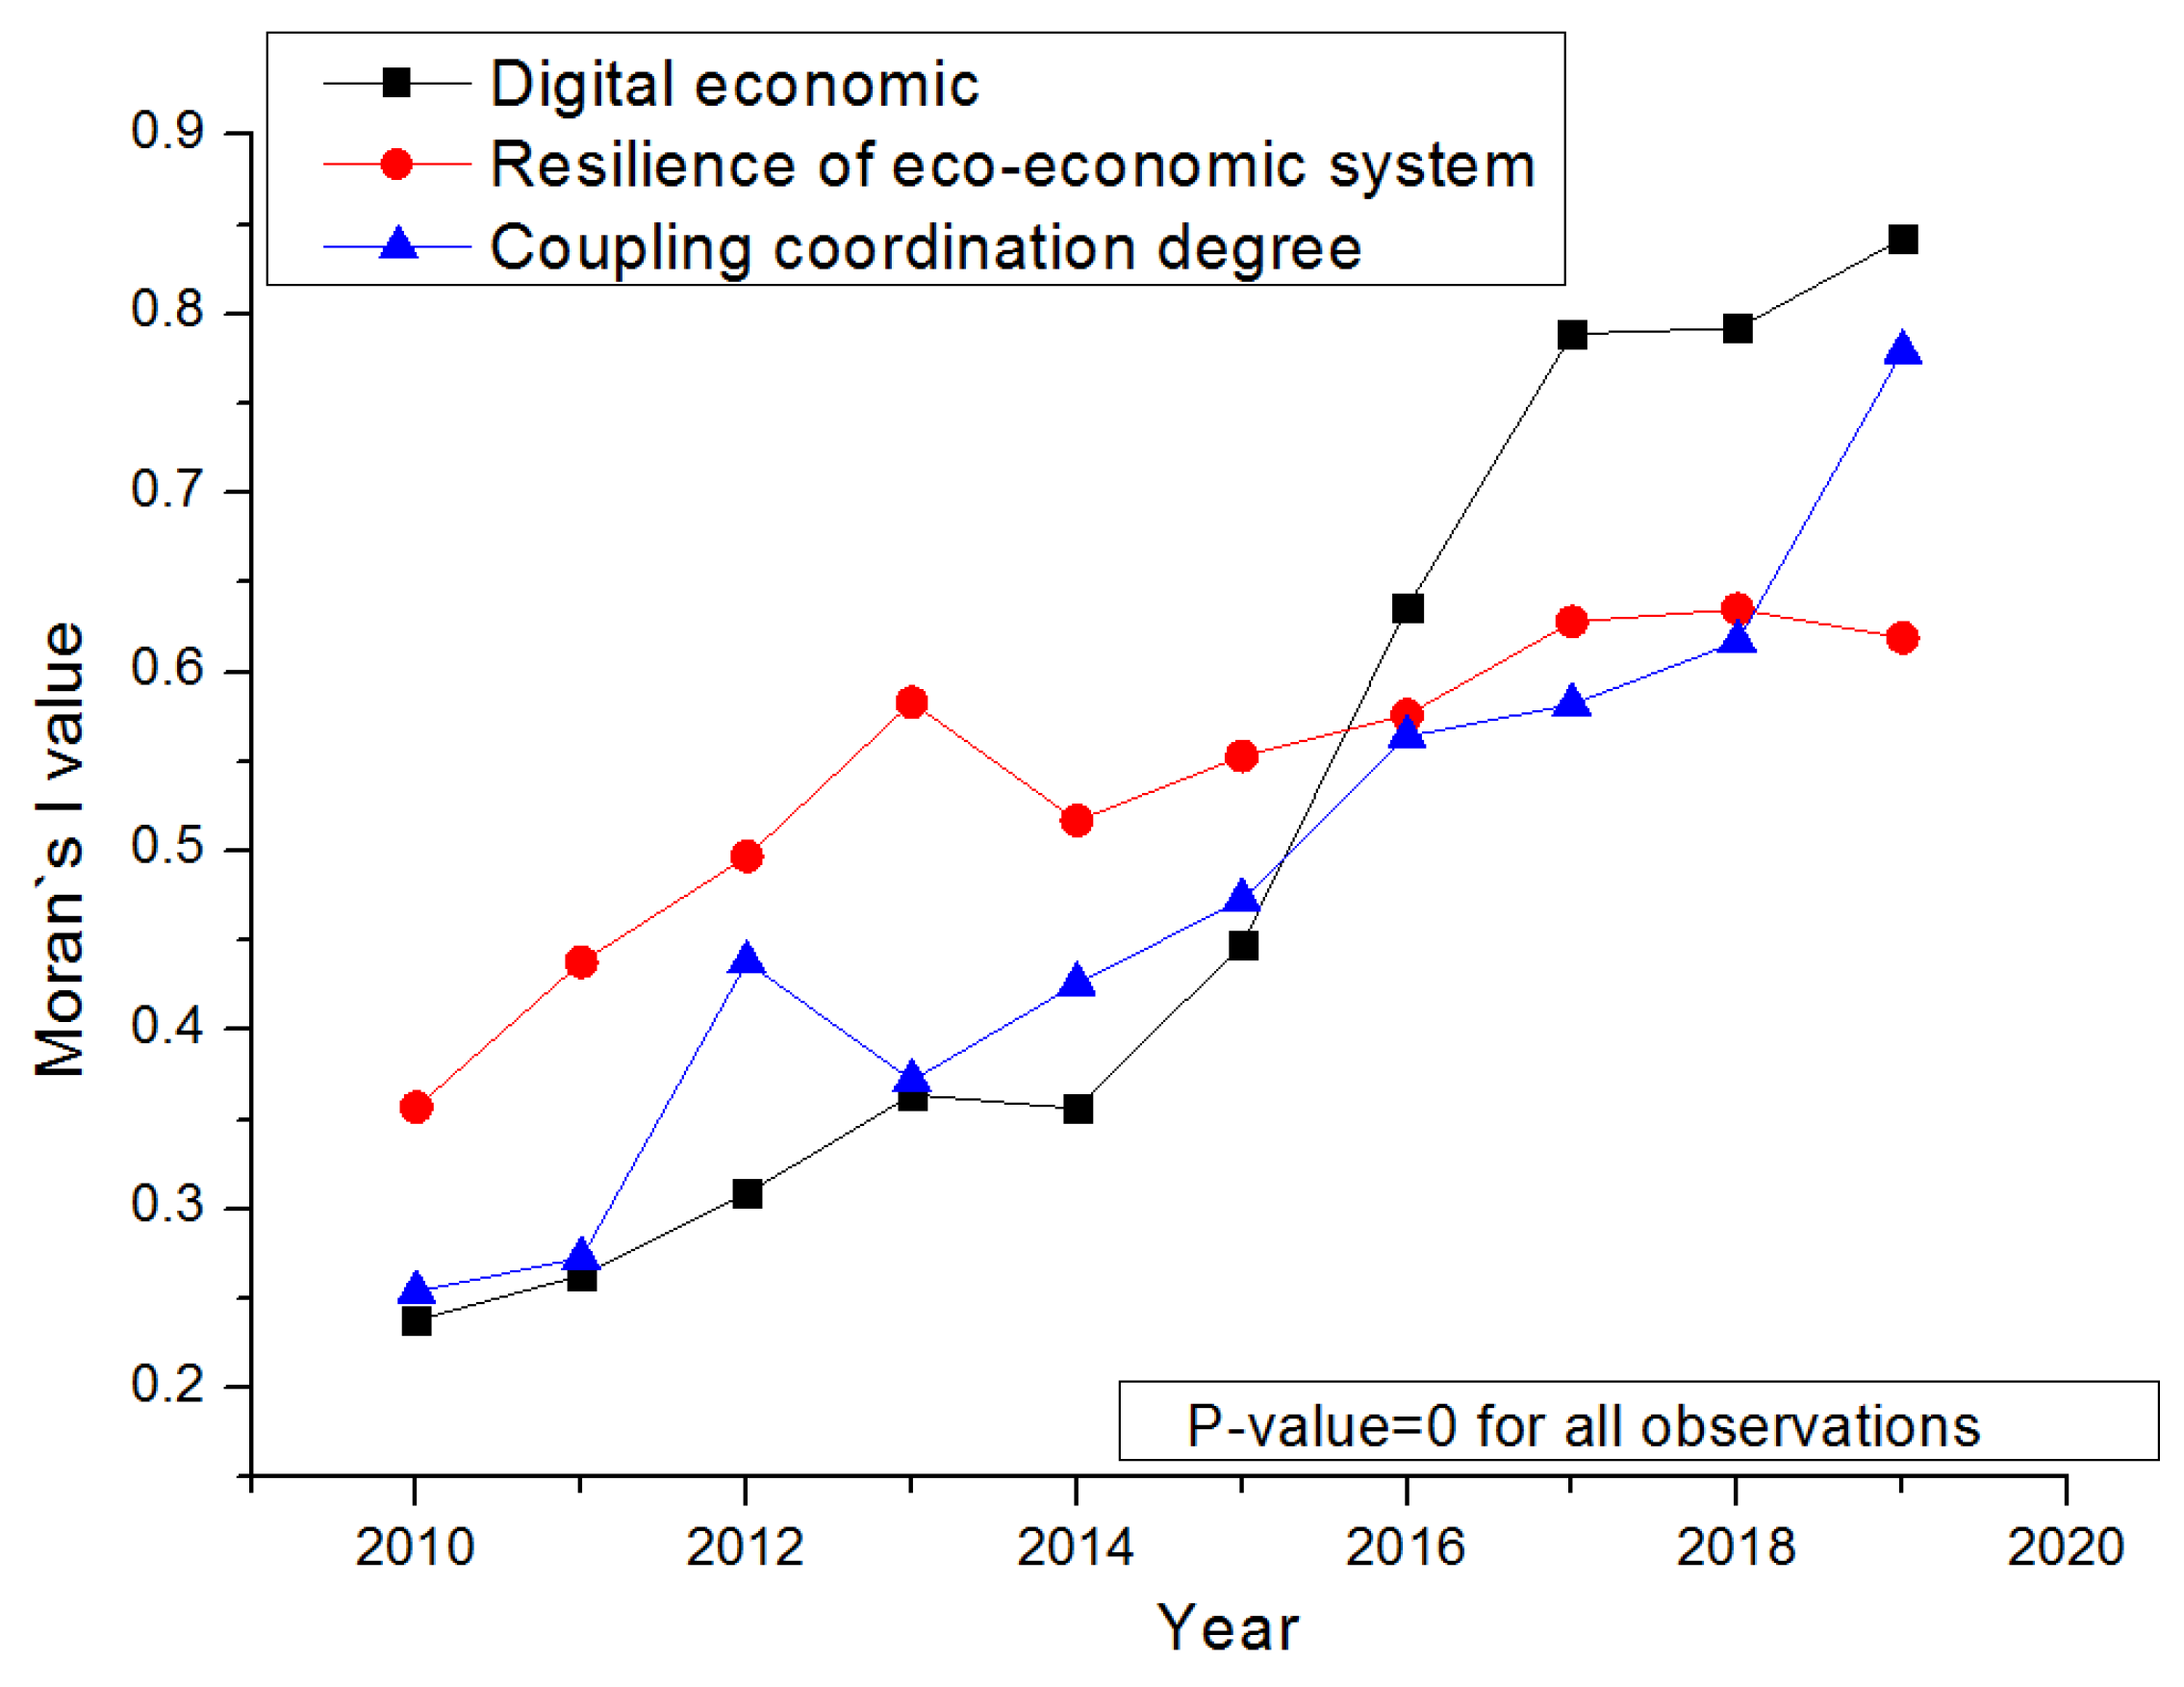
From Figure 4, it can be seen that: during 2010–2019, the level of digital economy and the urban resilience assessment index in the JJJ region as a whole exhibited a wavy upward trend, and time series features from both sides showed significant positive correlation. Additionally, the global index of digital economic development is better than the index of urban resilient development. In particular, it is divided into stages: high-velocity growth stage I (2010–2015) and medium-high-velocity growth stage II (2016–2019). The average values of the digital economic development index and the urban resilience development index are low, and the rate of growth is relatively rapid in the first stage. From 2010 to 2015, the growth rates of the digital economic index were 20%, 22.22%, 23.64%, 5.15%, and 11.89%, respectively. The resilient urban development index has a growth rate of 22.73%, 3.71%, 35.71%, 26.32%, and 33.33%, respectively, among others. Secondly, the rate of growth of both the digital economic development index and the urban resilient development index obviously slowed after 2016. Between 2015 and 2019, the growth rate of the digital economic index was 9.84%, 1.49%, and 5.82%, respectively, in the country. The urban resilience development index had growth rates of 26.44%, 17.27%, and 7.75%. Overall, the assessment index of digital economy and resilient urban development in the JJJ region is not perfect, and much progress remains to be made in achieving the coordinated development of the regional digital economy and urban resilience.
(2)
In the JJJ region, the degree of coupling coordination of the digital economy and the resilient urban development index showed a consistent upward trend overall, especially after 2015. From 2015 to 2019, the growth rate of coupling coordination degree was 12.30%, 8.15%, 4.68%, and 3.22%, respectively. Beijing, Tianjin, and Hebei showed similar time-series evolution rules across the entire development process. This study demonstrates that the interplay between digital economy and resilient urban development in JJJ is continually reinforced, and the degree of internal co-ordination between the two systems is progressively improved. Additionally, with their own attributes of high permeability and the deep integration of major issues in urban governance, construction, and development, they mutually promote each other and the tendency towards development is evident.
The process of developing and evolving the degree of coupling coordination can be divided into three stages. The first phase, from 2010 to 2014, lies between 0.201–0.288, which is at the slightly disequilibrium stage, indicating that there is little interaction between digital economy development and resilient urban development. At the same time, due to the low level of resilience development of urban eco-economic system, it is unable to provide the necessary environmental planning and industrial policies for the development of the digital economy. Both lack effective support and promotion. During the second phase, from 2015 to 2017, the JJJ region is in between 0.317–0.385, which indicates that the development of digital economy and urban resilience in the JJJ region is still in a state of flux. Matching the two sides in planning the digital economic environment and building industrial policy, the technical conditions for building urban resilience and the social development environment must be strengthened. During the third phase, from 2018 to 2019, the JJJ region lies between 0.403–0.416, which is in the primary coordination stage, indicating that the benign coupling and coordinated developmental situation that they favor one another was initially formed.

3.2. Analysis on the Spatial Disequilibrium of Their Development

3.2.1. Kernel Density Estimation Analysis

Because of differences in factor endowments and stages of development in different regions, it is possible that the measurement results and their respective trends with the passage of time are different. For this reason, in this paper, the kernel density estimation method of nonparametric estimation is used to analyze the differences in the dynamic evolution of digital economy and eco-economic system resilience assessment index and the degree of urban agglomeration coordination JJJ from the perspectives of distribution location, distribution shape, and distribution scalability.
Following the method of Gaussian kernel density estimation, Matlab software (MatlabR2022a) is used for kernel density estimation (see Figure 5, Figure 6 and Figure 7). The results show that, over the period 2010–2019, the core density curve shifted to the right, and the peak continued to decrease, showing a trend from “peak” to “flattening.” The curve shape softened, indicating that the development gap between cities in JJJ region gradually widened, and the convergence between cities decreased. Among them, the core density curve of digital economic evaluation index has the tendency to evolve to double peak, presenting the “M” double peak distribution. It shows that the development of digital economy in JJJ urban agglomeration is polarized, and there are obvious differences between regions. The core density curve of the resilience index of urban eco-economic system shows the evolution from “Twin Peaks Club” to “Multi-Peaks Club”. It shows that there are multipolarity and multilevel development trends. Additionally, with the passage of time, its peak is also more and more flat, and the toughness of the high-value area is gradually highlighted. The nuclear density curve of the coupling coordination degree keeps shifting to the right, the peak value keeps decreasing, the shape of the curve becomes moderate, and there is an evolution of the “bimodal club” to the “multi-modal club”, showing a polycentric development pattern. It shows that, over time, cities at the lower coordination stage and below gradually move to the middle and upper coordination stage. However, the coupling coordination gap of different regions has been enlarged because of the different speed and scale of the migration. In the future, it is urgent to optimize and coordinate the development of the digital economy and the resilience of urban eco-economic system so as to achieve balanced and sustainable development in the region.

3.2.2. Analysis of the Characteristics of Space-Time Transition

To further analyze the trend of dynamic spatial evolution of the degree of coupling coordination of the digital economy and the urban eco-economic system of 13 cities in the JJJ region, we used the natural segment method to dynamically visualize the degree of coupling coordination of the two developmental indices in the JJJ region in 2010, 2013, 2016, and 2019. Depending on the value of the degree of coupling coordination, it is drawn by the Arc-Gis10.2 software. (Figure 8).
According to Figure 8, overall, the coupling degree of digital economy index and resilience index of urban eco-economic system shows a certain spatial agglomeration distribution in space, and it shows an increasing trend and spatio-temporal pattern. Additionally, with the passage of time, it presents the characteristics of the distribution with Beijing and Tianjin as the nucleus, and there are large differences between different cities. Here, we perform a stepwise analysis, starting from the temporal and spatial dimensions.
(1)
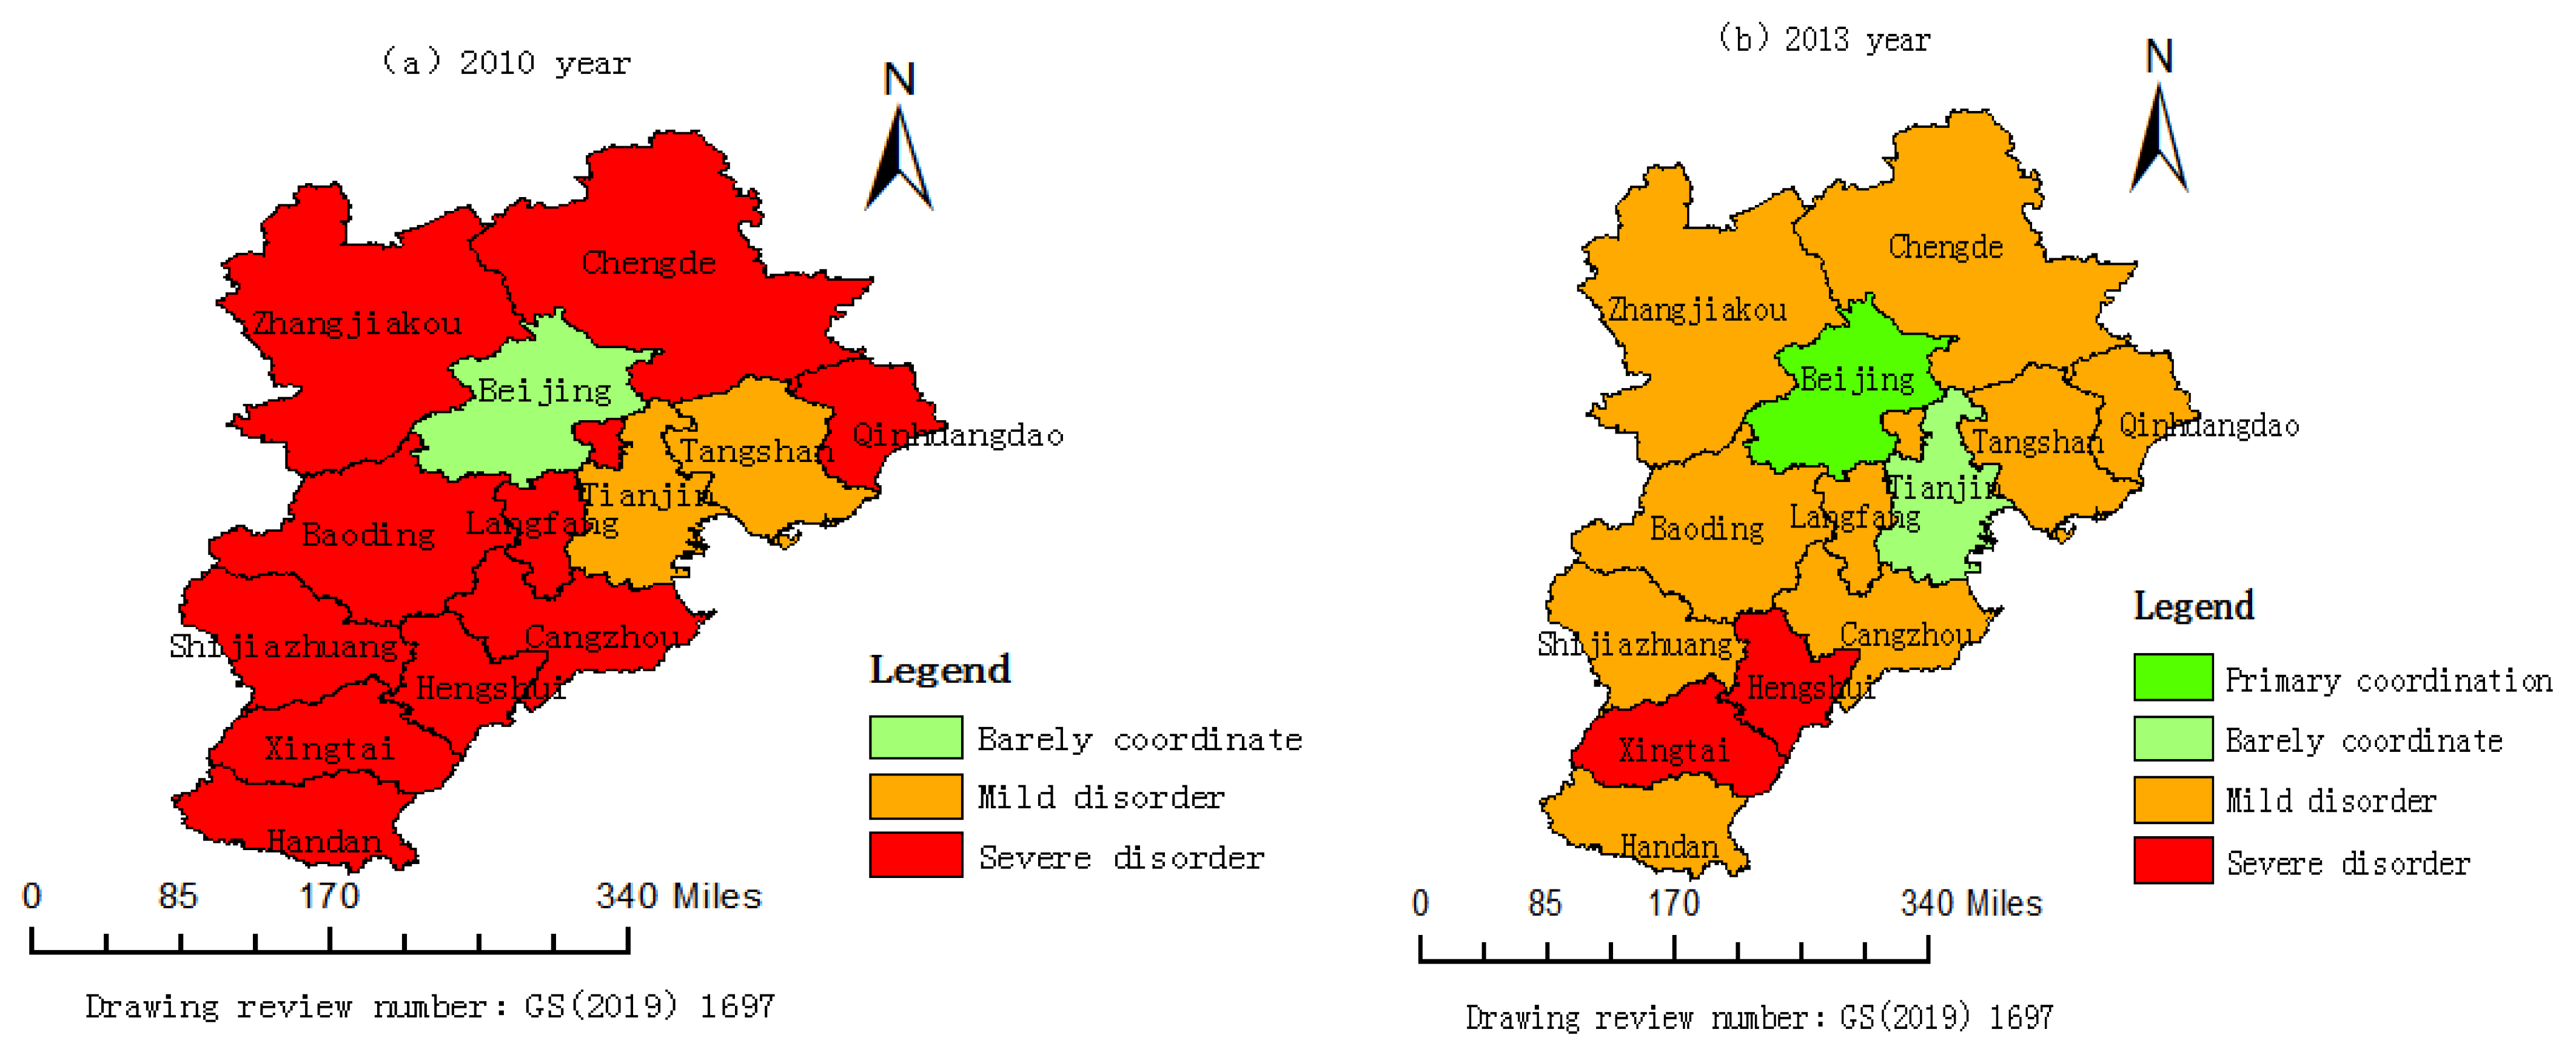
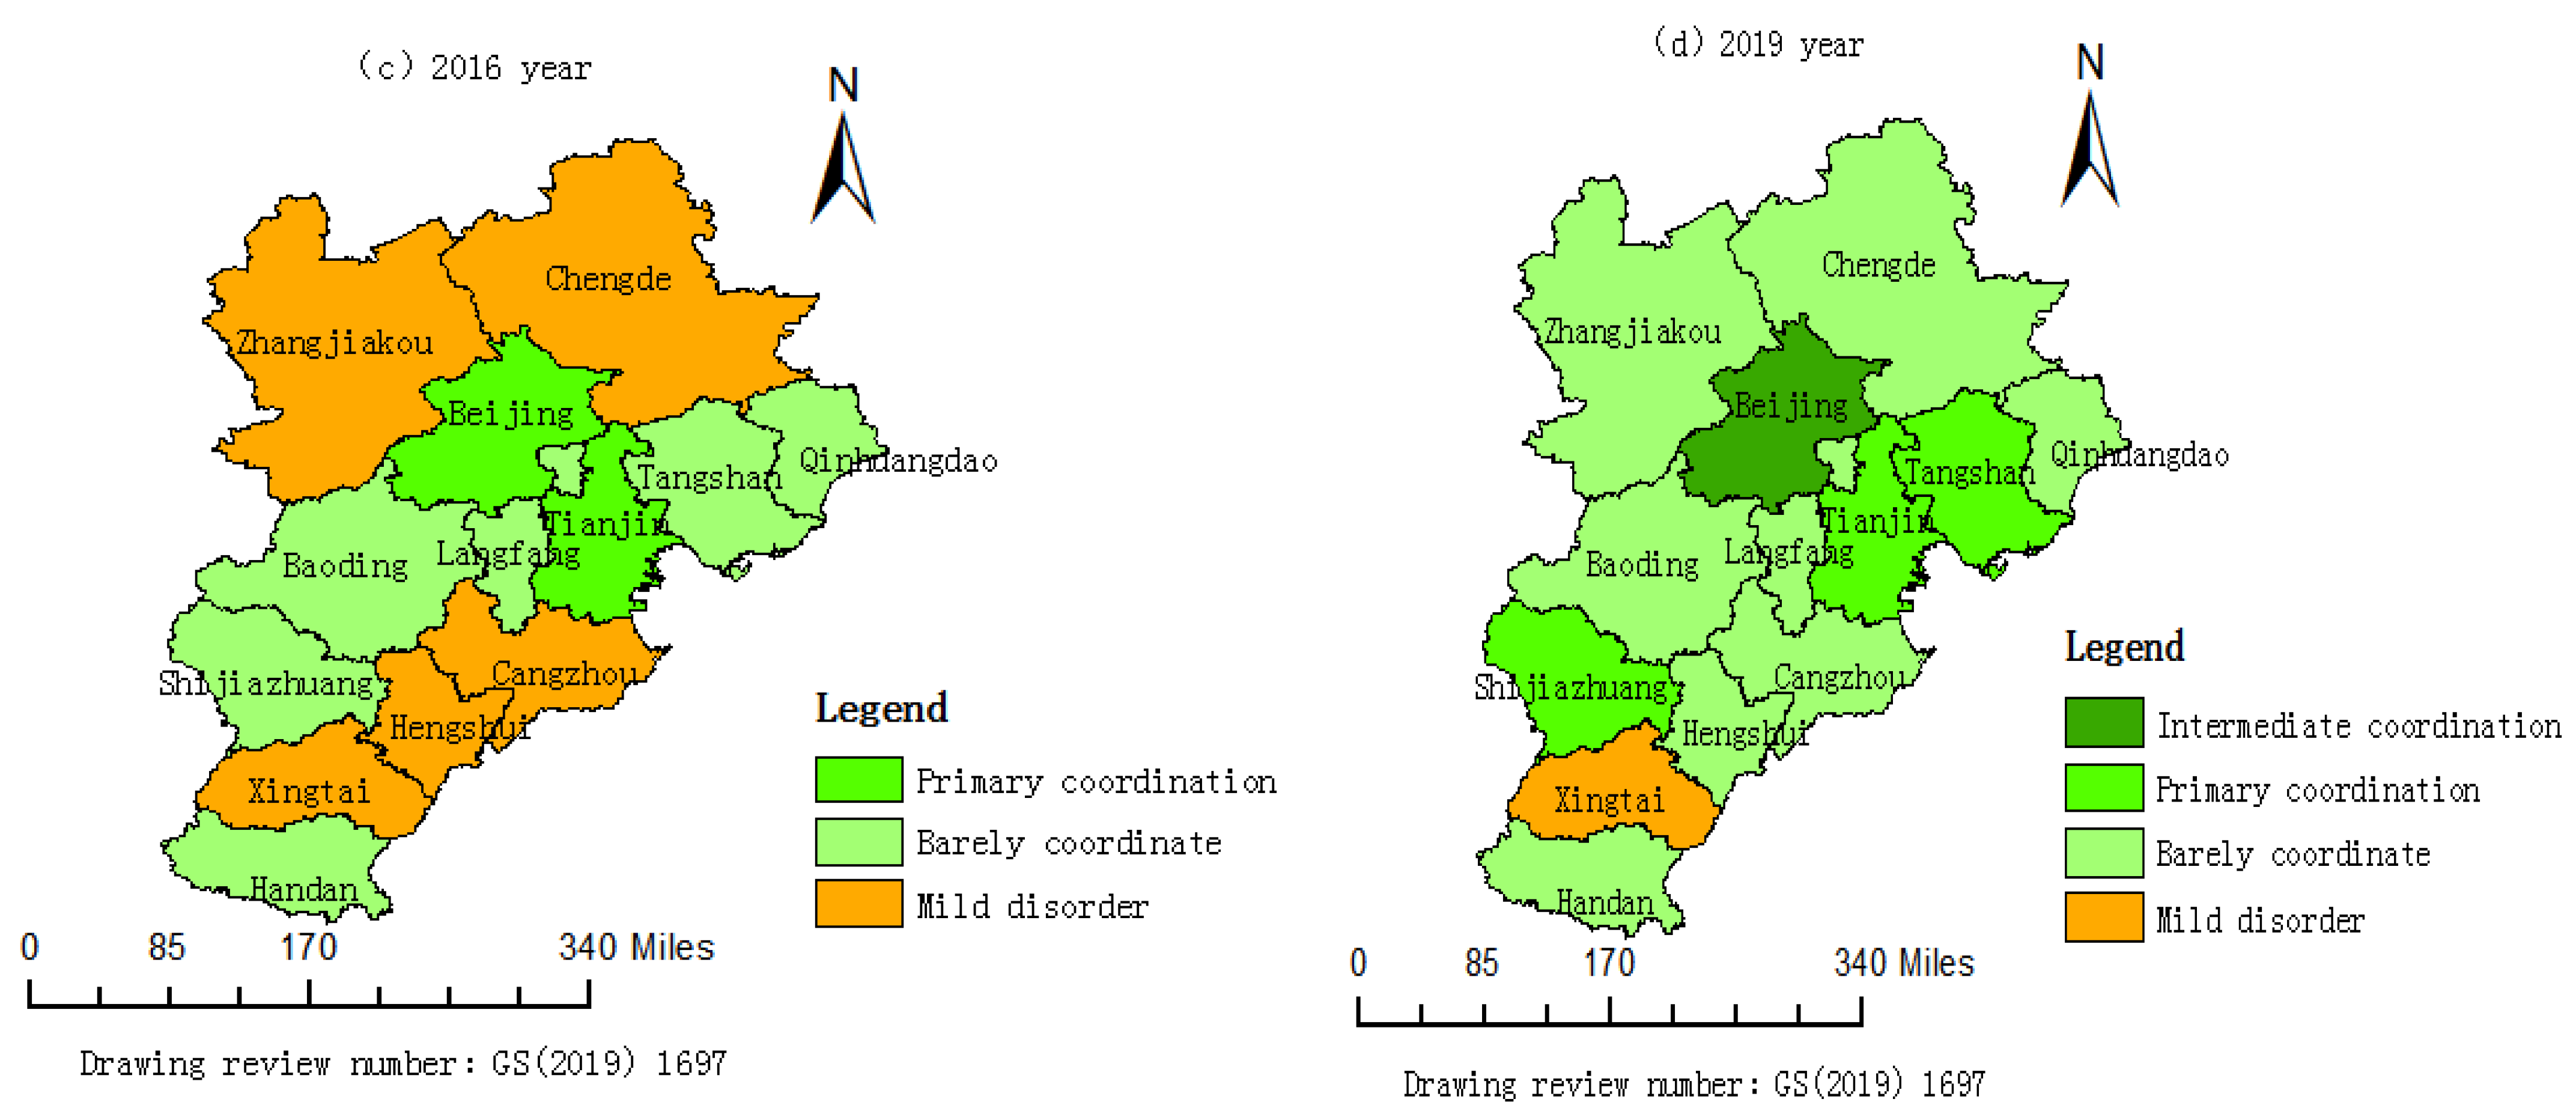
Middle and senior coordination stage: no cities in the JJJ region reached this stage during 2010, 2013, and 2016. In 2019, only Beijing reached the intermediate coupling coordination stage, but it has not yet reached the advanced coupling coordination development stage. Not only does this type of area incrementally increase the level of digital economy development and urban resilience, but it also forms a binding domain with neighboring domains that promote each other, and spillover effects, such as technological diffusion and factor flows, are evident. It, therefore, promotes the continuous improvement of the degree of coupling coordination of the digital economy and resilient urban development with one another, and it becomes the growth pole of regional development.
(2)
Primary coordination stage: there are no cities in 2010, only Beijing in 2013, Beijing and Tianjin in 2016, and Tianjin, Shijiazhuang, and Tangshan by 2019. On the whole, the number of cities in this stage increased by 30.77% from 2010 to 2019, and the distribution is relatively stable. In the future, cities at this stage should actively introduce experience, strengthen cross-regional cooperation, and enhance soft and hard power. Promoting the coordinated development of digital economy and urban resilience to a new height is important.
(3)
Barely coordination stage: only Beijing reached this stage in 2010, and Tianjin entered it in 2013. In 2016, the main cities at this stage are Baoding, Tangshan, Shijiazhuang, Qinhuangdao, Handan, and Langfang. By 2019, the main cities at this stage are Handan, Qinhuangdao, Hengshui, Baoding, Langfang, Cangzhou, Zhangjiakou, and Chengde. On the whole, the urban growth rate of JJJ region in this stage from 2010 to 2019 is 53.85%, and the spatial change in this type of area is relatively unstable, showing a relatively scattered distribution trend. At this stage, these kinds of cities should strengthen further optimization and construction, seize opportunities, and make a good start.
(4)
The stage of severe disorder and mild disorder: with the exception of Beijing, other cities in the JJJ region were at this stage in 2010. Except Beijing and Tianjin, every other cities in the JJJ region were at this stage in 2013. These results show that the polarization in the JJJ region from 2010 to 2013 is very severe, showing a tendency for unbalanced development. There are Xingtai, Zhangjiakou, Chengde, Cangzhou, and Hengshui in 2016 and only Xingtai in 2019. On the whole, the number of cities in JJJ region showed a downward trend from 2010 to 2019, by 84.62%, indicating that the level of coordinated development in JJJ region was increasing year by year from 2010 to 2019. The state is expected to dock the industry gradient transfer in the future, using digital economics to change the regional development model, as well as realizing corner overruns as quickly as possible.

3.3. Exploratory Spatial Data Analysis

3.3.1. Global Spatial Autocorrelation Analysis

Global spatial autocorrelation analysis was performed in order to further analyze the spatial agglomeration characteristics and distribution of the coupling coordination between regional digital economy and ecological economic system. The adjacency distance is used as the spatial evaluation weight to test and analyze the spatial autocorrelation of the development index and coordination index of JJJ urban agglomeration (Figure 9).
It shows that the global Moran’s I is greater than 0, and the Z value is greater than the critical value of confidence level (1.96). It shows that the spatial distribution of the coupling coordination degree of digital economy and urban eco-economic system resilience development index in JJJ region is not random, but it shows obvious positive spatial correlation, and the cities with high (or low) coupling coordination degree are often adjacent. From the perspective of the overall evolution trend of Moran’s I, it roughly shows an upward trend of “N” fluctuation. It rose from 0.254 in 2010 to 0.438 in 2012, then it decreased to 0.426 in 2014, and then it rose to 0.779 in 2019, indicating that, with the evolution of time, the spatial autocorrelation of the coupling coordination degree of digital economy and urban eco-economic system resilience development index in JJJ region gradually increases in fluctuations.

3.3.2. Local Spatial Autocorrelation Analysis

2013, 2015, 2017, and 2019 are chosen as temporal dimensions by the natural breakpoint method. According to Formula (8), the spatial agglomeration types of digital economy and urban resilience of 13 cities in JJJ region are divided into four agglomeration types: (HH), (LH), (LL), and (HL) agglomeration area. Use ArcGIS and GeoDa software (GeoDa-1.14.0.0) to derive the LISA agglomeration map (Figure 10) to show the state of agglomeration and the spatio-temporal distribution pattern of thirteen cities.
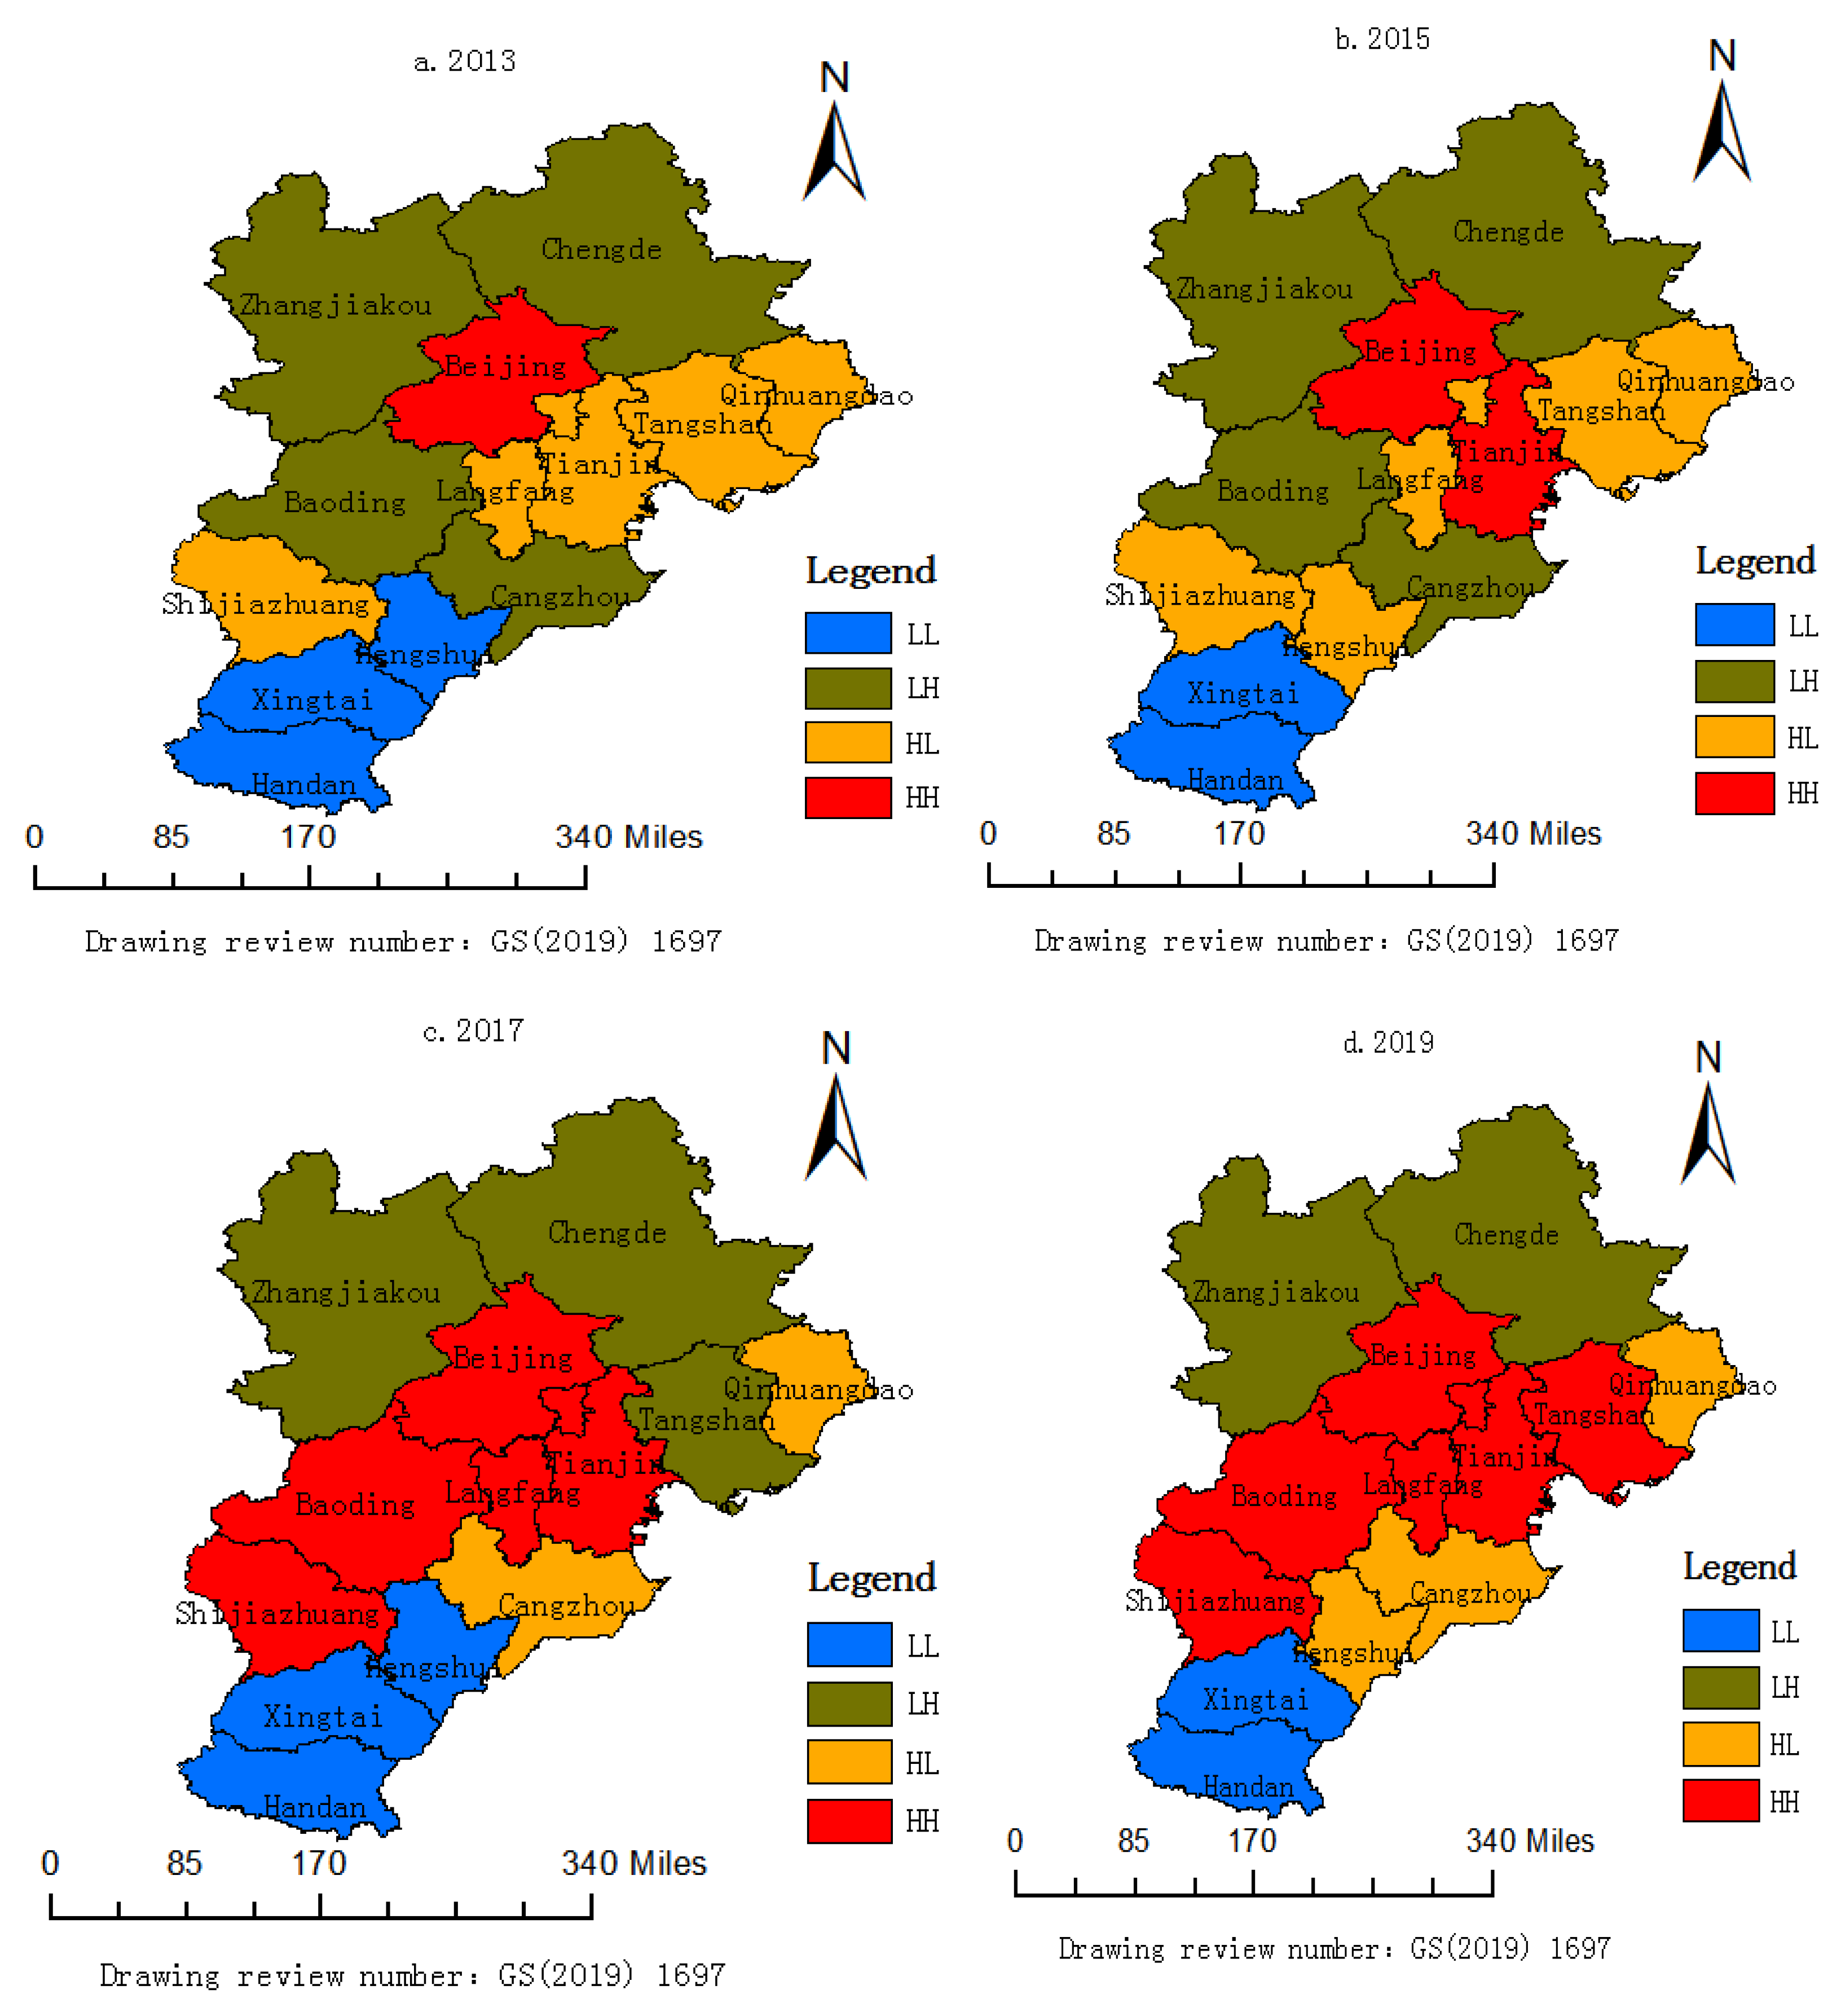
  • (HH): As can be seen in Figure 10, only Beijing is located in this region as of 2013. Beijing, Tianjin, Langfang, Baoding, Shijiazhuang, and Tangshan are located in this region in 2019. Overall, this type of area gradually expanded, and the increase evidently reached 38.46%, and the distribution of spatial agglomeration tends to be more concentrated. Not only does this type of area incrementally increase the level of digital economy development and urban resilience, but it also forms a binding domain with neighboring domains that promote each other, and spillover effects, such as technological diffusion and factor flows, are evident.
  • (LH): In 2013, there were mainly four areas in Chengde, Zhangjiakou, Baoding, and Cangzhou in the district, and, by 2019, there were mainly two areas in Chengde and Zhangjiakou in the district. Overall, cities within the district declined by 15.38% between 2010 and 2019, with a relatively stable distribution range, and there was a low level of coordinated development in this region.
  • (HL): In 2013, Tianjin, Langfang, Tangshan, Shijiazhuang, and Qinhuangdao were the main districts in the region. In 2019, Cangzhou, Qinhuangdao, and Hengshui were the main districts in the region. Overall, the extent of this type of zone in JJJ decreased by 15.38% between 2010 and 2019, and area type was relatively unstable with respect to spatial change, showing a relatively dispersed distribution pattern.
  • (LL): There are three main areas in this area: Xingtai, Hengshui, and Handan in 2013. In 2019, there were Handan and Xingtai. Overall, the extent of the agglomeration zone shows a decreasing trend from 2010 to 2019. These results show that the level of coordinated development of the digital economy and urban eco-economic system in the JJJ region and the radiation effect of Beijing and Tianjin as the core is getting progressively better.

3.4. Driving Factors Analysis

Based on tests that there is some geo-spatial dependence in the coordinated development of urban agglomerations in JJJ, since it is hard for the traditional econometric model to include spatial characteristics in it [3,6], we choose the spatial econometric model.
  • Choice of influential factors
This paper combines the existing research results, as well as the current situation of uneven economic development, uneven degree of openness, uneven human capital, and urgent need to improve the development environment in JJJ region. This study summarizes seven major influencing factors. Of these, the level of economic development is the foundation [2,3,6], the operational environment of science and technology is the driving force [11,16,60], and the direction of the governmental system is the guarantee [69,78,85]. See Table 4.
2.
Analysis of influencing factors
In accordance with the (9)–(11) model and with the help of Stata14.0, this paper performs a spatial econometric regression analysis on the driving factors for the degree of coupling coordination of the digital economy and the development of urban resilience in the JJJ region. Given the spatial heterogeneity of various cities in China, the dual temporal and spatial fixed-effect model is chosen. When combined with Ansilin’s judgment criterion, through the comparison of the results of the adjusted R2 and maximum likelihood estimation, we take the model (SDM) as the reference model. The landmark model uses the spatial adjacency weight matrix and, therefore, does not account for the spatial correlation of geographic distance and economic activity. For this reason, the inverse distance matrix (D) and the economic distance matrix (G) are constructed again to test the robustness of the benchmark model. The regression results (Table 5) show that the estimation results for the SDM and SEM models have not changed significantly. Only the spatial lag term in the model (SAR) becomes insignificant, but the coefficient symbols for the regressors have not changed, indicating that the results of estimating the benchmark model are robust.
According to the statistical results (Table 5), there are differences in the regression coefficient and spatial lag coefficient of the seven influential factors under three different spatial weight matrices. Among them, the PGDP, INS, INTERNET, and STU regression coefficients, as well as the spatial lag coefficients, are all positive and have passed the test of significance. They show that they have a positive effect on the coupling and coordinated development of the digital economy and the urban eco-economic system in this city and neighboring cities, and there is a clear positive spatial spillover effect. Note that the regression coefficients for FDI and ER are significant, while the spatial lag coefficients are insignificant, indicating that they have a positive effect on the city, but they will restrict the improvement in the degree of coupling coordination of the two neighboring cities. Neither the FINA regression coefficient, nor the spatial lag coefficient, passed significance testing, indicating that the level of financial development was not conducive to the level of coordinated development of the digital economy and the resilience of urban eco-economic systems in this city and its surrounding areas.

4. Discussion

4.1. Theoretical Value

The characteristics of the spatio-temporal evolution and the driving forces for the coupled and coordinated development of the digital economy and urban eco-economic system found in this paper are of referential importance to other countries and regions [93,94,95,96]. The findings of this paper have some reference value for the digital economy and for green development initiatives in many countries and regions. Analysis of the characteristics of spatiotemporal evolution suggests that there is a need to balance resilient coupling and coordinated development of the digital economy and urban eco-systems, as well as to fairly distribute the development resources of digital economy, so that backward areas can also benefit from the high-quality economic growth brought about by the digital economy. This significant spatial spillover effect demonstrates that, in order for development and growth to occur, it is important that cities in underdeveloped areas learn from the experience of resilient development and management of the digital economy and eco-economic system in neighboring cities.
Ultimately, depending on the path of influence, the government should improve the infrastructure construction of the urban eco-economic system and the development of the digital economy, and it should consolidate the rationalization and upgrading basis of industrial structure, consider the digital economy as the key starting point for upgrading industrial structure, and support companies in improving the innovation level of digital technology. We will constantly accelerate the exploration of new scenes and new models for the coordinated development of the urban digital economy and eco-economic system. The results of this study provide a new perspective for related research in the area of urban digital economy and eco-system resilience development under the “dual carbon” objective in China.

4.2. Practical Value

In practice, this paper comprehensively uses GIS spatial analysis technology, ESDA, nuclear density test, spatial metrology and other tools to reveal the spatio-temporal evolution pattern and driving mechanism of the coupled and coordinated development of JJJ urban agglomeration system. The purpose of this paper is to describe the spatio-temporal difference and spatial effect of the coupling and coordinated development of JJJ urban agglomeration system. An attempt is made to make differentiated policy recommendations with a view to exploring a widely replicable and accessible approach to promote the sustainable development of cities throughout the country and even in other developing countries.
According to the matrix of Boston Consulting Group (BCG), using the idea of this model for reference [97], it corresponds to the four spatial agglomeration types of JJJ urban agglomeration: “H-H, L-H, L-L, L-H”. JJJ urban agglomeration should look for different ways to enhance the potential of urban development, according to its own resource endowment, development orientation, and radiation-driven ability. We will promote organic convergence and coordinated development of the innovation chain, industrial chain, and value chain in the region. H-H: this type of area should continue to maintain a good momentum of development and give full play to the advantages of digital economy, technology, and regional policies, such as the internet, big data, and artificial intelligence. Increase investment in research and development, improve the level of urban informatization, and better promote the construction and development of urban eco-economic system resilience. At the same time, we should give full play to the leading role of radiation and agglomeration economic effects of central cities and eliminate institutional barriers, such as administrative segmentation and market segmentation. Promote knowledge and technology spillover among urban agglomerations, orderly flow of factors of production and innovation resources, and improve the efficiency of resource allocation in urban agglomerations. L-L: the state should further increase support for this type of cities, dock industrial gradient transfer, narrow the digital divide gap, use digital economy and technology to change the regional development model, and realize corner overtaking as soon as possible. H-L: the coupling and coordination level of digital economy and urban eco-economic system in this type of area has development advantages compared with the surrounding areas, and cross-regional cooperation and exchanges should be actively carried out with the surrounding areas. Promote the overall improvement of the coupling and coordinated development level of the surrounding urban system in a larger space through factor spillover and development demonstration. L-H: the level of coordinated development of digital economy and urban eco-economic system in this kind of region is low, and due to the flow of capital, talent, and other factors to urban areas with a high level of development, these factors result in serious polarization problems. It is necessary for the government to properly restrain the resource siphon of the core cities to the surrounding cities by means of spatial planning and industrial guidance, strengthen the overall regional coordination, and avoid excessive gaps within the urban agglomeration. In the future, this type of city should actively undertake the spillover of innovative resources in core cities, strengthen the concept of green development, and avoid becoming a haven for pollution.
Attach great importance to the spatial correlation and non-equilibrium characteristics of the coordinated development of system coupling and give full play to the spatial spillover effect. Build a cross-regional platform for digital technology cooperation and establish a mechanism for sharing resources and technology. We will optimize the spatial structure and spatial governance of urban agglomerations in all directions, and we will form a unified, open, coordinated, and orderly spatial pattern of regional integration. Spatial structure and spatial pattern are not only the important determinants of urban agglomeration development toughness and quality, but they are also the key to effectively alleviate the contradiction between resource and environmental constraints and economic development efficiency of urban agglomeration. We will strengthen the comprehensive management of the ecological environment of urban agglomeration and the intensive utilization of resource elements. Improve the resource and environmental carrying capacity and comprehensive carrying capacity of urban agglomeration and enhance the development toughness and sustainable development ability of urban agglomeration.

4.3. Recommendations for Policymakers

Drawing on research on digital economy and the urban eco-economic system in the JJJ region, we find that the development of the digital economy and the urban eco-economic system promotes each other, co-creates value, and realizes each other. Based on the empirical analysis, we offer the following suggestions, which may have some inspiration for policy-makers.
(1)
At the national level, regional digital economy planning and resilience of urban eco-system coupling collaborative development strategy should be followed, as well as following difference law, in order to achieve collaborative symbiotic development models. This is because of spatial differences and heterogeneity in resource endowments in different cities and because the effects of exogenous factors on different cities are different. As a result, the central government should adopt targeted and differentiated policies and actions depending on local conditions in order to achieve the transformation of urban planning and governance from a unified “multi-city one policy” to a flexible “one city, one policy”. From a governmental perspective, we should create an environment conducive to fair competition and institutional safeguards to guide banks in improving the funding system for the development of relevant topics, and we should form a long-term sharing mechanism for efficient allocation of financial resources.
(2)
The industrial structure should be actively adjusted and the positive effects of industrial structure upgrading, and rationalization on the development of both should be given full play. Additionally, we should gradually realize the high quality digital development of “economic ecology” and “ecological economization”. The resilience early warning system of the urban economic-social-ecological environment system is built on the attributes of the digital economy that are driven by the scene, data, and platform. We should incorporate the benefits of the city’s dynamic and visual big data development platform in diagnosing the vulnerability of the urban eco-system. These changes should be based on quantitative data, such as vulnerability and disaster carrying capacity. These processes implement the dynamic feedback mechanism of the “data governance” system and the dynamic adjustment mechanism, and they improve the resilience level of the urban eco-economic system.
(3)
Given the important role that digital economy development plays in fostering the resilience of regional eco-systems, in particular, there is a need for increased investment in the development of digital economies, including the promotion of 5G, the internet of things, cloud computing, big data, artificial intelligence, blockchain, and other new generation of information and communication technologies in order to speed up innovative breakthroughs and promote the deep integration of the digital economy and the real economy. Making digital economics an important foundation for enhancing economic resilience is important.
(4)
On the basis of regional differences and the existence of spatial spillover effects from the coordinated development of the digital economy and the resilience coupling of the eco-economic system, these changes should be made. In order to reduce the digital divide between regions, the government should implement a support policy that is appropriately biased towards backward and peripheral cities. Not only does it help to enhance the positive effect of the digital economic development of backward cities on the resiliency of eco-economic systems, it also helps to foster the resilience of the eco-economic system of the central cities.

5. Conclusions

Based on the coupling effect, this paper provides a thorough analysis of the characteristics of spatiotemporal evolution, the mechanism of interaction, spatial spillover effects, and driving factors from the perspectives of economics, society, ecology, and so on. Through an empirical analysis we make the following important discoveries:
(1)
From 2010 to 2019, the overall level of digital economy and urban eco-economic system resilience evaluation index in JJJ region showed a wavy upward trend, which showed a significant positive correlation. Additionally, the digital economic development index as a whole is better than the urban eco-economic system resilience development index. However, the development of the two should be a coordinated development process. Digital economy is a new driving force and new engine for the resilient construction and development of urban eco-economic system. This means that digital economy plays a more and more important role in promoting the resilient construction of urban eco-economic system.
(2)
The coupled coordination model is used to quantitatively analyze the coupling coordination degree between digital economic index and urban eco-economic system resilience index. The results show that the role of mutual promotion and coordination between them has been continuously strengthened in 2010–2019. The degree of internal coordination between the two systems has gradually increased, and the degree of coupling coordination has increased steadily, especially after 2015. By 2019, the JJJ region has been in the primary coupling coordination stage. This shows that the benign coupling and coordinated development situation of the mutual promotion of digital economy and urban eco-economic system in JJJ region has been initially formed, but it has not yet reached the ideal stage of middle-and high-level coupling and coordination.
(3)
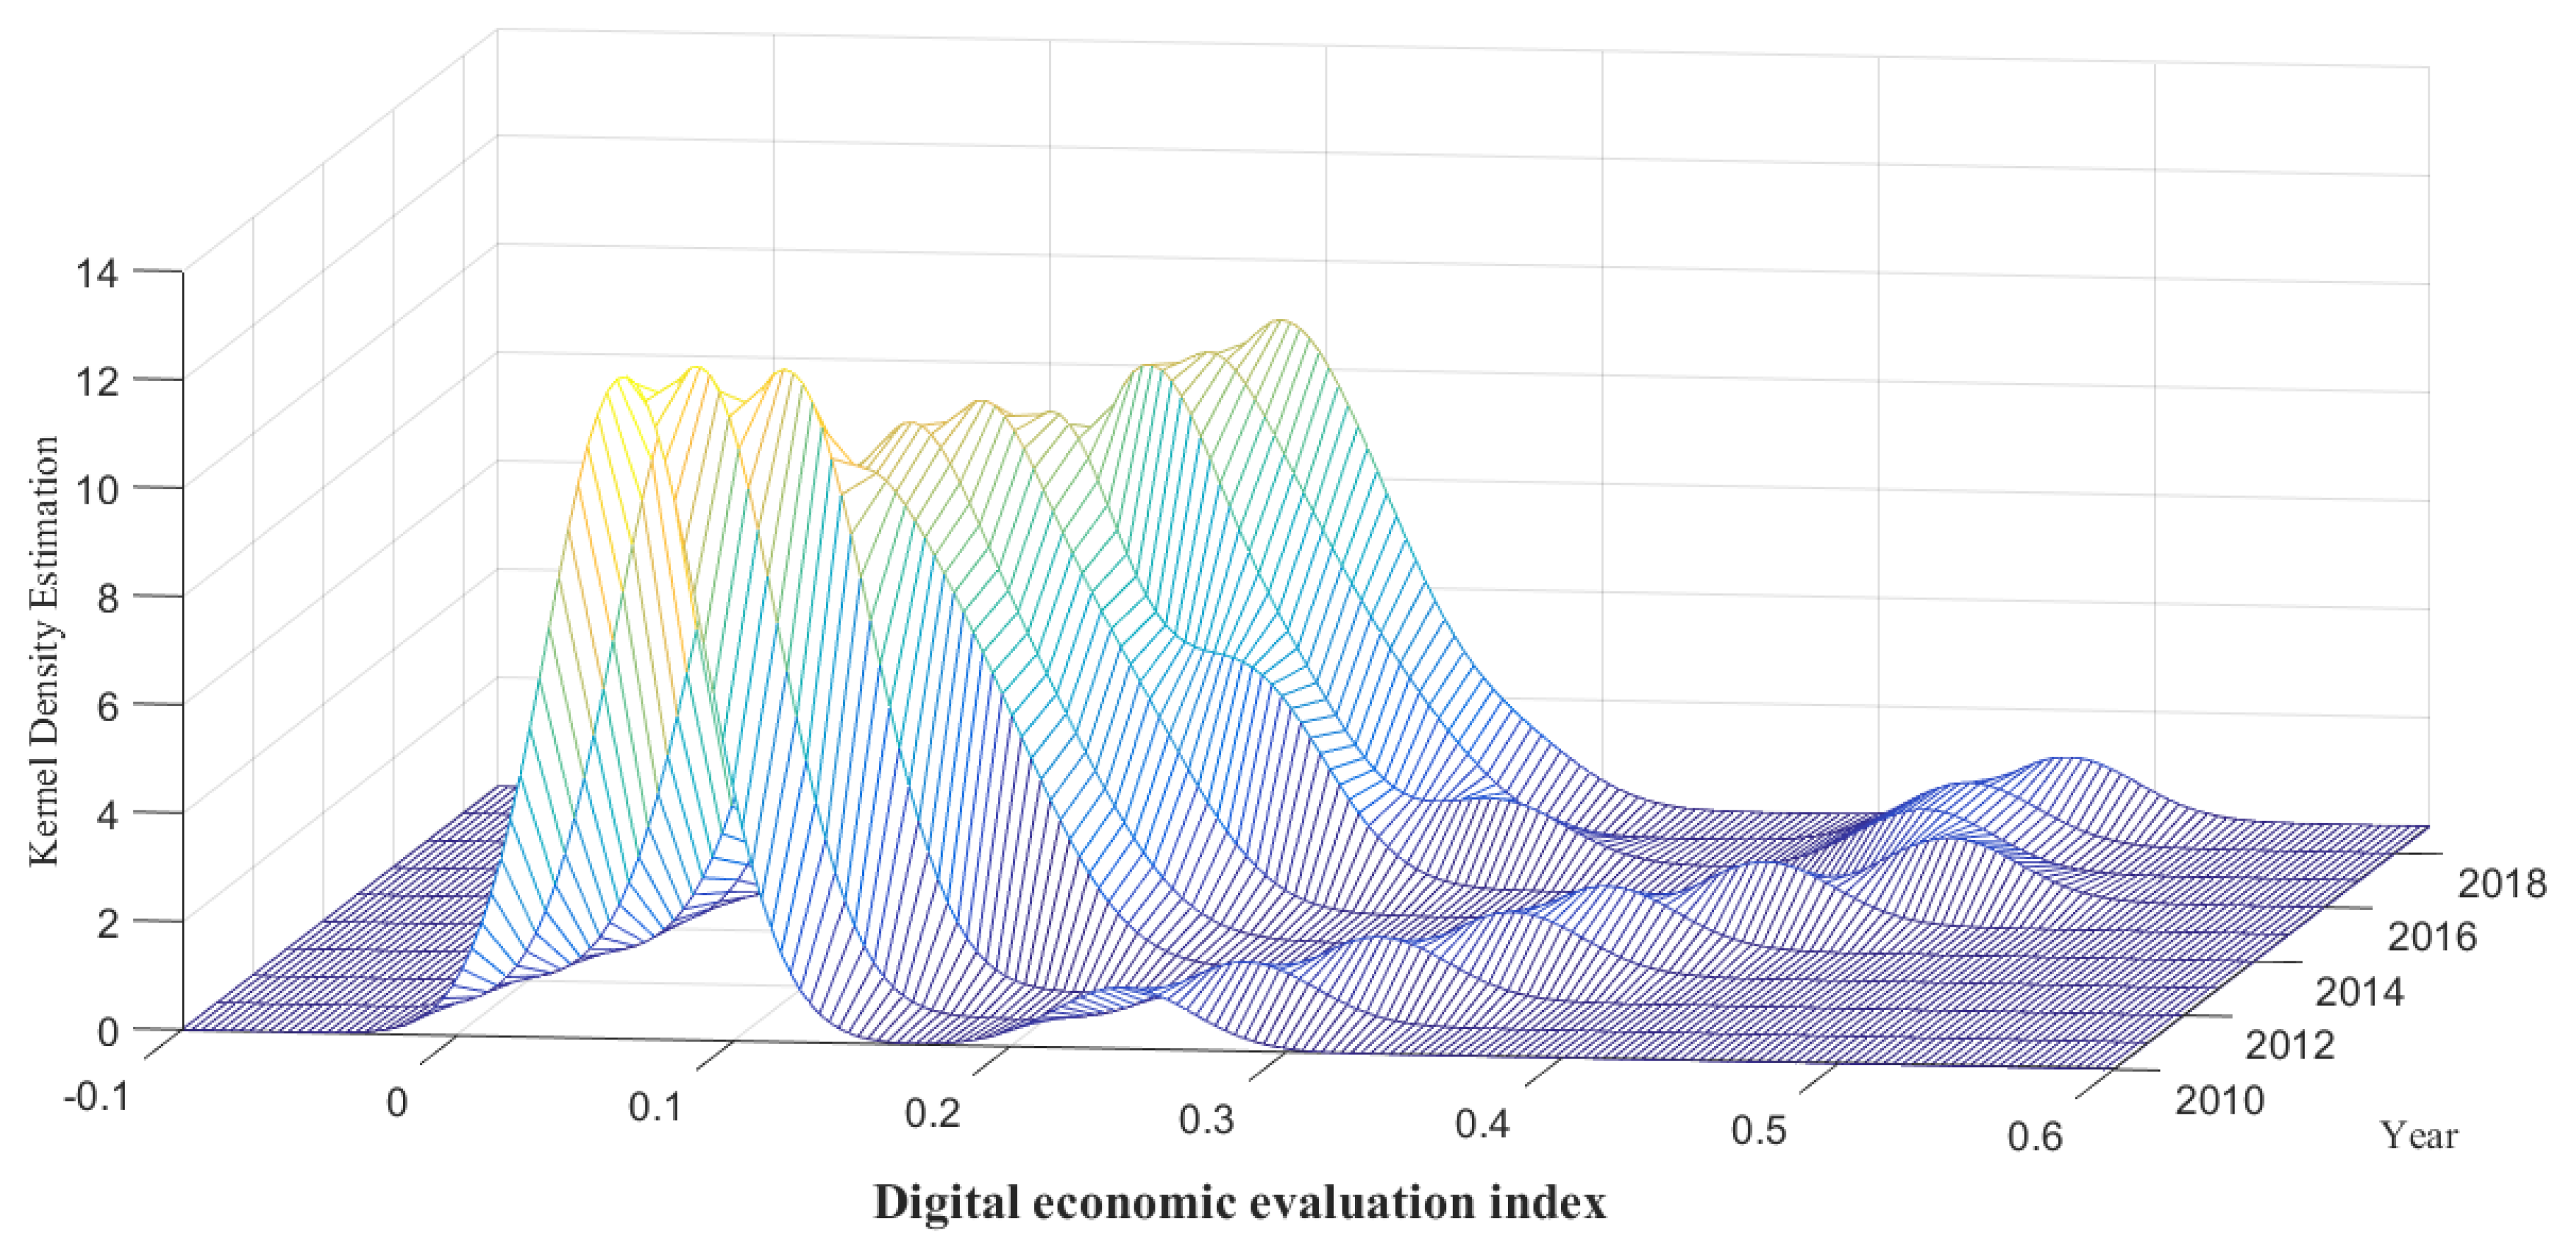
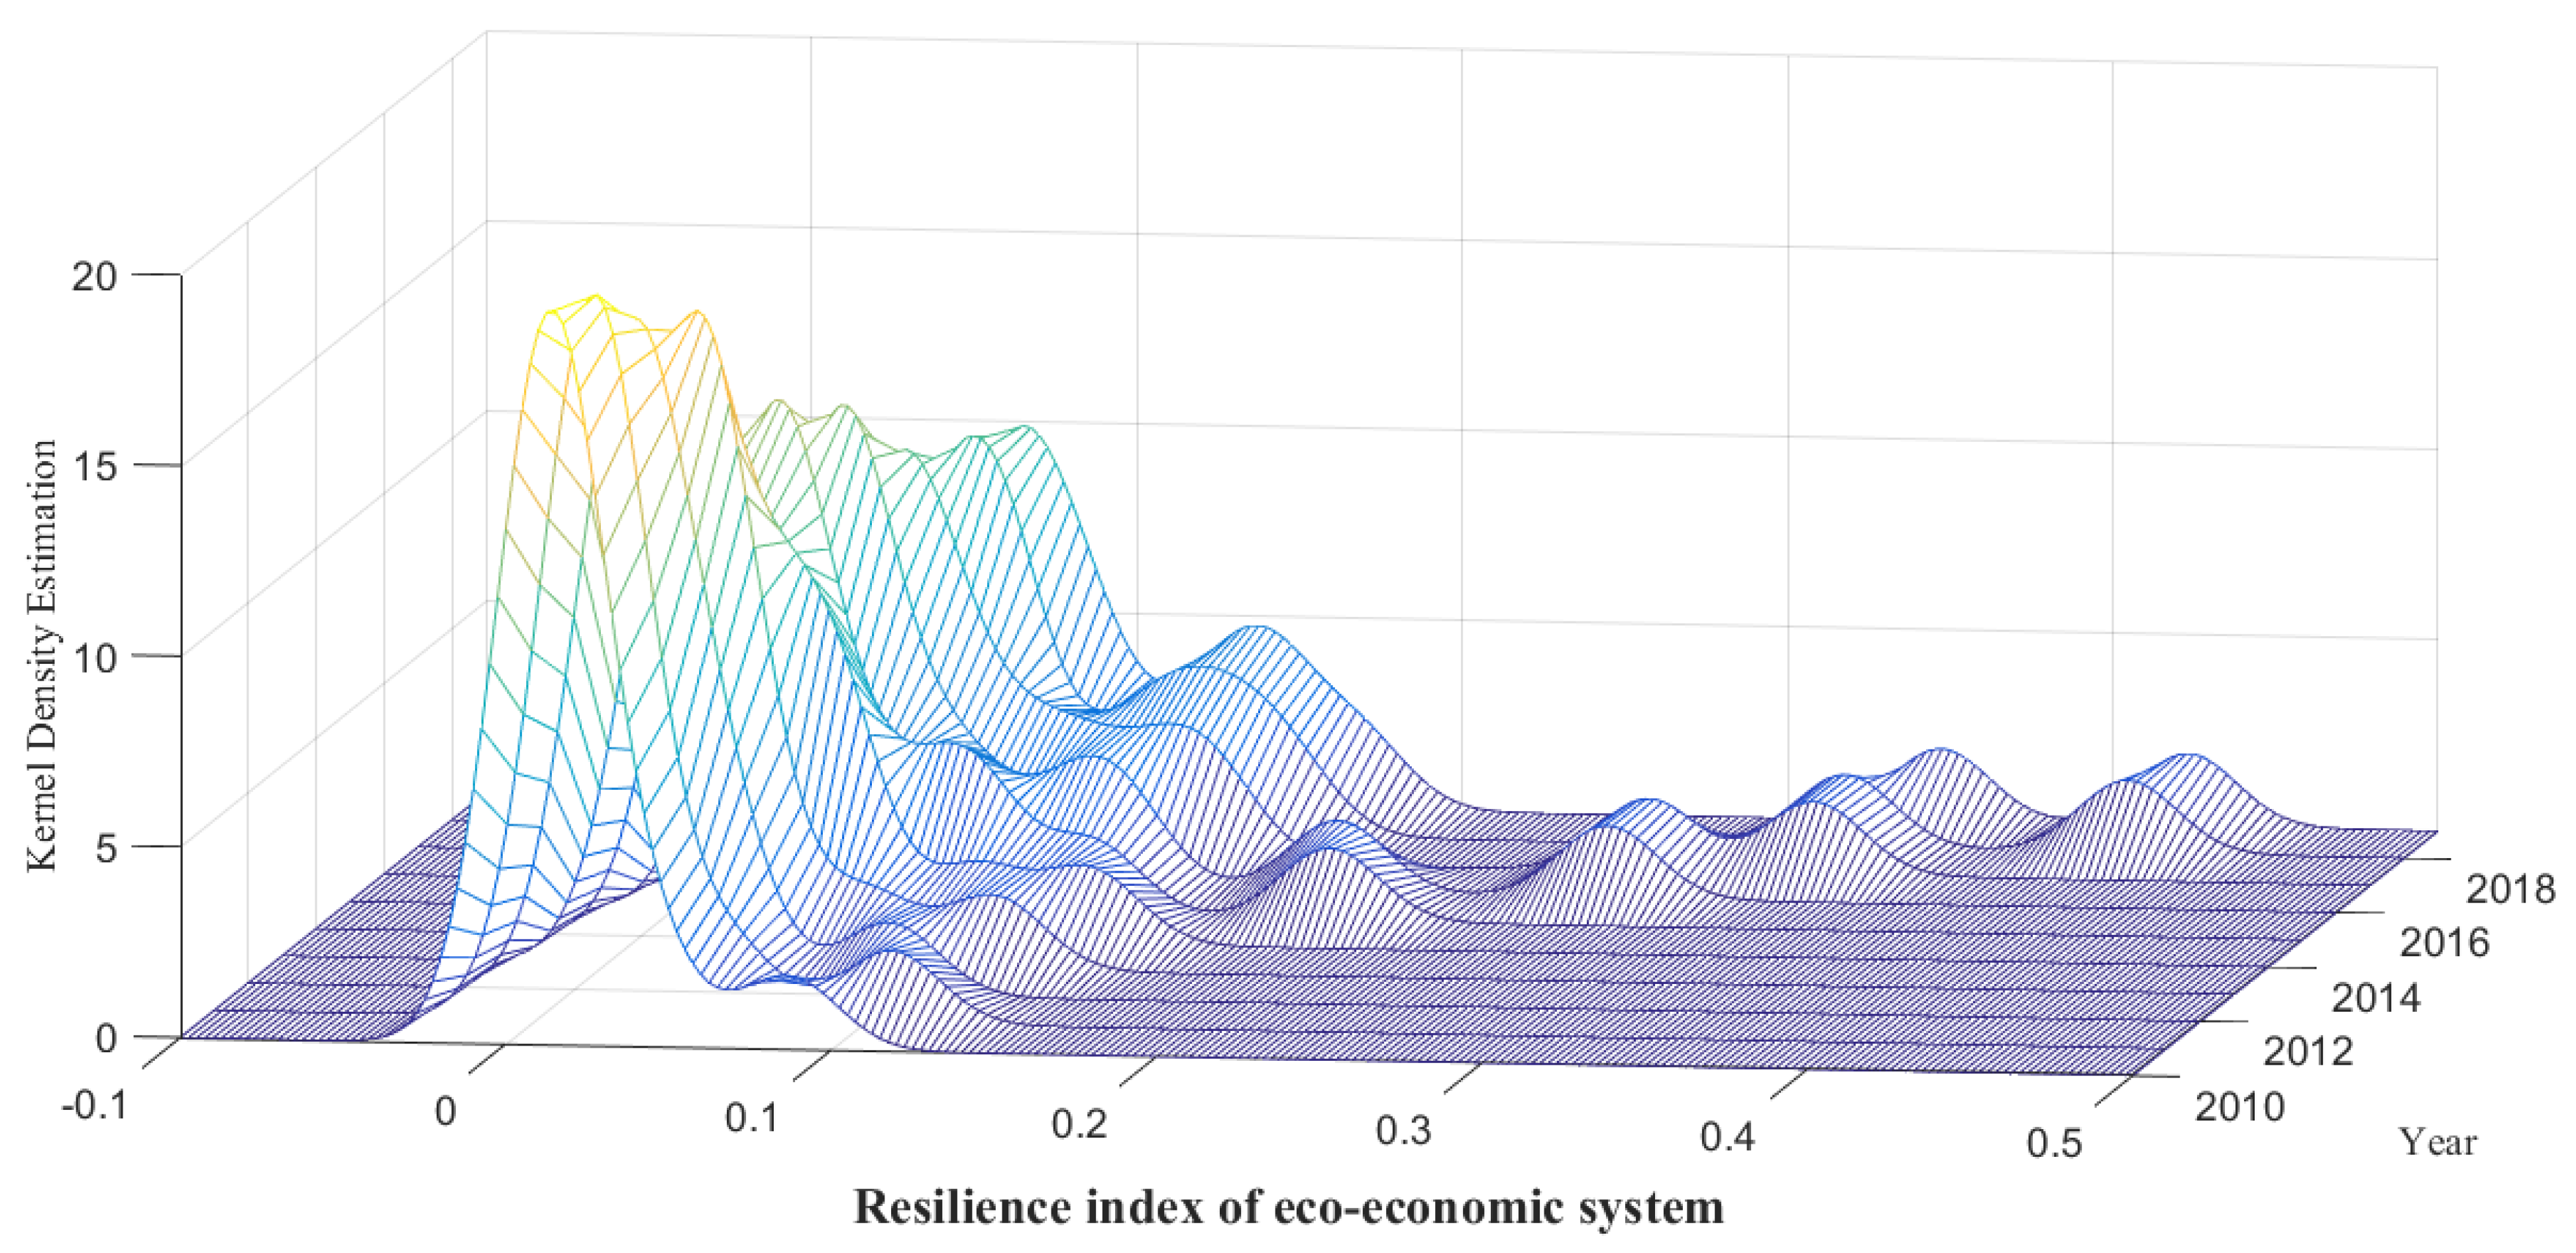
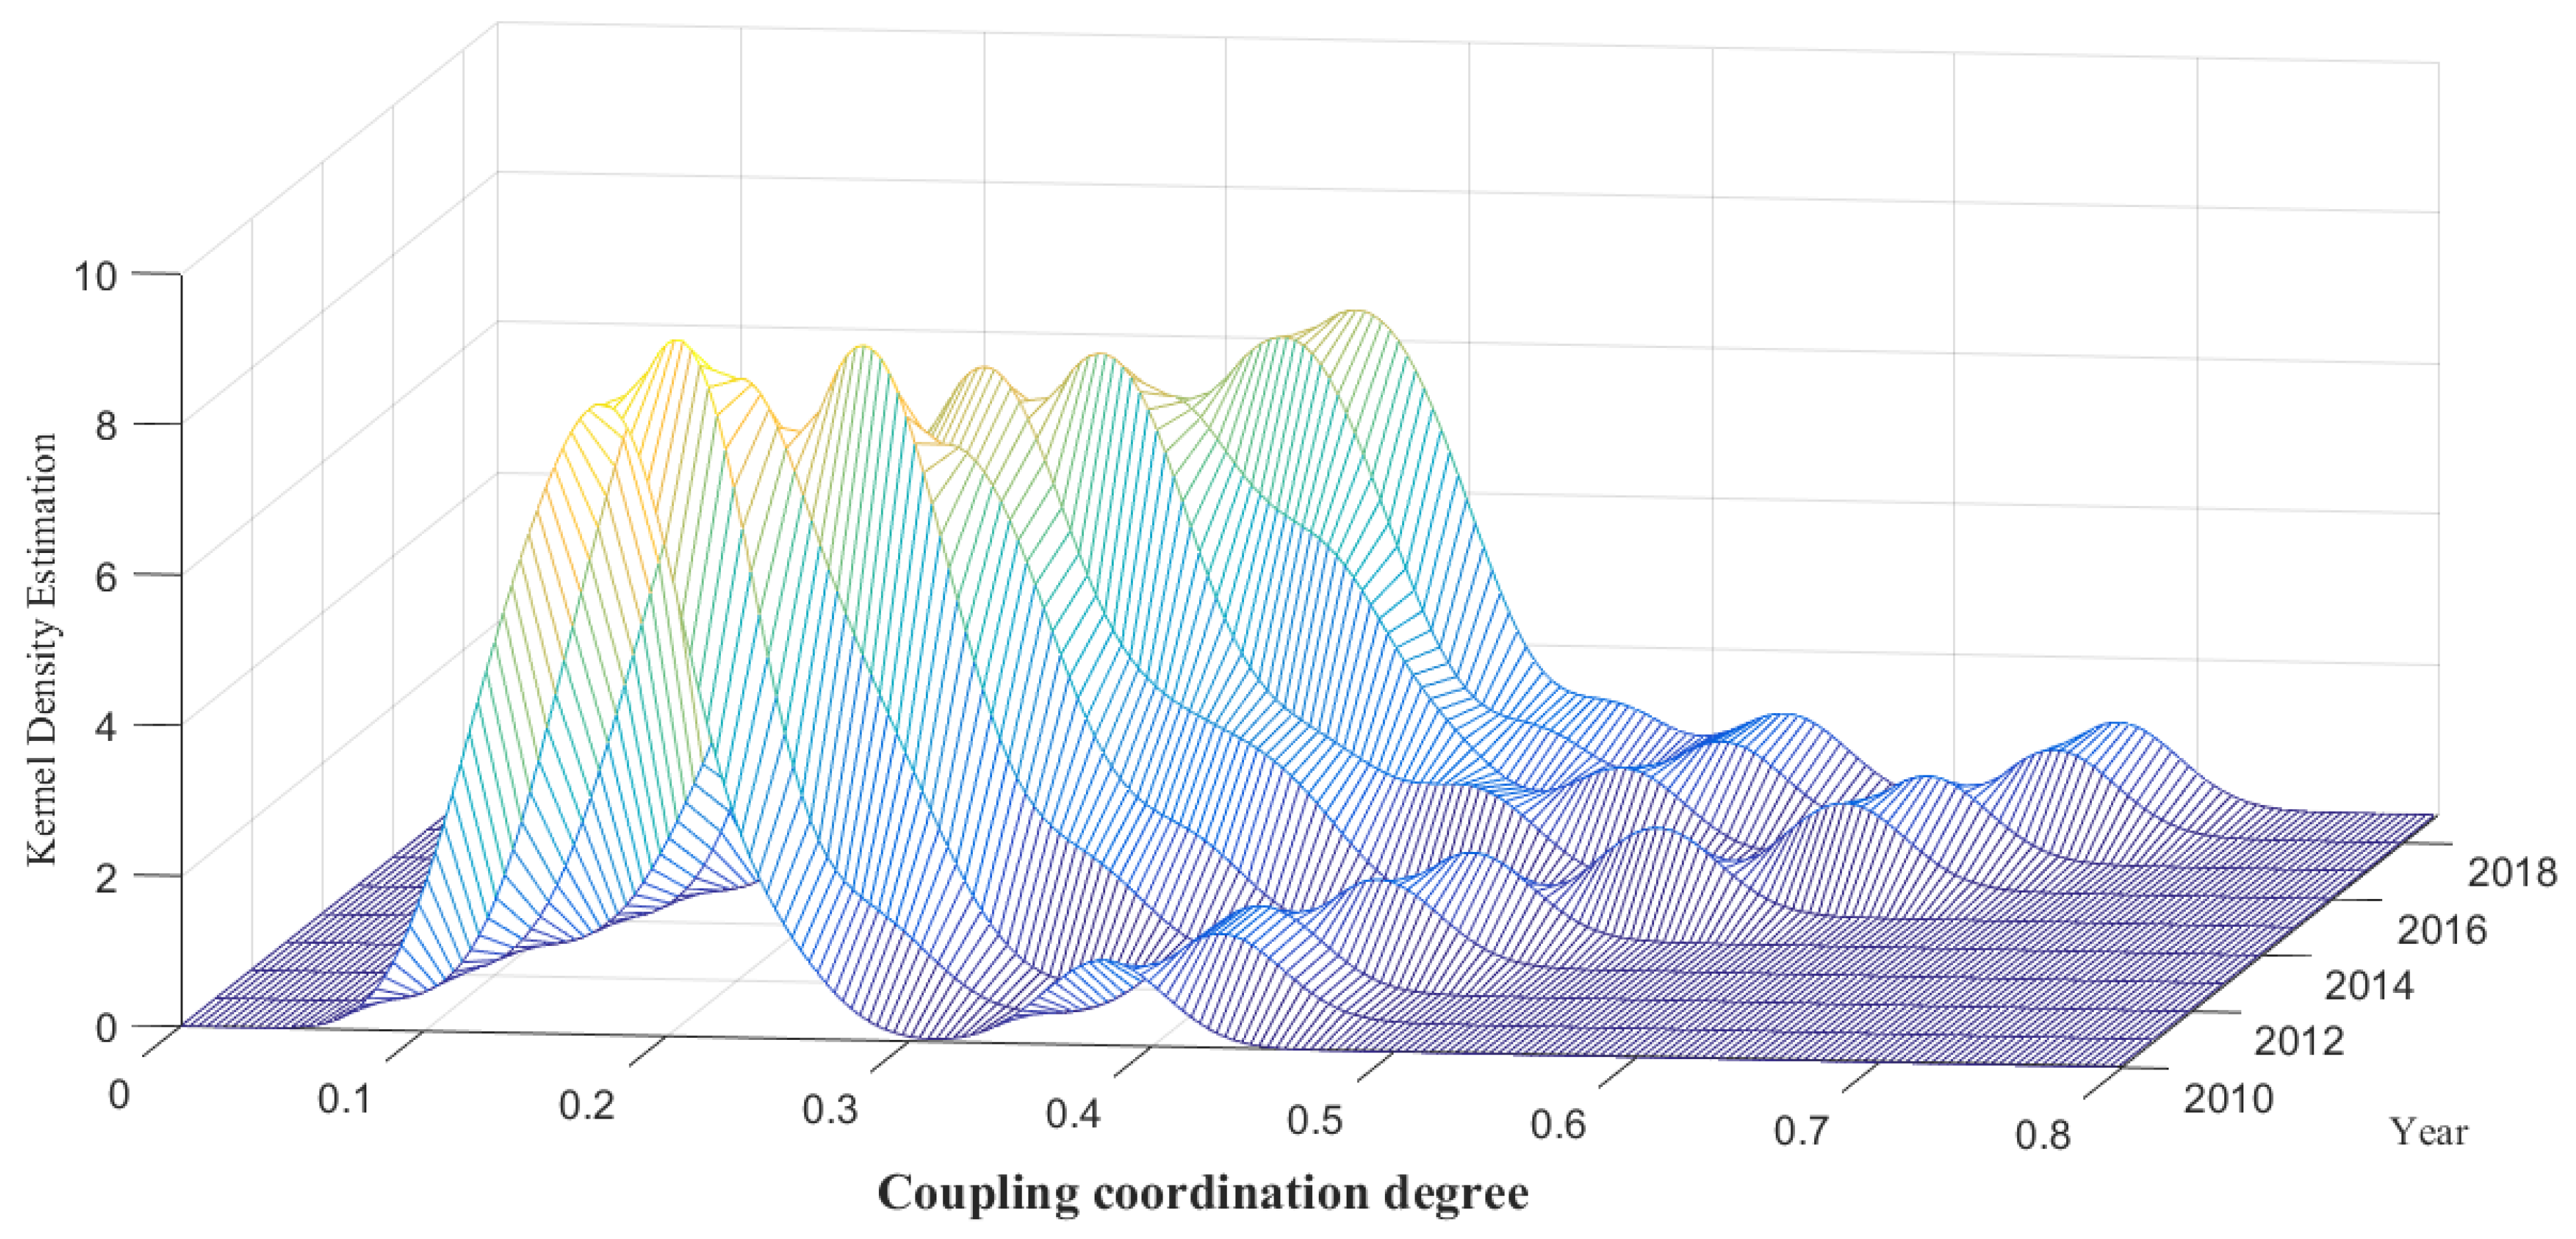
Spatial analysis: JJJ region shows a positive correlation in space, and it shows certain characteristics of spatial agglomeration and distribution. The results of nuclear density estimation and analysis show that, from 2010 to 2019, with the passage of time, the nuclear density curve continues to shift to the right, the peak value continues to decrease, showing a trend from “peak” to “flat”, and the shape of the curve becomes gentle. It shows that the development gap between cities in JJJ region is gradually expanding, and the convergence between cities is decreasing. The results of spatial econometric regression of the driving factors of the two coupling and coordinated development show that there are obvious spatial spillover and diffusion effects. Different influencing factors have significant differences in the coupling and coordinated development of this region and adjacent areas.
There is a complex interaction mechanism between regional digital economy and eco-economic system resilience. Vigorously developing the digital economy, releasing the dividend of industrial structure transformation, and building a new engine of economic development are important issues for China’s economy to achieve green transformation and sustainable development. Digital economy will gradually become a new driving force for future economic growth, and promoting the deep integration and coordinated development between digital economy and ecological environment will be the main theme of future development. Our findings provide strong theoretical support and policy inspiration for policy makers. In the future, it is believed that the government and the market will explore a widely replicated and available scheme so as to better provide reference for the sustainable development of cities in the whole country and other developing countries.
However, this paper has some limitations and further research directions to consider. Firstly, because of the limitations and offset of the JJJ urban agglomeration analysis data, overall, it is difficult to reveal in a comprehensive and systematic way the overarching laws and characteristics of coupling and coordinated development of the digital economy and urban eco-economic system resilience in JJJ region. Further data refinement is needed to fully understand this phenomenon. In addition, it will be necessary to explore the dynamic mechanism of spatial differentiation and optimize the path of the regional digital economy and the resilience coupling of urban eco-economic system. The study of dynamic simulation and decision early warning mechanism to realize the resilience development of urban eco-economic system will be a new direction to be explored in the future.

Author Contributions

Writing—original draft preparation, K.Y. and X.L.; methodology, B.H. and L.Z.; writing—review and editing, B.H. and T.N. All authors have read and agreed to the published version of the manuscript.

Funding

This research was supported by the National key R&D Program of China (No. 2022YFC3901805).

Institutional Review Board Statement

Not applicable.

Informed Consent Statement

Not applicable.

Data Availability Statement

Not applicable.

Acknowledgments

The authors acknowledge the professionals and editors who collaborated during this study.

Conflicts of Interest

The authors declare no conflict of interest.

References

  1. Chen, S.; Liu, Y.; Li, S.; Shi, X.; Lv, H.; Wang, J. Beijing-Tianjin-Hebei urban PM2.5 the health risks of contamination and the economic loss research. J. Saf. Environ. 2020, 20, 1146–1153. [Google Scholar]
  2. Zhao, L.; Li, J.; Shao, Q. Evaluation of urban comprehensive carrying capacity: Case study of the Beijing–Tianjin–Hebei urban agglomeration, China. Environ. Sci. Pollut. Res. 2020, 27, 19774–19782. [Google Scholar] [CrossRef]
  3. Sara, M.; Joshua, P.N.; Melissa, S. Defining urban resilience: A review. Landsc. Urban Plan. 2016, 147, 38–49. [Google Scholar]
  4. Haskell, L.; Bonnedahl, K.J.; Stål, H.I. Social innovation related to ecological crises: A systematic literature review and a research agenda for strong sustainability. J. Clean. Prod. 2021, 325, 129316. [Google Scholar] [CrossRef]
  5. Guan, C.; Weng, Y.; Zhao, J.; Lin, Y.; Zhang, W.; Tu, Q. Examining China’s sustainable development based on genuine progress indicator. Sustain. Prod. Consum. 2021, 28, 1635–1644. [Google Scholar] [CrossRef]
  6. Xu, S.; Yang, C.; Huang, Z.; Failler, P. Interaction between Digital Economy and Environmental Pollution: New Evidence from a Spatial Perspective. Int. J. Environ. Res. Public Health 2022, 19, 5074. [Google Scholar] [CrossRef] [PubMed]
  7. Zhao, M.; Liu, R.; Dai, D. Synergistic Effect between China’s Digital Transformation and Economic Development: A Study Based on Sustainable Development. Sustainability 2021, 13, 13773. [Google Scholar] [CrossRef]
  8. Lu, Z.N.; Chen, H.; Hao, Y.; Wang, J.; Song, X.; Mok, T.M. The dynamic relationship between environmental pollution, economic development and public health: Evidence from China. J. Clean. Prod. 2017, 166, 134–147. [Google Scholar] [CrossRef]
  9. Guo, J.; Li, J. Efficiency evaluation and influencing factors of energy saving and emission reduction: An empirical study of China’s three major urban agglomerations from the perspective of environmental benefits. Ecol. Indic. 2021, 133, 108410. [Google Scholar] [CrossRef]
  10. Han, H.; Guo, L.; Zhang, J.Q.; Zhang, K.Z.; Cui, N.B. Spatiotemporal analysis of the coordination of economic development, resource utilization, and environmental quality in the Beijing-Tianjin-Hebei urban agglomeration. Ecol. Indic. 2021, 127, 107724. [Google Scholar] [CrossRef]
  11. Gu, R.; Li, C.; Li, D.; Yang, Y.; Gu, S. The Impact of Rationalization and Upgrading of Industrial Structure on Carbon Emissions in the Beijing-Tianjin-Hebei Urban Agglomeration. Int. J. Environ. Res. Public Health 2022, 19, 7997. [Google Scholar] [CrossRef]
  12. Siqin, Z.; Niu, D.; Li, M.; Zhen, H.; Yang, X. Carbon dioxide emissions, urbanization level, and industrial structure: Empirical evidence from North China. Environ. Sci. Pollut. Res. 2022, 29, 34528–34545. [Google Scholar] [CrossRef] [PubMed]
  13. Xia, M.J.; Li, J. Assessment of ecological wellbeing performance and its spatial correlation analysis in the Beijing-Tianjin-Hebei urban agglomeration. J. Clean. Prod. 2022, 154, 120453. [Google Scholar]
  14. Hou, J.D.; Ruan, X.X.; Lv, J.; Guo, H.X. Two-stage super-efficiency slacks-based model to assess China’s ecological well-being. Int. J. Environ. Res. Public Health 2020, 17, 7045. [Google Scholar] [CrossRef] [PubMed]
  15. Zhang, X.L.; Li, H. Urban resilience and urban sustainability: What we know and what do not know. Cities 2018, 72, 141–148. [Google Scholar] [CrossRef]
  16. Santarius, T.; Pohl, J.; Lange, S. Digitalization and the Decoupling Debate: Can ICT Help to Reduce Environmental Impacts While the Economy Keeps Growing. Sustainability 2020, 12, 7496. [Google Scholar] [CrossRef]
  17. Li, Z.; Li, N.; Wen, H. Digital Economy and Environmental Quality: Evidence from 217 Cities in China. Sustainability 2021, 13, 8058. [Google Scholar] [CrossRef]
  18. Li, Z.G.; Wang, J. The Dynamic Impact of Digital Economy on Carbon Emission Reduction: Evidence City-level Empirical Data in China. J. Clean. Prod. 2022, 351, 131570. [Google Scholar] [CrossRef]
  19. Yousaf, Z.; Radulescu, M.; Sinisi, C.I.; Serbanescu, L.; Punescu, L.M. Towards sustainable digital innovation of smes from the developing countries in the context of the digital economy and frugal environment. Sustainability 2021, 13, 5715. [Google Scholar] [CrossRef]
  20. Cao, S.; Nie, L.; Sun, H.; Sun, W.; Taghizadeh-Hesary, F. Digital finance, green technological innovation and energy-environmental performance: Evidence from China’s regional economies. J. Clean. Prod. 2021, 327, 129458. [Google Scholar] [CrossRef]
  21. Xu, A.D.; Qian, F.B.; Pai, C.H.; Yu, N.; Zhou, P. The Impact of COVID-19 Epidemic on the Development of the Digital Economy of China-Based on the Data of 31 Provinces in China. Front. Public Health 2022, 9, 778671. [Google Scholar] [CrossRef]
  22. Frenken, K.; Schor, J. Putting the sharing economy into perspective. Environ. Innov. Soc. Transit. 2017, 23, 3–10. [Google Scholar] [CrossRef]
  23. Pouri, M.J.; Hilty, L.M. The digital sharing economy: A confluence of technical and social sharing. Environ. Innov. Soc. Transit. 2021, 38, 127–139. [Google Scholar] [CrossRef]
  24. Ma, D.; Zhu, Q.; Business, J.O.; Woodside, A.G. Innovation in emerging economies: Research on the digital economy driving high-quality green development. J. Bus. Res. 2022, 145, 801–813. [Google Scholar] [CrossRef]
  25. Hudec, O.; Reggiani, A.; Iserová, M. Resilience capacity and vulnerability: A joint analysis with reference to Slovak urban districts. Cities 2018, 73, 24–35. [Google Scholar] [CrossRef]
  26. Büyüközkan, G.; Ilıcak, Ö.; Feyzioğlu, O. A review of urban resilience literature. Sustain. Cities Soc. 2022, 77, 103579. [Google Scholar] [CrossRef]
  27. Ding, C.; Liu, C.; Zheng, C.; Li, F. Digital Economy, Technological Innovation and High-Quality Economic Development: Based on Spatial Effect and Mediation Effect. Sustainability 2022, 14, 216. [Google Scholar] [CrossRef]
  28. Su, J.; Su, K.; Wang, S. Does the Digital Economy Promote Industrial Structural Upgrading?—A Test of Mediating Effects Based on Heterogeneous Technological Innovation. Sustainability 2021, 13, 10105. [Google Scholar] [CrossRef]
  29. Liu, Z.; Liu, J.; Osmani, M. Integration of Digital Economy and Circular Economy: Current Status and Future Directions. Sustainability 2021, 13, 7217. [Google Scholar] [CrossRef]
  30. Liu, Y.; Yang, Y.; Li, H.; Zhong, K. Digital Economy Development, Industrial Structure Upgrading and Green Total Factor Productivity: Empirical Evidence from China’s Cities. Int. J. Environ. Res. Public Health 2022, 19, 2414. [Google Scholar] [CrossRef]
  31. Martins, N.O. The classical circular economy, sraffian ecological economics and the capabilities approach. Ecol. Econ. 2018, 145, 38–45. [Google Scholar] [CrossRef]
  32. Yan, X.; Chen, M.; Chen, M.Y. Coupling and Coordination Development of Australian Energy, Economy, and Ecological Environment Systems from 2007 to 2016. Sustainability 2019, 11, 6568. [Google Scholar] [CrossRef]
  33. Su, L. The Impact of Coordinated Development of Ecological Environment and Technological Innovation on Green Economy: Evidence from China. Int. J. Environ. Res. Public Health 2022, 19, 6994. [Google Scholar] [CrossRef]
  34. Yuan, L.; Li, R.; He, W.; Wu, X.; Kong, Y.; Dagmawi, M.; Thomas, S. Coordination of the Industrial-Ecological Economy in the Yangtze River Economic Belt, China. Front. Environ. Sci. 2022, 10, 882221. [Google Scholar] [CrossRef]
  35. Liu, H.; Han, B.; Wang, L. Modeling the spatial relationship between urban ecological resources and the economy. J. Clean. Prod. 2016, 173, 207–216. [Google Scholar] [CrossRef]
  36. Tang, P.L.; Huang, J.J.; Zhou, H.; Fang, C.L.; Zhan, Y.J.; Huang, W. Local and telecoupling coordination degree model of urbanization and the eco-environment based on RS and GIS: A case study in the Wuhan urban agglomeration. Sustain. Cities Soc. 2021, 75, 102–115. [Google Scholar] [CrossRef]
  37. Chen, W.D.; Si, W.; Chen, Z.M. How technological innovations affect urban eco-efficiency in China: A prefecture-level panel data analysis. J. Clean. Prod. 2020, 270, 122–149. [Google Scholar] [CrossRef]
  38. Danish; Wang, Z. Investigation of the ecological footprint’s driving factors: What we learn from the experience of emerging economies. Sustain. Cities Soc. 2019, 49, 101626. [Google Scholar] [CrossRef]
  39. Pan, Y.X.; Zhang, B.Y.; Wu, Y.; Tian, Y. Sustainability assessment of urban ecological-economic systems based on emergy analysis: A case study in Simao, China. Ecol. Indic. 2020, 15, 107–127. [Google Scholar] [CrossRef]
  40. Fang, S.J.; Xiao, Q. Research on regional ecological well-being performance and spatial effect in China. China Popul. Environ. 2019, 29, 1–10. [Google Scholar]
  41. Wang, J.; Li, R.; Xue, K.; Fang, C. Analysis of Spatio-Temporal Heterogeneity and Socioeconomic driving Factors of PM2.5 in Beijing–Tianjin–Hebei and Its Surrounding Areas. Atmosphere 2021, 12, 1324. [Google Scholar] [CrossRef]
  42. Song, M.L.; Zhao, X.; Shang, Y.P. The impact of low-carbon city construction on ecological efficiency: Empirical evidence from quasi-natural experiments. Resour. Conserv. Recycl. 2020, 157, 102–115. [Google Scholar] [CrossRef]
  43. Tripathy, N. Does measure of financial development matter for economic growth in India? Quant. Financ. Econ. 2019, 3, 508–525. [Google Scholar] [CrossRef]
  44. Del Río Castro, G.; Fernández, M.C.G.; Colsa, U. Unleashing the convergence amid digitalization and sustainability towards pursuing the Sustainable Development Goals (SDGs): A holistic review. J. Clean. Prod. 2021, 280, 122204. [Google Scholar] [CrossRef]
  45. Gouvea, R.; Kapelianis, D.; Kassicieh, S. Assessing the nexus of sustainability and information & communications technology. Technol. Forecast. Soc. Chang. 2018, 130, 39–44. [Google Scholar]
  46. Sun, X.X.; Loh, L. Sustainability governance in China: An analysis of regional ecological efficiency. Sustainability 2019, 11, 1958. [Google Scholar] [CrossRef]
  47. Seele, P.; Lock, I. The game-changing potential of digitalization for sustainability: Possibilities, perils, and pathways. Sustain. Sci. 2017, 12, 183–185. [Google Scholar] [CrossRef]
  48. França, A.; Neto, J.A.; Gonçalves, R.; Almeida, C. Proposing the use of blockchain to improve the solid waste management in small municipalities. J. Clean. Prod. 2019, 244, 118529. [Google Scholar] [CrossRef]
  49. Hu, B.; Yuan, K.; Niu, T.; Zhang, L.; Guan, Y. Study on the Spatial and Temporal Evolution Patterns of Green Innovation Efficiency and Driving Factors in Three Major Urban Agglomerations in China—Based on the Perspective of Economic Geography. Sustainability 2022, 14, 9239. [Google Scholar] [CrossRef]
  50. Firnkorn, J.; Mueller, M. Free-floating electric carsharing-fleets in smart cities: The dawning of a post-private car era in urban environments? Environ. Sci. Policy 2015, 45, 30–40. [Google Scholar] [CrossRef]
  51. Huang, L.; Yang, P.; Zhang, B.; Hu, W. Spatio-Temporal Coupling Characteristics and the Driving Mechanism of Population-Land-Industry Urbanization in the Yangtze River Economic Belt. Land 2021, 10, 400. [Google Scholar] [CrossRef]
  52. Maddison, D. Environmental Kuznets curves: A spatial econometric approach. J. Environ. Econ. Manag. 2006, 51, 218–230. [Google Scholar] [CrossRef]
  53. Zhong, K. Does the digital finance revolution validate the Environmental Kuznets Curve? Empirical findings from China. PLoS ONE 2022, 17, e0257498. [Google Scholar] [CrossRef]
  54. Shuai, C.; Chen, X.; Wu, Y.; Zhang, Y.; Tan, Y. A three-step strategy for decoupling economic growth from carbon emission: Empirical evidences from 133 countries. Sci. Total Environ. 2019, 646, 524–543. [Google Scholar] [CrossRef] [PubMed]
  55. Song, Y.; Sun, J.; Zhang, M.; Su, B. Using the Tapio-Z decoupling model to evaluate the decoupling status of China’s CO2 emissions at provincial level and its dynamic trend. Struct. Chang. Econ. Dyn. 2020, 52, 120–129. [Google Scholar] [CrossRef]
  56. Wu, Y.; Tam, V.W.Y.; Shuai, C.; Shen, L.; Zhang, Y.; Liao, S. Decoupling China’s economic growth from carbon emissions: Empirical studies from 30 Chinese provinces (2001–2015). Sci. Total Environ. 2019, 656, 576–588. [Google Scholar] [CrossRef]
  57. Bagheri, M.; Delbari, S.H.; Pakzadmanesh, M.; Kennedy, C.A. City-integrated renewable energy design for low-carbon and climate-resilient communities. Appl. Energy 2019, 239, 1212–1225. [Google Scholar] [CrossRef]
  58. Jabareen, Y. Planning the resilient city: Concepts and strategies for coping with climate change and environmental risk. Cities 2013, 31, 220–229. [Google Scholar] [CrossRef]
  59. Liu, H.M.; Fang, C.L.; Fang, K. Coupled Human and Natural Cube: A novel framework for analyzing the multiple interactions between humans and nature. J. Geogr. Sci. 2020, 30, 355–377. [Google Scholar] [CrossRef]
  60. Mallick, S.K.; Das, P.; Maity, B.; Rudra, S.; Pramanik, M.; Pradhan, B.; Sahana, M. Understanding Future Urban Growth, Urban Resilience and Sustainable Development of Small Cities using Prediction-Adaptation-Resilience (PAR) Approach. Sustain. Cities Soc. 2021, 74, 103196. [Google Scholar] [CrossRef]
  61. Marjolein, S.; Bas, W. Building up resilience in cities worldwide: Rotterdam as participant in the 100 Resilient Cities Programme. Cities 2017, 61, 109–116. [Google Scholar]
  62. Simone, C.; Iandolo, F.; Fulco, I.; Loia, F. Rome was not built in a day. Resilience and the eternal city: Insights for urban management. Cities 2021, 110, 103070. [Google Scholar] [CrossRef]
  63. González, D.P.; Monsalve, M.; Roberto, M.; Moris, R.; Herrera, C. Risk and resilience monitor: Development of multiscale and multilevel indicators for disaster risk management for the communes and urban areas of Chile. Appl. Geogr. 2018, 94, 262–271. [Google Scholar] [CrossRef]
  64. Li, J.L.; Sun, W.; Song, H.M. Toward the construction of a circular economy eco-city: An emergy-based sustainability evaluation of Rizhao city in China. Sustain. Cities Soc. 2021, 71, 102–115. [Google Scholar] [CrossRef]
  65. Liu, Q.; Wang, S.; Li, B.; Zhang, W. Dynamics, differences, influencing factors of eco-efficiency in China: A spatiotemporal perspective analysis. J. Environ. Manag. 2020, 264, 110442. [Google Scholar] [CrossRef] [PubMed]
  66. Wang, Z.B.; Fang, C.L.; Cheng, S.W.; Wang, J. Evolution of coordination degree of eco-economic system and early-warning in the Yangtze River Delta. J. Geogr. Sci. 2013, 23, 147–162. [Google Scholar] [CrossRef]
  67. Wang, Z.; Deng, X.; Wong, C.; Li, Z.; Chen, J. Learning urban resilience from a social- economic- ecological system perspective: A case study of Beijing from 1978 to 2015. J. Clean. Prod. 2018, 183, 343–357. [Google Scholar] [CrossRef]
  68. Guo, L. The impact mechanism of the digital economy on China’s total factor productivity: An uplifting effect or a restraining effect? S. China J. Econ. 2021, 40, 9–27. [Google Scholar]
  69. Pan, W.; Xie, T.; Wang, Z.; Ma, L. Digital economy: An innovation driver for total factor productivity. J. Bus. Res. 2022, 139, 303–311. [Google Scholar] [CrossRef]
  70. Yue, S.J.; Shen, Y.C.; Yuan, J.H. Sustainable total factor productivity growth for 55 states: An application of the new malmquist index considering ecological footprint and human development index. Resour. Conserv. Recycl. 2019, 146, 475–483. [Google Scholar] [CrossRef]
  71. Yang, J.; Li, X.M.; Huang, S.J. Impacts on environmental quality and required environmental regulation adjustments: A perspective of directed technical change driven by big data. J. Clean. Prod. 2020, 275, 124–126. [Google Scholar] [CrossRef]
  72. Liang, Q.; Xiao, S.P.; Li, M.X. Has the development of digital economy improved the ecological efficiency of cities?: Based on the perspective of industrial structure upgrading. Inq. Econ. Issues 2021, 6, 82–92. [Google Scholar]
  73. Lin, B.Q.; Zhou, Y.C. Measuring the green economic growth in China: Influencing factors and policy perspectives. Energy 2022, 241, 76–102. [Google Scholar] [CrossRef]
  74. Jorgenson, A.K.; Alekseyko, A.; Giedraitis, V. Energy consumption, human wellbeing and economic development in central and eastern European nations: Acautionary tale of sustainability. Energy Pol. 2014, 66, 419–427. [Google Scholar] [CrossRef]
  75. Zhao, L.L.; Zhang, G.X. Evaluation and welfare effect of coordinated ecological development of the Beijing-Tianjin-Hebei region. China Popul. Environ. 2020, 30, 36–44. [Google Scholar] [CrossRef]
  76. Jia, P.R.; Li, K.; Shao, S. Choice of technological change for China’s low-carbon development: Evidence from three urban agglomerations. J. Environ. Manag. 2018, 206, 1308–1319. [Google Scholar] [CrossRef] [PubMed]
  77. Cui, Z.; Yang, F.; Ren, F.; Zhang, X.; Jing, Z. Assessing sustainability environmental performance of three urban agglomerations in China: An input–output modeling approach. Ecol. Indic. 2021, 130, 108079. [Google Scholar] [CrossRef]
  78. Ma, L.; Zuo, Z.; Zhao, B.; Li, L. Weight Calculation of GSM-R Network Quality of Service Evaluation Indexes Based on Analytic Hierarchy Process and Entropy Weight Method. J. Phys. Conf. Ser. 2021, 1828, 012089. [Google Scholar] [CrossRef]
  79. Saaty, T.L. Decision making—The analytic hierarchy and network processes (AHP/ANP). J. Syst. Sci. Syst. Eng. 2004, 13, 1–35. [Google Scholar] [CrossRef]
  80. Ramos, J.; Santos, M.N.; Whitmarsh, D.; Monteiro, C.C. The usefulness of the analytic hierarchy process for understanding reef diving choices: A case study. Bull. Mar. Sci. 2006, 78, 213–219. [Google Scholar]
  81. Zhou, J.; Tan, S.; Li, J.; Xu, J.; Wang, C.; Ye, H. Landslide Susceptibility Assessment Using the Analytic Hierarchy Process (AHP): A Case Study of a Construction Site for Photovoltaic Power Generation in Yunxian County, Southwest China. Sustainability 2023, 15, 5281. [Google Scholar] [CrossRef]
  82. Nsangou, D.; Kpoumié, A.; Mfonka, Z.; Ngouh, A.N.; Fossi, D.H.; Jourdan, C.; Mbele, H.Z.; Mouncherou, O.F.; Vandervaere, J.-P.; Ngoupayou, J.R.N. Urban flood susceptibility modelling using AHP and GIS approach: Case of the Mfoundi watershed at Yaoundé in the South-Cameroon plateau. Sci. Afr. 2022, 15, e01043. [Google Scholar] [CrossRef]
  83. Yuan, K.; Hu, B.; Niu, T.N.; Zhu, B.L.; Zhang, L.; Guan, Y.Q. Competitiveness Evaluation and Obstacle Factor Analysis of Urban Green and Low-Carbon Development in Beijing-Tianjin-Hebei Cities. Math. Probl. Eng. 2022, 15, 5230314. [Google Scholar] [CrossRef]
  84. Zhang, X.; Zhao, Y.A.; Gao, L.; Hao, D.H. Evaluation framework and method of the intelligent behaviors of unmanned ground vehicles based on AHP scheme. Appl. Mech. Mater. 2015, 721, 476–480. [Google Scholar] [CrossRef]
  85. Zhao, L.; Cao, N.G.; Han, Z.L.; Gao, X.T. Spatial correlation network and influencing factors of green economic efficiency in China. Resour. Sci. 2021, 43, 1933–1946. [Google Scholar] [CrossRef]
  86. Xiao, L.M.; Zhang, X.P. Spatio-temporal characteristics of coupling coordination between green innovation efficiency and ecological welfare performance under the concept of strong sustainability. J. Nat. Resour. 2019, 34, 312–324. [Google Scholar] [CrossRef]
  87. Dong, L.; Longwu, L.; Zhenbo, W.; Liangkan, C.; Faming, Z. Exploration of coupling effects in the economy—Society—Environment system in urban areas: Case study of the Yangtze River Delta urban agglomeration. Ecol. Indic. 2021, 128, 107858. [Google Scholar] [CrossRef]
  88. Lu, H.L.; Zhou, L.H.; Chen, Y.; An, Y.W.; Hou, C.X. Degree of coupling and coordination of eco-economic system and the influencing factors: A case study in Yanchi County, Ningxia Hui Autonomous Region, China. J. Arid. Land 2017, 9, 446–457. [Google Scholar] [CrossRef]
  89. Zhang, Y.K.; Khan, S.U.; Swallow, B.; Liu, W.X.; Zhao, M.J. Coupling coordination analysis of China’s water resources utilization efficiency and economic development level. J. Clean. Prod. 2022, 373, 133874. [Google Scholar] [CrossRef]
  90. Wang, S.Y.; Zhang, Y.X.; Yao, X.R. Research on spatial unbalance and influencing factors of ecological well-being performance in China. Int. J. Environ. Res. Public Health 2021, 18, 9299. [Google Scholar] [CrossRef]
  91. Wang, H.J.; Bao, C. Scenario modeling of ecological security index using system dynamics in Beijing-Tianjin-Hebei urban agglomeration. Ecol. Indicat. 2021, 125, 107613. [Google Scholar] [CrossRef]
  92. Long, L.J. Evaluation of ecological civilization construction performance and its international comparison from the perspective of overall well-being. J. Nat. Resour. 2019, 34, 1259–1272. [Google Scholar] [CrossRef]
  93. Singpai, B.; Wu, D.D. An integrative approach for evaluating the environmental economic efficiency. Energy 2021, 215, 118940. [Google Scholar] [CrossRef]
  94. Peng, H.S.; Guo, L.J.; Zhang, J.H.; Zhong, S.E.; Yu, H.; Han, Y. Research progress and implication of the relationship between regional economic growth and resource environmental pressure. Resour. Sci. 2020, 42, 593–606. [Google Scholar] [CrossRef]
  95. Zhang, S.; Zhu, D.J.; Shi, Q.H.; Cheng, M. Which countries are more ecologically efficient in improving human well-being? An application of the index of ecological well-being performance. Resour. Conserv. Recycl. 2018, 129, 112–119. [Google Scholar] [CrossRef]
  96. Li, W.; Yi, P. Assessment of city sustainability—Coupling coordinated development among economy, society and environment. J. Clean. Prod. 2020, 256, 120453. [Google Scholar] [CrossRef]
  97. Zailani, S.; Govindan, K.; Iranmanesh, M.; Shaharudin, M.R.; Chong, Y.S. Green innovation adoption in automotive supply chain: The Malaysian case. J. Clean. Prod. 2015, 108, 1115–1122. [Google Scholar] [CrossRef]
Figure 1. Synergistic Mechanism of the Digital Economy and the Resilient Development of the Urban Eco-economic system.
Sustainability 15 07258 g001
Figure 2. JJJ urban agglomeration in China.
Sustainability 15 07258 g002
Figure 3. The research framework.
Sustainability 15 07258 g003
Figure 4. Change trend of digital economy and urban resilience index, coupling degree and coordination degree in JJJ region from 2010 to 2019.
Sustainability 15 07258 g004aSustainability 15 07258 g004b
Figure 5. Core density map of digital economic evaluation index of JJJ urban agglomeration from 2010 to 2019.
Sustainability 15 07258 g005
Figure 6. Core density map of eco-economic system resilience (evaluation index of JJJ urban agglomeration from 2010 to 2019).
Sustainability 15 07258 g006
Figure 7. Nuclear density map of coupling coordination degree between JJJ urban agglomeration from 2010 to 2019.
Sustainability 15 07258 g007
Figure 8. Spatial and temporal transition distribution pattern of coupling coordination degree in JJJ region.
Sustainability 15 07258 g008aSustainability 15 07258 g008b
Figure 9. JJJ region digital economy and urban eco-economic system resilience (global moran’s I).
Sustainability 15 07258 g009
Figure 10. LISA agglomeration Map in JJJ region.
Sustainability 15 07258 g010
Table 1. The corresponding relationship between scale and mapping value.
Scale123456789
Mapping value1 × R 02 × R 13 × R 24 × R 35 × R 46 × R 57 × R 68 × R 79 × R 8
Table 2. Grade evaluation criteria of coupling coordination degree.
Coupling Coordination DegreeCoupling Coordination LevelCoupling Coordination DegreeCoupling Coordination Level
0 < D ≤ 0.2Severe disorder0.4 < D ≤ 0.6Primary coordination
0.2 < D ≤ 0.3Mild disorder0.6 < D ≤ 0.8Middle coordination
0.3 < D ≤ 0.4Barely coordinate0.8 < D ≤ 1Senior coordination
Table 3. Evaluation index system.
Target LayerCriterion LayerIndicatorsIndicial AttributeVIF
Resilience of eco-economic systemEconomic level resiliencePer capita GDP(+)3.174
Per capita fiscal expenditure(+)2.546
FDI investment amount(+)1.749
Year-end savings balance of urban and rural residents(+)1.538
Per capita investment in fixed assets(+)2.107
The proportion of the output value of the tertiary industry in GDP(+)4.312
Social and institutional resilienceSocial security accounts for the proportion of financial expenditure(+)3.114
Urban per capita disposable income(+)1.472
Number of health workers per thousand people(+)2.384
Number of persons receiving higher education per thousand people(+)1.067
Proportion of unemployed population(−)3.469
Density of urban health stations(+)2.463
Proportion of personnel of public management and social organizations(+)4.382
Density of government agencies(+)2.573
Urban governance capacity(+)4.623
Aging rate(+)3.267
Infrastructure resiliencePer capita urban road area(+)2.134
Eco-environmental resilienceLength of urban drainage pipeline(+)1.743
Urban per capita electricity consumption(+)2.864
Number of urban communication base stations(+)3.428
Degree of material supply guarantee(+)4.372
Perfection of disaster prevention and mitigation facilities(+)5.143
Per capita public health facilities(+)3.486
Green coverage rate in built-up area(+)6.417
Per capita green space area(+)5.439
Discharge of industrial wastes(−)7.642
Harmless treatment rate of municipal solid waste(+)3.734
Air quality index(−)4.865
Number of Internet users per 10,000 people(+)1.903
Digital economyDigital infrastructureNumber of mobile phone users per 10,000 people(+)2.197
Number of urban e-commerce parks(+)1.172
Digital industryNumber of employees in information transmission, computer services and software industry(+)3.476
Total amount of telecom service(+)2.839
Proportion of expenditure on science and technology(+)3.765
Digital innovation abilityNumber of patents related to digital economy per 10,000 people(+)5.467
Penetration of digital high-tech applications in listed companies(+)6.728
Digital inclusive financial coverage breadth index(+)2.034
Digital inclusive financeDigital inclusive Financial use depth Index(+)2.128
Digital inclusive Finance digitalization Index(+)3.875
Table 4. Definition and explanation of variables related to the factors.
Influence LevelInfluencing FactorsVariable AbbreviationMeasurement IndexUnit
Economic development levelPer capita income levelPGDPPer capita GDPPerson/yuan
Industrial structureINSOutput value of tertiary industry/GDP%
Operation environment of science and technologyFinancial development levelFINABalance of deposits and loans of financial institutionsyuan
The level of opening upFDIForeign direct investment/GDP%
Urban informatization levelINTERNETProportion of Internet users per 10,000 people%
Government system orientationIntensity of environmental regulationERIndustrial pollution Control Expenditure/GDP%
Higher education levelSTUNumber of college studentsperson
Table 5. Statistics of spatial econometric regression results.
Variable Adjacency Distance Matrix (W)Inverse Distance Matrix (D)Economic Distance Matrix (G)
OLSSEMSARSDMSEMSARSDMSEMSARSDM
InFINA0.6320.8430.785−0.9370.8230.786−0.9030.8820.827−0.964
InINS0.836 *0.648 *0.776 *0.783 **0.6230.738 *0.743 **0.628 *0.639 *0.728 **
InER0.238 *0.365 **0.327 *0.372 *0.683 *0.359 *0.382 *0.326 **0.349 *0.344 *
InINTERNET0.318 *0.216 *−0.308 *0.116 ***0.187 *0.243 *0.314 **0.286 *0.227 *0.244 **
InPGDP0.538 ***0.427 *0.386 *0.392 ***0.378 *0.428 *0.468 ***0.382 *0.425 *0.378 ***
InFDI0.427 *0.458 *−0.5380.234 **0.428 *−0.5360.252 **0.453 *−0.5460.273 **
InSTU1.183 ***−0.6150.839 **1.216 ***−0.5590.838 **1.146 ***−0.6360.841 **1.348 ***
InFINA.W 1.2630.6380.7280.5460.7430.8520.647
InINS.W 0.032 * 0.738 * 0.730 *
InER.W −1.483 −0.064 −0.056
InINTERNET.W 0.314 *** 0.357 * 0.443 **
InPGDP.W 0.649 ** 0.682 ** 0.739 **
InFDI.W −0.683 −1.038 * −1.458
InSTU.W 0.792 ** 0.687 * 0.656 **
P 0.245 *0.149 ** 0.6490.118 ** 0.6370.235 **
R2-ad0.3280.4170.3370.6340.4790.3830.7520.5460.4320.839
Log-likelihood 228.42213.97231.74227.58216.64229.34213.74208.31229.17
Time effectFixedFixedFixedFixedFixedFixedFixedFixedFixedFixed
Individual effectFixedFixedFixedFixedFixedFixedFixedFixedFixedFixed
Number of samples500500500500500500500500500500
Note: *, ** and *** are significant at 10%, 5% and 1% confidence levels, respectively.
Disclaimer/Publisher’s Note: The statements, opinions and data contained in all publications are solely those of the individual author(s) and contributor(s) and not of MDPI and/or the editor(s). MDPI and/or the editor(s) disclaim responsibility for any injury to people or property resulting from any ideas, methods, instructions or products referred to in the content.

