Article

Spatial Distribution and Controlling Factors of Groundwater Quality Parameters in Yancheng Area on the Lower Reaches of the Huaihe River, Central East China

North Jiangsu Research Institute of Agricultural and Rural Modernization, School of Urban and Planning, Yancheng Teachers University, Yancheng 224002, China
*
Author to whom correspondence should be addressed.
Sustainability 2023, 15(8), 6882; https://doi.org/10.3390/su15086882
Submission received: 12 February 2023 / Revised: 31 March 2023 / Accepted: 17 April 2023 / Published: 19 April 2023

Abstract

:
Groundwater samples that were distributed across the Yancheng area in the lower reaches of the Huaihe River were collected from the phreatic aquifer and first confined water layer during the summer of 2016. Using the water quality index, the suitability of the groundwater for drinking and irrigation purposes was systematically evaluated. The controlling factors of solute formation and the causes of water quality deterioration were discussed using the Chadha diagram and the relationship among ions. The results showed that there was a serious lack of excellent- and good-grade groundwater for drinking purposes in the shallow layer. The groundwater was also found to be unsuitable for irrigation, with only approximately 70% being of good quality. The spatial heterogeneity of the water quality was significant, and poor-quality groundwater was found to be distributed discontinuously. The high concentration of alkali metals in the shallow groundwater was found to be due to the weathering of silicate rocks in clay and subclays and the replacement of Ca2+ with Na+ in the surrounding rocks. Additionally, the leaching of residues from the salt industry and marine sediment in historical periods were identified as key factors leading to the scattering of poor-quality groundwater in inland areas. The study found that the shallow groundwater in the study area was not significantly affected by seawater intrusion and human activities. However, signs of human activity, such as agricultural fertilizer and urban sewage, were found to be affecting the “excellent-” and “good-grade” shallow groundwater intended for irrigation purposes.

1. Introduction

Driven by factors such as natural conditions, industrial clustering, transportation, and human activities, the population of coastal areas has increased rapidly, and the demand for water resources has risen to an unprecedented level [1]. As surface water resources are easily polluted and have a high rate of space–time variability, the role of groundwater resources in ensuring the sustainable development of industry and agriculture and the survival of humans and ecosystems has gradually increased [2]. However, the quality of groundwater is restricted by many factors, such as regional geology, the intensity of rock weathering, the residence time of water in porous media, seawater infiltration, the discharge of human pollutants, etc. [3,4]. In addition, changes in water quality may affect human health (e.g., hypertension, hypercalcemia/magnesemia, kidney stones, gastro-renal discomfort, arterial calcification, thrombosis, and other diseases), soil texture (e.g., soil chemical composition, permeability, air permeability, etc.), crop growth and yield, etc. [5]. In recent years, many remarkable results have been achieved in research on the content and methods of groundwater evaluation for drinking [6] and irrigation purposes [2]. The contents of the evaluation include the health risk status of drinking groundwater [7], the impact of seawater intrusion on groundwater quality, and the suitability of groundwater for irrigation purposes [2]. Given their different foci, the most commonly used evaluation methods are the water quality index method (WQI) [6], the entropy weighted water quality index method (EWQI) [8], the fuzzy comprehensive method [6], and the health risk weight method (HRWM) [9]. Among these methods, the WQI has been widely used by international scholars due to its simple calculation, practicality, and versatile applications [6,10,11].
Over the past 40 years, China’s coastal regions have witnessed significant population growth, resulting in increased industrial, agricultural, and tertiary sector activities. However, these developments have caused the overexploitation of groundwater, increasing the risk of seawater intrusion into inland aquifers [12,13]. In addition, various factors, such as water–rock reactions, industrial sewage, irrigation wastewater, etc., have seriously affected the quality and quantity of groundwater resources and limited their development and utilization efficiency [14]. Yancheng (which means “a place rich in salt” in Chinese), located on the plain formed by the alluvial and siltation of the lower Huai River [12], has a population density of about 400 people/km2. It is famous for red-crowned cranes, elk, a world natural heritage site, the Yellow Sea wetlands, and historical salt production. However, Yancheng’s average elevation is less than 4 m, and it is the only prefecture-level city with no hills in China. It has the characteristics of a low-lying and flat terrain, slow runoff, and strong water and rock effects, causing a deterioration of water quality and even excessive manganese in sources of drinking water [15]. Unfortunately, most previous research on the quality of groundwater in Yancheng mainly focused on the chemical composition of the groundwater, health risk assessments, and reasons for the salinization of the coastal wetlands and its impact on the wetland ecology without a comprehensive groundwater quality and cause assessment [16,17,18]. Therefore, this study conducted spatial sampling of shallow groundwater in the Yancheng area, used the Durov diagram to analyze the characteristics of the water’s chemical composition, and applied the water quality index (WQI) to evaluate the suitability of the groundwater for drinking purposes. Parameters such as the total dissolved solids (TDS), magnesium adsorption ratio (MAR), residual sodium carbonate (RSC), sodium absorption coefficient (SAR), sodium percentage (Na%), permeability index (PI), and the integrated irrigation water quality index (IIWQI) were utilized to systematically evaluate the suitability of the groundwater for irrigating farmland. Additionally, controlling factors of water quality evolution were analyzed using the Chadha diagram and the relationship between ions. This study aims to provide a scientific reference for regional economic and social development planning, rational development, and the sustainable utilization of groundwater resources.

2. Materials and Methods
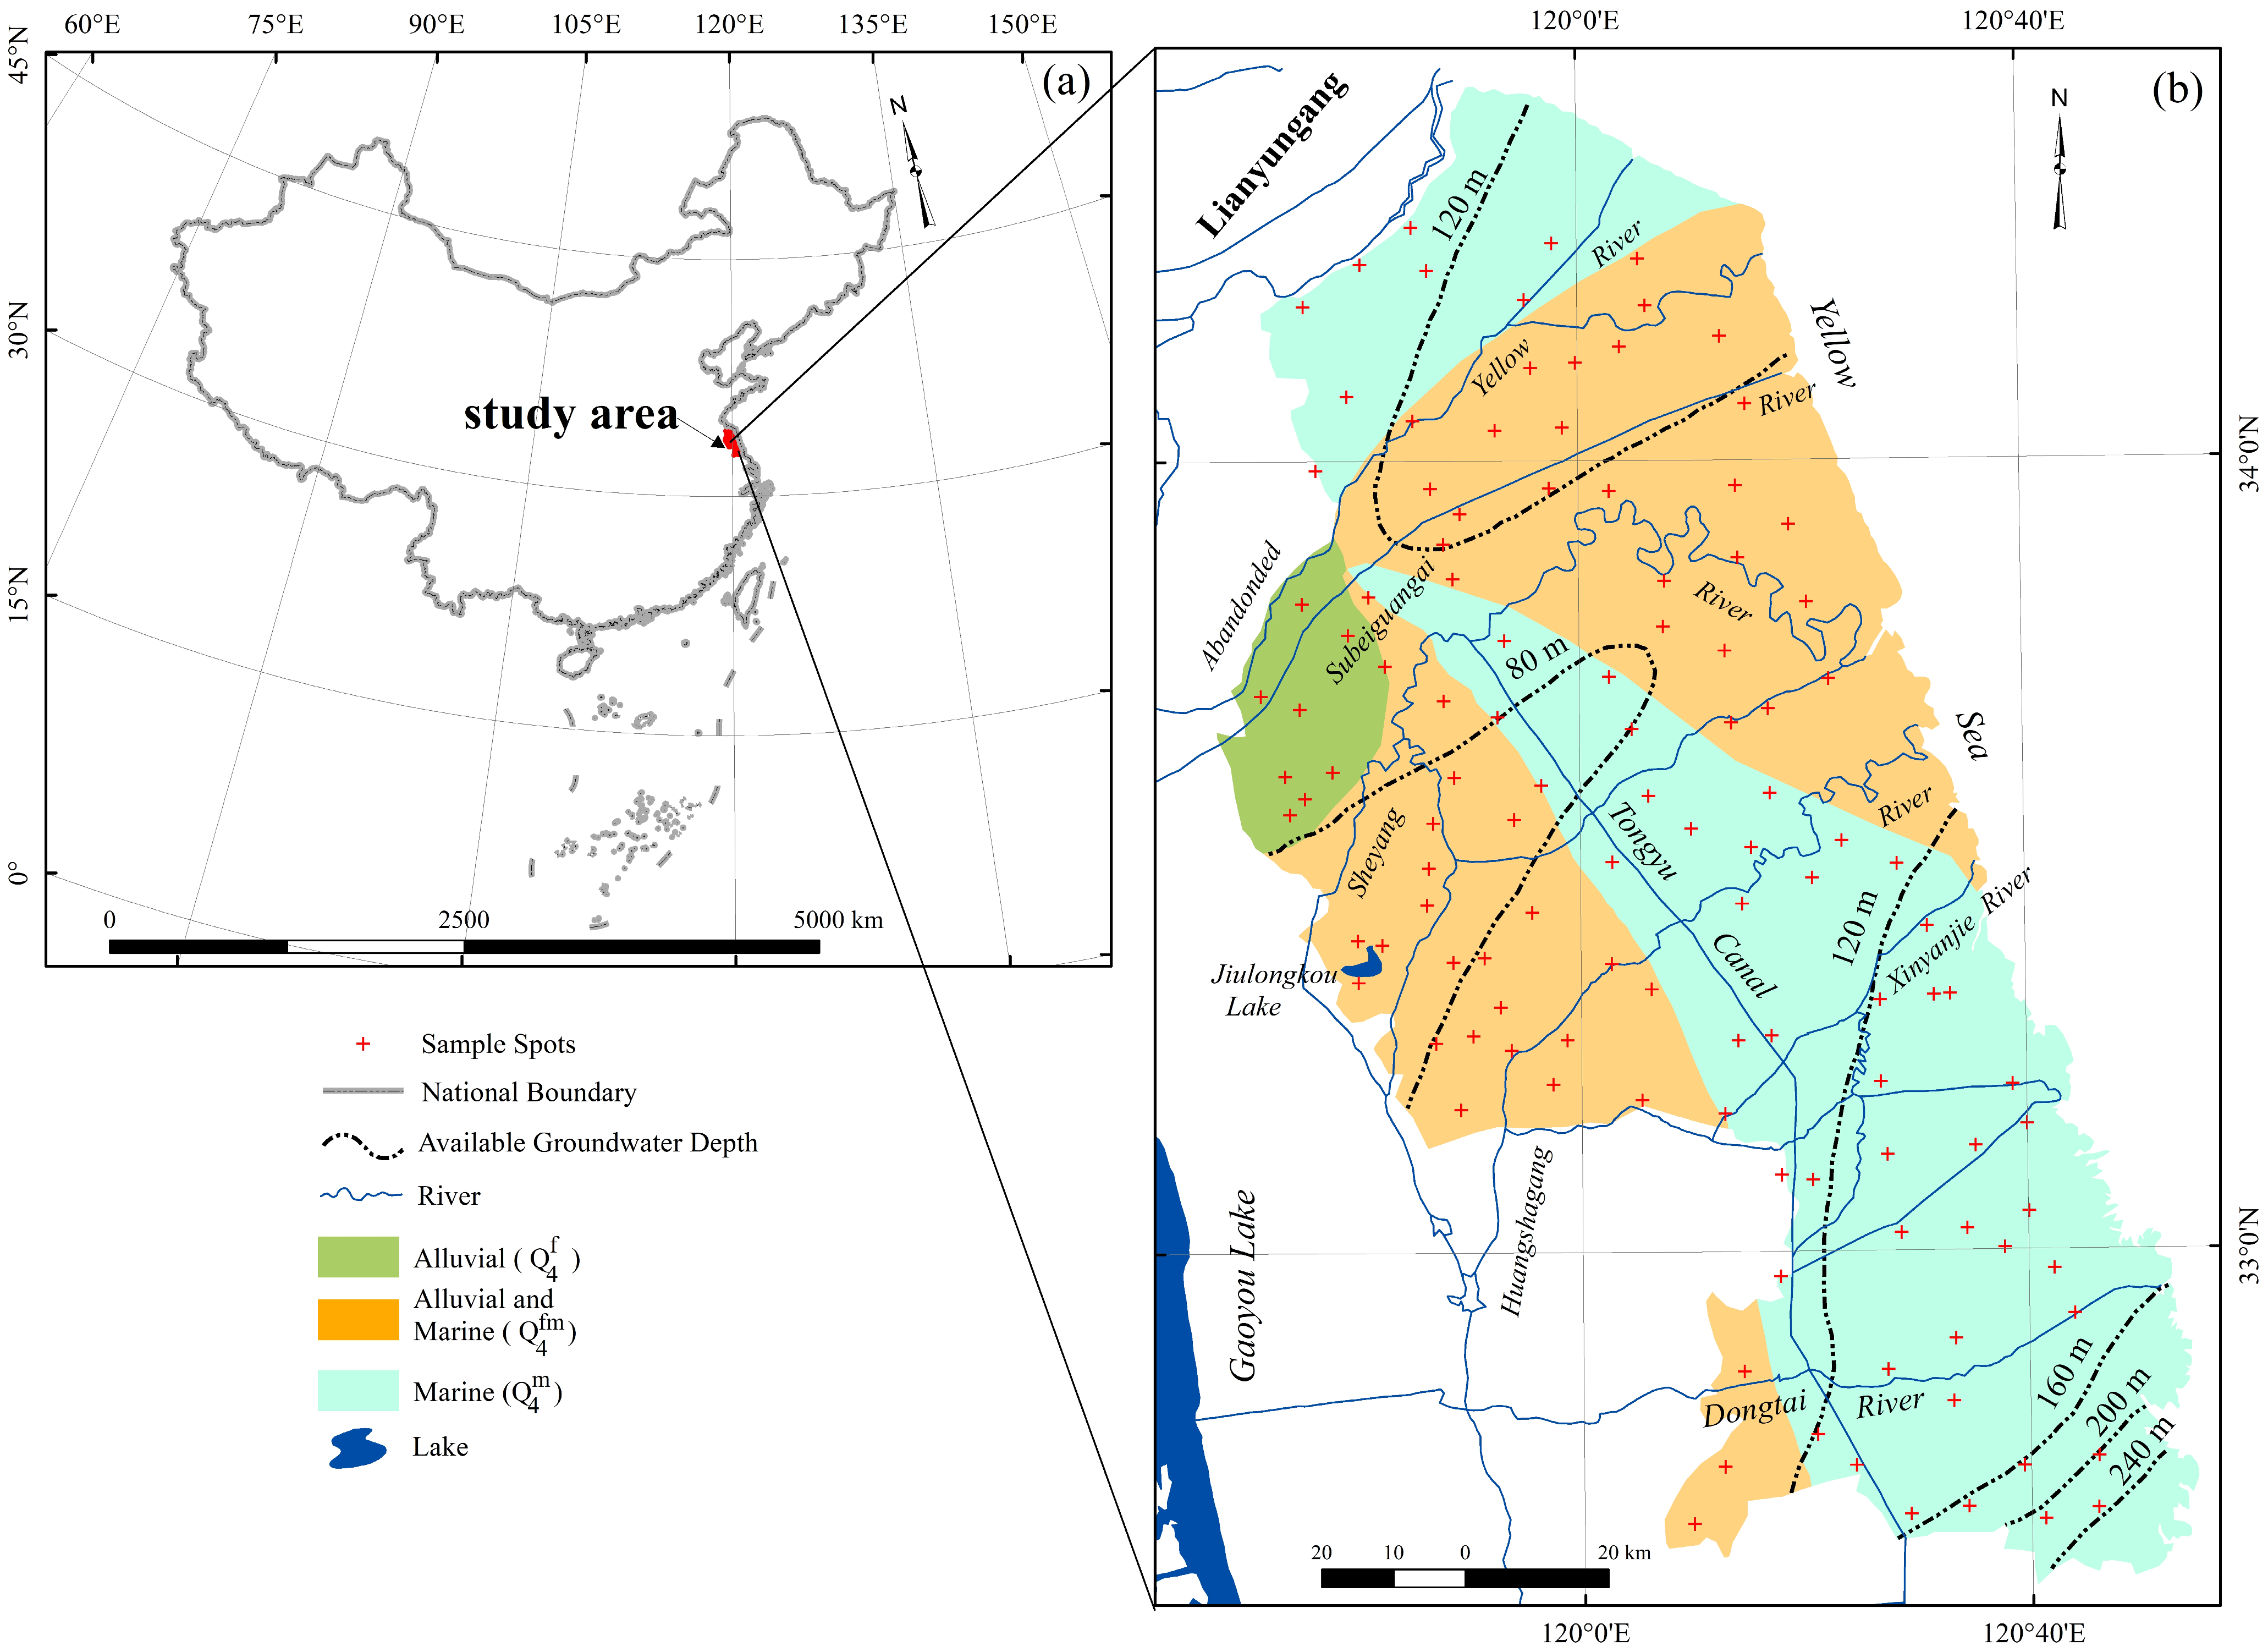
2.1. Study Area

2.1.1. Regional Geography

The administrative area of Yancheng is approximately 1.69 × 10⁴ km2. It is located on the alluvial and silted plain between the Yangtze River and the Yellow River. The terrain is flat and low-lying, with an average elevation of less than 4 m. The area of the water and wetland accounts for 12.1% and 26.8% of the total area, respectively. There are many rivers, such as the Abandoned Yellow River (Zhongshan River), Sheyang River, Huangshagang River, Xinyanjie River, Subeiguangai River, and Dongtai River, resulting in a river network density as high as 3.1 km/km2 [19]. At the connection of the Tongyu Canal and the agricultural irrigation water network, the north and south waterways are interconnected (Figure 1). The annual average surface runoff is about 2.96 billion m3, and the amount of groundwater that can be developed is about 570 million m3 [20]. Yancheng is located in the transitional zone between the south (a subtropical monsoon climate zone) and the north (a temperate monsoon climate zone). The annual average temperature and precipitation are about 14 °C and 1000 mm, respectively. The latter is basically equivalent to the average annual evaporation (950–1120 mm) [16]. Cultivated land covers around 50% of the total area of Yancheng, which is known for its rich production of wheat, rice, and various other agricultural and sideline products such as watermelons, persimmons, grapes, and so on. In particular, the coastal saline paddy soil, represented by the soil between the Sheyang River and Huangshagang River, is extremely rich in potassium. This results in the rice having a pure, sweet, and unique taste, which is a product of geographical indication in China. In addition, watermelons, persimmons, and grapes in the study area are also famous local agricultural products. Therefore, sustaining and developing these distinctive agricultural and sideline industries poses serious challenges for protecting the quality and quantity of regional water resources.

2.1.2. Hydrogeology

Since the Pliocene, neotectonic movements in the Yancheng area have been dominated by subsidence [16]. Due to the interaction of the Yangtze River, the Yellow River, the Huai River, and the Yellow Sea in the historical period, a loose alluvium and marine deposit layer was formed that is rich in clay, subclay, and sandstone, with a thickness of more than 1000 m [21]. The artificial accumulation layer of the Quaternary Holocene is widely developed on the surface and contains significant amounts of clay and plant roots. Consequently, the water storage capacity is relatively low, and the permeability is poor, which inhibits the exchange of groundwater and surface water to a certain extent [13,17]. The groundwater was shallowly buried and dominated by pore water, which was rich in aquifers composed of silt, sand, or gravel. However, due to the low-lying and flat terrain in the region, the surface and underground runoff was very slow. Affected by factors such as water–rock interactions and evapotranspiration, some soils were salinized and swampy, while the groundwater also demonstrated salinization [16]. The roof burial depth of the rock group rich in high-quality, fresh water that can be developed and utilized was generally below 80–120 m, that is, the second and lower confined water aquifer group (Figure 1) [17].

2.2. Sample Collection and Analysis

In July and August of 2016, the spatial sampling of drinking well water was carried out in rural villages and coastal farms in Yancheng in the lower reaches of the Huai River. A total of 115 samples were collected (Figure 1). Although high-quality groundwater existed 80 to 240 m below the surface, the depth of the drinking water wells sampled was between 15 and 25 m due to technical and economic constraints, and the water bodies mainly came from the phreatic aquifer and the first layer of confined water [16]. To avoid the interference of factors such as standing water and evaporation in the well pipe, the sample collection was carried out 5 min after the well water was pumped. Before sampling, a 500 mL polyethylene sampling bottle was cleaned with deionized water. During sampling, the sampling bottle was rinsed with well water 3 to 4 times. After the sampling bottle was filled as much as possible and sealed with parafilm, it was stored at a low temperature and protected from light.
After the samples were transported to the State Key Laboratory of Cryosphere Science, Chinese Academy of Sciences, the TDS and electrical conductivity (EC) were measured using a DDS-307A conductivity meter (Made in Shanghai INESA Scientific Instrument Co., Ltd, China), and the pH value was measured using a PHSJ-3F pH meter(Made in Shanghai INESA Scientific Instrument Co., Ltd, China). The HCO3 was titrated with 0.01 mol/L hydrochloric acid [14]. After the sample was filtered through a 0.45 μm disposable nylon needle filter and diluted by the volumetric method, the anions (Cl, SO42−, and NO3) and cations (Na+, K+, Mg2+, and Ca2+) in the groundwater were determined using ICS-2500 and Dinex-600 ion chromatographs (Made in Thermo Fisher Scientific Inc., California, USA), respectively. In the process of testing, we added a volumetric dilution standard for every 15 samples to ensure that the errors of the dilution and measurement of the anion and cation concentration were within ±2% and ±3%, respectively [22]. In addition, the ion balance error indicated that 62.9% and 37.1% of the test samples were within ±5% and ±10%, respectively [1].

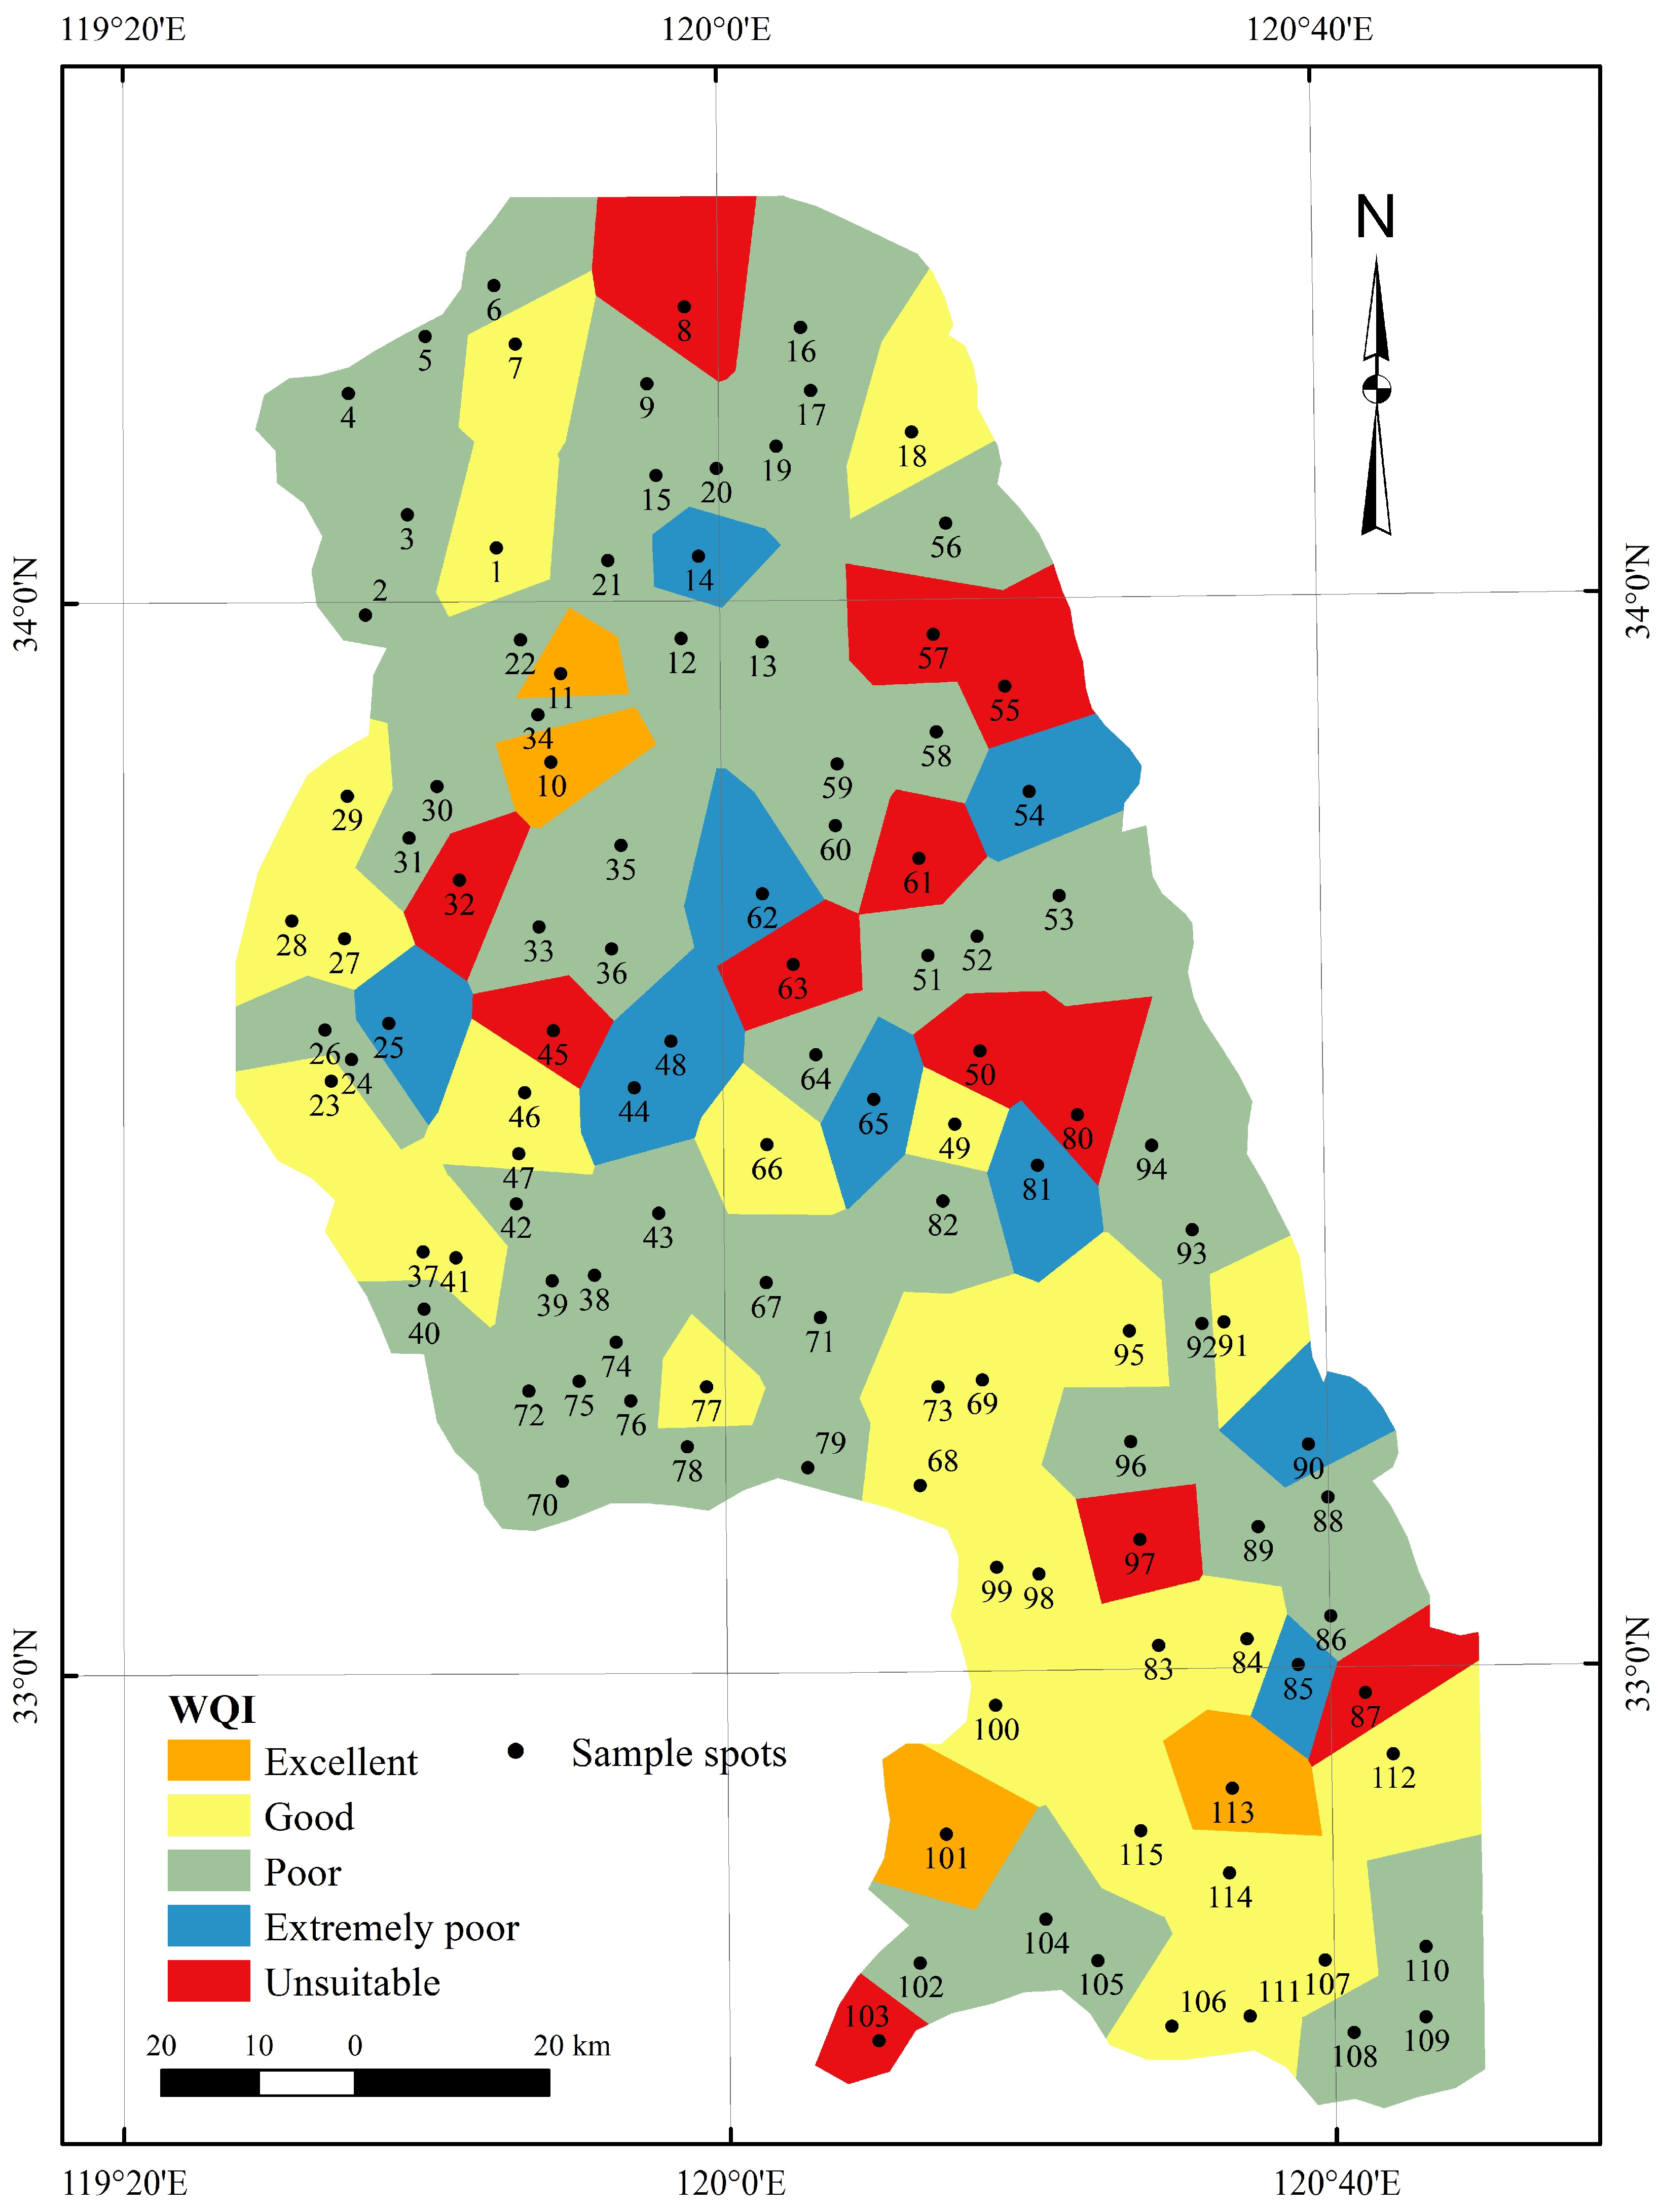
2.3. Water Quality Index for Drinking (DWQI)

The DWQI is a widely used drinking water quality assessment tool [6,10,11]. The calculated DWQI value was presented in five classification categories by ArcGIS 10.7 software: excellent water (DWQI < 50), good water (50 ≤ DWQI < 100), poor water (100 ≤ DWQI < 200), extremely poor water (200 ≤ DWQI < 300), and unsuitable for drinking water (DWQI > 300) [11,23]. The calculation process for the DWQI is as follows:
D WQI = i = 1 n ( Rw i × q i )
where Rwi is the relative weight of each chemical indicator, that is, the proportion of the weight value (wi) assigned to each chemical indicator (Equation (2)). The basis for assigning weights is that the degree of impact of the chemical indicators on primary health and hydrogeochemistry is represented by a value from 1 to 5. As the value increases, the impact of the corresponding chemical indicators on water quality also increases (Table 1). The groundwater quality level is represented by qi, which is determined by the measured value (Ci) of the chemical parameter in each water sample and the standard limit (Si) proposed by different organizations (Equation (3)). The Si used in this paper was derived from the Chinese Groundwater Quality Standard (GB/T 14848-2017).
Rw i = w i i = 1 n w i
q i = C i S i × 100

2.4. Integrated Irrigation Water Quality Index (IIWQI)

Many parameters were available for describing the quality of groundwater for irrigation purposes, including the ion concentration, TDS, pH, temporary hardness (TH, Equation (4)), and the ratio between the parameters. Given the duplication of different parameters to characterize the harmfulness of groundwater to soil or crops and the differences in the standard values defined by various regional institutions, this paper selected the TDS, SSP, SAR, RSC, MAR, PI, and other parameters for comprehensive evaluation; these indicators have been widely used [2,24,25]. In addition to the direct measurement of the TDS derived from water samples, other relevant parameters were calculated in Equations (5)–(9):
TH = ( Ca 2 + + Mg 2 + 2 ) × 100
where the TH is expressed in mg/L; the concentrations of Ca2+ and Mg2+ are expressed in meq/L.
Soluble   sodium   percentage : SSP = Na + + K + Ca 2 + + Mg 2 + + Na + + K + × 100 %
Sodium   adsorption   ratio : SAR = Na + Ca 2 + + Mg 2 + 2
Residual   sodium   carbonate : RSC = ( CO 3 2 + HCO 3 ) ( Ca 2 + + Mg 2 + )
Magnesium   adsorption   ratio : MAR = Mg 2 + Ca 2 + + Mg 2 + × 100
Permeability   index :   PI = Na + + HCO 3 Ca 2 + + Mg 2 + + Na + × 100
where the concentrations of all the ions are expressed in meq/L. The acceptable ranges of the above indicators are shown in Table 2.
Furthermore, the integrated irrigation water quality index (IIWQI) was used to systematically evaluate the groundwater quality [26,27,28], and the calculation formula was as follows:
IIWQI = 1 n   i = 1   n V i V si
where Vi is the concentration of the i-th observed variable or parameter, Vsi represents the standard guideline value of the respective parameter, and n represents the total number of selected parameters.
When IIWQ < 0.25, the irrigation water quality was “excellent”; when 0.25 ≤ IIWQI < 0.5, it was “good”; when 0.5 ≤ IIWQI < 0.75, it was “medium”; when 0.75 ≤ IIWQI < 1, it was “poor”; and when IIWQI > 1, it was “very poor and not suitable for irrigation” [26].

2.5. Chlor–Alkali Index

The excessive presence of Na+ in groundwater may be attributed to the cation exchange process, which plays a crucial role in groundwater chemistry. The identification of specific ion exchanges can be accomplished using the chlor–alkali index (CAI-I and CAI-II), a method proposed by Schoeller [29]. The equations for calculating the chlor–alkali index are as follows (Equations (11) and (12)):
CAI I = Cl ( Na + + K + ) Cl
CAI II = Cl ( Na + + K + ) HCO 3 + SO 4 2 + CO 3 2 + NO 3

3. Results

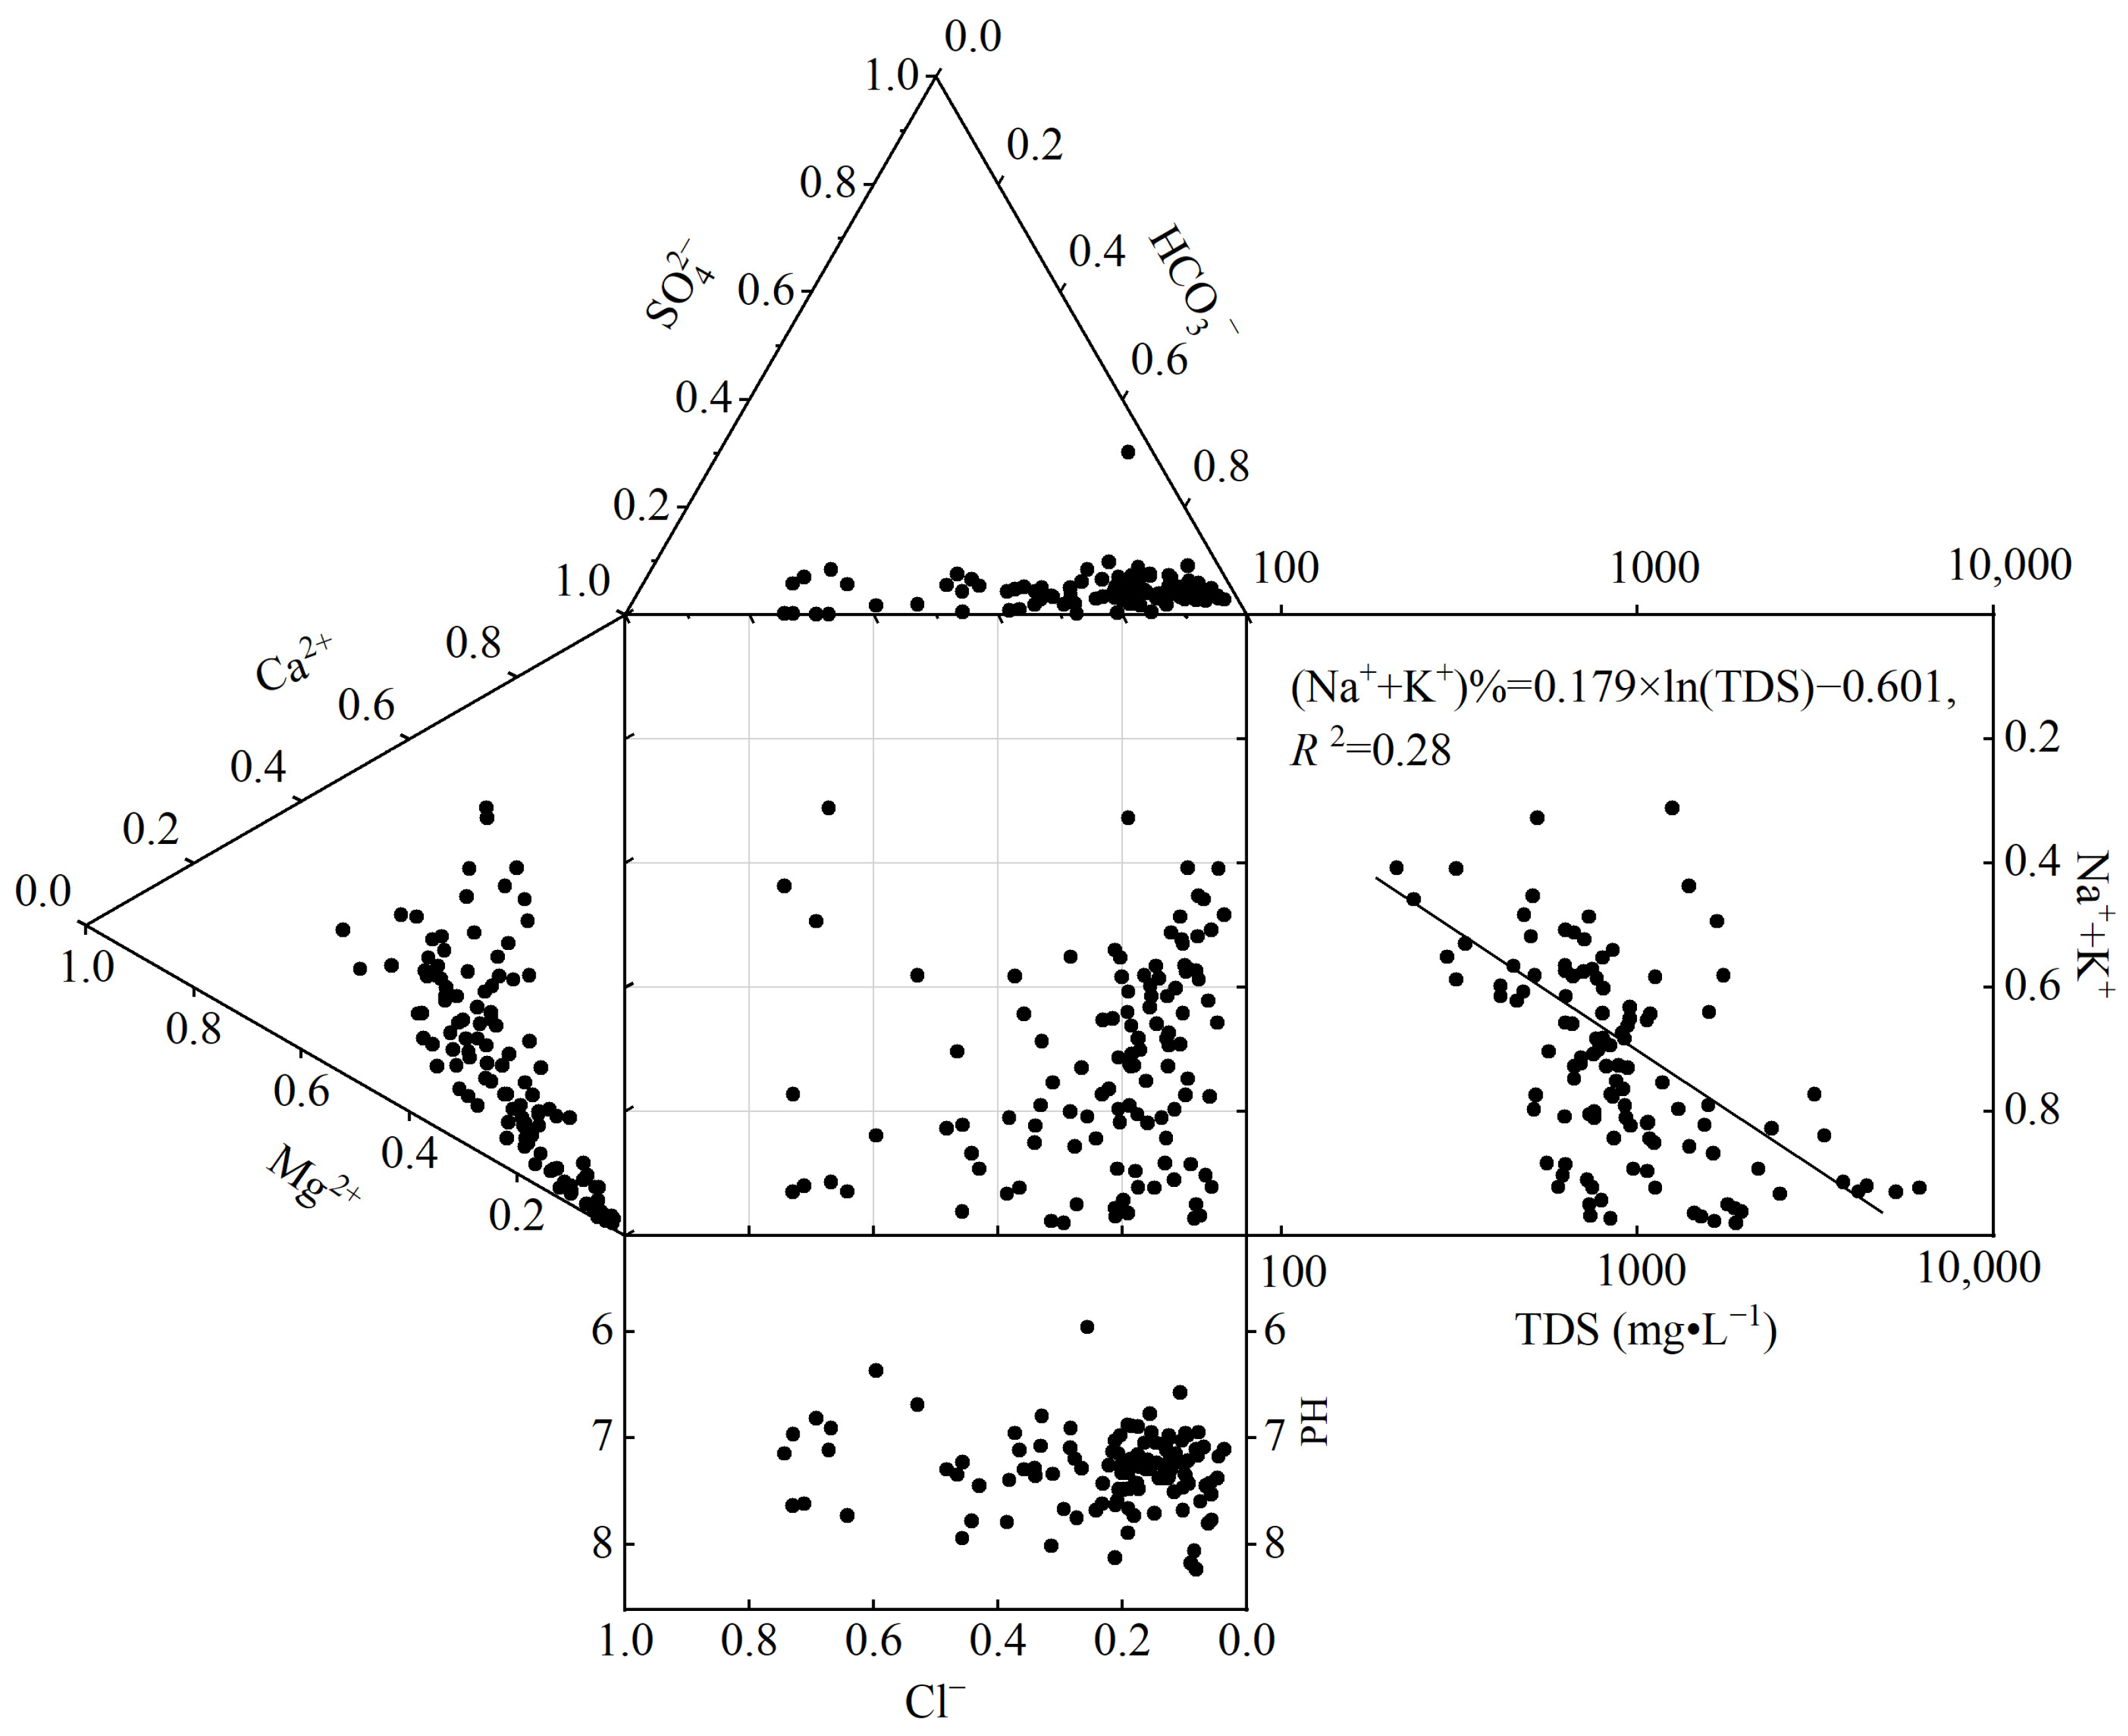
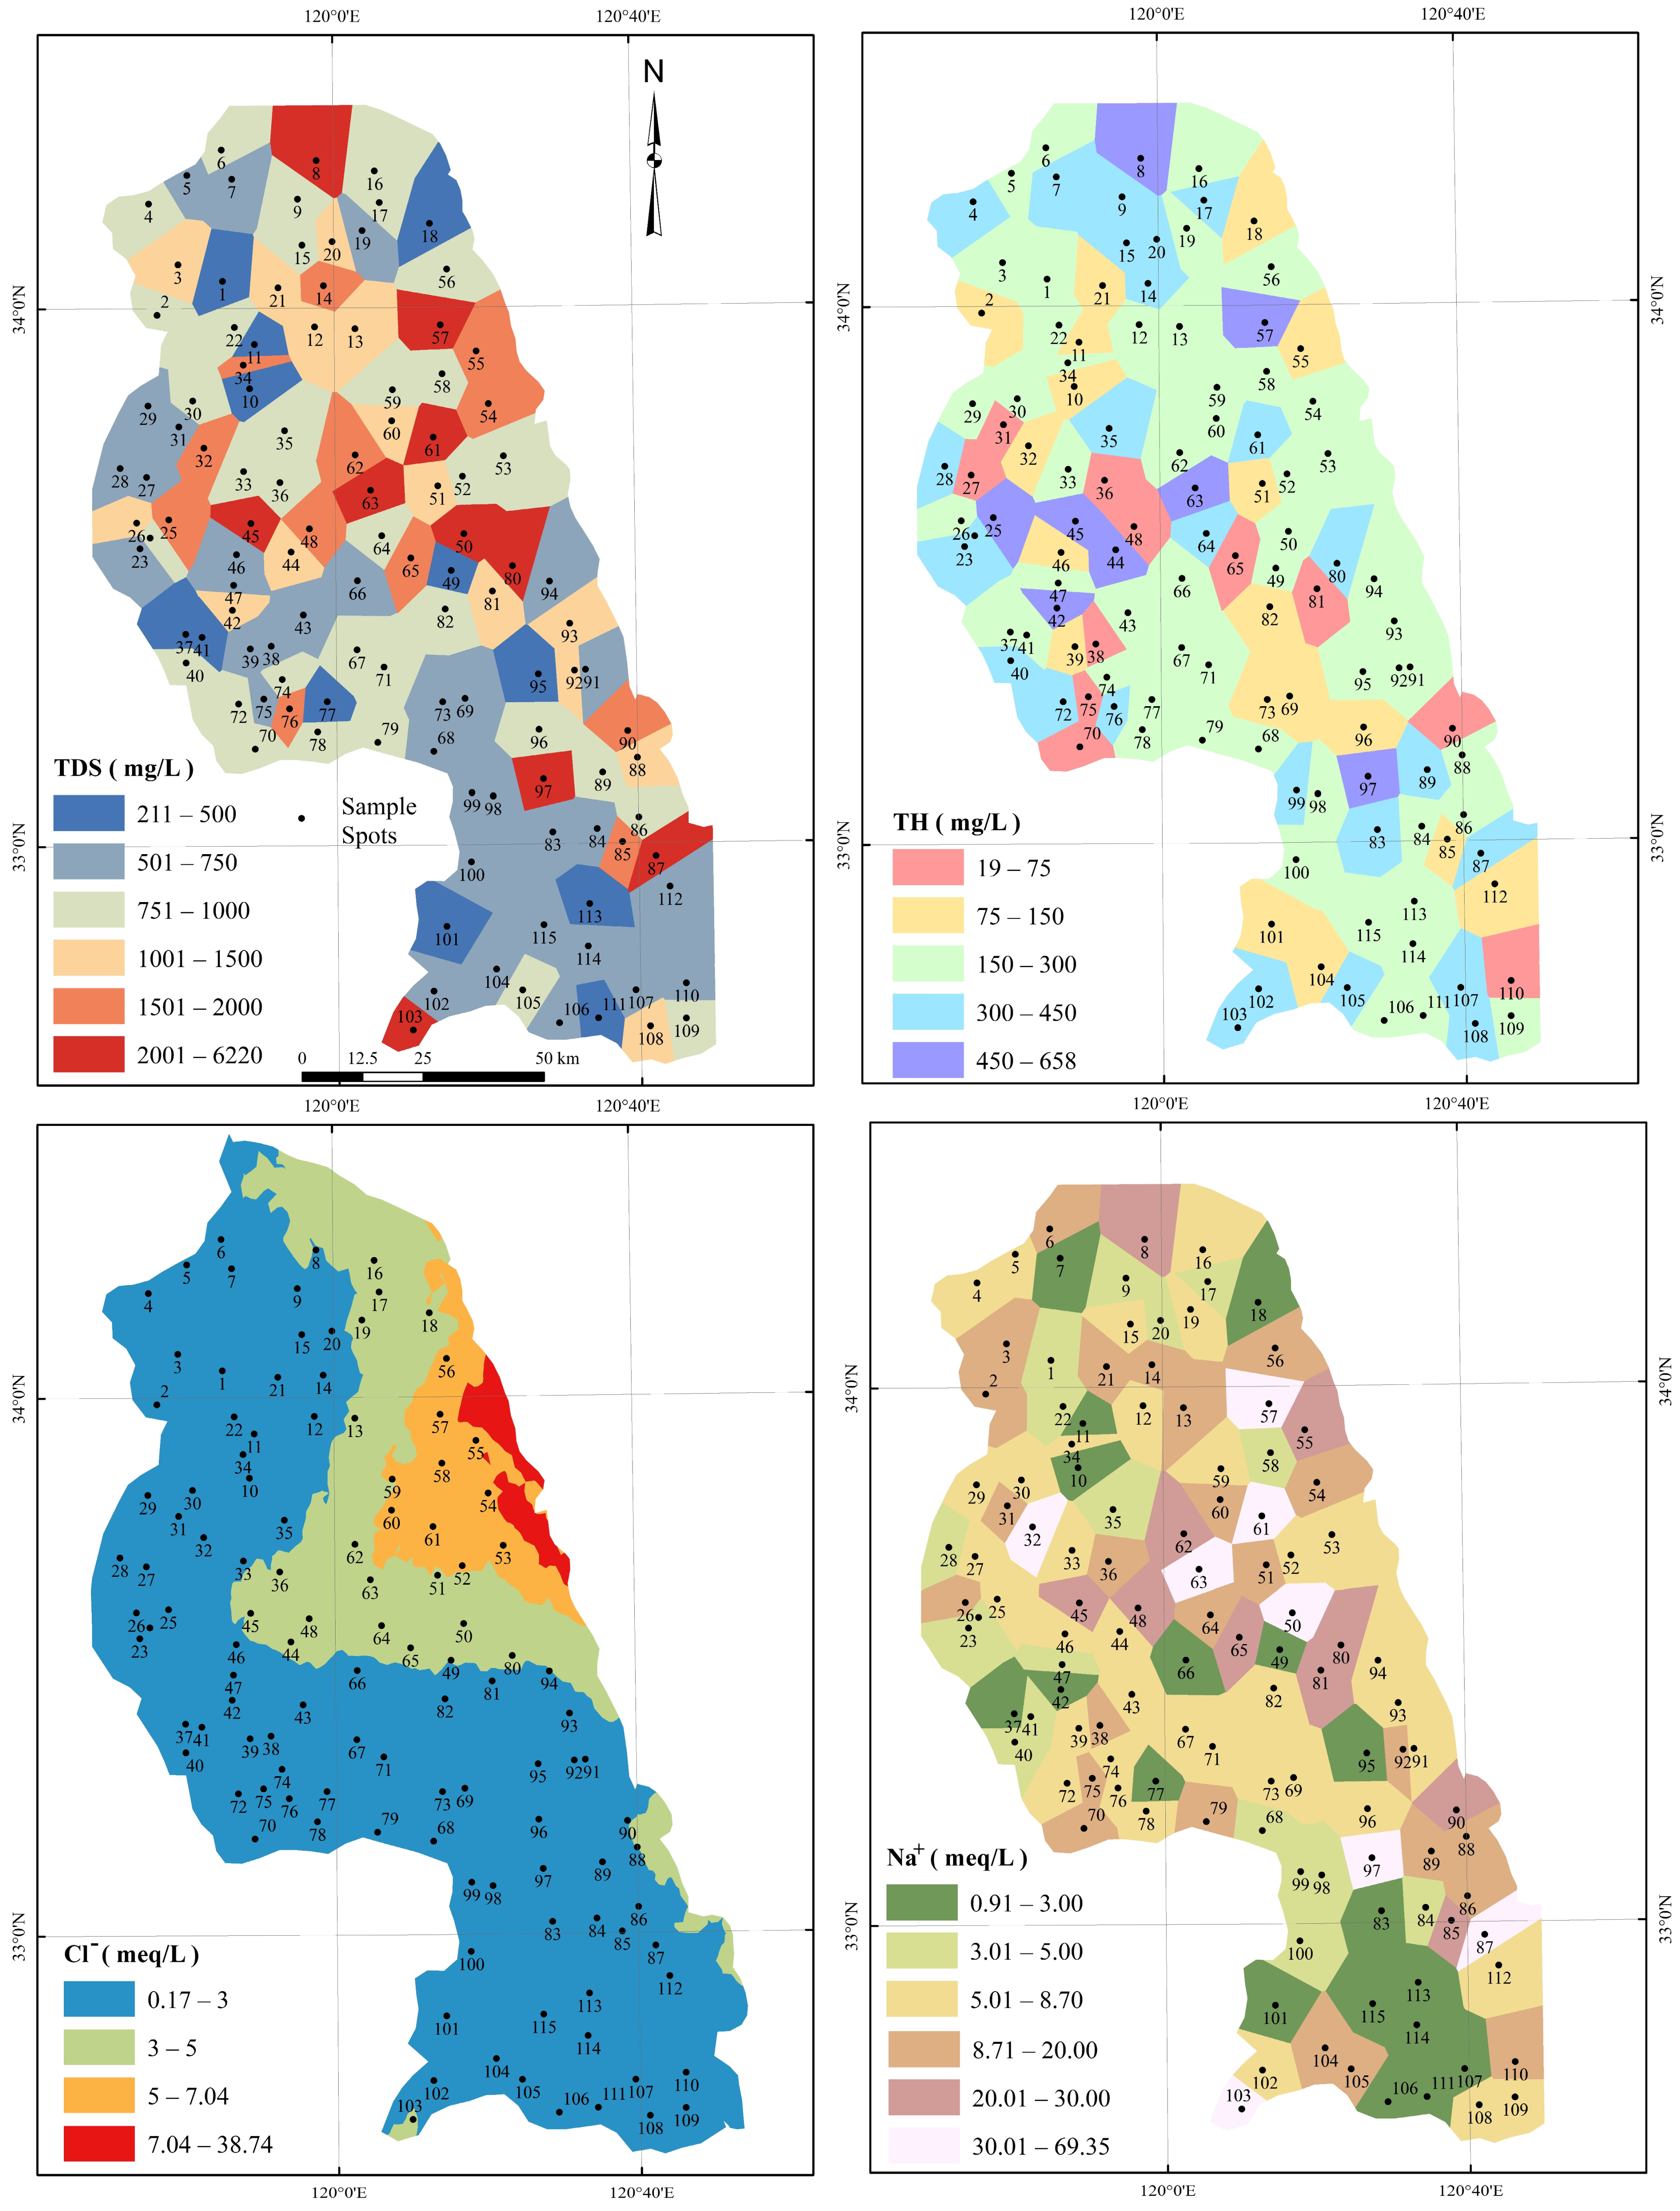
3.1. Groundwater Chemical Composition

The analysis of water chemical parameters provides valuable insights into the chemical composition of groundwater. In the Yancheng area, the groundwater was mostly neutral to slightly alkaline, with 81.74% of the total samples having a pH value greater than 7.0 (Figure 2). The TH ranged from 19.18 to 657.78 mg/L, with an average of 245.05 mg/L (Table 3). The TDS ranged from 117 to 4415 mg/L, with an average value of 1126.25 mg/L, which was similar to the shallow groundwater in the adjacent Nantong area [30]. However, the TDS was about 1.4 times higher than the shallow groundwater in the Guohe River basin in the upper reaches of the Huaihe River [31], indicating that water–rock interaction played a significant role during the formation and migration of groundwater in the Huaihe River Basin.
The anion was dominated by HCO3 (Figure 2), with an average concentration of 11.05 meq/L (Table 3), accounting for 67.68% of the total anion concentration (TZ), followed by Cl, with an average concentration of 4.45 meq/L, accounting for 27.28%. The concentrations of SO42− and NO3 were relatively low, accounting for only 4.09% and 0.97% of the TZ, respectively. Na+ dominated the cations, with an average concentration of 10.79 meq/L, accounting for 66.59% of the total cation concentration (TZ+). Second, the concentrations of Mg2+ and Ca2+ accounted for 18.53% and 11.70%, respectively. The K+ concentration was the lowest, accounting for only 3.16% of the TZ+. The ion concentration sequences of Cl > SO42− and Mg2+ > Ca2+ in the shallow groundwater of the Yancheng area were significantly different from that of the Guohe River basin in the upper reaches of the Huaihe River (SO42− > Cl and Ca2+ > Mg2+) [31], indicating that the formation mechanism of groundwater solutes in the upper and lower reaches of the Huaihe River could be different. Moreover, significant differences in the chemical parameters between samples were observed through CV, SD, and extreme values, which reflected the different chemical evolution processes of groundwater in the study area, and solute sources were controlled by multiple factors [1,10].

3.2. Groundwater Quality Assessment for Drinking Purposes

Compared to the groundwater quality standards of China (Table 1), only 1.74% of the samples in the Yancheng area had a low pH value, namely, samples No. 73 and No. 97 (Figure 1). The samples with an over-standard TDS accounted for 32.17% and were mainly distributed in the vicinity of the Sheyang River and Huangshagang River (Figure 3). The Ca2+ and Mg2+ concentrations are not defined by drinking water standards, but the associated TH thresholds (450 mg/L) are defined. The samples with a high TH in the study area were Nos. 8, 25, 42, 44, 45, 57, 63, and 97, accounting for 6.96% of the total samples. They were also distributed mainly near the Sheyang River.
The Cl concentration showed an increasing trend centered on the Huangsha Port in Sheyang County which could be caused by the infiltration of seawater or the leaching of residual marine materials [14,29]. As a result, the proportion of samples with an excessive Cl concentration reached 15.65% (Table 3). Both SO42− and NO3 in the groundwater could be supplied by human activities. In particular, NO3 often comes from agricultural fertilizers, domestic wastewater, and human and animal manure [32,33]. However, the concentrations of SO42− and NO3 in the study area were within the standard range.
The samples with excessive Na+ in the study area accounted for 37.39% of the total samples (Table 3) and were mainly distributed in the vicinity of the Sheyang River and Huangshagang River. There were significant differences in the spatial distribution of Na+ and Cl, indicating their different sources, as a key factor for the high Na+ concentration could be the weathering of albite-rich clay/subclay (Equation (13)) [33].
4 NaAlSi 3 O 8 + 4 CO 2 + 6 H 2 O 4 Na + + 4 HCO 3 -   + Al 4 ( Si 4 O 10 ) ( OH ) 8 + 8 SiO 2
Systematically considering the excessive physical and chemical parameters of the TDS, TH, pH, Na+, Cl, SO42−, and NO3 in the sample, the DWQI for groundwater drinking purposes could be obtained by Equations (1)–(3). Excellent-quality groundwater samples, accounting for 3.48% of the total samples, were distributed near the Subeiguangai River (sample numbers 10 and 11) and Dongtai River (sample numbers 101 and 103), possibly due to surface water seepage and dilution (Figure 4). Good-quality samples accounted for 26.09% and were mainly distributed in the inland areas near the Sheyang River and Huangshagang River and the south of the Xinyanjie River. The samples with poor water quality accounted for 51.30% and were mainly distributed to the north of the Xinyanjie River. The samples with extremely poor water quality, which were rendered unsuitable for drinking, accounted for 8.70% (sample numbers 14, 25, 44, 48, 54, 62, 65, 81, 85, and 90) and 10.43% (sample numbers 8, 32, 45, 50, 55, 57, 61, 63, 80, 87, 97, and 103), respectively. These samples could have been formed due to the effects of rock weathering [34] and residual seawater [14,33] or the salt-making residues of historical periods [35]. They were mainly distributed on both sides of the Xinyanjie River.

3.3. Groundwater Quality Assessment for Irrigation

High salinity and ion concentration in irrigation water not only affect the physical and chemical properties of the soil but also have a significant impact on the quality and yield of crops [36]. In the Yancheng area, the quality of the groundwater for agricultural irrigation purposes was evaluated mainly by indicators such as the TDS, SSP, SAR, RSC, MAR, and PI (Table 2).

3.3.1. TDS for Irrigation Purposes

The TDS content in groundwater not only affects soil water migration [26] but also the distribution of soil nutrients and enzyme activities [37] which, in turn, affect the growth and development of crops. Samples with excellent and good water quality (TDS < 1000 mg/L) in the study area accounted for only 67.82% of the total number of samples (Table 4). Doubtfully applicable and inapplicable samples accounted for 23.48% and 8.70%, respectively, and were primarily distributed in the production area of branded rice, located between the Abandoned Yellow River and the Huangshagang River.

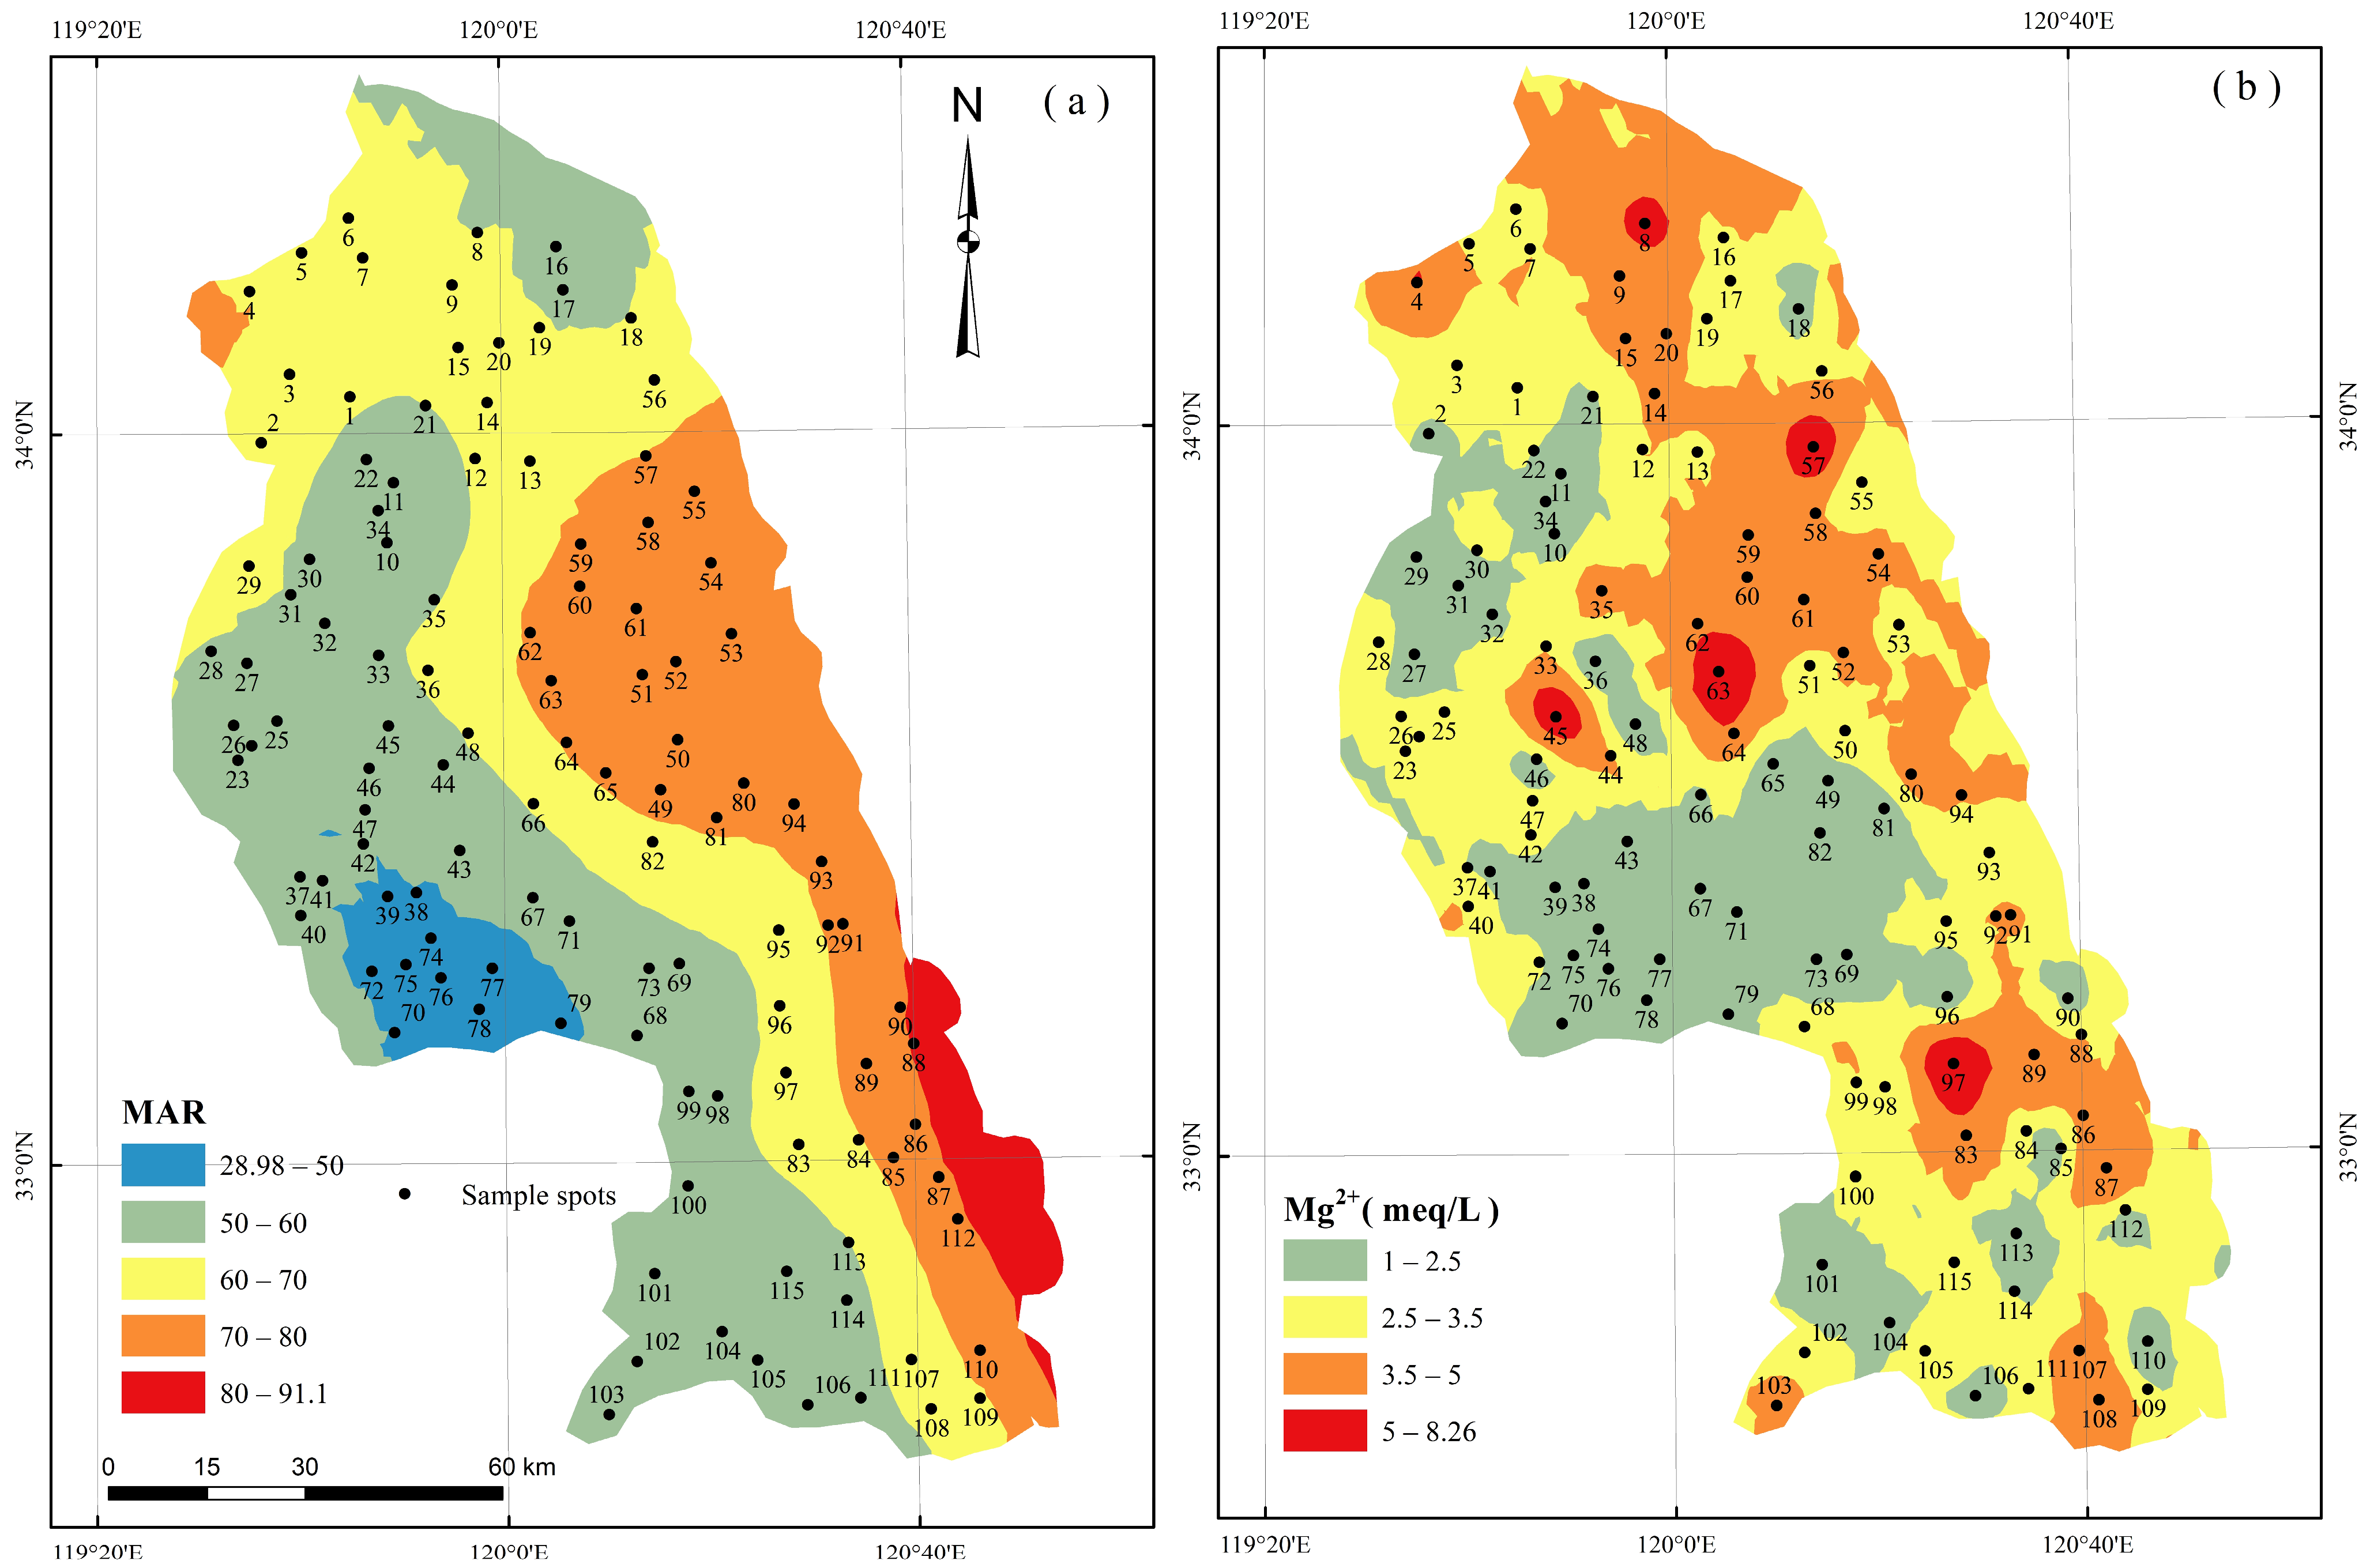
3.3.2. Magnesium Adsorption Ratio (MAR)

A high magnesium concentration in groundwater can destabilize the soil material composition, promote soil alkalinity, and reduce crop productivity [24]. The MAR ranged from 28.98 to 91.10, with an average value of 61.77, and 80.87% of the samples exceeded the threshold (MAR = 50) (Figure 5a). Additionally, the Mg2+ concentration ranged from 0.21 to 8.26 meq/L, with 60.87% of the samples exceeding the 2.5 meq/L (60 mg/L) groundwater quality standard for irrigation purposes (Figure 5b). The distribution of Mg2+ concentration was consistent with that of excessive MAR, and both exceeded the threshold except for the inland areas adjacent to the Xinyanjie River. This high concentration could be attributed to the weathering of low-abundance sedimentary magnesite (Equation (14)) [22].
MgCO 3 + CO 2 + H 2 O Mg 2 + + HCO 3

3.3.3. Residual Sodium Carbonate (RSC)

In nature, high concentrations of carbonate and bicarbonate may precipitate due to factors such as evaporation or saturation, thereby reducing soil porosity and permeability [36]. Secondly, the presence of excessive CO32− or HCO3 is often accompanied by a significantly higher concentration of Na+ and K+ than Cl, which will cause the organic matter in the soil to dissolve and cause the surface to be black when the soil dries. This excess (heavy) sodium carbonate is usually expressed as RSC [26]. Water samples smaller than 2.5 meq/L RSC in the study area accounted for only 18.26% (Table 4, Figure 6) and were distributed mainly near Jiulongkou Lake. The significantly higher concentration of HCO3 in 81.74% of the samples could be similar to the regionally higher concentration of Na+, which was the result of the carbonation of silicate in clay and subclay (Equation (13)) [22].

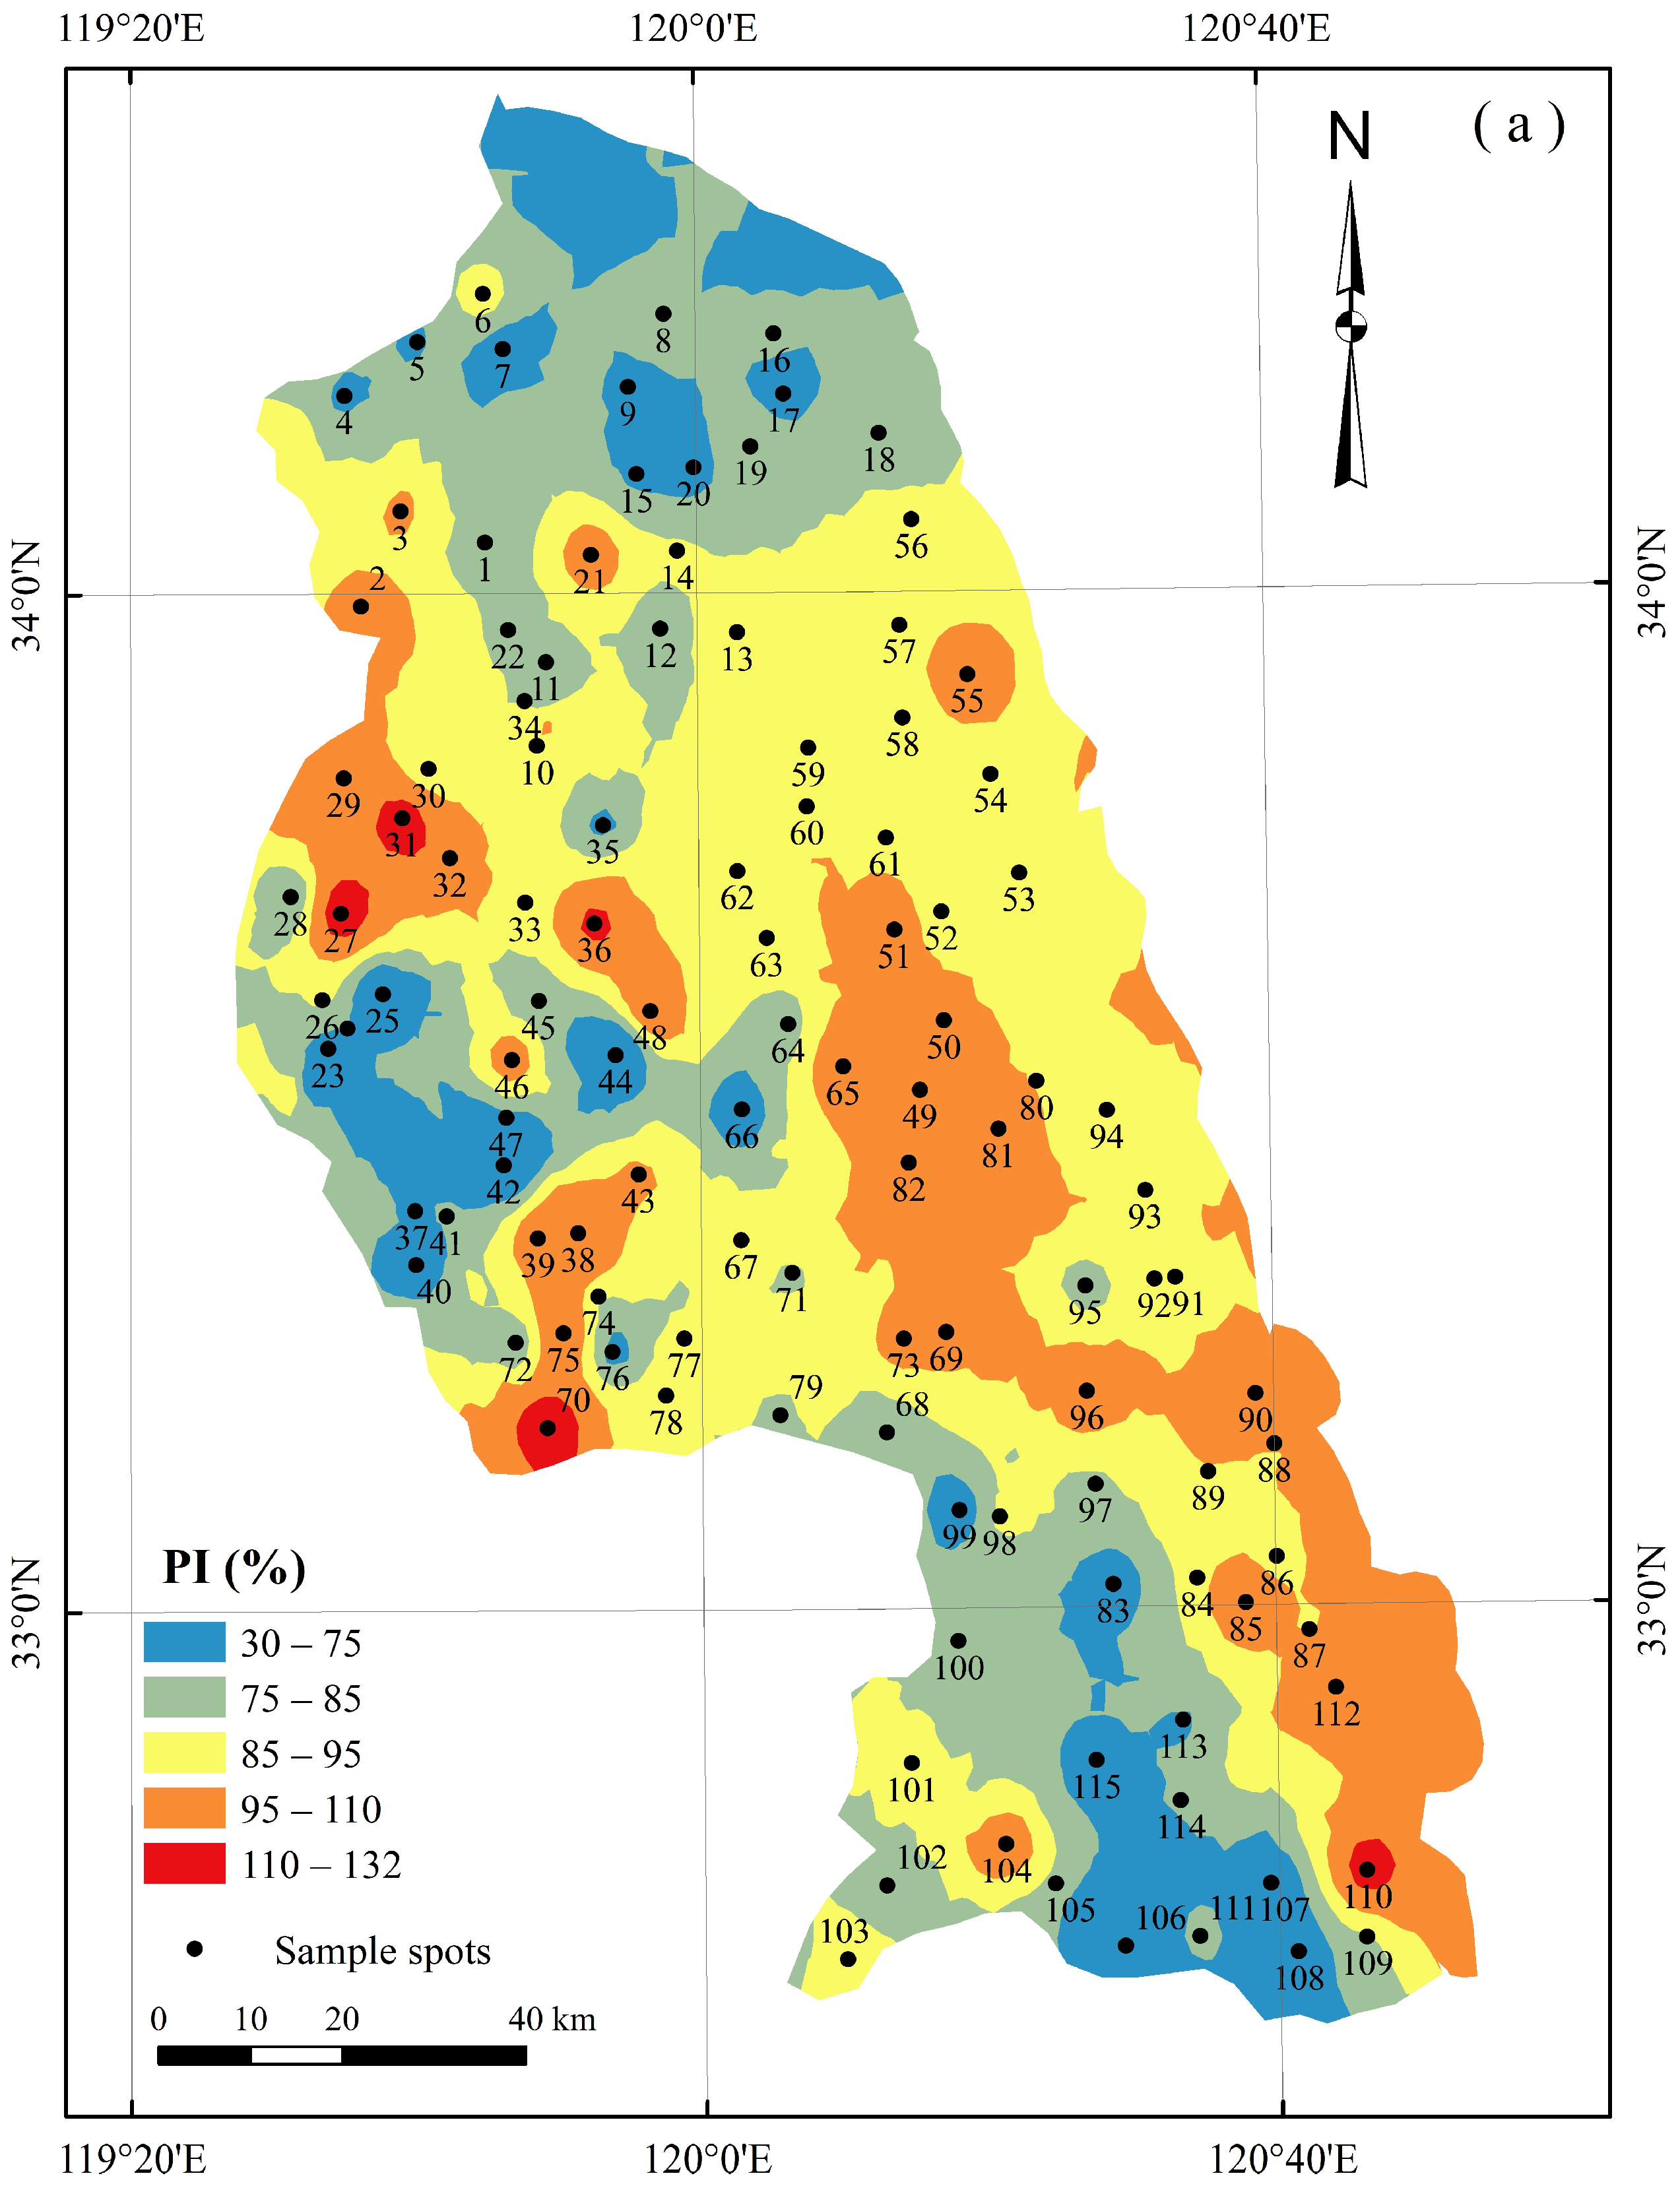
3.3.4. Permeability Index (PI)

The long-term use of water rich in Ca2+, Mg2+, Na+, K+, and HCO3 for irrigation may reduce soil permeability, destroy soil aggregate structure, promote soil compaction, and ultimately affect crop yields [26]. Therefore, the PI was introduced to evaluate the potential of soil moisture movement (permeability) [38]. In the Yancheng area, the PI ranged between 30.87 and 131.68, with an average of 87.23 (Table 4). The samples with good water quality, which were suitable for irrigation, accounted for 74.78%. The doubtful samples accounted for 25.22% and were distributed mainly in the vicinity of Jiulongkou Lake, the Abandoned Yellow River, and the Dongtai River (Figure 7a). In fact, the PI depended mainly on the exchange process of ion components in the water and soil. Therefore, the relationship between the total ion concentration (TIC) and the PI was plotted (Figure 7b), where Class I represents 100% permeability (suitable), Class II represents 75% permeability (doubtful), and Class III represents 25% permeability (unsuitable) [38,39]. The spatial distribution of the results is shown in Figure 7c. Groundwater samples that were suitable and doubtfully suitable for irrigation accounted for 13.04% and 60.00%, respectively, in the Yancheng area. The samples for which irrigation could significantly affect soil permeability were mainly distributed on sides of the Tongyu Canal, north of the Xinyanjie River, and near the mouths of the Dongtai River and Subei Irrigation River and accounted for 27% of the total samples.

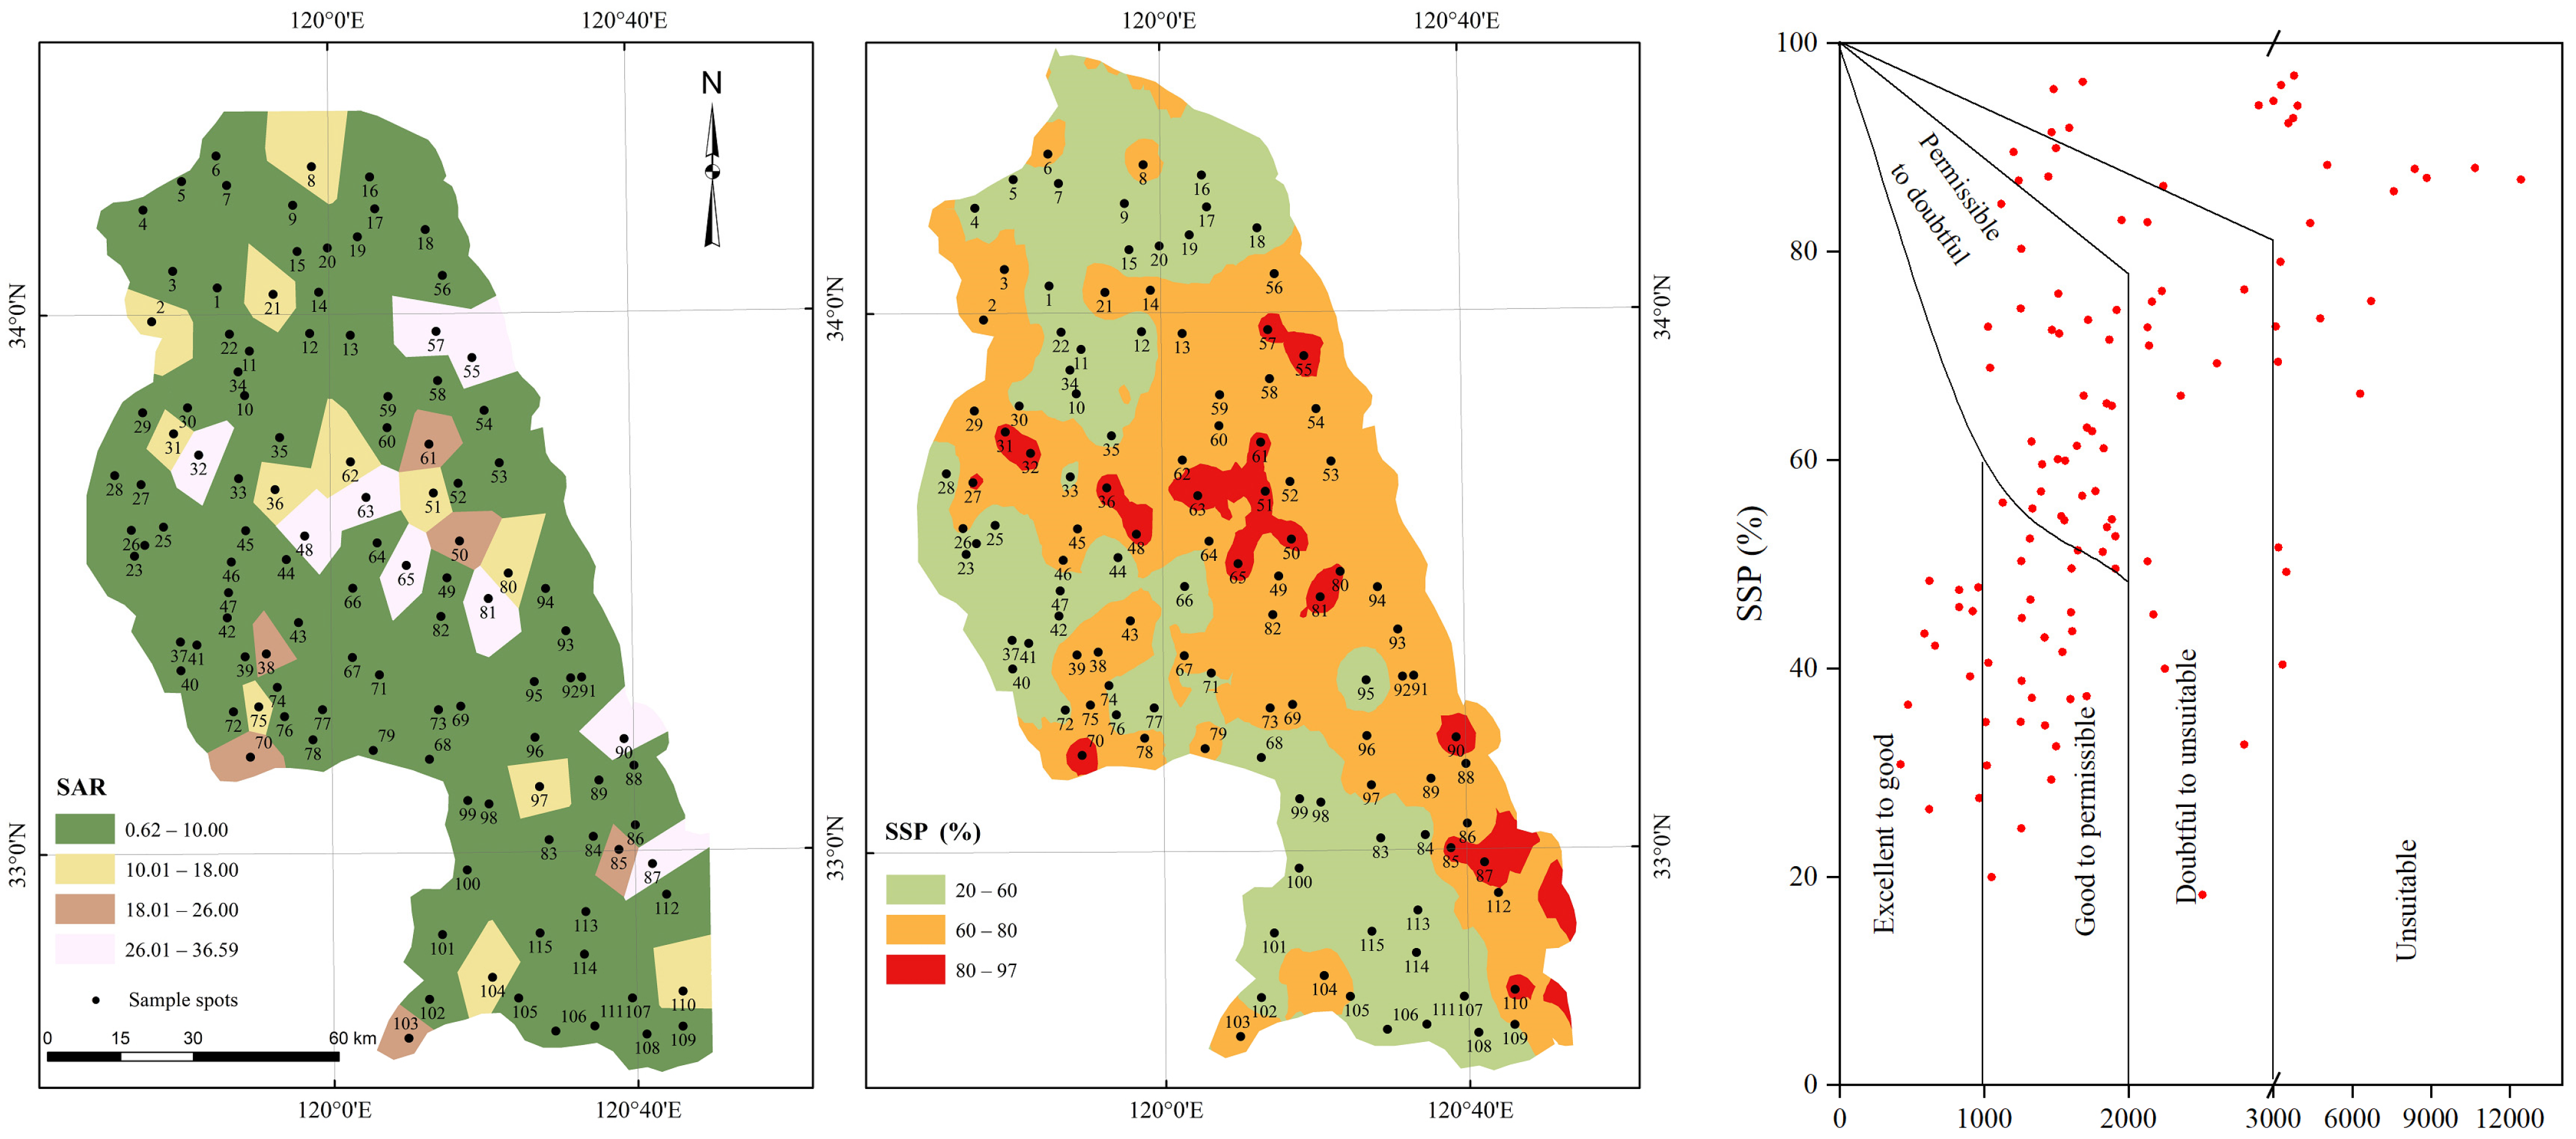
3.3.5. Sodium Adsorption Ratio (SAR)

The SAR is one of the most important indicators for measuring the harm of sodium or alkali when evaluating the suitability of groundwater for irrigation [26,40]. Although the groundwater in the Yancheng area is rich in Na+, the clay and subclay minerals in the alluvial and silt layers are also rich in sodium–potassium feldspar debris [16], leading to Na+ + K+ enrichment on Ca2+ + Mg2+ [22]. This further enhances the influence of Na+ on the soil layer [40,41], such as destroying the soil structure and aggregates, promoting soil compaction, leading to hard soil, and reducing the soil air and water permeability. Samples with a SAR ranging from 0 to 18, which were suitable for irrigation purposes, accounted for 86.95% (Table 4), while samples with a SAR greater than 26, which were not suitable for irrigation, accounted for 7.83% (Nos. 32, 48, 55, 57, 63, 65, 81, 87, and 90) and were distributed mainly on the seaward side of marine sediments formed in the past 4000 years (Figure 8) [22].
Furthermore, the Na hazard was further evaluated by the SSP. In the Yancheng area, 49.57% of the samples with an SSP value below 60% were suitable for irrigation, and these were mainly distributed in inland areas far from the sea and the adjacent areas of the Abandoned Yellow River. Meanwhile, samples with an SSP value of more than 80% were unsuitable for irrigation and accounted for 23.48%, and their distribution was similar to the distribution of samples with an over-standard SAR (Figure 8). Therefore, a comprehensive classification of the groundwater for irrigation purposes was carried out using the electrical conductivity (EC) vs. the SSP diagram (Wilcox diagram). The results showed that only 5.22% and 24.35% of the samples belonged to the “excellent to good” and “good enough to permissible” categories; 30.43% and 15.65% of the samples belonged to the “permissible to doubtful” and “doubtful to unsuitable” categories, respectively; 24.35% of the samples were not suitable for irrigation, and their distribution was also similar to SAR.

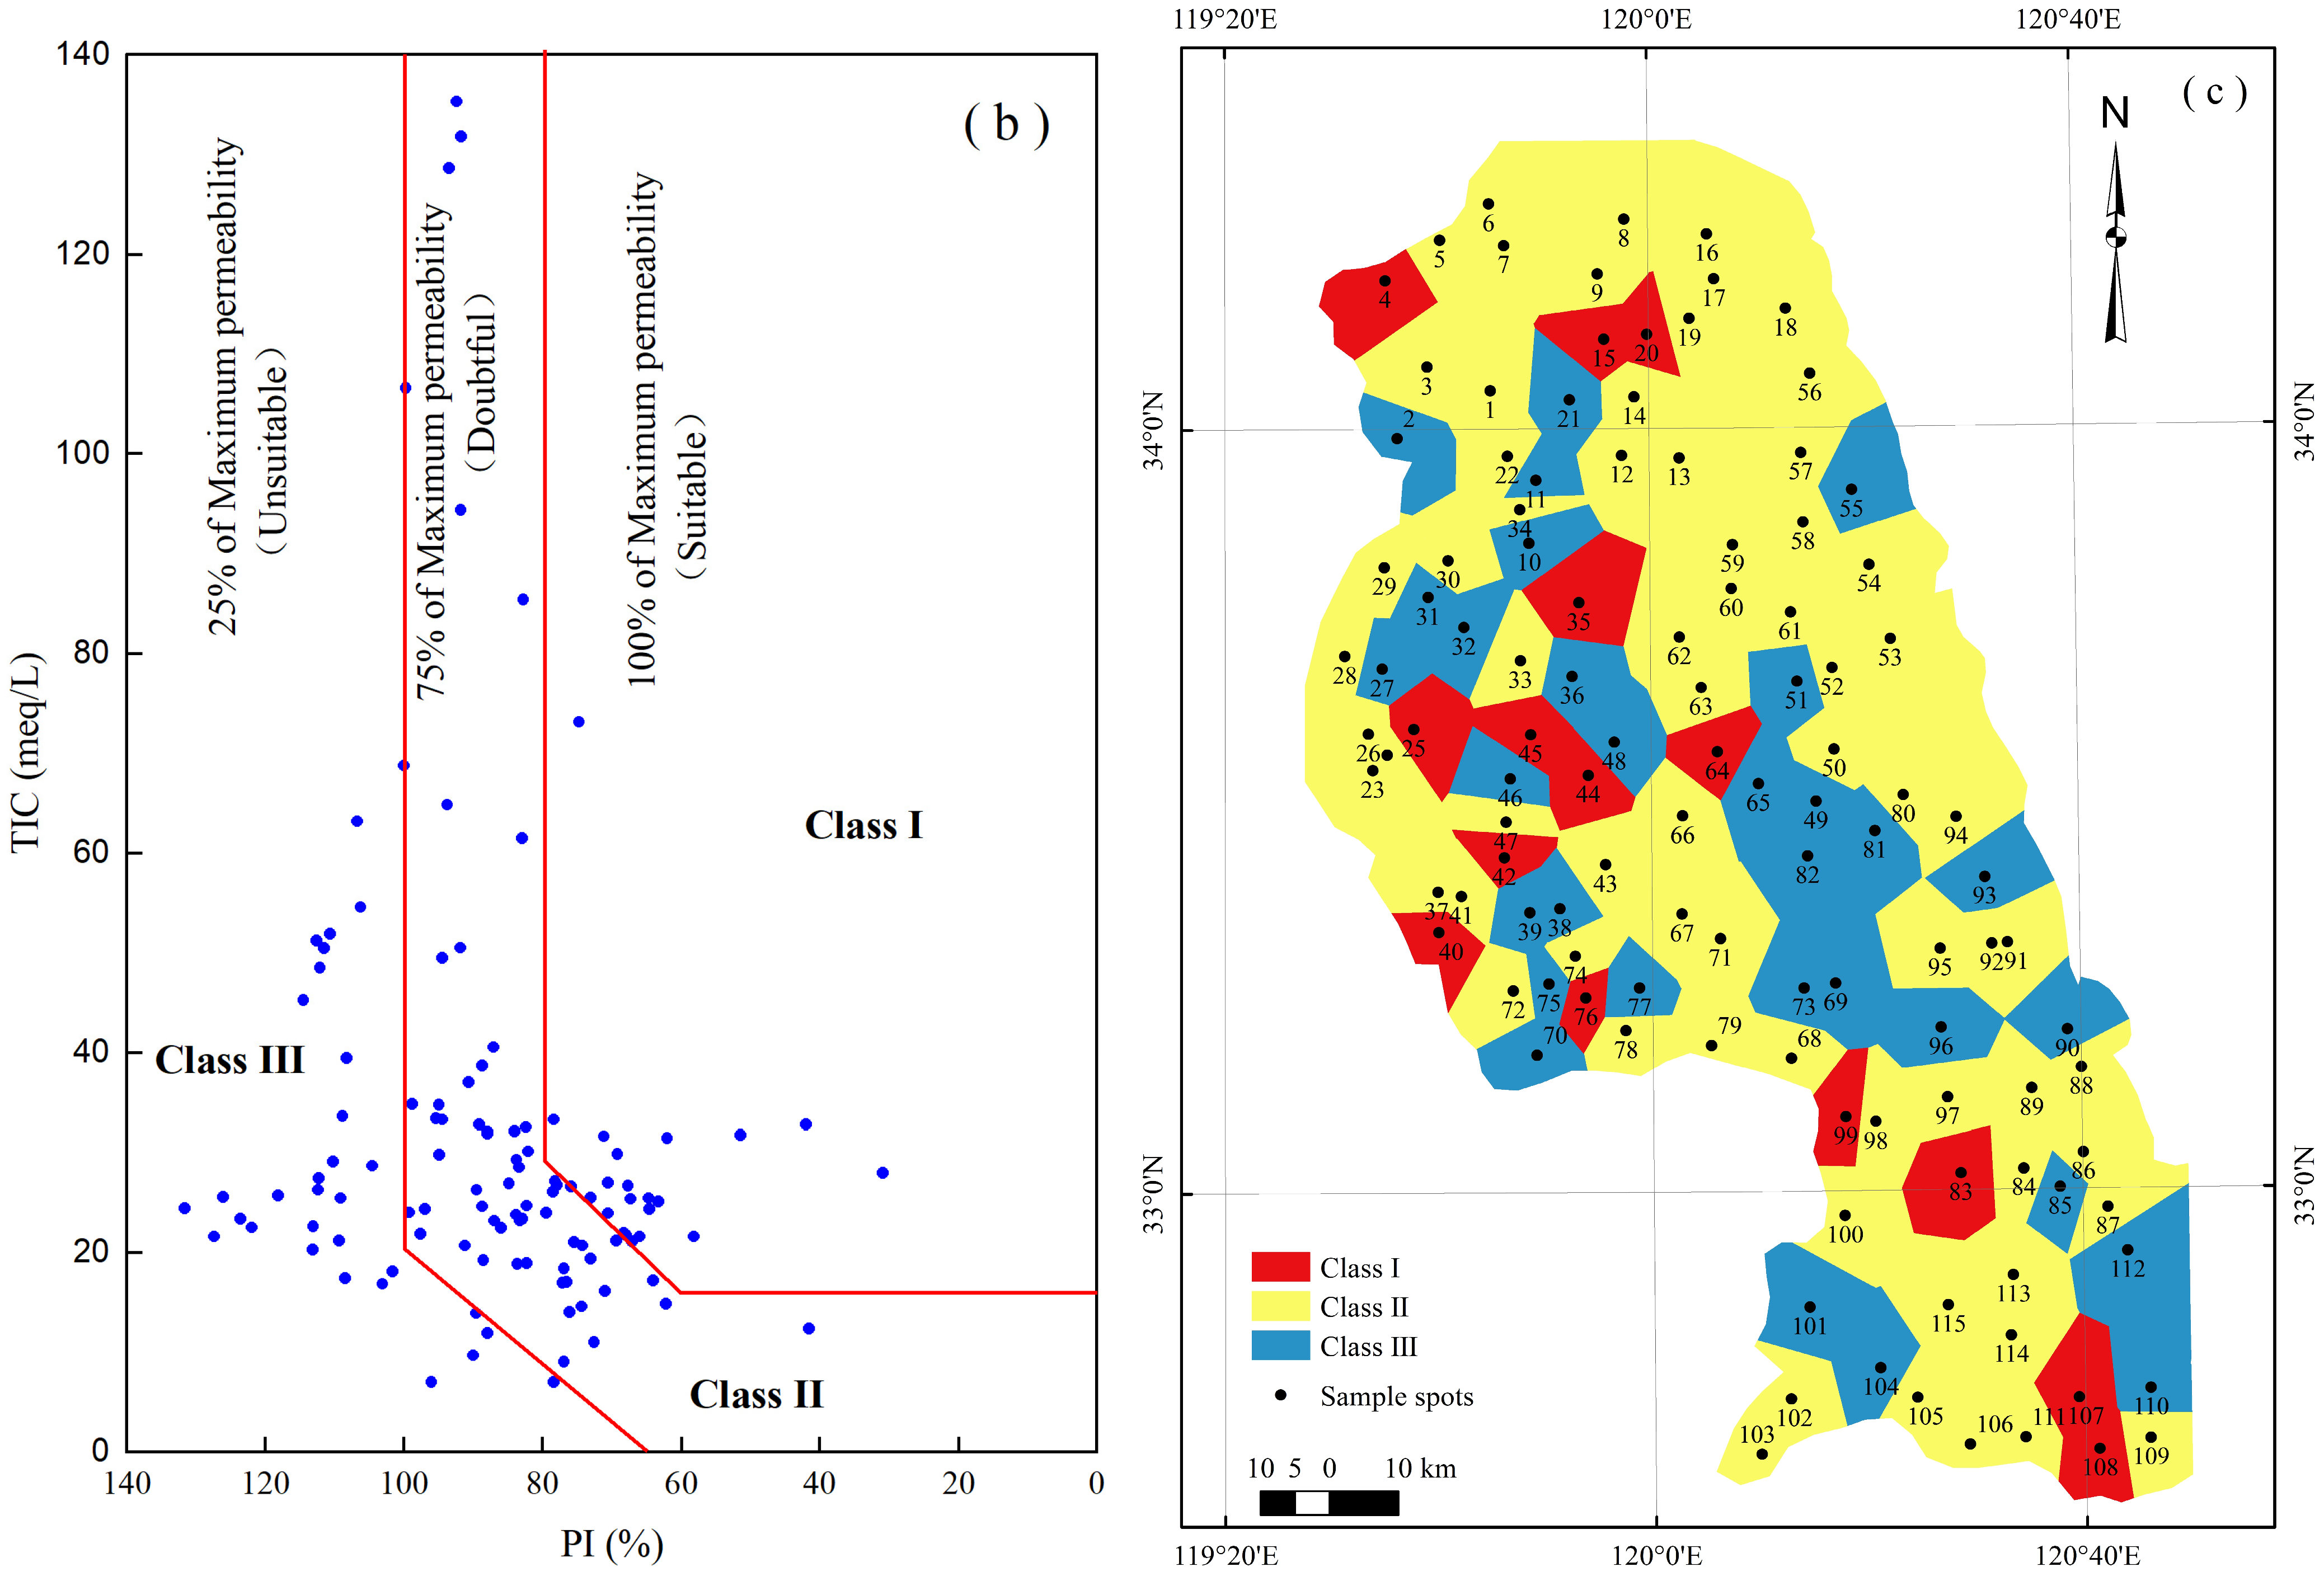
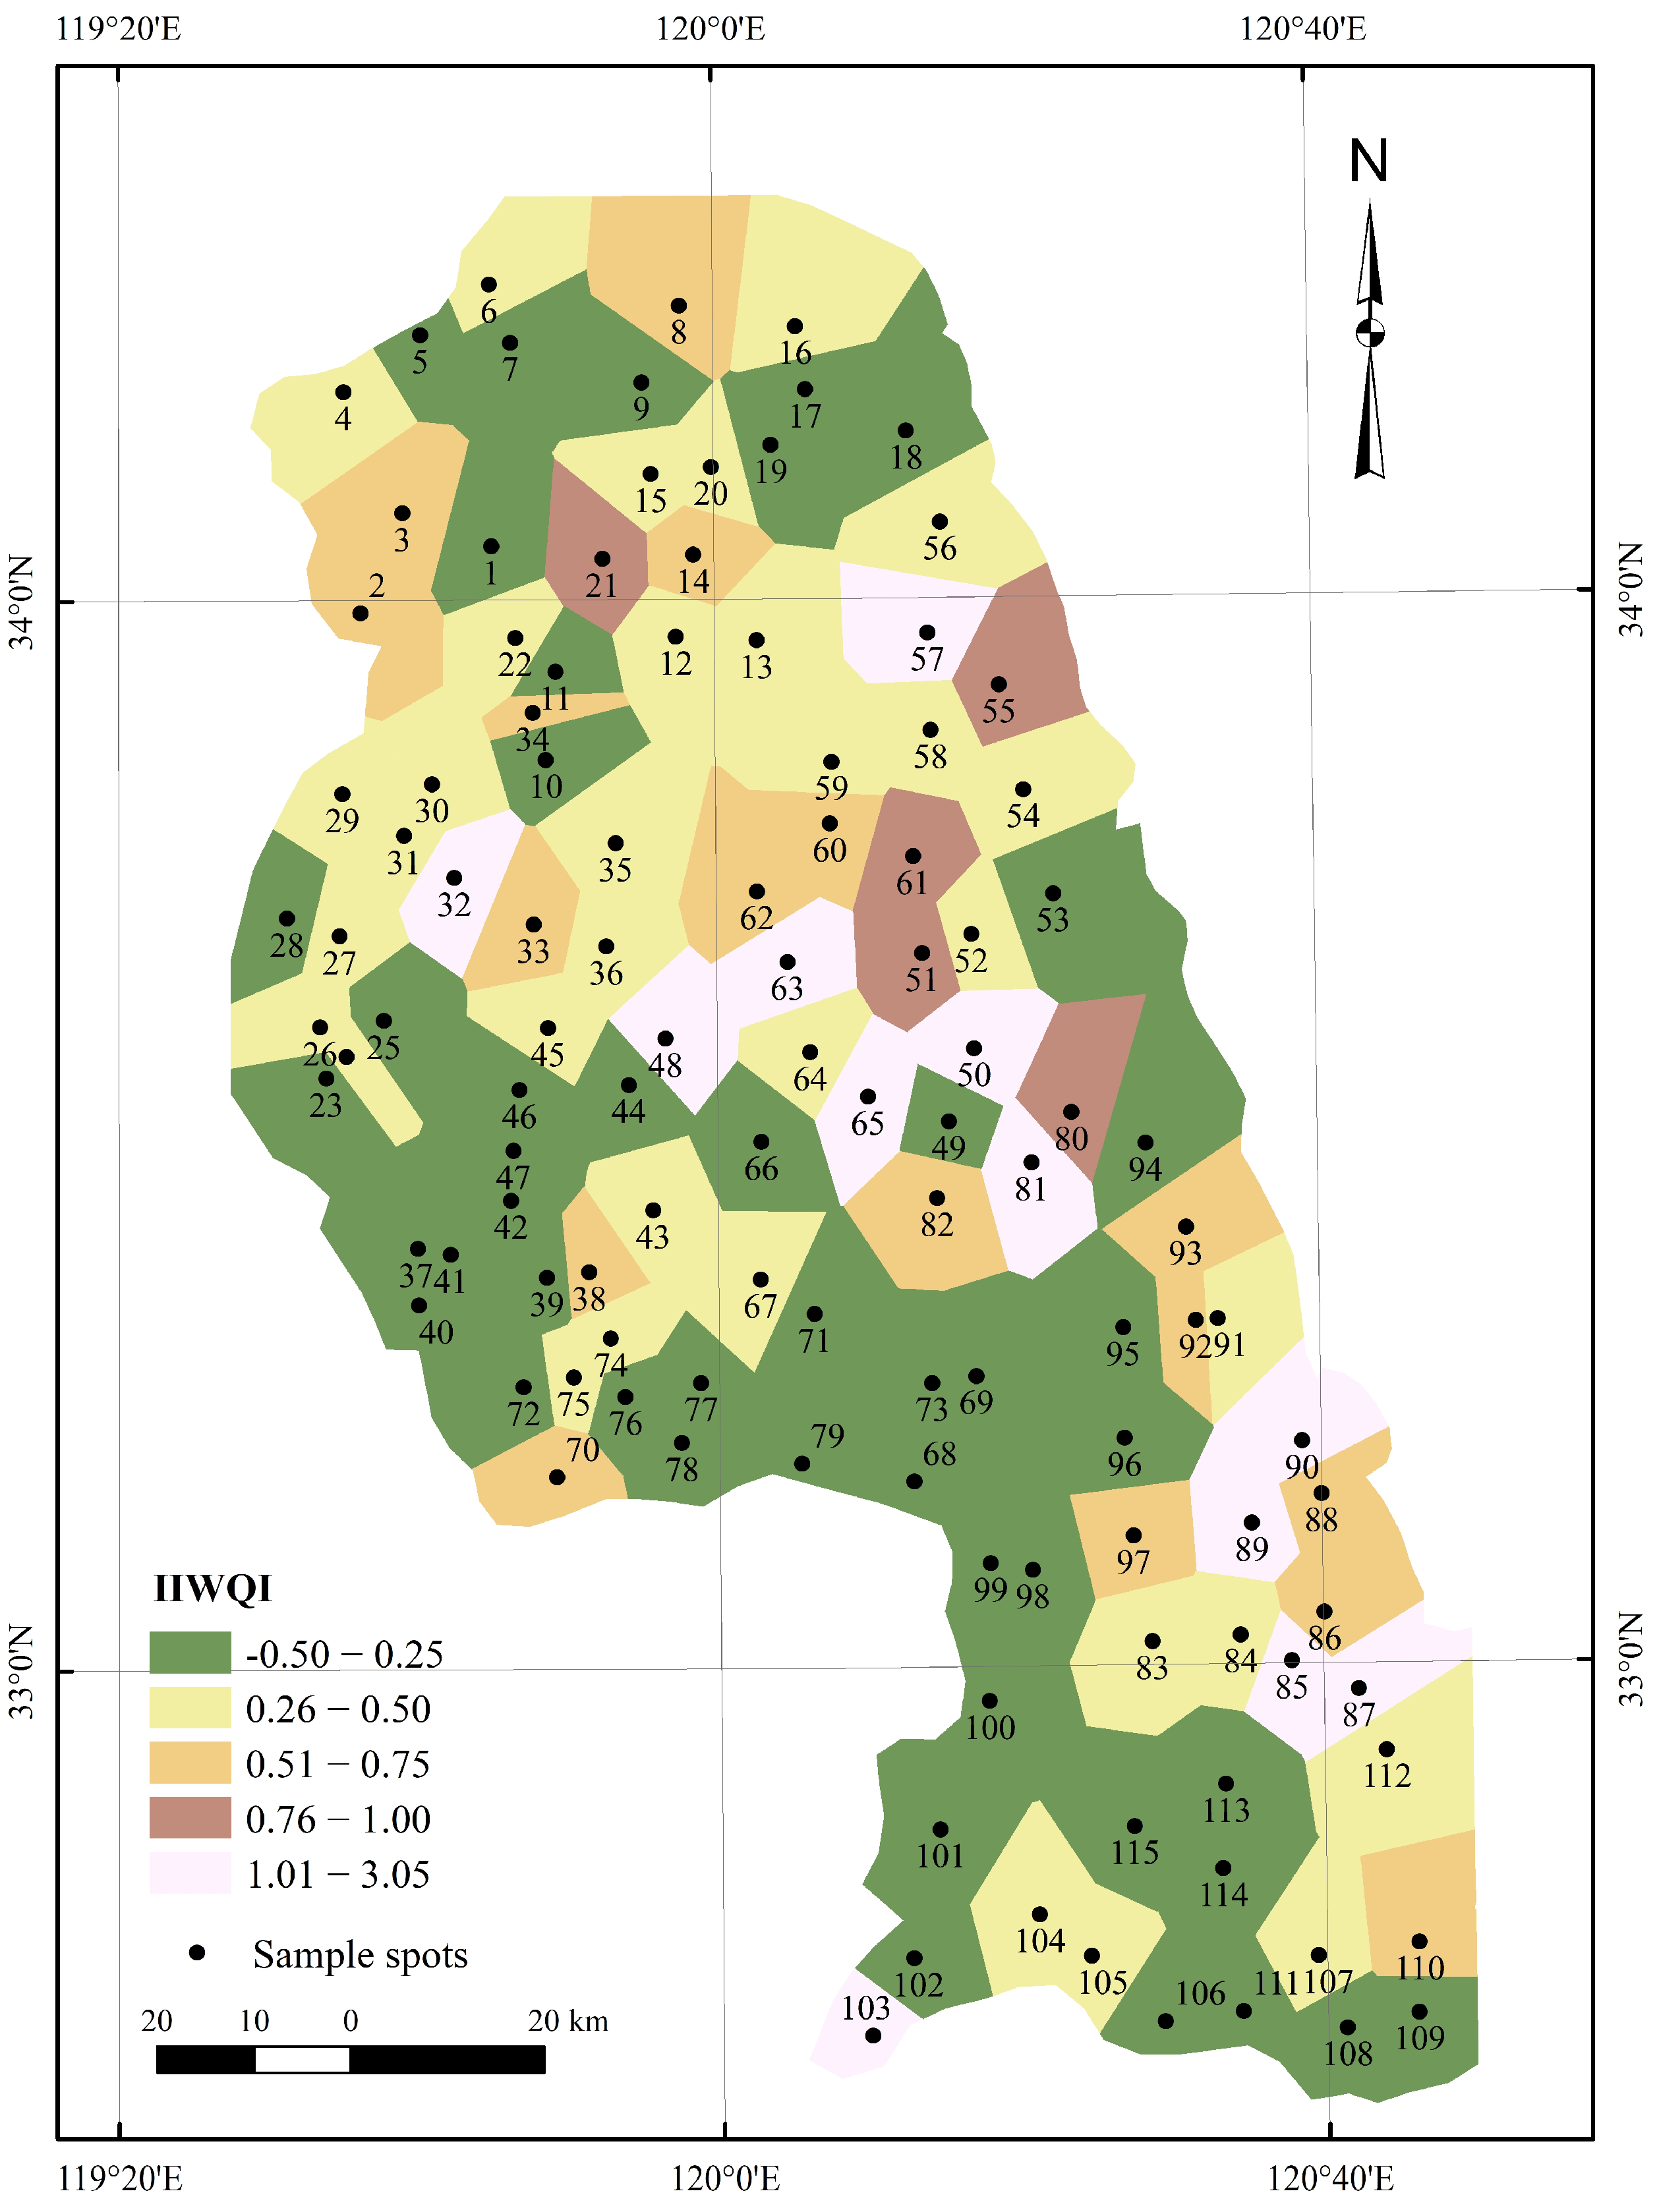
3.3.6. Integrated Irrigation Water Quality Index (IIWQI)

The IIWQI, calculated using Equation (10), showed that samples with “excellent” and “good” water quality accounted for 40.87% and 29.57%, respectively, and were mainly distributed in the western inland area and near the river channel (Figure 9). The samples with “medium” water quality accounted for 14.78%. The samples with “poor” water quality and which were “unsuitable” for irrigation accounted for 4.35% and 10.43%, respectively, and were distributed mainly on both sides of the Tongyu Canal, north of the Xinyanjie River, and near the mouths of the Xinyanjie River.

4. Discussion

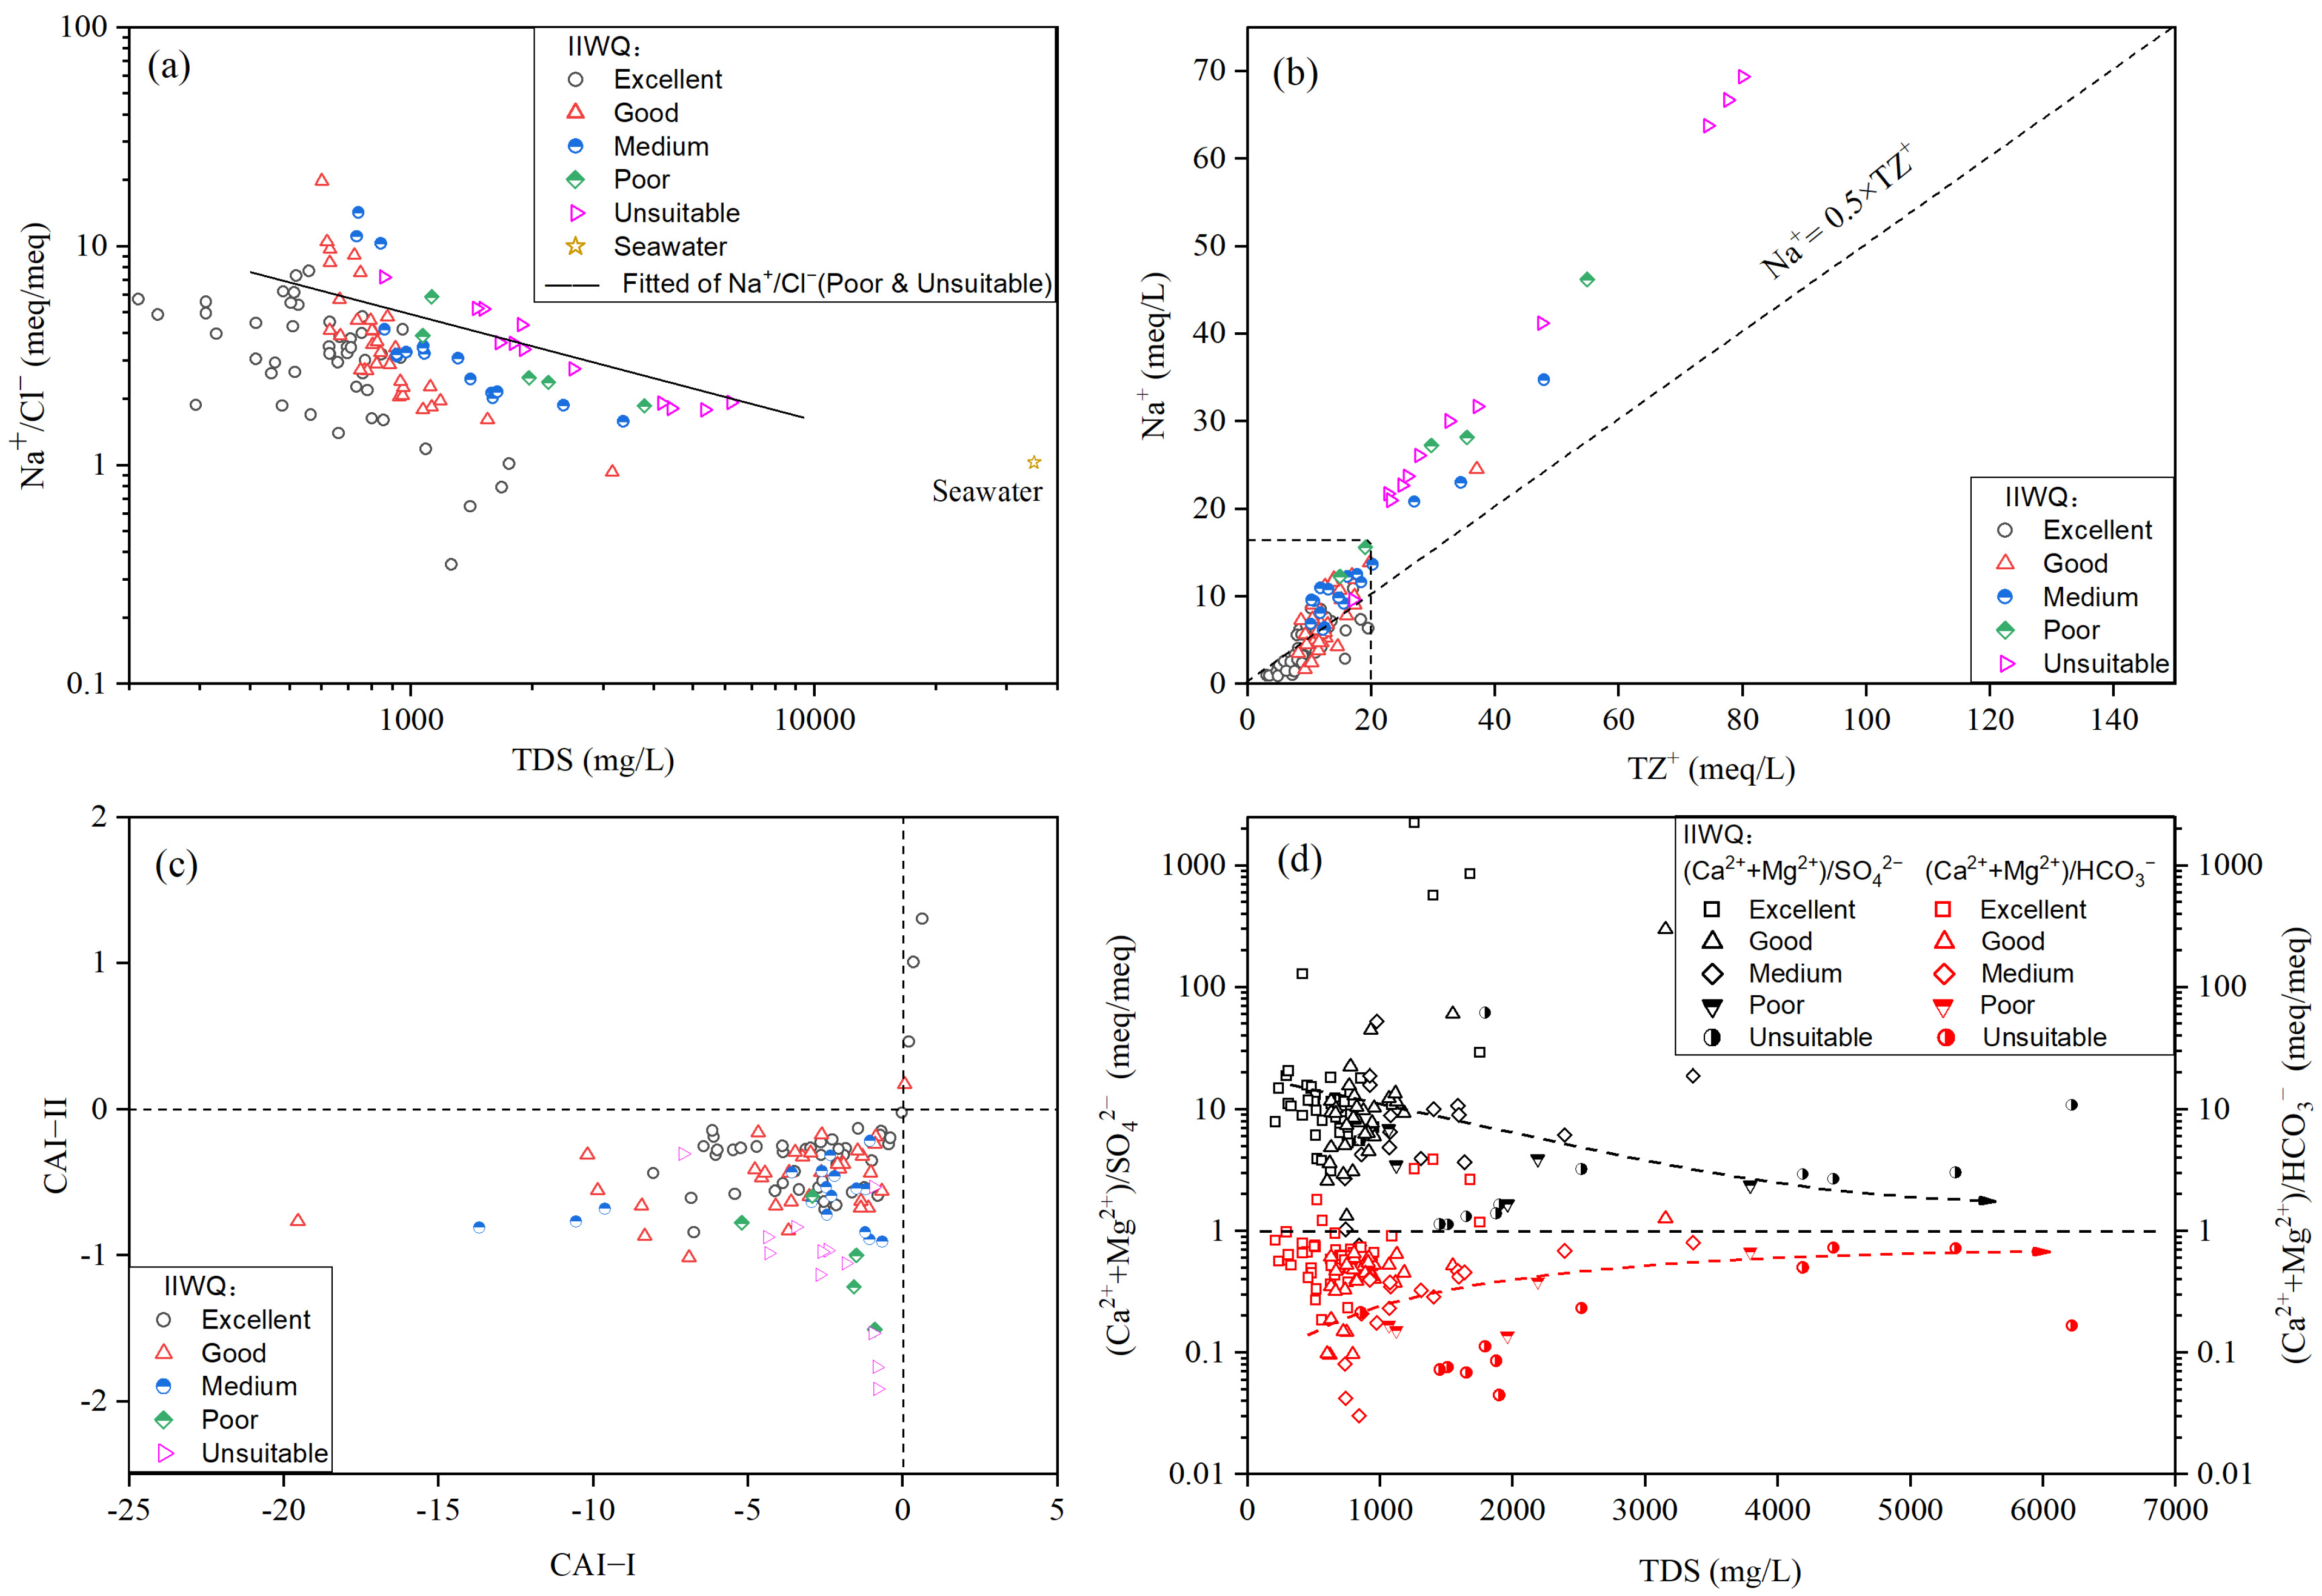
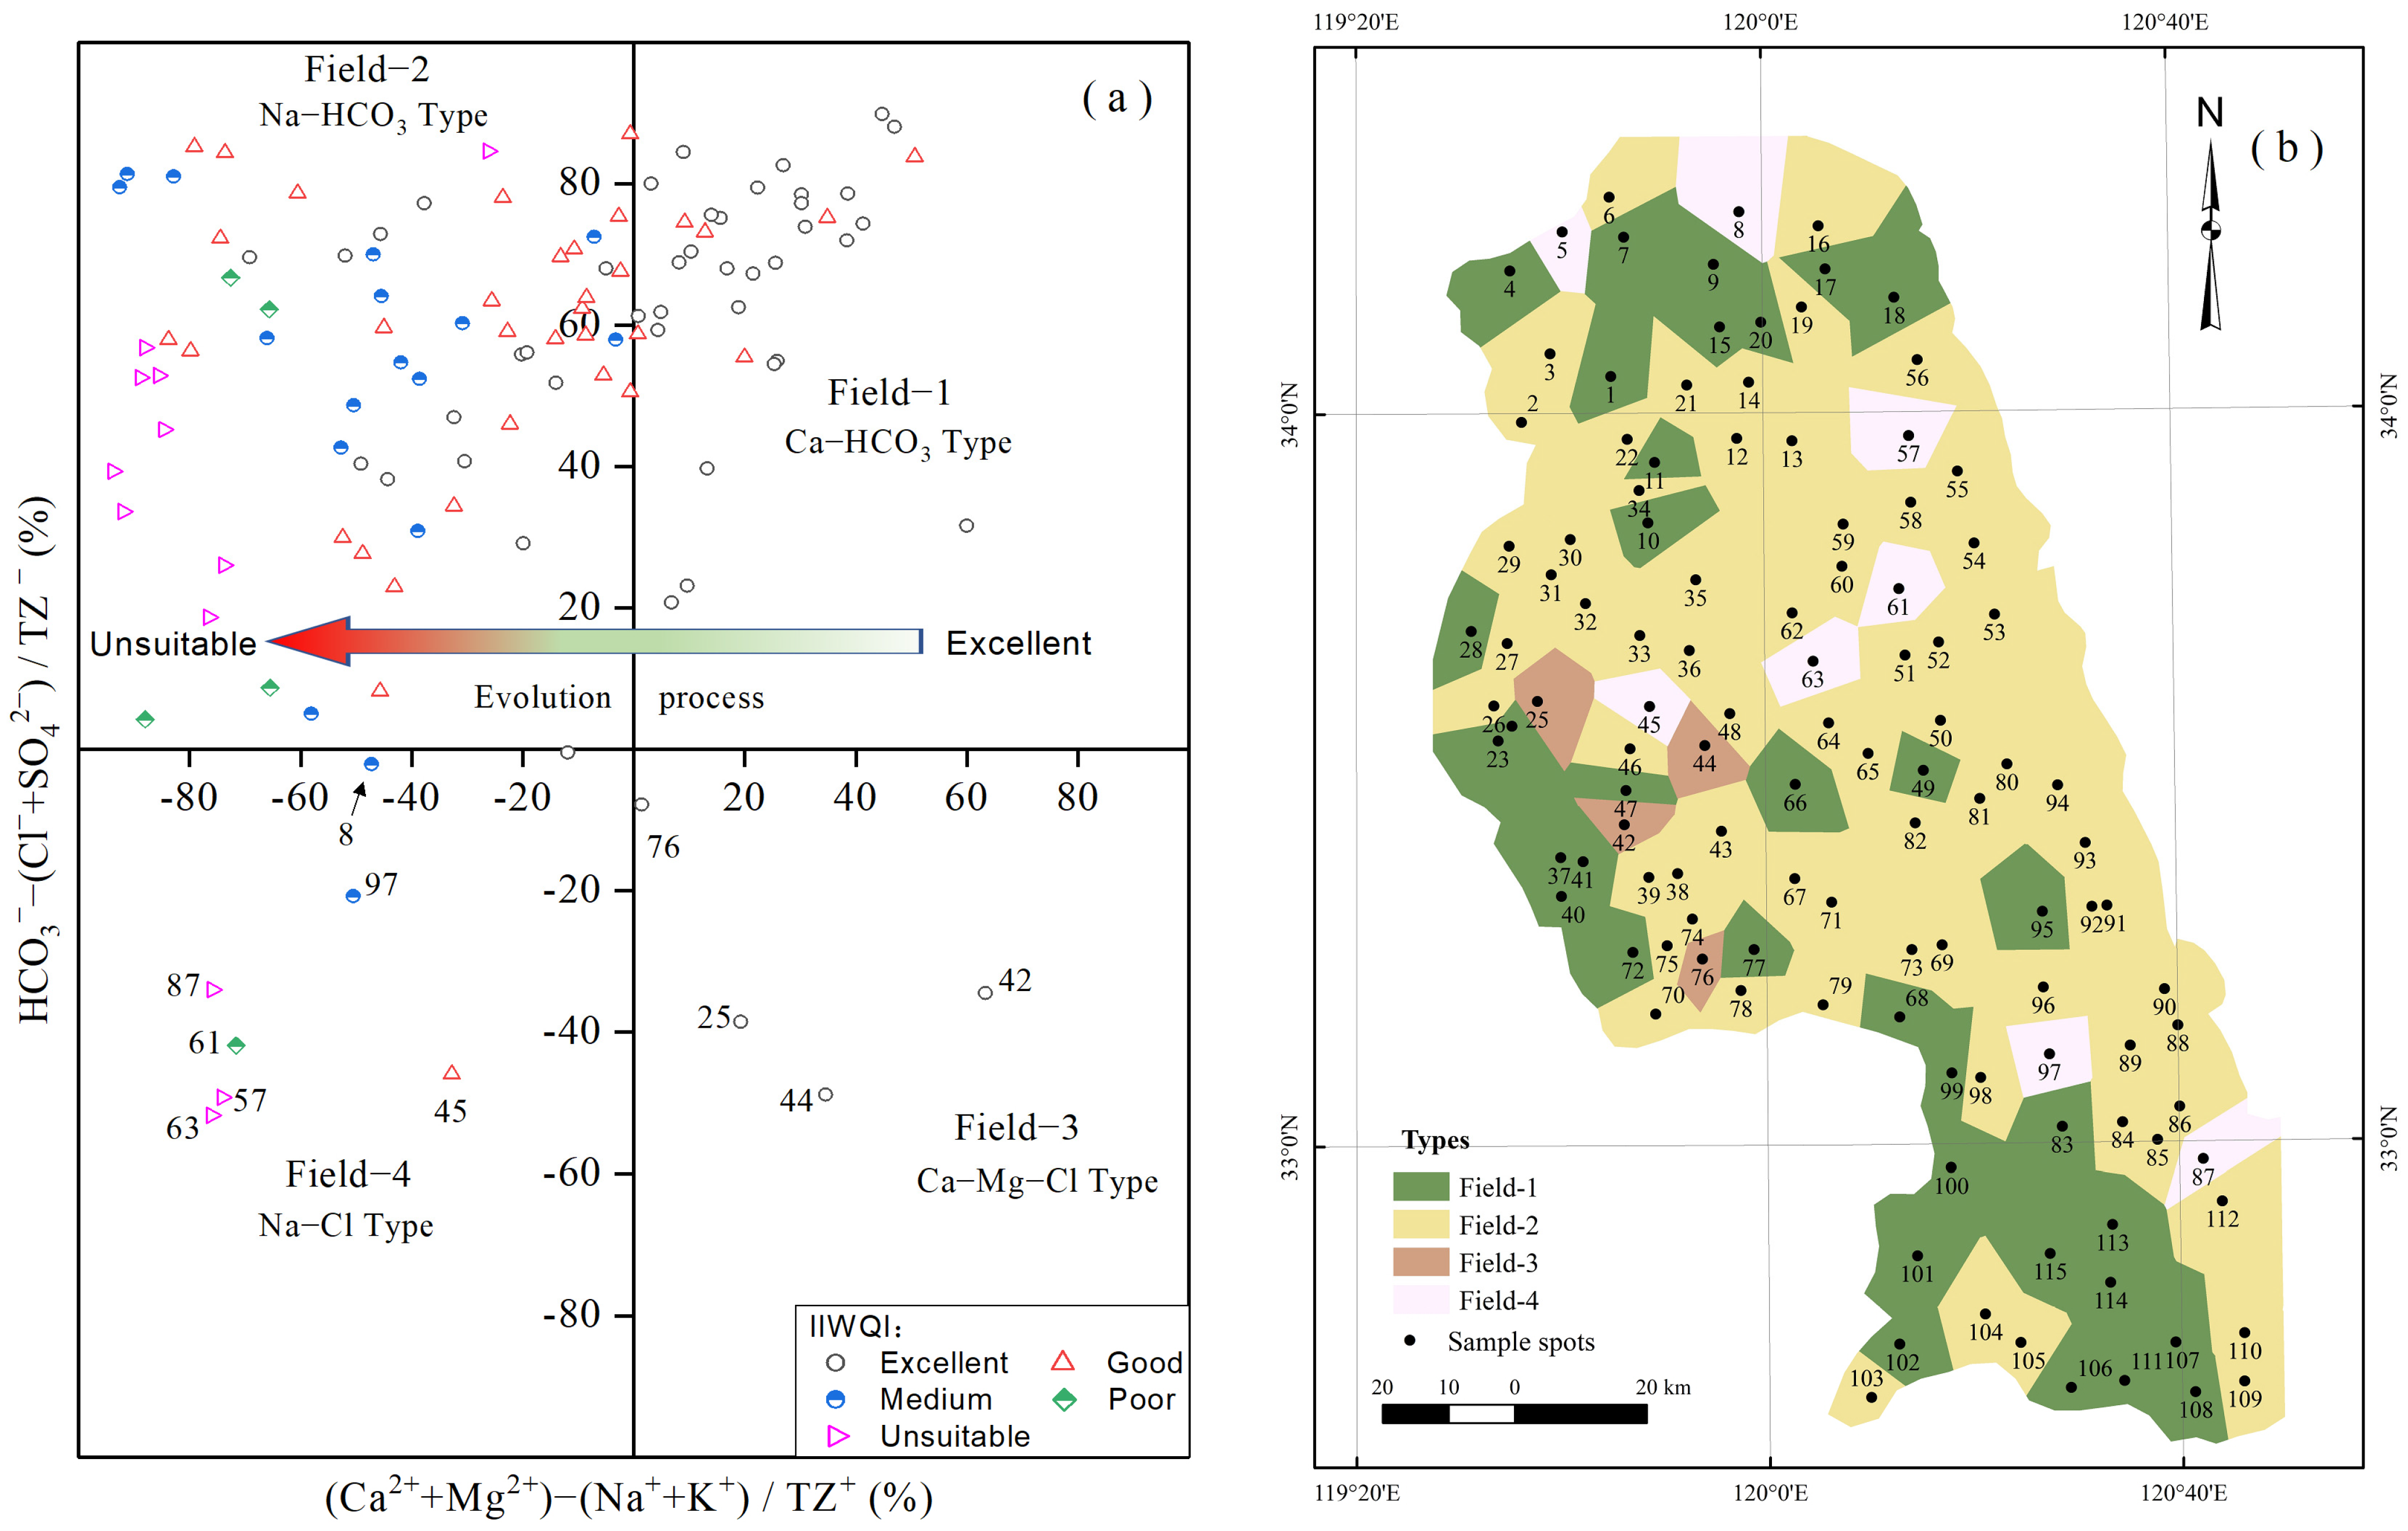
4.1. Geochemical Factors on Water Quality

With the continuous advancement of the “National Drinking Water Project”, the scope and intensity of the impact of groundwater used for drinking purposes on human health have gradually reduced in the Yancheng area. However, the impact of groundwater quality on crop growth and yield is increasing [42,43]. Therefore, based on the IIWQI, the samples were divided into five categories to further explore the origin and evolution process of the quality of shallow groundwater in the study area.
When the milliequivalent ratio of sodium to chlorine (Na+/Cl) shows small spatial differences, it suggests that the sodium and chlorine come from the same source, which could be rainwater or dissolved salt rock. Significant differences in the Na+/Cl ratio indicate that the sodium and chlorine come from different sources, which may be influenced by local factors such as soluble salt in the soil and rock weathering replenishment [2]. The ratio of Na+/Cl in the groundwater in the Yancheng area ranged from 0.35 to 19.91, with an average value of 3.89, and the relationship between the proportion of Na+ + K+ in the total cations and Cl was disordered; however, with the increase in the TDS, there was a significant trend of increase (Figure 2), indicating that the high concentration of Na rarely came from salt rocks or precipitation and instead mainly came from rock weathering or human activities, such as silicate weathering and cation exchange [44]. Secondly, the sample anions were mainly dominated by HCO3 (Figure 2), suggesting that silicate weathering should be the main source of Na+ (Equation (13)). However, with solute enrichment, i.e., when the TDS value increased, the ratio of Na+/Cl gradually approached precipitation/seawater (Figure 10a), indicating that the strong evaporation of regional precipitation or the leaching replenishment of residual marine sediment also significantly promoted groundwater solute enrichment.
In addition, the ratio of Na+ to the total cations (TZ+) also helps explain silicate weathering. When Na+ = 0.5 TZ+, silicate weathering dominates the formation of groundwater solutes [45]. When the TZ+ in the shallow groundwater in the study area was less than 20 meq/L, the scattered points of Na+ and TZ+ were mainly concentrated near the 1:2 line (Figure 10b), indicating that silicate weathering was the key hydrochemical process controlling the formation of solutes. This was consistent with the results of the analysis of the relationship between Mg2+/Na+ − Ca2+/Na+ and HCO3/Na+ − Ca2+/Na+ [22], and it was also consistent with the chemical erosion of the upper Huaihe River controlled by silicate weathering [31]. However, as the TZ+ value increased, the scattered points of the samples which were unsuitable for irrigation and some with poor water quality gradually deviated from the 1:2 line, suggesting that other water chemical processes could also affect the concentration of Na+.
If the Na+ in the groundwater is replaced by Ca2+ or Mg2+, which are rich in the surface material of the surrounding rock, CAI-I and CAI-II are both greater than zero. Otherwise, the rich Na+ on the surface of the surrounding rock material can be replaced by the Ca2+ (Mg2+) in the groundwater, resulting in an increase in the concentration of Na+ in the groundwater and a decrease in the concentration of Ca2+ (Mg2+) [45]. Most of the groundwater samples in the study area were distributed in the lower left part of Figure 10c, indicating that there was a significant reverse ion exchange in the groundwater, that is, the lithophile element Ca2+ in the groundwater replaced the Na+ element in the surrounding rock (Equation (15)). This was consistent with the result that the obvious enrichment of Na+ + K+ on Ca2+ + Mg2+ was confirmed by the (Ca2+ + Mg2+) − (HCO3 + SO42−) and (Na+ + K+) − Cl diagrams in the study area [22].
Na2X(solid) + Ca2+(liquid) = CaX(solid) + 2Na+(liquid)
Furthermore, the ratios of (Ca2+ + Mg2+)/SO42− and (Ca2+ + Mg2+)/HCO3 are often used to identify the source of Ca2+, Mg2+, and SO42−. When the ratio of (Ca2+ + Mg2+)/SO42− is close to 1, the Ca2+, Mg2+, and SO42− may come from the dissolution of gypsum in the salt rock; when the ratio of (Ca2+ + Mg2+)/HCO3 is close to 1, the Ca2+ and Mg2+ come from the carbonation of Ca(Mg) rocks (Equations (16) and (17)) [46]. The average ratios of (Ca2+ + Mg2+)/SO42− and (Ca2+ + Mg2+)/HCO3 in the study area were 45.57 and 0.55, respectively, which were significantly different from 1 (Figure 10d), indicating that the supply of Ca2+ and Mg2+ by the dissolution of gypsum could be ignored and that the carbonation by the Ca(Mg) rock was relatively weak. The large amount of HCO3 produced by the carbonation of Na feldspar (Equation (13)) was the main reason why the (Ca2+ + Mg2+)/HCO3 ratio was significantly less than 1. Secondly, the TDS of samples with poor water quality and those that were unsuitable for irrigation was mostly higher than 1500 mg/L; with the increase in TDS, the values of (Ca2+ + Mg2+)/SO42− and (Ca2+ + Mg2+)/HCO3 all rapidly approached 1, that is, the weathering effect of silicate gradually weakened, and at the same time, the value of Na+/Cl was rapidly approaching seawater (Figure 10a). Therefore, the dominant factor promoting the rapid deterioration of water quality had evolved into leaching residual marine sediments. Furthermore, considering the fact that samples with poor water quality were mostly scattered in inland areas and that the salt industry was widely distributed in historical periods [47], the water quality deterioration could also have been caused by the residues of salt industry activities during the Ming and Qing Dynasties.
3 ( Ca 1 - x Mg x ) CO 3 + CO 2 + H 2 O + H 2 SO 4 3 ( 1   -   x ) Ca 2 + + 3 x Mg 2 + + 4 HCO 3 - + SO 4 2 -
2 ( Ca 1 x M g x ) ( AlSi 3 O 8 ) 2 + 4 CO 2 + 6 H 2 O 2 ( 1   -   x ) Ca 2 + + 2 x Mg 2 + + 4 HCO 3 - + Al 4 ( Si 4 O 10 ) ( OH ) 8   + 8 SiO 2
Based on the above analysis, the Chadha diagram was used to comprehensively analyze the hydrochemical composition type and ion exchange status of the groundwater [48]. When the alkaline earth metal ions in the water samples of the study area exceeded the alkali metal ions, the water quality was classified as “excellent” and “good” (Figure 11a). This water was mostly distributed in the vicinity of the Abandoned Yellow River and the western inland area, was far from the ocean as a whole (Figure 11b), and should be caused by the infiltration and dilution of upstream, net-like runoff, lakes, and other bodies of water. The groundwater quality was “excellent” especially when the strong acid anion (Cl + SO42−) in the samples in the Field 3 area exceeded the weak acid anion (HCO3), which further illustrates the effect of surface water infiltration replenishment on the samples.
As the ratio of [(Ca2+ + Mg2+) − (Na+ + K+)]/TZ+ decreased, the water quality tended to gradually deteriorate (Figure 11a). When the ratio was less than −60%, the water quality became poor and unsuitable for irrigation, indicating that the water quality in the study area was mainly controlled by the supply intensity of alkali metals. Among them, there was a significant alkali ion exchange phenomenon in which Na+ + K+ was enriched on Ca2+ + Mg2+ in the Field 2 water sample [24], that was, the replacement of Ca2+ in the groundwater with Na+ in the soil (Equation (15)). This was because the adsorption between ions in natural water was controlled mostly by the bond energy of metal cations, which usually followed: Ca > Mg > K > H > Na [43]. The samples accounted for 58.13% of the total sampled and were distributed mainly in the vast area on the seaside (Figure 11b). From this, it was recommended that surface water, rainwater, or deep, high-quality groundwater be used as much as possible for the irrigation of crops in this area to prevent the deterioration of the regional soil texture.
The Na+ − Cl-type water samples in Field 4 were prone to salinity problems during irrigation and drinking. Their average ratio of Na+/Cl was only 43.42% of the average value in the study area, which significantly tended toward the seawater of the western Pacific Ocean (Figure 10a). Their distribution was similar to that of the groundwater that was not suitable for irrigation (Figure 9) and should be the result of residual seawater leaching during marine regression [14] or the leaching of residues from human salt production activities in historical periods.

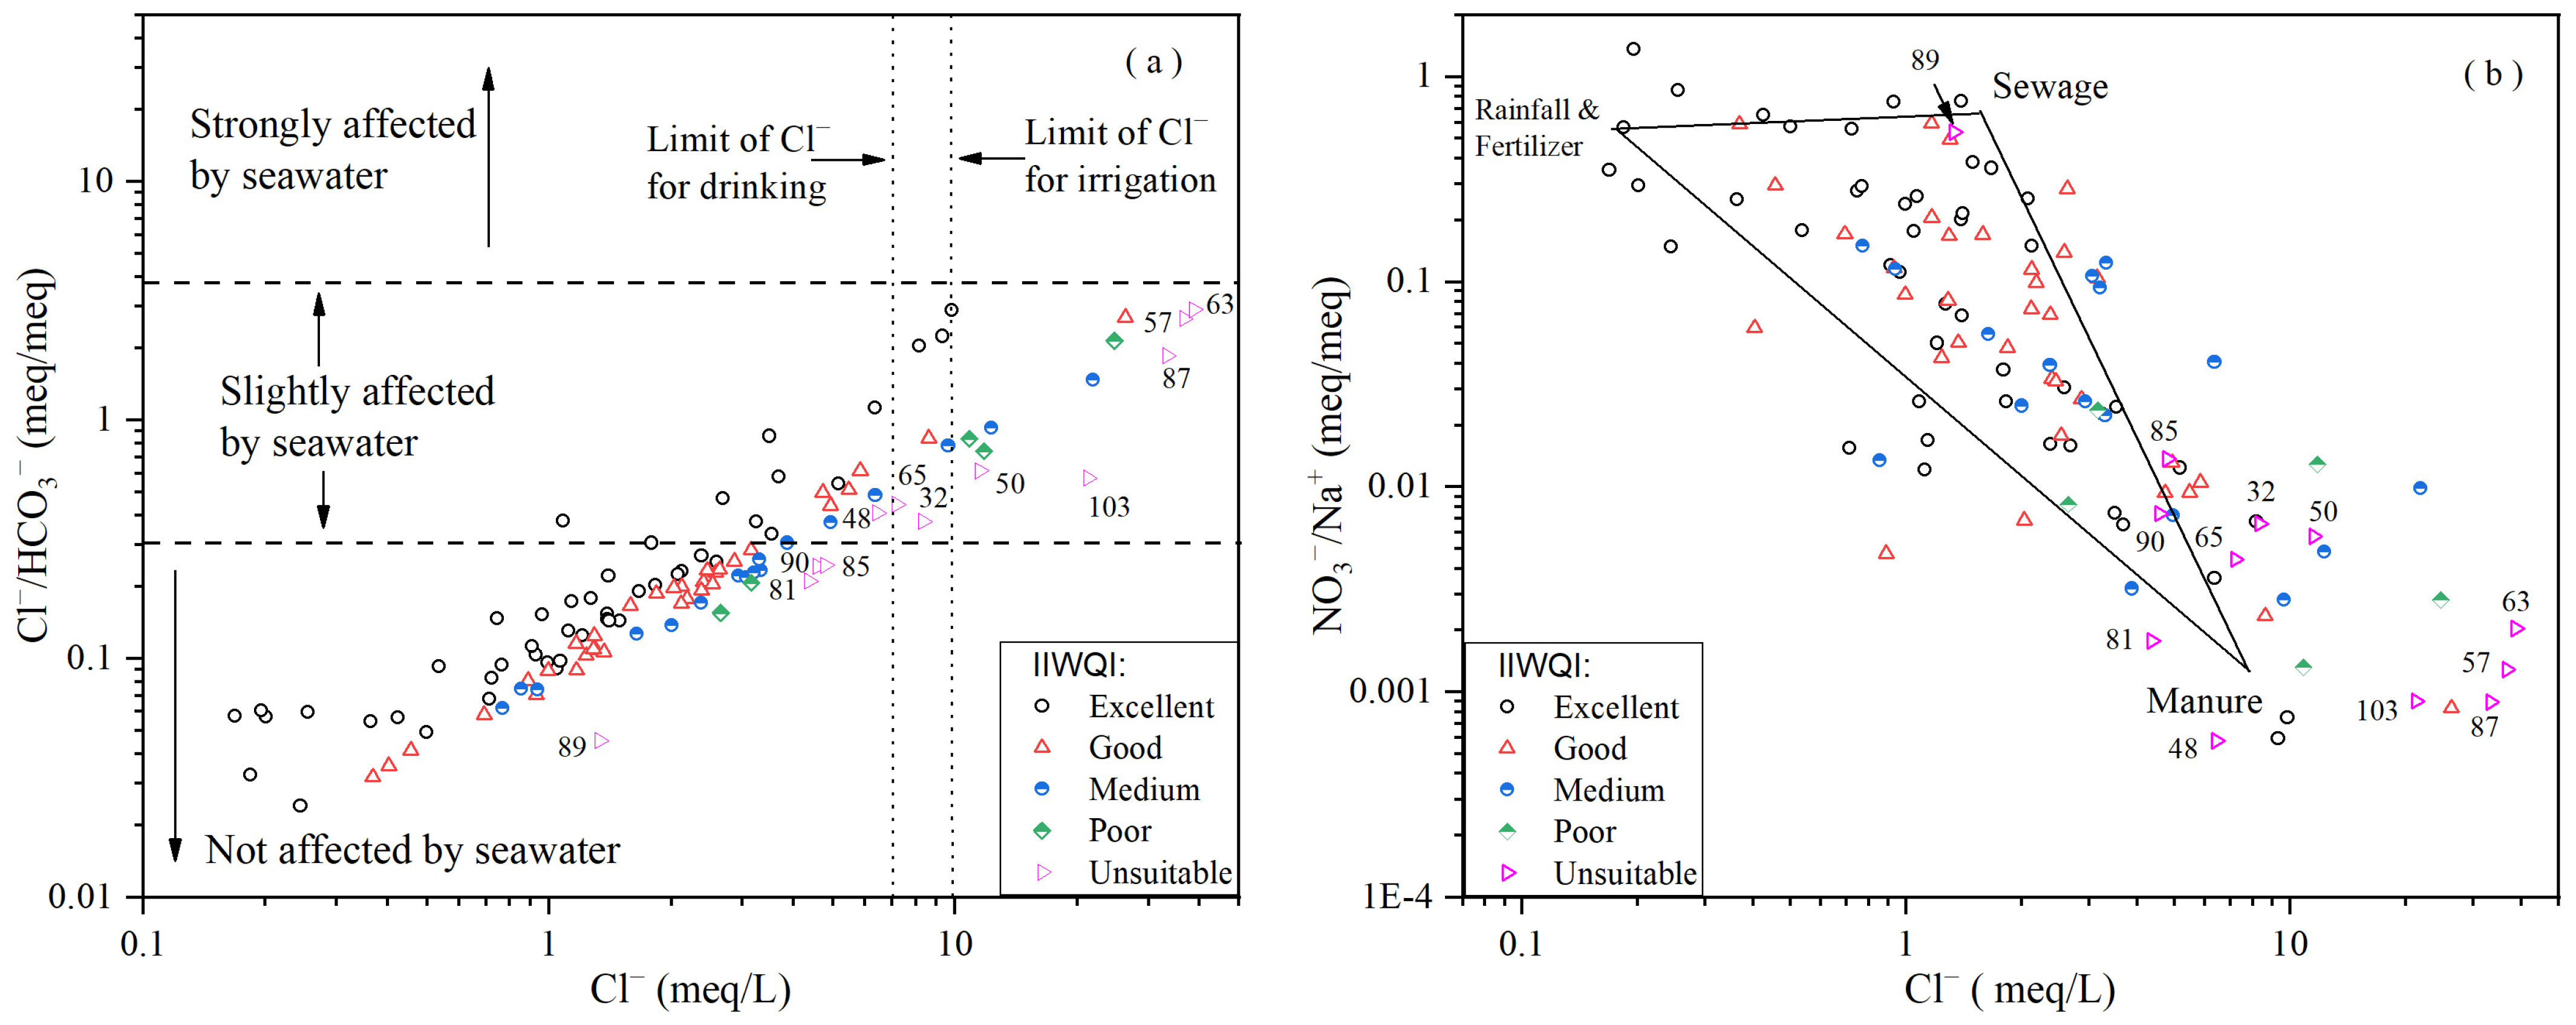
4.2. Impact of Seawater and Human Activities

Chloride and bicarbonate are the most common anions found in groundwater and are mainly controlled by seawater and rock weathering, respectively. By comparing and analyzing the ratio of Cl/HCO3 in the salinization process, groundwater content can be classified into three categories: unaffected by seawater (<0.3), slightly affected (0.3–3.8), and strongly affected (>3.8) [49]. The relationship between Cl/HCO3 and Cl in Yancheng indicated that the chemical composition of the groundwater was not strongly affected by seawater (Figure 12a), which could be caused by factors such as the shallower groundwater level and the large distance between the sampling point and the ocean (>9 km). Slightly affected and unaffected sampling points accounted for 30.43% and 69.57%, respectively. The former included not only coastal waters but also high-quality inland waters (such as sample points 42, 44, 102, etc.), and the spatial distribution was relatively scattered.
Furthermore, it is challenging to establish a reliable correlation between Cl and NO3 in natural water bodies; however, it has been proven that different water sources have different NO3/Cl ratios. A water body affected by manure/rural sewage has the characteristics of a low NO3/Cl ratio and a high Cl value; the use of a large amount of chemical fertilizers in farmland could cause the ratio of NO3/Cl to be higher and the concentration of Cl to be lower [50,51]. Therefore, this study utilized research findings on NO3/Cl vs. Cl in the Qinhuai River Basin, which is adjacent to the study area, to distinguish the source of NO3 and the impact of human activities on the quality of the groundwater [32]. The results showed that agricultural fertilizers and urban sewage had a relatively weak impact on shallow groundwater in the Yancheng area (Figure 12b) and affected only some water of “excellent” and “good” grades. However, if the discharge of pollutants was not restricted, it could lead to a significant deterioration in regional water quality. The nitrates from pollutants such as rural sewage and manure were mainly distributed in “unsuitable” water and a small number of “medium” and “poor” water bodies that were slightly affected by seawater. Moreover, the traditional open-pollution methods of rural sewage and feces were very similar to the salt decoction and sun-dried salt in the Ming and Qing Dynasties in the study area [35,47]. This finding further confirms that the unsuitability of groundwater for irrigation purposes in the region was mainly caused due to the leaching of residues from the human salt industry.

5. Conclusions

The shallow groundwater in Yancheng, China, was generally neutral to slightly alkaline, and the ranges of TH and TDS values were from 19.18 to 657.78 mg/L and from 117 to 4415 mg/L, respectively, with averages of 245.05 mg/L and 1126.25 mg/L. The anion and cation concentrations were dominated by HCO3 and Na+, respectively, and the orders of ion concentration were HCO3 > Cl > SO42− > NO3 and Na+ > Mg2+ > Ca2+ > K+, different from the Guohe River basin in the upper reaches of the Huai River, indicating significant differences in the formation mechanism of groundwater solutes in the upper and lower reaches of the Huai River. The over-standard sample values for the pH, TDS, TH, Cl, and Na+ of groundwater for drinking purposes accounted for 1.74%, 32.17%, 6.96%, 16.65%, and 37.39% of the total sampled amount, respectively. The samples with an extremely poor water quality and unsuitable drinking water quality, as determined by DWQI, accounted for 8.70% and 10.43%, respectively, and were mainly distributed in the area between the Abandoned Yellow River and the Xingyanjie River. The samples identified by the IIWQI as unsuitable for irrigation accounted for 10.43% and were distributed on both sides of the Tongyu Canal, north of the Xingyanjie River, and near the mouths of the Xingyanjie River. Excessive use of these water bodies for irrigation may damage the structure and aggregates of the soil, reduce the soil water and air permeability, promote soil compaction and the development of alkalinity, and cause the risk of crop yield reduction.
The weathering of silicate rocks in regional clays and subclays and the replacement of lithophile Ca2+ in the groundwater with Na+ elements in the surrounding rocks were key hydrochemical processes that controlled the formation and evolution of solutes in the shallow groundwater. These processes could increase the concentration of alkali metals and deteriorate the water quality. On this basis, the residual marine sediments in the process of regression or historical salt industry residues should be the main cause of poor water quality and the unsuitability for irrigation of the groundwater scattered in the inland areas. To maintain the quality of the branded grain-producing areas, it is highly recommended to use surface water, rainwater, or deep, high-quality groundwater for crop irrigation in this region. This would help prevent the degradation of soil texture and ensure the sustainability of agriculture in the area.

Author Contributions

J.W. designed and conceived the research idea, took lead in the supervision, and prepared the initial draft. J.X. provided GIS mapping support and edited the final version of the manuscript. All authors have read and agreed to the published version of the manuscript.

Funding

This article was sponsored by the State Key Laboratory of Cryosphere Science Open Fund Project (SKLCS-OP-2020-7) and the National Natural Science Foundation of China (41471060).

Institutional Review Board Statement

Not applicable.

Informed Consent Statement

Not applicable.

Data Availability Statement

In this study, the data were sampled by the authors.

Acknowledgments

The authors would like to thank the editor and the anonymous referees for their comments and suggestions, which were most useful in revising the paper. The authors also would like to acknowledge Cui Xiaoqing of the State Key Laboratory of Cryospheric Science for testing the ionic concentration.

Conflicts of Interest

The authors declare that they have no known competing financial interest or personal relationships that could have appeared to influence the work reported in this paper.

References

  1. Osiakwan, G.M.; Appiah-Adjei, E.K.; Kabo-Bah, A.T.; Gibrilla, A.; Anornu, G. Assessment of groundwater quality and the controlling factors in coastal aquifers of Ghana: An integrated statistical, geostatistical and hydrogeochemical approach. J. Afr. Earth Sci. 2021, 184, 104371. [Google Scholar] [CrossRef]
  2. Li, P.Y.; He, S.; Yang, N.N.; Xiang, G. Groundwater quality assessment for domestic and agricultural purposes in Yan’an City, northwest China: Implications to sustainable groundwater quality management on the Loess Plateau. Environ. Earth Sci. 2018, 77, 775. [Google Scholar] [CrossRef]
  3. Lima, I.Q.; Muñoz, M.O.; Ramos, O.E.; Bhattacharya, P.; Choque, R.Q.; Aguirre, J.Q.; Sracek, O. Hydrochemical assessment with respect to arsenic and other trace elements in the Lower Katari Basin, Bolivian Altiplano. Groundw. Sustain. Develop. 2019, 8, 281–293. [Google Scholar] [CrossRef]
  4. Luo, P.; Xu, C.; Kang, S.; Huo, A.; Lyu, J.; Zhou, M.; Nover, D. Heavy metals in water and surface sediments of the Fenghe River Basin, China: Assessment and source analysis. Water Sci. Technol. 2021, 84, 3072–3090. [Google Scholar] [CrossRef]
  5. Qin, J.; Duan, W.; Chen, Y.; Dukhovny, V.A.; Sorokin, D.; Li, Y.; Wang, X. Comprehensive evaluation and sustainable development of water–energy–food–ecology systems in Central Asia. Renew. Sustain. Energy Rev. 2022, 157, 112061. [Google Scholar] [CrossRef]
  6. He, S.; Wu, J.H. Hydrogeochemical characteristics, groundwater quality, and health risks from Hexavalent Chromium and Nitrate in groundwater of Huanhe formation in Wuqi County, Northwest China. Expo. Health 2019, 11, 125–137. [Google Scholar] [CrossRef]
  7. Liu, S.F.; Gao, B.; Zhang, H.Y.; Fan, H.; Jiang, W.B. Evaluation of groundwater quality and fluoride enrichment characteristics in western Tarim Basin: A case study of Akto County. Arid Land Geogr. 2021, 4, 1261–1271. [Google Scholar]
  8. Su, H.; Kang, W.D.; Xu, Y.J.; Wang, J.D. Assessment of groundwater quality and health risk in the oil and gas field of Dingbian County, Northwest China. Expo. Health 2016, 9, 227–242. [Google Scholar] [CrossRef]
  9. Wu, J.H.; Zhang, Y.X.; Zhou, H. Groundwater chemistry and groundwater quality index incorporating health risk weighting in Dingbian County, Ordos basin of northwest China. Geochemistry 2020, 80, 125607. [Google Scholar] [CrossRef]
  10. Zhou, Y.H.; Li, P.Y.; Xue, L.L.; Dong, Z.; Li, D. Solute geochemistry and groundwater quality for drinking and irrigation purposes: A case study in Xinle City, North China. Geochemistry 2020, 80, 125609. [Google Scholar] [CrossRef]
  11. Brahim, F.B.; Boughariou, E.; Bouri, S. Multicriteria-analysis of deep groundwater quality using WQI and fuzzy logic tool in GIS: A case study of Kebilli region, SW Tunisia. J. Afr. Earth Sci. 2021, 180, 104224. [Google Scholar] [CrossRef]
  12. Liu, J.N.; Du, J.Z.; Yu, X.Q. Submarine groundwater discharge enhances primary productivity in the Yellow Sea, China: Insight from the separation of fresh and recirculated components. Geosci. Front. 2021, 12, 101204. [Google Scholar] [CrossRef]
  13. Mao, C.P.; Tan, H.B.; Song, Y.X.; Rao, W.B. Evolution of groundwater chemistry in coastal aquifers of the Jiangsu, east China: Insights from a multi-isotope (δ2H, δ18O, 87Sr/86Sr, and δ11B) approach. J. Contam. Hydrol. 2020, 235, 103730. [Google Scholar] [CrossRef] [PubMed]
  14. Huang, J.O.; Xian, Y.; Li, W.; Zhang, D.Z.; Zhuang, X.M. Hydrogeochemical evolution of groundwater flow system in the typical coastal plain: A case study of Hangjiahu plain. Earth Sci. 2021, 46, 2565–2582. [Google Scholar]
  15. Wang, J.N.; Li, A.M.; Wang, Q.J.; Zhou, Y.; Fu, L.C.; Li, Y. Assessment of the manganese content of the drinking water source in Yancheng, China. J. Hazard. Mater 2010, 182, 259–265. [Google Scholar] [CrossRef]
  16. Zhang, Y.; Fu, C.C.; Mao, L.; Gong, X.L.; Li, X.Q. Hydrochemical characteristics and formation mechanism of the groundwater in Yancheng, Jiangsu province. Res. Environ. Yangtze Basin 2017, 26, 598–605. [Google Scholar]
  17. Fu, C.C.; Li, X.Q.; Zhang, Y.; Mao, L.; Gong, X.L. Groundwater quality evaluation and the health risk assessment of Yancheng Coastal Plain. J. Water Res. Water Eng. 2017, 28, 54–60. [Google Scholar]
  18. Zhang, H.B.; Zhen, Y.; Zhang, Y.F. Changes and patterns of spartina alterniflora salt marshes in Yancheng for 4 periods since 1997. Wetl. Sci. 2018, 16, 582–586. [Google Scholar]
  19. Zhou, F.; Yu, H.H.; Liu, C.Y. Change of rivers system in the Lixiahe region during urbanization. South-to-North Water Transf. Water Sci. 2018, 16, 144–150. [Google Scholar]
  20. Gu, F. Water resources status and problems in Yancheng city. Hydrology 2003, 23, 53–55. [Google Scholar]
  21. Yu, G.; Ye, L.T.; Liao, M.N. Simulations of coastal sediment patterns during the Late Pleistocene in Jiangsu coast. Acta Sedimentol. Sin. 2016, 34, 670–678. [Google Scholar]
  22. Wang, J.; Zhang, H.B.; Xu, J.L.; Li, Y.S. Provenance of Groundwater Solute and Its Controlling Factors in Yancheng Area. Environ. Sci. 2022, 43, 1908–1919. [Google Scholar]
  23. Sahu, P.; Sikdar, P.K. Hydrochemical framework of the aquifer in and around East Kolkata Wetlands, West Bengal, India. Environ. Geol. 2008, 55, 823–835. [Google Scholar] [CrossRef]
  24. Sutradhar, S.; Mondal, P. Groundwater suitability assessment based on water quality index and hydrochemical characterization of Suri Sadar Sub-division, West Bengal. Ecol. Inform. 2021, 64, 101335. [Google Scholar] [CrossRef]
  25. Amalraj, A.; Pius, A. Assessment of groundwater quality for drinking and agricultural purposes of a few selected areas in Tamil Nadu South India: A GIS-based study. Sustain. Water Resour. Manag. 2018, 4, 1–21. [Google Scholar] [CrossRef]
  26. Hossain, M.; Patra, P.K.; Begum, S.N.; Rahaman, C.H. Spatial and sensitivity analysis of integrated groundwater quality index towards irrigational suitability investigation. Appl. Geochem. 2020, 123, 104782. [Google Scholar] [CrossRef]
  27. Haldar, K.; Kujawa-Roeleveld, K.; Dey, P.; Bosu, S.; Datta, D.K.; Rijnaarts, H. Spatiotemporal variations in chemical-physical water quality parameters influencing water reuse for irrigated agriculture in tropical urbanized deltas. Sci. Total Environ. 2019, 708, 134559. [Google Scholar] [CrossRef]
  28. Sidhu, N.; Rishi, M.S.; Kishore, N. A water quality index approach to appraise temporal variation and heavy metal accumulation in urban storm water flow with special emphasis on irrigation utility, Chandigarh, India. Int. J. Eng. Sci. Res. Technol. 2015, 4, 484–496. [Google Scholar]
  29. Zaidi, F.K.; Nazzal, Y.; Jafri, M.K.; Naeem, M.; Ahmed, I. Reverse ion exchange as a major process controlling the groundwater chemistry in an arid environment: A case study from northwestern Saudi Arabia. Environ. Monit. Assess. 2015, 187, 607. [Google Scholar] [CrossRef]
  30. Zhou, H.F.; Tan, H.B.; Zhang, X.Y.; Zhang, W.J.; Sun, X. Recharge source, hydrochemical characteristics and formation mechanism of groundwater in Nantong, Jiangsu Province. Geochimica 2011, 40, 566–576. [Google Scholar]
  31. Zheng, T.; Jiao, T.L.; Hu, B.; Gong, J.S.; Hou, M.X.; Wang, H.S. Hydrochemical characteristics and its origin of groundwater in the middle part of Guohe river basin. Environ. Sci. 2021, 42, 766–775. [Google Scholar]
  32. Xia, Y.Q.; Li, Y.F.; Zhang, X.Y.; Yan, X.Y. Nitrate source apportionment using a combined dual isotope, chemical and bacterial property, and Bayesian model approach in river systems. J. Geophys. Res. Biogeosci. 2017, 122, 2–14. [Google Scholar] [CrossRef]
  33. He, M.X.; Zhang, B.; Xia, W.X.; Cui, X.; Wang, Z.L. Hydrochemical characteristics and analysis of Qilihai Wetland, Tianjin. Environ. Sci. 2021, 42, 776–785. [Google Scholar]
  34. Zhang, J.Q.; Liu, J.; Kong, X.Z.; Xue, C.T.; Liu, X.B.; Sun, L.S.; Yue, B.J.; Wen, C. Clay mineral assemblage of sediments from middle reach of Huaihe river. Mar. Geol. Quatern. Geol. 2011, 31, 21–29. [Google Scholar] [CrossRef]
  35. Bao, J.L. The research about saltworks migration and vicissitude of Huai Salterns in Ming and Qing Dynasties. Res. Chin. Econ. Hist. 2016, 1, 114–124. [Google Scholar]
  36. Esmaeili-Vardanjan, M.; Rasa, I.; Amiri, V.; Yazdi, M.; Pazand, K. Evaluation of groundwater quality and assessment of scaling potential and corrosiveness of water samples in Kadkan aquifer, Khorasan-e-Razavi Province, Iran. Environ. Monit. Assess. 2015, 187, 53. [Google Scholar] [CrossRef] [PubMed]
  37. Xian, X.X.; Kong, F.L.; Zhu, M.K.; Li, Y.; Xi, M. Effects of water and salt gradients on soil nutrient indices and enzyme activities in coastal wetlands. Bull. Soil Water Conserv. 2019, 39, 65–71. [Google Scholar]
  38. Batarseh, M.; Imreizeeq, E.; Tilev, S.; Alaween, M.A.; Alawneh, M.A. Assessment of groundwater quality for irrigation in the arid regions using irrigation water quality index (IWQI) and GIS-Zoning maps: Case study from Abu Dhabi Emirate, UAE. Groundw. Sustain. Dev. 2021, 14, 100611. [Google Scholar] [CrossRef]
  39. Verma, A.; Yadav, B.K.; Singh, N.B. Hydrochemical exploration and assessment of groundwater quality in part of the Ganga-Gomti fluvial plain in northern India. Groundw. Sustain. Dev. 2021, 13, 100560. [Google Scholar] [CrossRef]
  40. Rao, K.N.; Latha, P.S. Groundwater quality assessment using water quality index with a special focus on vulnerable tribal region of Eastern Ghats hard rock terrain, Southern India. Arab. J. Geosci. 2019, 12, 267. [Google Scholar] [CrossRef]
  41. Roy, A.; Keesari, T.; Mohokar, H.; Sinha, U.K.; Bitra, S. Assessment of groundwater quality in hard rock aquifer of central Telangana state for drinking and agriculture purposes. Appl. Water Sci. 2018, 8, 124. [Google Scholar] [CrossRef]
  42. Han, D.M.; Currell, M.J. Review of drivers and threats to coastal groundwater quality in China. Sci. Total Environ. 2022, 806, 150913. [Google Scholar] [CrossRef] [PubMed]
  43. Wang, Z.Y.; Su, Q.; Wang, S.; Gao, Z.J.; Liu, J.T. Spatial distribution and health risk assessment of dissolved heavy metals in groundwater of eastern China coastal zone. Environ. Pollut. 2021, 290, 118016. [Google Scholar] [CrossRef] [PubMed]
  44. Cravotta III, C.A.; Senior, L.A.; Conlon, M.D. Factors affecting groundwater quality used for domestic supply in Marcellus Shale region of North-Central and North-East Pennsylvania, USA. Appl. Geochem. 2022, 137, 105149. [Google Scholar] [CrossRef]
  45. Gao, Y.Y.; Qian, H.; Ren, W.H.; Wang, H.K.; Liu, F.X. Hydrogeochemical characterization and quality assessment of groundwater based on integrated-weight water quality index in a concentrated urban area. J. Clean Prod. 2020, 260, 121006. [Google Scholar] [CrossRef]
  46. He, J.Y.; Zhang, D.; Zhao, Z.Q. Spatial and temporal variations in hydrochemical composition of river water in Yellow River Basin, China. Chin. J. Ecol. 2017, 36, 1390–1401. [Google Scholar]
  47. Fang, M.; Zong, L.G. Changes of Jiangsu coast and its influence on the development of tidal flats. Agr. Hist. China 1989, 2, 31–37. [Google Scholar]
  48. Vuai, S.A.; Tokuyama, A. Solute generation and CO2 consumption during silicate weathering under subtropical, humid climate, northern Okinawa Island, Japan. Chem. Geol. 2007, 236, 199–216. [Google Scholar] [CrossRef]
  49. Bhadra, T.; Hazra, S.; Roy, S.; Barman, B.C. Assessing the groundwater quality of the coastal aquifers of a vulnerable delta: A case study of the Sundarban Biosphere Reserve, India. Groundw. Sustain. Develop. 2020, 11, 100438. [Google Scholar] [CrossRef]
  50. Gibrilla, A.; Fianko, J.R.; Ganyaglo, S.; Adomako, D.; Anornu, G.; Zakaria, N. Nitrate contamination and source apportionment in surface and groundwater in Ghana using dual isotopes (15N and 18O-NO3) and a Bayesian isotope mixing model. J. Contam. Hydrol. 2020, 233, 103658. [Google Scholar] [CrossRef]
  51. Cui, Y.H.; Wang, J.; Liu, Y.C.; Hao, S.; Cao, X. Hydro-chemical charateristics and ion origin analysis of surface groundwater at the Shengjin Lake and Yangtze River interface. Environ. Sci. 2021, 42, 3223–3231. [Google Scholar]
Figure 1. Distribution of sampling points and regional geological conditions. (a) The study area is located in eastern central China; (b) Distribution of sampling points on a hydrogeological map (including the major water networks, available groundwater depth, and geological composition).
Sustainability 15 06882 g001
Figure 2. Durov diagram of the hydrochemical composition of shallow groundwater in the Yancheng area.
Sustainability 15 06882 g002
Figure 3. Spatial distribution of TDS, TH, Cl, and Na+ in shallow groundwater.
Sustainability 15 06882 g003
Figure 4. Distribution of DWQI (water quality index for drinking) in shallow groundwater in Yancheng area.
Sustainability 15 06882 g004
Figure 5. Spatial distribution of (a) magnesium adsorption ratio and (b) Mg2+ concentration.
Sustainability 15 06882 g005
Figure 6. Spatial distribution of residual sodium carbonate (RSC) in shallow groundwater in the Yancheng area.
Sustainability 15 06882 g006
Figure 7. Soil permeability potential under different water quality background in theYancheng area. (a) Spatial distribution of permeability index (PI); (b) PI vs. total ion concentration (TIC); (c) Spatial distribution of sample classification results based on the relationship of PI and TIC.
Sustainability 15 06882 g007aSustainability 15 06882 g007b
Figure 8. Spatial distribution of SAR and SSP and a Wilcox diagram.
Sustainability 15 06882 g008
Figure 9. Distribution of IIWQI of shallow groundwater for irrigation purposes.
Sustainability 15 06882 g009
Figure 10. Plots of (a) Na+/Cl vs. TDS, (b) Na+ vs. TZ+, (c) CAI-I vs. CAI-II, and (d) (Ca2+ + Mg2+)/SO42− (HCO3) vs. TDS.
Sustainability 15 06882 g010
Figure 11. Hydrochemical facies of groundwater in the study area based on the Chadha diagram. (a) Chadha diagram (Field−1: Ca–HCO3-type waters, reflecting recharge and weathering. Field−2: Na–HCO3-type waters, reflecting base ion exchange. Field−3: Ca–Mg–Cl-type waters, reflecting reverse ion exchange. Field−4: Na–Cl-type waters, reflecting evaporation or mixing with seawater); (b) Location of four types of the samples.
Sustainability 15 06882 g011
Figure 12. Plots of (a) Cl/HCO3 vs. Cl; (b) NO3/Na+ vs. Cl.
Sustainability 15 06882 g012
Table 1. Weights and relative weights of hydrochemical parameters of groundwater for drinking purposes.
ParametersTDSTHNa+ClSO42−NO3pH
mg/Lmeq/L
Standards *10004508.77.045.211.436.5–8.5
Weight (wi)5354111
Relative weight (Rwi)0.250.150.250.200.050.050.05
* Standards for groundwater quality for Chinese drinking purposes (GB/T 14848-2017).
Table 2. Groundwater evaluation index and classification threshold * for irrigation purposes.
IndicesExcellentGoodDoubtfulUnsuitable
TDS/(mg/L)<500500–10001000–2000≥2000
SAR<1010–1818–26≥26
SSP<2020–6060–80≥80
MAR <50 ≥50
RSC/(meq/L) <1.251.25–2.50≥2.50
PI ≥7525–75<25
* Water quality classification standards are quoted from [24,26].
Table 3. Statistical analysis of the hydrochemical parameters of groundwater samples.
ItemsNa+K+Mg2+Ca2+ClSO42−NO3HCO3ECTDSTHpH
meq/Lμs/cmmg/L
Mean10.790.513.001.904.450.670.1611.052252.301126.25245.057.30
Min0.910.020.210.130.170.010.002.8642221119.185.96
Max69.353.118.268.8538.743.741.0637.1912,4206220657.788.23
SD12.490.531.741.437.030.620.194.801937.54969.11131.420.36
CV115.66103.3257.7875.19157.9592.47119.8943.4986.0286.0553.634.87
% of SEAL (1)37.39 15.650.000.00 32.176.961.74
(1) % of SEAL indicated the proportion of samples exceeding the drinking water standard to the total number of samples.
Table 4. Statistical status of groundwater assessment indicators for agricultural irrigation purposes and the proportion of water quality classification.
ItemsCalculation Result StatisticsProportion of Classification
AverageMaxMinExcellentGoodDoubtfulUnsuitable
TDS/(mg/L)1126.25622021110.43%57.40%23.47%8.70%
SAR7.9236.590.6276.52%10.43%5.22%7.83%
SSP61.4196.918.310.87%48.70%26.96%23.48%
MAR61.7791.128.98 19.13% 80.87%
RSC/(meq/L)6.1430.98−9.77 10.43%7.83%81.74%
PI87.23131.6830.87 74.78%25.22%0
Disclaimer/Publisher’s Note: The statements, opinions and data contained in all publications are solely those of the individual author(s) and contributor(s) and not of MDPI and/or the editor(s). MDPI and/or the editor(s) disclaim responsibility for any injury to people or property resulting from any ideas, methods, instructions or products referred to in the content.

