Communication

Non-Invasive Characterization of Subsurface Barriers Constructed via Deep Soil Mixing for Contaminated Land Containment

1
State Environmental Protection Key Laboratory of Soil Environmental Management and Pollution Control, Nanjing Institute of Environmental Sciences, Ministry of Ecology and Environment of China, Nanjing 210042, China
2
School of Sustainability, Civil and Environmental Engineering, University of Surrey, Guildford GU2 7XH, UK
3
Technology Innovation Center for Ecological Monitoring and Restoration Project on Land (arable), Ministry of Natural Resources, Geological Survey of Jiangsu Province, Nanjing 210018, China
*
Author to whom correspondence should be addressed.
Sustainability 2023, 15(8), 6783; https://doi.org/10.3390/su15086783
Submission received: 15 February 2023 / Revised: 31 March 2023 / Accepted: 5 April 2023 / Published: 17 April 2023
(This article belongs to the Special Issue Safe Disposal of Solid Waste in Landfill)

Abstract

:
Deep soil mixing has been widely used to construct subsurface barriers (cut-off walls) in contaminated sites for contamination containment. Non-invasive geophysical methods are promising for the characterization and assessment of such barriers. The aim of this study was to assess and compare the characterization performance of four geophysical methods (i.e., electrical resistivity tomography, ground-penetrating radar, seismic imaging, and the transient Rayleigh surface wave method) for a subsurface barrier built using soil-mixing technology. The electrical resistivity tomography results show that the overall resistivity of the stratum on the barrier wall increased markedly, and local defects such as pockets of clay appeared as low-resistance anomalies on the resistivity profile. In contrast, the ground radar method failed to make a reasonable evaluation of the quality of the barrier wall because the surrounding environment caused great noise interference. The seismic mapping method had a better performance when the lateral geological conditions were studied. It is also suggested that to improve the signal-to-noise ratio of the surface wave signal, a vibrator with stronger energy should be used, and if conditions permit, the surrounding vibration sources should be shut down during geophysical tests. It is therefore recommended that decision makers and engineers consider using a combination of geophysical methods to evaluate the quality of barrier walls. They should also pay close attention to the specific geological conditions of a survey area, such as the presence of saltwater layers and interference from nearby structures, in order to choose the most appropriate method.

1. Introduction

The pollution of soil and groundwater is a serious issue in many developing countries, affecting the sustainable development of the economy and society. Therefore, it is particularly important to carry out treatment and containment of polluted sites. In abandoned landfills, chemical plants, and other polluted sites, if a detailed survey and treatment are not carried out, the spread of pollutants will affect human health and cause a series of problems. The use of cut-off walls as a subsurface barrier for contaminated land containment promotes sustainability by preventing the spread of pollutants and reducing the need for ongoing remediation efforts, ultimately leading to improved environmental and economic outcomes [1]. Non-invasive geophysical methods can be used for underground detection and are promising for the long-term monitoring and assessment of subsurface barriers in contaminated land. These methods are not only efficient, convenient, and low-cost; they can also obtain continuous data, which are a great help for the characterization of pollution features.
Commonly used non-invasive geophysical methods include electrical resistivity tomography (ERT), ground-penetrating radar (GPR), induced polarization (IP), transient electromagnetics (TM), etc. ERT can quickly and efficiently detect polluted sites [2,3], and the detection results can effectively reflect the pollution distribution information of polluted sites to facilitate the preliminary assessment of the degree and scope of pollution in contaminated sites [4]. Rosales et al. [5] used the ERT method to conduct environmental monitoring of the soil under a gas station. Dong et al. [6] verified the feasibility of using ERT to survey sites contaminated with inorganic acids. Kumar et al. [7] applied ERT and time-domain induced polarization (TDIP) in hard rock for groundwater investigations in Choutuppal, Telangana, India. Catapano et al. [8] confirmed the feasibility of using GPR in 3D tomography for oil leakage monitoring through experiments. Wang et al. [9] used a combination of three methods, namely frequency domain electromagnetics (FDEM), ERT, and GPR, to investigate heavy-metal-contaminated sites before and after remediation, and proved that GPR can effectively locate shallow-buried objects, providing verification for the completion of remediation. Splajt et al. [10] investigated the use of ground-penetrating radar and reflectance spectroscopy in landfill monitoring. The utilization of ground-penetrating radar data to identify leachate leakage from the cracks of a cut-off wall has also been demonstrated. Lu et al. [11] conducted a GPR survey at a site that was partly excavated and filled with highly contaminated soils. The results show that the LNAPL contamination area could be revealed by GPR data at a lower radar signal amplitude. After 19 months of monitoring, Simyrdanis [12] used time-shift ERT technology to monitor and map underground pollution caused by waste generated in the olive oil production process, accurately showing the migration direction of the pollutants. Previous studies have also used seismic methods to investigate contaminated sites, and have found that the seismic reflection method is effective in detecting changes in the subsurface structure caused by contamination. The seismic wave method has also been used to map the depth and thickness of the contaminated layer, and the seismic tomography method has been used to identify the distribution of pollutants [13,14].
Through the combined application of four non-invasive geophysical survey methods in a contaminated site, this study proved the effectiveness of the application of environmental geophysical survey methods to characterize subsurface barriers and the necessity of combining multiple methods to carry out reliable characterization. First, the site description and testing methods are presented, and then the non-invasive testing results are compared and analyzed. Through the combined use of four methods, the application effects, specific advantages, and limitations of each method are discussed.

2. Site Description and Testing Methods

2.1. Site Description

The subsurface barrier system constructed via deep soil mixing was installed at a contaminated site in Jiangsu, China, in September 2019, along with the other remediation activities undertaken at the site. This area has been in a state of subsidence since the Mesozoic, and after the Cenozoic, a series of lowlands and lake basins formed. Large-scale transgression makes the groundwater mostly salty, but shallower than 10 m. Due to the infiltration and recharge of freshwaters such as rainfall and surface water, the quality of groundwater has been significantly desalinated, forming a shallow desalination zone. The salinity of groundwater is an important parameter in non-invasive geophysical testing as it affects the electrical resistivity of soils. Total dissolved solids (TDSs) assay results around the site are shown in Figure 1a. Two wells, which were at a depth ranging from 0 to 5 m, held freshwater, and the amount of TDSs present was less than 1 g/L. Three wells, located at a depth of 5–10 m, held brackish water, and the amount of TDSs present was between 1 and 2 g/L. Six wells with a depth of more than 15 m held saltwater with an amount of TDSs exceeding 15 g/L. The results show the obvious stratification characteristics of TDSs, which formed a stratification of fresh water in the upper part, a transition zone in the middle, and saltwater in the lower part.
The construction of the low-permeability barrier system was such that barrier wall sections were installed to contain the chemical plant. The subsurface barrier walls were constructed using a PH-5A single-auger soil-mixing system, producing one column with each penetration. The columns had a designed diameter of 700 mm and depth of 16 m, and each installation overlapped by 200 mm. The soil-mixing binder used was a CEM II/B-V 32.5 cement consisting of 75% ordinary Portland cement and 25% fly ash (Yancheng Cement Ltd., Yancheng, China). The water-to-cement ratio of the grout was 1.0 and the soil-to-cement ratio was 7.3, which were determined via a series of lab tests before construction commenced.
The layout of the three geophysical testing lines at the site is shown in Figure 1b. Testing Line 1 and 2 were on the subsurface barriers where the ERT, ground-penetrating radar method, seismic image method, and Rayleigh surface wave method were used for non-invasive characterization. Line 3 was three meters away and parallel with Line 1, acting as a reference line for the ground without subsurface barriers, and only a high-density resistivity test was conducted. The surface conditions and main interference factors of each testing line are summarized in Table 1.

2.2. Non-Invasive Testing Methods

The subsurface barrier wall was not located very deep, the local defects in the barriers were small, and the differences in physical properties between the local defects and the barriers were not significant. Therefore, geophysical methods for non-invasive characterization of barriers were required to obtain a relatively high resolution and signal-to-noise ratio. According to the characteristics of subsurface barriers, geophysical methods based on the electrical and elastic characteristics of the ground were selected, including electrical resistivity tomography, ground-penetrating radar, shallow seismic exploration, and transient surface wave.
Electrical resistivity tomography (ERT) was used to investigate the electrical property differences between the native soil and subsurface barriers. The main acquisition parameters were as follows: the number of electrodes was 60–180; the electrode distance was 1 m; the maximum isolation factor was 19–30; and the power supply voltage was 450 V. A WGMD-9 ERT system (Chongqing Pentium, Chongqing, China) was adopted, and the electrode array of Wenner was used for data acquisition. The data collected in the field were first transferred to the computer through an SD card, and the original data format (.wda) was converted into a format (.dat) suitable for the analysis with the RES2DINV software. Then, the RES2DINV processing software was used to pre-process the raw data through procedures such as splicing and mutation point elimination. Thirdly, 2D inversion was carried out using the RES2DINV software, and the inversion routine was based on the smoothness-constrained least-squares method. The difference between calculated and measured apparent resistivity values was given by the root mean squared (RMS) error in the inversion procedure, and the RMS errors of L1–3 were 8.0%, 9.8%, and 2.2%, respectively. Finally, the inversion model was derived, and a resistivity cross-section diagram was drawn using mapping software.
GPR is a detection method that uses high-frequency radio waves to determine the material distribution in a medium. An SIR-30E geological radar instrument (GSSI, US) was used. The main acquisition parameters were as follows: the main frequency of the antenna was 100 MHz, the point distance was 0.25 m, the sampling rate was 1024, and the emissivity was 100 KHz. The Radan7 data processing system (GSSI, US) was adopted.
The Aether Multifunctional Geophysical System produced by Crystal Globe Geophysical Research & Service, USA, was used to obtain seismic image records with a high signal-to-noise ratio and resolution. The acquisition parameters were as follows: digital detector with a 40 Hz main frequency, offset distance of 10 m, point distance of 1 m, recording length of 100 ms, 18-pound sledgehammer source, and resin backing plate excitation. For seismic image data processing, we used the Geogiga SF Imager module in the Geogiga Seismic Pro seismic data processing software (Geogiga Technology, Calgary, AB, Canada). By selecting the processing parameters reasonably and optimizing the processing flow, high-quality time profiles and depth profiles could be obtained. The same equipment was also used for active source surface wave exploration, which is a new engineering seismic exploration method that uses the dispersion characteristics of Rayleigh surface waves to study the petrophysical properties of near-surface formations.

3. Results and Discussions

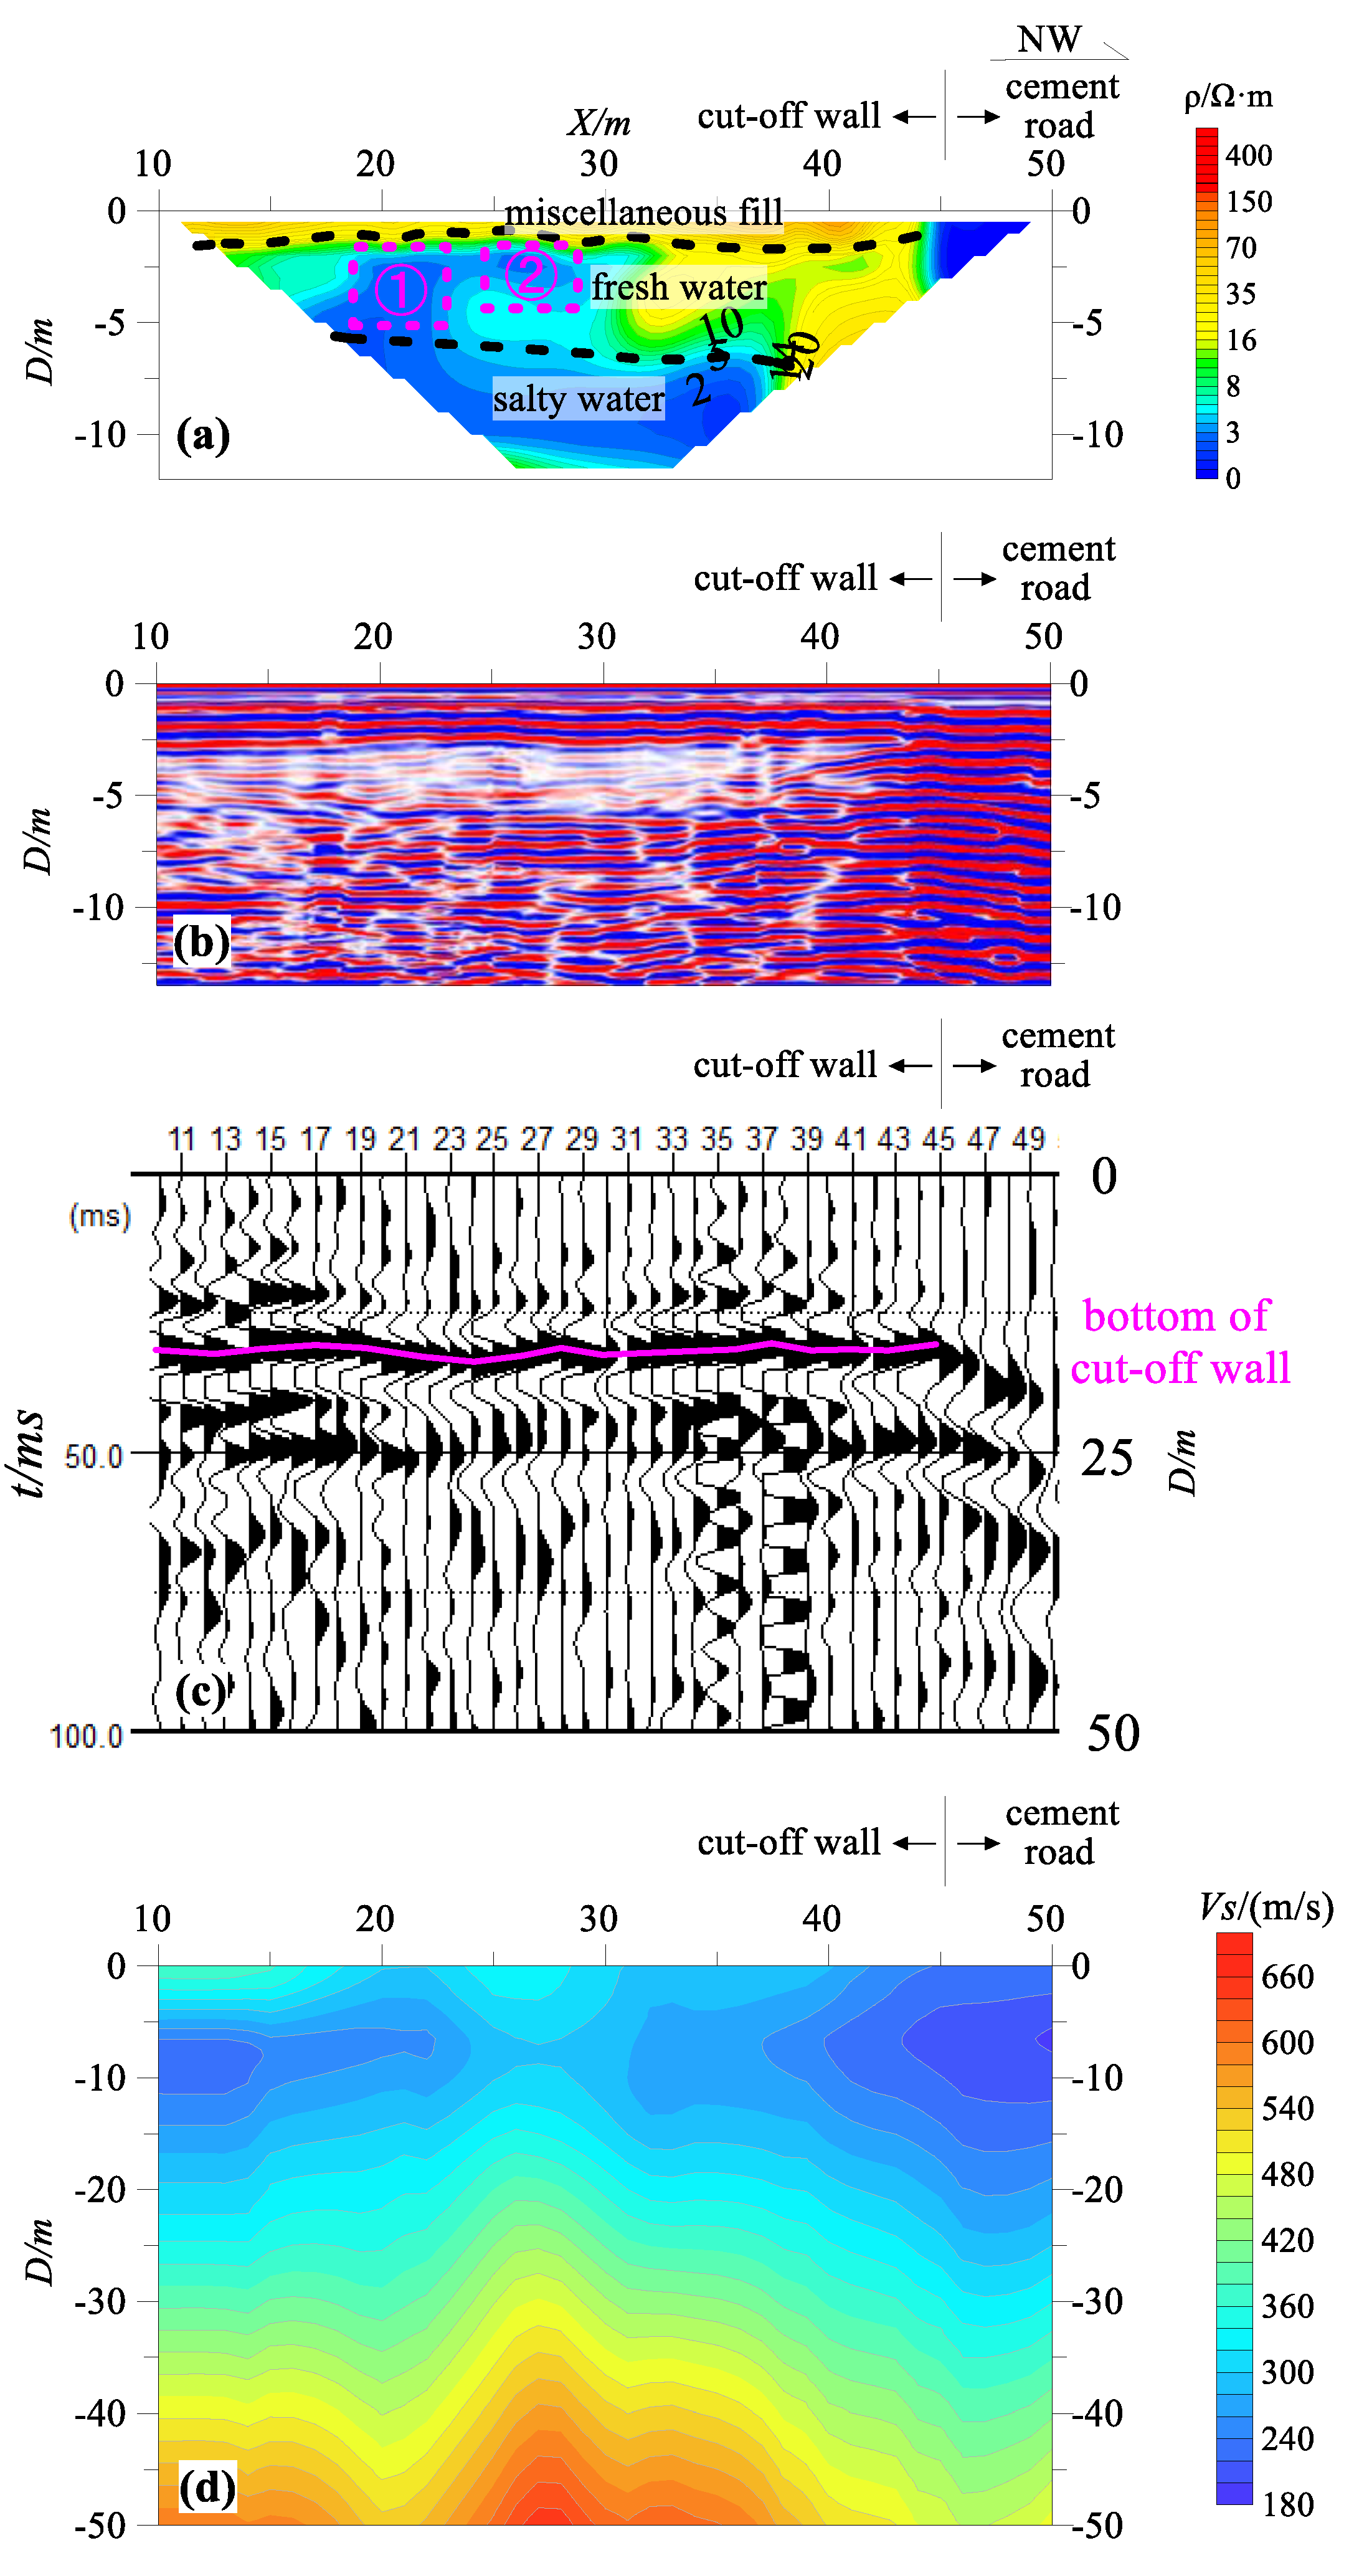
3.1. Electrical Resistivity Tomography

Figure 2 shows the contrast profiles of the resistivity inversion created by using the ERT on the barrier wall and outside the wall. Figure 2a shows the inversion resistivity profile of Line 1 on the barrier wall; Figure 2b shows the profile of Line 3 outside the barrier wall. The abscissa on each section is the station number, and the ordinate is the depth. It can be seen from the figure that the vertical electrical variations in the vertical barrier wall and those outside the wall were basically the same; that is to say, the resistivity above 9 m was generally greater than 5 Ω·m, which corresponds to a shallow high-resistivity layer; the resistivity below 9 m was generally less than 5 Ω·m, which corresponds to a relatively low-resistance layer. At the same time, it can be seen from the comparison that there was a superficial high-resistance layer with a resistivity greater than 20 Ω·m in the section below 2 m on the barrier wall. Combined with the groundwater test and geophysical results for the survey area, the high-resistivity layer at shallower than 9 m was inferred to be a phreatic freshwater layer, and the relatively low-resistivity layer deeper than 9 m was inferred to be a phreatic saltwater layer. It can be seen that ERT was particularly sensitive to the saltwater layer, and could effectively divide the salt and freshwater interface. The resistivity contours in the freshwater layer area on the profile map reflect the lithological changes in the formation. However, the resistivity contour of the saline layer mainly reflects the change in the salinity of the saline layer and somewhat reflects the lithology changes in the formation and the quality of the barrier wall. Therefore, due to the influence of the saltwater layer, the extraction of relevant information for the detection of the barrier wall via ERT in the survey area was mainly limited to the freshwater layer area.
Figure 2a,b shows the outer section of the barrier wall, which generally shows the characteristics of an alternating distribution of high-resistance areas and low-resistance areas. The resistivity of the upper section of the barrier wall was higher than that of the outer section of the barrier wall, reflecting the electrical characteristics of the high-resistance cement–soil barrier. As determined by examining the overall uniform resistivity contours shown in Figure 2a, there were three local low-resistivity anomaly areas, numbered ①~③, located at 65–69 m, 82–87 m, and 107–111 m. It is inferred that these three low-resistance anomaly areas were local defect areas, and there might be local non-uniform soil mixing.

3.2. Comparative Analysis of Four Testing Methods

Figure 3a shows the resistivity profile of Line 1. As discussed in the previous section, information about the barrier wall in the saltwater layer was completely irretrievable. The time profile of the GPR in Figure 3b shows that a reflection wave with strong amplitude and horizontal straightness was detected at shallow depths above 5 m, and reflection characteristics, including weak amplitude and poor lateral continuity, were shown below 5 m. The depth of the barrier wall could not be determined from the radar time profile, and it was more difficult to assess the local defects in the barrier wall. However, GPR could effectively identify the underground metal pipelines. Therefore, GPR could be used for the investigation of hidden disturbances in the site in the detection of the barrier wall. Figure 3c shows the seismic image section of Line 1. There was a relatively obvious phase axis near 32 ms in the section. This phase axis had strong reflection energy, gentle fluctuations in the longitudinal direction, good continuity in the lateral direction, and no wrong break phenomenon. However, near point 170, there was a phenomenon of dislocation and discontinuity of the phase axis, which was completely consistent with the turning position of the barrier wall. After the time–depth conversion of the wave speed data, the depth corresponding to the position of the phase axis was determined to be about 16 m, which is consistent with the bottom boundary depth of the barrier wall. Therefore, it can be inferred that this phase axis reflected the bottom boundary of the barrier wall, which was horizontally flat, continuous, and clear, indicating the good quality of the barrier wall. Figure 3d shows the shear wave velocity profile of Line 1 as measured using the active source surface wave method. The lateral extension of each velocity layer in the profile was relatively gentle, and only the low-velocity layer bulged out to the deep part near point 75. It was verified via an on-site investigation that this was a disturbance caused by the pipeline.
In general, ERT can better reflect the resistivity of the barrier wall and analyze the construction quality. However, due to the influence of groundwater salinity, the bottom interface of the barrier wall could not be reflected. The seismic image method could reflect the undulation and burial depth of the bottom interface of the barrier wall. The GPR method had no good reflection on the bottom boundary of the barrier wall. The active source surface wave method should theoretically have reflected the wall geometry, but this was not achieved due to the strong interference in the work area and the weak source energy.
Line 2 was a short measurement line. Points 0–45 were directly arranged on the barrier wall, and points 45–60 were arranged on cement pavement. It can be seen from Figure 4a that the electrical characteristics of the 0–45 m stake on the barrier wall and the 45–60 m stake on the cement pavement were significantly different. The electrical characteristics of the 0–45 m stake were similar to those of Line 1, and could be divided vertically into three electrical layers, corresponding to a shallow high-resistance layer, a submerged freshwater layer, and a submerged saltwater layer. It was inferred that there were two local defect areas in the profile, numbered ① and ②, located at stakes 19–23 m and 24–28 m, respectively. At 45–60 m, the cement pavement had abnormally low resistance, and any useful underground information was completely concealed. In Figure 4b, the reflection wave phase axis with strong amplitude and horizontal straightness is shown to be as shallow as 5 m, and the reflection characteristics, including weak amplitude and poor transverse continuity, were shown below 5 m. The depth of the wall could not be determined from the radar time profile. Figure 4c shows the seismic image section of Line 2. There was a relatively obvious phase axis near 32 ms, but after point 45, the phase axis was staggered, and it disappeared near point 50. It is speculated that the strong energy phase axis in the range of points 0–45 was the reflection interface of the bottom boundary of the barrier wall. Figure 4d shows the shear wave velocity profile of Line 2 as measured by the active source surface wave method. There was an obvious low-velocity layer in the shallow part near point 45. It is speculated that there was a gap between the cement pavement and the underlying ground. This also explains why the phase axis of the cement section in the seismic image was concave and the energy was weakened.

4. Conclusions

The overall resistivity of the stratum on the barrier wall rose, and the lateral continuity of the resistivity contour was enhanced. ERT was particularly sensitive to the saltwater layer, which covered up the information about the barrier wall. In the freshwater layer, the lateral continuity of resistivity contours could be used to effectively identify the internal defects of the barrier wall. Local defects, such as pockets of clay, appeared as low-resistance anomalies on the resistivity profile.
The GPR failed to make a reasonable evaluation of the quality of the barrier wall because the width of the wall was smaller than the size of the radar antenna. The factory buildings, large equipment, and local pipelines near the survey line all caused great interference in the original data. The seismic mapping method had a better performance when the lateral geological conditions were studied, with the advantages of fast data processing. However, when there were many target layers to be detected, multiple reflection events complicated the characterization of the reflection interface.
The active source surface wave method can theoretically reveal wall structures; however, due to its poor anti-interference ability and the fact that the survey area was located in an active chemical plant with strong background noise, the signal-to-noise ratio of the collected data was too low. To improve the signal-to-noise ratio of the surface wave signal, a vibrator with stronger energy should be used, and if conditions permit, the surrounding vibration sources should be shut down during geophysical tests.
It is therefore recommended that decision makers and engineers consider using a combination of geophysical methods to evaluate the quality of barrier walls. They should also pay close attention to the specific geological conditions of a survey area, such as the presence of saltwater layers and interference from nearby structures, in order to choose the most appropriate method. Additionally, decision makers should strive to improve the signal-to-noise ratio of the surface wave signal by using stronger energy vibrators and shutting down surrounding vibration sources during testing to achieve more accurate results. Finally, decision makers should continue to invest in the development of non-invasive monitoring technologies based on geophysical methods, as they have the potential to play an increasingly important role in investigating contaminated sites and providing effective technical support for remediation efforts.
Geophysical methods have the advantages of non-invasiveness, high efficiency, high resolution, and a low cost, and they can be used to realize dynamic monitoring of pollutant diffusion and barrier wall performance by conducting multiple time-shift observations in the same contaminated site. We expect that with improvements in instrument performance, the optimization of data processing methods, and the accumulation of practical experience, non-invasive monitoring technology based on geophysical methods will play an increasingly important role in the investigation of contaminated sites, so as to provide effective technical support for the investigation of contaminated sites.

Author Contributions

Conceptualization, B.C.; data analysis, T.S. and G.J.; writing—original draft preparation, X.W.; writing—review and editing, B.C.; funding acquisition, B.C and J.X. All authors have read and agreed to the published version of the manuscript.

Funding

This research was funded by the Youth Program of the National Natural Science Foundation of China (42107220).

Institutional Review Board Statement

Not applicable.

Informed Consent Statement

Not applicable.

Data Availability Statement

All data, models, and code generated or used during the study appear in the submitted article.

Acknowledgments

The authors would like to acknowledge the technical support provided by Shoufeng Zhu and Rong Mei at the Geological Survey of Jiangsu Province.

Conflicts of Interest

The authors declare no conflict of interest.

References

  1. Cruz, N.F.; Marques, R.C. Scorecards for sustainable local governments. Cities 2014, 39, 165–170. [Google Scholar] [CrossRef]
  2. US EPA. Innovations in Site Characterization: Geophysical Investigation at Hazardous Waste Sites; United States Environment Protection Agency Office of Soil Waste and Emergency Response: Washington, DC, USA, 2000.
  3. Dahlin, T. The development of DC resistivity imaging techniques. Comput. Geosci. 2001, 27, 1019–1029. [Google Scholar] [CrossRef]
  4. Wang, Y.; Nai, C.; Wang, Y.; Dong, L.; Xu, Y. Comparison of anti-noise performance using wenner and dipole-dipole arrays in pollution survey. Res. Environ. Sci. 2013, 26, 879–884. [Google Scholar]
  5. Rosales, R.M.; Martínez-Pagan, P.; Faz, A.; Moreno-Cornejo, J. Environmental monitoring using electrical resistivity tomography (ERT) in the subsoil of three former petrol stations in SE of Spain. Water Air Soil Poll. 2012, 223, 3757–3773. [Google Scholar] [CrossRef]
  6. Dong, L.; Ye, T.F.; Neng, C.X.; Liu, Y.Q.; Gong, Y.L.; Chen, Y. Application of ERT technology in the investigation of inorganic acid contaminated sites. Environ. Sci. Res. 2008, 6, 67–71. [Google Scholar]
  7. Kumar, D.; Mondal, S.; Nandan, M.J.; Harini, P.; Sekhar BM, V.; Sen, M.K. Two-dimensional electrical resistivity tomography (ERT) and time-domain-induced polarization (TDIP) study in hard rock for groundwater investigation: A case study at Choutuppal Telangana, India. Arab. J. Geosci. 2016, 9, 355. [Google Scholar] [CrossRef]
  8. Catapano, I.; Affinito, A.; Bertolla, L. Oil spill monitoring via microwave tomography enhanced GPR surveys. J. Appl. Geophys. 2014, 108, 95–103. [Google Scholar] [CrossRef]
  9. Wang, T.P.; Chen, C.C.; Tong, L.T.; Chang, P.Y.; Chen, Y.C.; Dong, T.H.; Cheng, S.N. Applying FDEM, ERT and GPR at a site with soil contamination: A case study. J. Appl. Geophys. 2015, 121, 21–30. [Google Scholar] [CrossRef]
  10. Splajt, T.; Ferrier, G.; Frostick, L.E. Monitoring of landfill leachate dispersion using reflectance spectroscopy and ground-penetrating radar. Environ. Sci. Technol. 2003, 37, 4293–4298. [Google Scholar] [CrossRef] [PubMed]
  11. Lu, Q.; Feng, X.; Liu, C.; Li, H.L.; Sato, M. Detection of LNAPL contaminated soils by GPR. In Proceedings of the 2011 IEEE International Geoscience and Remote Sensing Symposium, Vancouver, BC, Canada, 24–29 July 2011; pp. 842–845. [Google Scholar]
  12. Simyrdanis, K.; Papadopoulos, N.; Soupios, P. Characterization and monitoring of subsurface contamination from Olive Oil Mills’ waste waters using Electrical Resistivity Tomography. Sci. Total Environ. 2018, 637–638, 991–1003. [Google Scholar] [CrossRef] [PubMed]
  13. Grandjean, G. A seismic multi-approach method for characterizing contaminated sites. J. Appl. Geophys. 2006, 58, 87–98. [Google Scholar] [CrossRef]
  14. Zelt, C.A.; Azaria, A.; Levander, A. 3D seismic refraction traveltime tomography at a groundwater contamination site. Geophysics 2006, 71, 67–78. [Google Scholar] [CrossRef]
Figure 1. (a) TDS distribution around the contaminated site; (b) layout of the non-invasive geophysical testing line.
Sustainability 15 06783 g001
Figure 2. Contrast profiles of resistivity inversion as determined by performing ERT (a) on the barrier wall (Line 1) and (b) outside the wall (Line 3).
Sustainability 15 06783 g002
Figure 3. Geophysical methods comparison for Line 1: (a) inversion of resistivity section by ERT; (b) time profile of GPR; (c) time profile of seismic image method; (d) transient Rayleigh surface wave profile.
Sustainability 15 06783 g003
Figure 4. Comparison of geophysical methods for Line 2: (a) inversion of resistivity section by ERT; (b) time profile of the GPR; (c) time profile of seismic image method; (d) transient Rayleigh surface wave profile.
Sustainability 15 06783 g004
Table 1. Surface conditions and main interference factors of each testing line.
No.Surface ConditionSurrounding StructuresMajor Interfering Factors
1Barrier wall located at 0–170 m, and the ground surface comprised exposed cement-mixed soil.The northwest side of the survey line was adjacent to two production plantsPlant, large equipment, local pipeline
2Barrier wall located at 0–45 m, and the ground surface comprised exposed cement-mixed soil.
The surface of the barrier wall at 45–60 m was covered by cement pavement.
The east side of the survey line was adjacent to an incinerator deviceIncinerator installation, cement pavement
3Native soil without subsurface barriers-Underground pipeline
Disclaimer/Publisher’s Note: The statements, opinions and data contained in all publications are solely those of the individual author(s) and contributor(s) and not of MDPI and/or the editor(s). MDPI and/or the editor(s) disclaim responsibility for any injury to people or property resulting from any ideas, methods, instructions or products referred to in the content.

