Article

Experimental and Modeling Study on the Removal of Mn, Fe, and Zn from Fiberboard Industrial Wastewater Using Modified Activated Carbon

by
Syafiqa Ayob
1,
Wahid Ali Hamood Altowayti
2,*,
Norzila Othman
3,*,
Faisal Sheikh Khalid
1,
Shafinaz Shahir
2,
Husnul Azan Tajarudin
4,* and
Ammar Mohammed Ali Alqadasi
5
1
Faculty of Civil Engineering and Built Environment, Universiti Tun Hussein Onn Malaysia, Parit Raja 86400, Johor, Malaysia
2
Department of Biosciences, Faculty of Science, Universiti Teknologi Malaysia, Johor Bahru 81310, Johor, Malaysia
3
Micro-Pollutant Research Centre (MPRC), Department of Civil Engineering, Faculty of Civil Engineering and Built Environment, Universiti Tun Hussein Onn Malaysia, Parit Raja 86400, Johor, Malaysia
4
Division of Bioprocess, School of Industrial Technology, Universiti Sains Malaysia, Gelugor 11800, Pinang, Malaysia
5
Department of Computer Science, Faculty of Information and Communication Technology, International Islamic University Malaysia, Kuala Lumpur 53100, Selangor, Malaysia
*
Authors to whom correspondence should be addressed.
Sustainability 2023, 15(8), 6734; https://doi.org/10.3390/su15086734
Submission received: 5 December 2022 / Revised: 24 December 2022 / Accepted: 26 December 2022 / Published: 17 April 2023

Abstract

:
In this work, the use of agricultural waste from oil palm petioles (OPP) as a raw material for the production of activated carbon (AC) and its characterization were examined. By soaking these chars in nitric acid (HNO3) and potassium hydroxide (KOH) at a 10% concentration, AC with favorable high-porosity carbons was generated. To maximize AC synthesis, the AC was pyrolyzed at 460, 480, and 500 °C temperatures for 20 min. Based on micrographs of formed pores and surface functional groups, 480 °C carbonization temperature on both chemical HNO3 and KOH was shown to be the best. The FTIR measurements reveal that chemical activation successfully transformed the raw material into AC. Moreover, FESEM micrographs show the pores and cavities of the prepared AC achieve a high surface area. This is further supported by BET results of HNO3 OPP AC and KOH OPP AC with surface areas of 883.3 and 372.4 m2/g, respectively, compared with the surface area of raw OPP of 0.58 m2/g. Furthermore, the tests were revealed by an optimization model, namely response surface methodology (RSM), using a central composite design (CCD) technique. The findings showed that all three parameters (pH, time, and dose) had a substantial impact on the removal of Zn, Fe, and Mn. Analysis of variance (ANOVA) and analytical error indicated that the models were accurate, with a low error value and a high R2 > 0.9. Remarkably, the good correlation between actual and predicted removal values showed that the modified activated carbon is a promising adsorbent for heavy metal removal from wastewater.

1. Introduction

Fiberboards are wood fiber agglomerates which are mainly used for furniture manufacture. This product has been on the increase for years, given its high resistance, stability, and quality finish, coupled with reasonable costs. In the fiberboard industry, the processing procedure has harmful effects on the aquatic environment due to important concentrations of dangerous chemicals. These products require the use of large quantities of water. According to Kloch and Toczyłowska-Mamińska [1], the plants producing wood-based panels use between 0.1 and 1.5 m3 of water per 1 m3 of panel produced, and they estimated that the global wood-based panel industry can generate up to 600 million m3 of wastewater every year.
One of the most water-consuming processes during wood-panel processing is wood chip washing [2]. Leaching takes place when the chips are being washed. Metal ions, such as calcium, potassium, manganese, magnesium, and iron, are naturally occurring components in wood [3]. The extraction of organic acids from the wood gives the wastewater a low pH of 5.5 [4]. Santos et al. [5] detected several heavy metal ions from wood chip leachings such as copper, iron, and manganese. This is also in line with [6] findings, whereby, during the woodchip flushing analysis, metal ions as such copper (Cu), aluminum (Al), zinc, manganese (Mn), barium, and iron (Fe) was detected.
Some heavy metals are required in small amounts by humans, but the majority of them are harmful even at low concentrations and toxic at higher concentrations. Heavy metals specifically are more dangerous owing to their non-biodegradability [7]. Regardless of wood species, the majority of wood chip leaching shows significant solute metal ions. The phenomenon results from different conditions of wood treatment and different origins of logs [1]. Consequently, the degradation of such toxic substances in wastewater is a significant processing problem and of high importance. Furthermore, the current environmental regulations have restricted their ultimate discharge into water bodies [2].
Extensive research has been conducted over the past years to find low-cost, high-capacity adsorbents for metal ion removal [8,9]. Activated carbon has been gaining attention from researchers, especially as a contaminant removal media worldwide. It has long been recognized as an effective adsorption material due to its large surface area, large number of surface-active adsorption sites, and high adsorption capacity. Activated carbon can be manufactured from any type of carbonaceous material. In commercial practice, the most common raw materials used are coal, peat, lignite, wood, and coconut shell [10,11,12]. However, according to Bakar et al. [13] and Duan et al. [10], commercial activated carbons are very expensive and non-renewable. Thus, many researchers have shifted to developing a new low-cost activated carbon from waste material that is more affordable and abundantly available [14,15]. El-Bendary et al. [14], for example, modified corn cobs and luffa using aluminum chloride as effective low-cost adsorbents for the removal of Fe(III) from aqueous solutions. Additionally, the increased demand for the commercial adsorbent activated carbon has caused its price to rise. Therefore, by converting the commercial adsorbent into agricultural waste, according to Ayob et al. [15], this process is more environmentally friendly.
In Malaysia, oil palm plantations have produced 135 million tons of agricultural waste annually [16]. Oil palm fronds are one of the massive wastes in oil palm plantations [17]. Dungani et al. [16] and Said et al. [18] estimated that 4.16 million tons of frond waste is from replanting activities, and 51.66 million tons are from pruning activities. Previous studies have shown that different parts of oil palm waste can be utilized as activated carbon, i.e., empty fruit bunches [19,20,21], palm kernel shell, mesocarp fibers, and trunks [6]. A study from Ujile and Okwakwam [22] used empty fruit bunches (EFB) as activated carbon, and they were able to remove 57% of iron, 99.6% of copper, and 90% of cadmium. Meanwhile, a study from Baby and Hussein [23] shows that oil palm kernel shells impregnated with phosphoric acid removes 99% of chromium, 80% of cadmium, 80% of zinc, and 99% of lead.
Similar to other biomaterials, activated carbon generated from oil palm waste is normally developed via physical or chemical activation [24]. Physical activation is a two-stage process that begins with carbonization in the presence of inert gas and ends with activation with the help of an oxidizing gas, while chemical activation, often known as “wet oxidation”, is a one-stage process in which carbonization and activation occur concurrently [11,13,25]. Both kinds of activation have advantages and disadvantages; nevertheless, chemical activation is preferred by researchers due to its low heating temperature, quick processing time, high carbon yield, well-controlled porosity, and high specific surface area [10,25].
Chemical activation has long been known and used in the production of biomaterials such as activated carbon. One of the important elements in chemical activation is the type of activating agent used. The main functions of chemical reagents are to degrade or dehydrate the organic components during the activation process to suppress the depolymerization of hydrocarbons on the carbon surface [10]. Activating agents may be grouped into four groups based on the acid–base theory and activation mechanism, such as alkaline, acidic, neutral, and self-activating agents [25]. These types of activating agents will react differently with carbon precursors and lead to various activation mechanisms [25].
An efficient statistical method known as Response Surface Methodology (RSM) offers an exploratory approach to optimization. Additionally, it is a set of mathematical and statistical methods used to maximize the relevance of several influencing elements, even when complicated interactions are present [24]. The primary goal of using RSM is to identify the optimum operating parameters for the process or an area that complies with the operating requirements [25]. By integrating RSM with a central composite design (CCD) approach to optimize all the influencing factors simultaneously, the limitations of standard analytical optimization methods may be completely removed [26].
Thus, in this study, activated carbon derived from oil palm petiole (OPP) is prepared using two different types of activating agents, namely acid and alkaline. The effect of the activating agent on the physio-chemical characteristics and adsorption efficiency of activated carbons (AC) was identified and further discussed. Moreover, the AC was evaluated for the simultaneous adsorption of three different metal ions that represented contaminates in fiberboard processing industrial wastewater. Furthermore, Expert Design Software version 13 was used to evaluate the predicted removal (%) of Zn, Fe, and Mn from aqueous solution by KOH-impregnated AC and impregnated HNO3. In order to optimize the three parameters (pH, adsorbent dose, and contact time) that affect the removal of Zn, Fe, and Mn metals, the RSM model with a central composite design (CCD) technique was applied. Additionally, to validate the accuracy of the models, the performance of the model was evaluated using statistical analysis and coefficient of determination (R2).

2. Materials and Methods

2.1. Material Preparation

Oil palm fronds were collected from a local oil palm plantation located at Kg. Rahmat, Batu Pahat, Johor. The leaf was exiled from the oil palm fronds and only the petiole of the oil palm was employed in this study, as shown in Figure S1 (The Picture of oil palm petiole (OPP) that has been extracted from oil palm fronds). The OPP was parched for 2 weeks and pretreated using hydrochloric acid to remove visible dirt and accumulation of impurities from the surface before being oven-dried. The oven was set to 80 °C and left for 24 h to remove all moisture content. For activation, two types of impregnation chemicals were prepared, namely potassium hydroxide (KOH) (≥85%, pellets) and nitric acid (HNO3) (≥70.0%) purchased from Sigma-Aldrich (Burlington, MA, USA) (M) Sdn Bhd. Dried OPP was soaked in 1000 mL of 10% diluted KOH or HNO3 and left for 24 h. Subsequently, the impregnated OPP was dried in an oven and carbonized using a muffle furnace with activation temperatures of 460, 480, and 500 °C. The activation temperature was selected, based on the findings of the thermogravimetric analyzer (TGA) analysis.

2.2. Material Characterization

The physicochemical features and morphological structure of OPP were investigated. Lignocellulose analysis was carried out to determine the presence of crude fibers such as cellulose, hemicellulose, and lignin in OPP. A simple standard was adopted in this analysis in order to extract three different detergent fibers, namely natural detergent fiber (NDF), acid detergent fiber (ADF), and acid detergent lignin (ADL) using fiber hot and cold extraction. Prior to the analysis, the OPP precursor was ground into small pieces (75 mesh) and oven-dried (80 °C) until the constant weight was less than 1% within 24 h.
Thermal decomposition analysis was carried out by using a thermogravimetric analyzer (TGA) before the carbonization process. TGA analysis was performed using a TGA Instruments 500. Ten mg of OPP was placed in a platinum pan. The samples were then heated under the nitrogen atmosphere at 30 mL/min at 10 °C min−1 with the heating rate equilibrated at 30 °C to 900 °C [27].
For qualitative analysis, FTIR and Field Emission Scanning Electron Microscope (FESEM) analysis were carried out. For FESEM analysis, a JFM 7200F Field Emission Scanning Electron Microscope (JEOL, Tokyo, Japan) with electron beam lithography was used. Prior to the analysis, each sample was sputtered with gold using the JFC-1600 Auto Fine Coater (JOEL, Tokyo, Japan) for 40 s at 30 mA under a high vacuum until they were completely covered. The purpose of sample sputtering is to avoid charges dissipating during imaging.
Next, the FTIR spectrometer (Perkin Elmer Spectrum 100, Waltham, MA, USA) was employed in this study to determine the presence of surface functional groups in OPP. The spectra were set to the range of 4500–500 cm−1 for all the samples. The activated carbon’s specific surface area and pore distribution were determined with a multiple-point Brunauer, Emmet, and Teller (BET) gas adsorption measurement using the Micromeritics ASAP 2020 operated at 77 K. The t-plot micropore volume was used to compute the micropore volume. The amount of N2 adsorbed at relative pressures near unity ≈ 0.99 corresponds to the total amount adsorbed (VT) in both the micropores and the mesopores; consequently, the subtraction of the micropore volume from the total amount will provide the volume of the mesopores [28,29]. The pore size distribution will be determined by using Barrett Joyner Halenda’s (BJH) model.
The production of activated carbon was further discussed in terms of yield. The yield of OPP activated carbon (OPP-AC) was applied to calculate the following Equation (1):
Y i e l d   % = W i W f W i × 100
where W i is the initial weight and W f is the final weight.

2.3. Batch Adsorption

In order to determine the efficiency of AC produced, batch adsorption was carried out. Wastewater from the fiberboard industry was used as polluted water media. The initial investigation found that zinc (Zn), manganese (Mn), and iron (Fe) were the highest metal concentration in this wastewater; thus, these elements were chosen to be further treated. The batch adsorption study is investigated through optimum parameters. The optimal adsorption removal and adsorption capacity of a composite adsorbent were investigated under several conditions, including pH, adsorbent dosage, and contact time [30].
The pH range of the heavy metals (Mn, Fe, and Zn) was specified to be observed between acidic 6 and alkaline 14, or (6, 8, 10, 12, and 14). To achieve the optimum pH for heavy metal removal, the dose, shaking speed, contact time, and solution volume were kept constant at 0.2 g, 100 revolutions per minute, 90 min, and 100 mL, respectively. The impact of adsorbent dose was next examined by measuring the optimum pH value. According to our early research, the dose was set at 0.1, 0.2, 0.3, 0.4, 0.5, and 0.6 g/mL in order to determine the optimum dosage for heavy metal removal. According to our preliminary investigation, the impact of contact time was tested using 100 mL of wastewater with 0.2 g and 0.3 of KOH-impregnated AC and HNO3-impregnated AC adsorbent dose, respectively, with 100× g of shaking speed and contact time varied from 0 to 180 min.
The concentration difference between before and after the removal was used to calculate the Zn, Fe, and Mn ions’ removal percentage (R%) as follows [31]:
R % = C i   C e C i × 100
where: C i : The initial concentration of Zn, Fe, and Mn ions in mg/L; C e : The final concentration of Zn, Fe, and Mn ions in mg/L; M: The mass of KOH-impregnated AC and HNO3-impregnated AC adsorbent (g); V: The volume of the solution (L)

2.4. Design of Experimental Using RSM

The statistical design of experiments and data analysis were performed using Design Expert Software (version 13). RSM was used in this investigation to evaluate the relationships between the responses (Zn, Fe, and Mn removal%) and the independent factors (pH, adsorbent dose, and contact time), as well as to improve the necessary conditions of the variables in order to predict the optimal value of the responses. Among other RSM designs, CCD was used to examine the effects of the three components individually and together on the responses [32]. In order to analyze the interactions between parameters, CCD is suited for fitting a quadratic surface and aids in optimizing the effective parameters with a minimal number of tests [33]. Three factors were taken into account: pH (X1), adsorbent dose (X2), and contact time (X3). We selected these three variables and their associated ranges based on our initial study.
Table 1 lists the levels and ranges of the variables analyzed. The efficiency of Mn, Fe, and Zn removal was examined to assess the process’ performance. Based on some exploratory studies, each independent variable was adjusted at the indicated ranges among two levels of +1 and 1. Twenty tests were completed overall for the three factors (=2k + 2k + 6), where k is the total number of factors (k = 3) [34]. Six replications were added to fourteen trials to help determine the simple error. The quadratic model is the proper one, since there are only two levels for each factor:
Analysis of variance (ANOVA) is used to evaluate and determine the importance of each variable as stated in Equation (3) [34]:
Y = β ˳ + i = 1 k β i   χ i + i = 1 k β i i   χ i 2 + i = 1 k β i i   χ i 2 + i = 1 k 1 j = i + 1 k β i j χ i   χ j + ε  
where Y is the observed responses, χ i is the independent variables, and β ˳ is the constant variables; β i   , β i i , and β i j represent the coefficients for linear, quadratic, and interaction effects, respectively, and ε denotes the random error.
Contour plots and 3D surfaces are used to analyze the interactions and ideal operating conditions for heavy metal removal [35]. To determine the interaction between the process factors and the replies, graphs of the data were analyzed using analysis of variance (ANOVA). The coefficient of determination (R2) and analytical error analysis was used to describe how effectively the model matched the data [36]. Model F-value (Fisher variation ratio) and probability value (Prob > F) were the primary metrics used to show the model’s applicability and significance.

2.5. Analytical Error Analysis

To determine the best fitting of models onto removal data, the error function must be calculated [37]. It is necessary to analyze error functions in order to assess how well the models match the experimental data. The coefficient of determination (R2) is probably the function that is used the most often in research to choose the best models [38]. The best-fit model is selected based on the size of the coefficient of determination. The best match is often considered to be the model with the greatest coefficient of determination value (R2) [39]. Additionally, the fit for the removal data is improved by reducing the numerical value of the error functions for a particular model. The following are the formulas for the coefficient of determination and other error functions.

2.5.1. Coefficient of Determination (R2)

The coefficient of determination (R2 or r-squared), which measures the percentage of variation in the dependent variable that can be explained by the independent variable, is a statistical metric used in regression analysis. Additionally, the coefficient of determination shows how well the data match the model (the goodness of fit). The possible values are 0 to 1 for the coefficient of determination. Additionally, this is how the statistical metric is often expressed [38]:
R 2 = 1   i = 1 n ( M t A t ) 2 i = 1 n A t A

2.5.2. Mean Square Error (MSE)

The most used error measure is probably mean square error (MSE). Due to the higher effect of squaring bigger numbers than smaller ones, it penalizes larger mistakes. The MSE is calculated as follows by dividing the total squared errors by the total number of observations:
MSE = 1 n i = 1 n A t M t  

2.5.3. The Root Mean Square Error (RMSE)

The root mean square error (RMSE), which may be expressed as the following equation, is the square root of the mean square error (MSE):
RMSE = 1 n i = 1 n A t M t 2  

2.5.4. The Mean Absolute Deviation (MAD):

The total absolute difference between the actual value and the prediction divided by the number of observations is the mean absolute deviation (MAD), which can be written as the equation below:
MAD   = i = 1 n A t M t n

2.5.5. Mean Absolute Percentage Error (MAPE)

The following is how to express mean absolute percentage error (MAPE), which is the average of absolute errors divided by the actual observation values:
MAPE = i = 1 n A t M t A t n
where: A t : Experiment data, M t : Model date, n : number of experiments carried out.

3. Results and Discussion

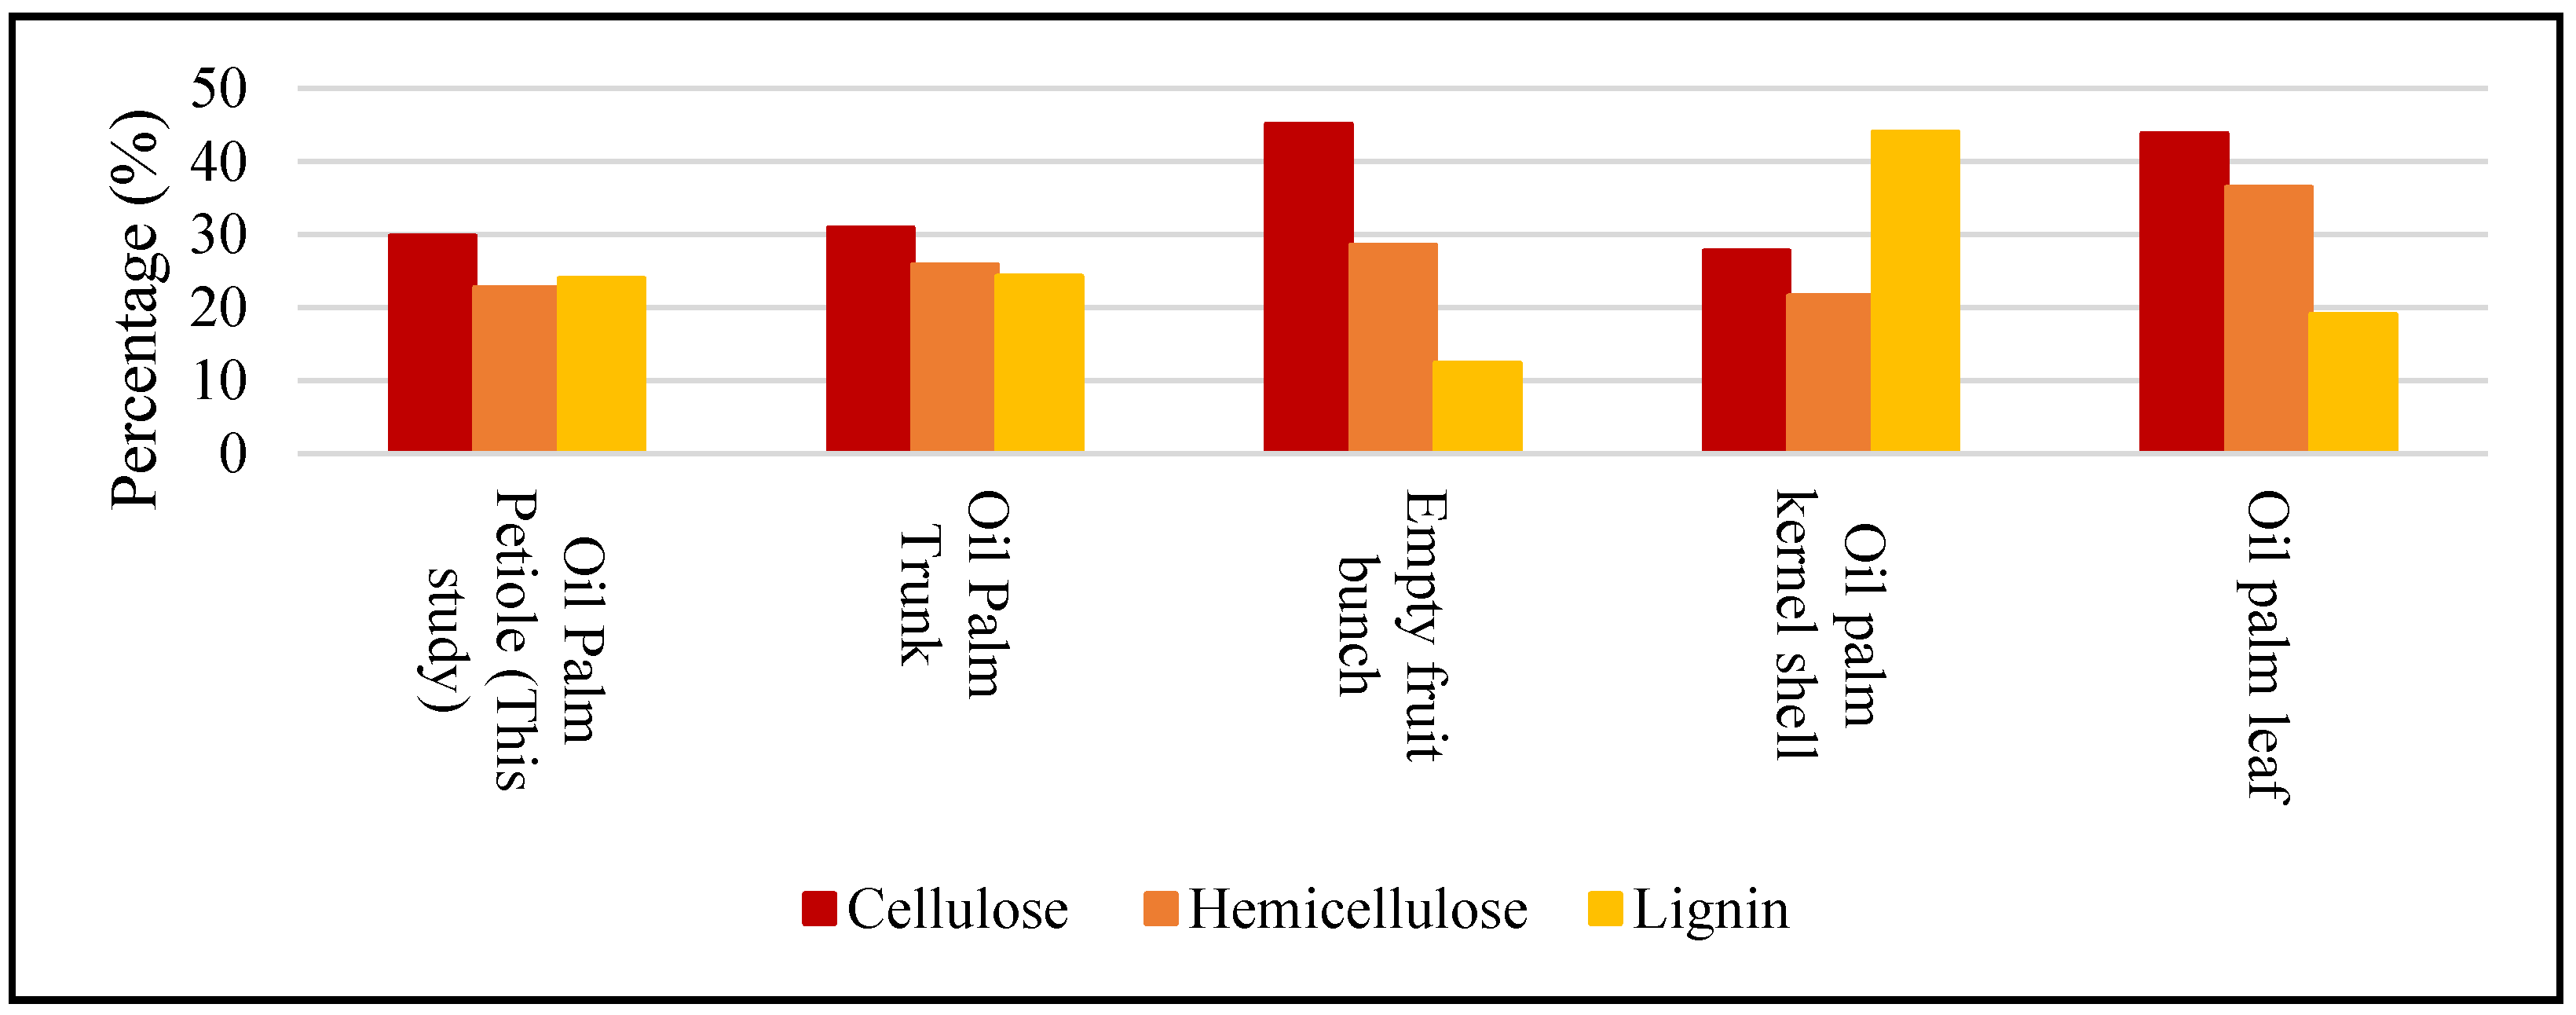
3.1. Cellulose, Hemicellulose, and Lignin Content

Lignocellulosic material is regarded as a mixture of cellulose, hemicellulose, and lignin. Cellulose and hemicellulose are made up of carbohydrates and make up holocellulose [40]. Cellulose is a glucose-based linear polymer with extra hydrogen bonds that make it hard, solid, and difficult to break. Hemicellulose, on the other hand, is found in secondary cell walls and is made up of tiny, highly branched chains of different pentoses and hexoses. Meanwhile, lignin, a very complex substance with a three-dimensional cross-linked polyphenolic structure, is present between the cellulose and hemicellulose cell walls [18].
Lignocellulose elements play an important role in the development of AC. According to Yunus et al. [41], materials with high lignin content developed AC with high macropores and materials with high cellulose yield developed AC with a predominantly microporous structure. Among these elements, lignin presents a significant advantage because it is resistant to chemical and biological degradation. Lignin is also said to be the most abundant component of charred materials. In addition, according to Baker et al. [13], lignin content appeared to correlate with the fixed carbon content and increased significantly after carbonization. The adsorption process is also strongly influenced by the chemical composition of the lignocellulosic fibers, especially the –OH and aromatic groups [40].
Figure 1 classifies the lignocellulosic of OPP from this study and other oil palm waste used as precursors for AC preparation. The results show that OPP has a high quantity of cellulose and a moderate amount of lignin, with values of 25.95 and 16.81%, respectively. This was also in line with Said et al. [18], who said that cellulose is the most essential element of oil palm biomass. In view of AC production, biomass with greater hemicellulose and cellulose content will almost certainly require a high conversion rate during carbonization [42]. In the present study, the percentage amount of cellulose in OPP is lower than in other types of palm oil biomass. Thus, the time taken for the degradation on OPP was relatively shorter, and the lower temperature was used to degrade the biomass constituents.
By comparing the range of ash of the other precursors, it was found that OPP gives a lower percentage of ash, which was 1.71% [43,44]. This value was also less than the maximum limit set by ASTM D-2866-94, which was 5%. The purpose of measuring the ash content of activated charcoal is to quantify the metal oxide content of AC and also as an indication of high-grade carbon. In this study, OPPs are ideally suited to be employed as AC’s precursor.

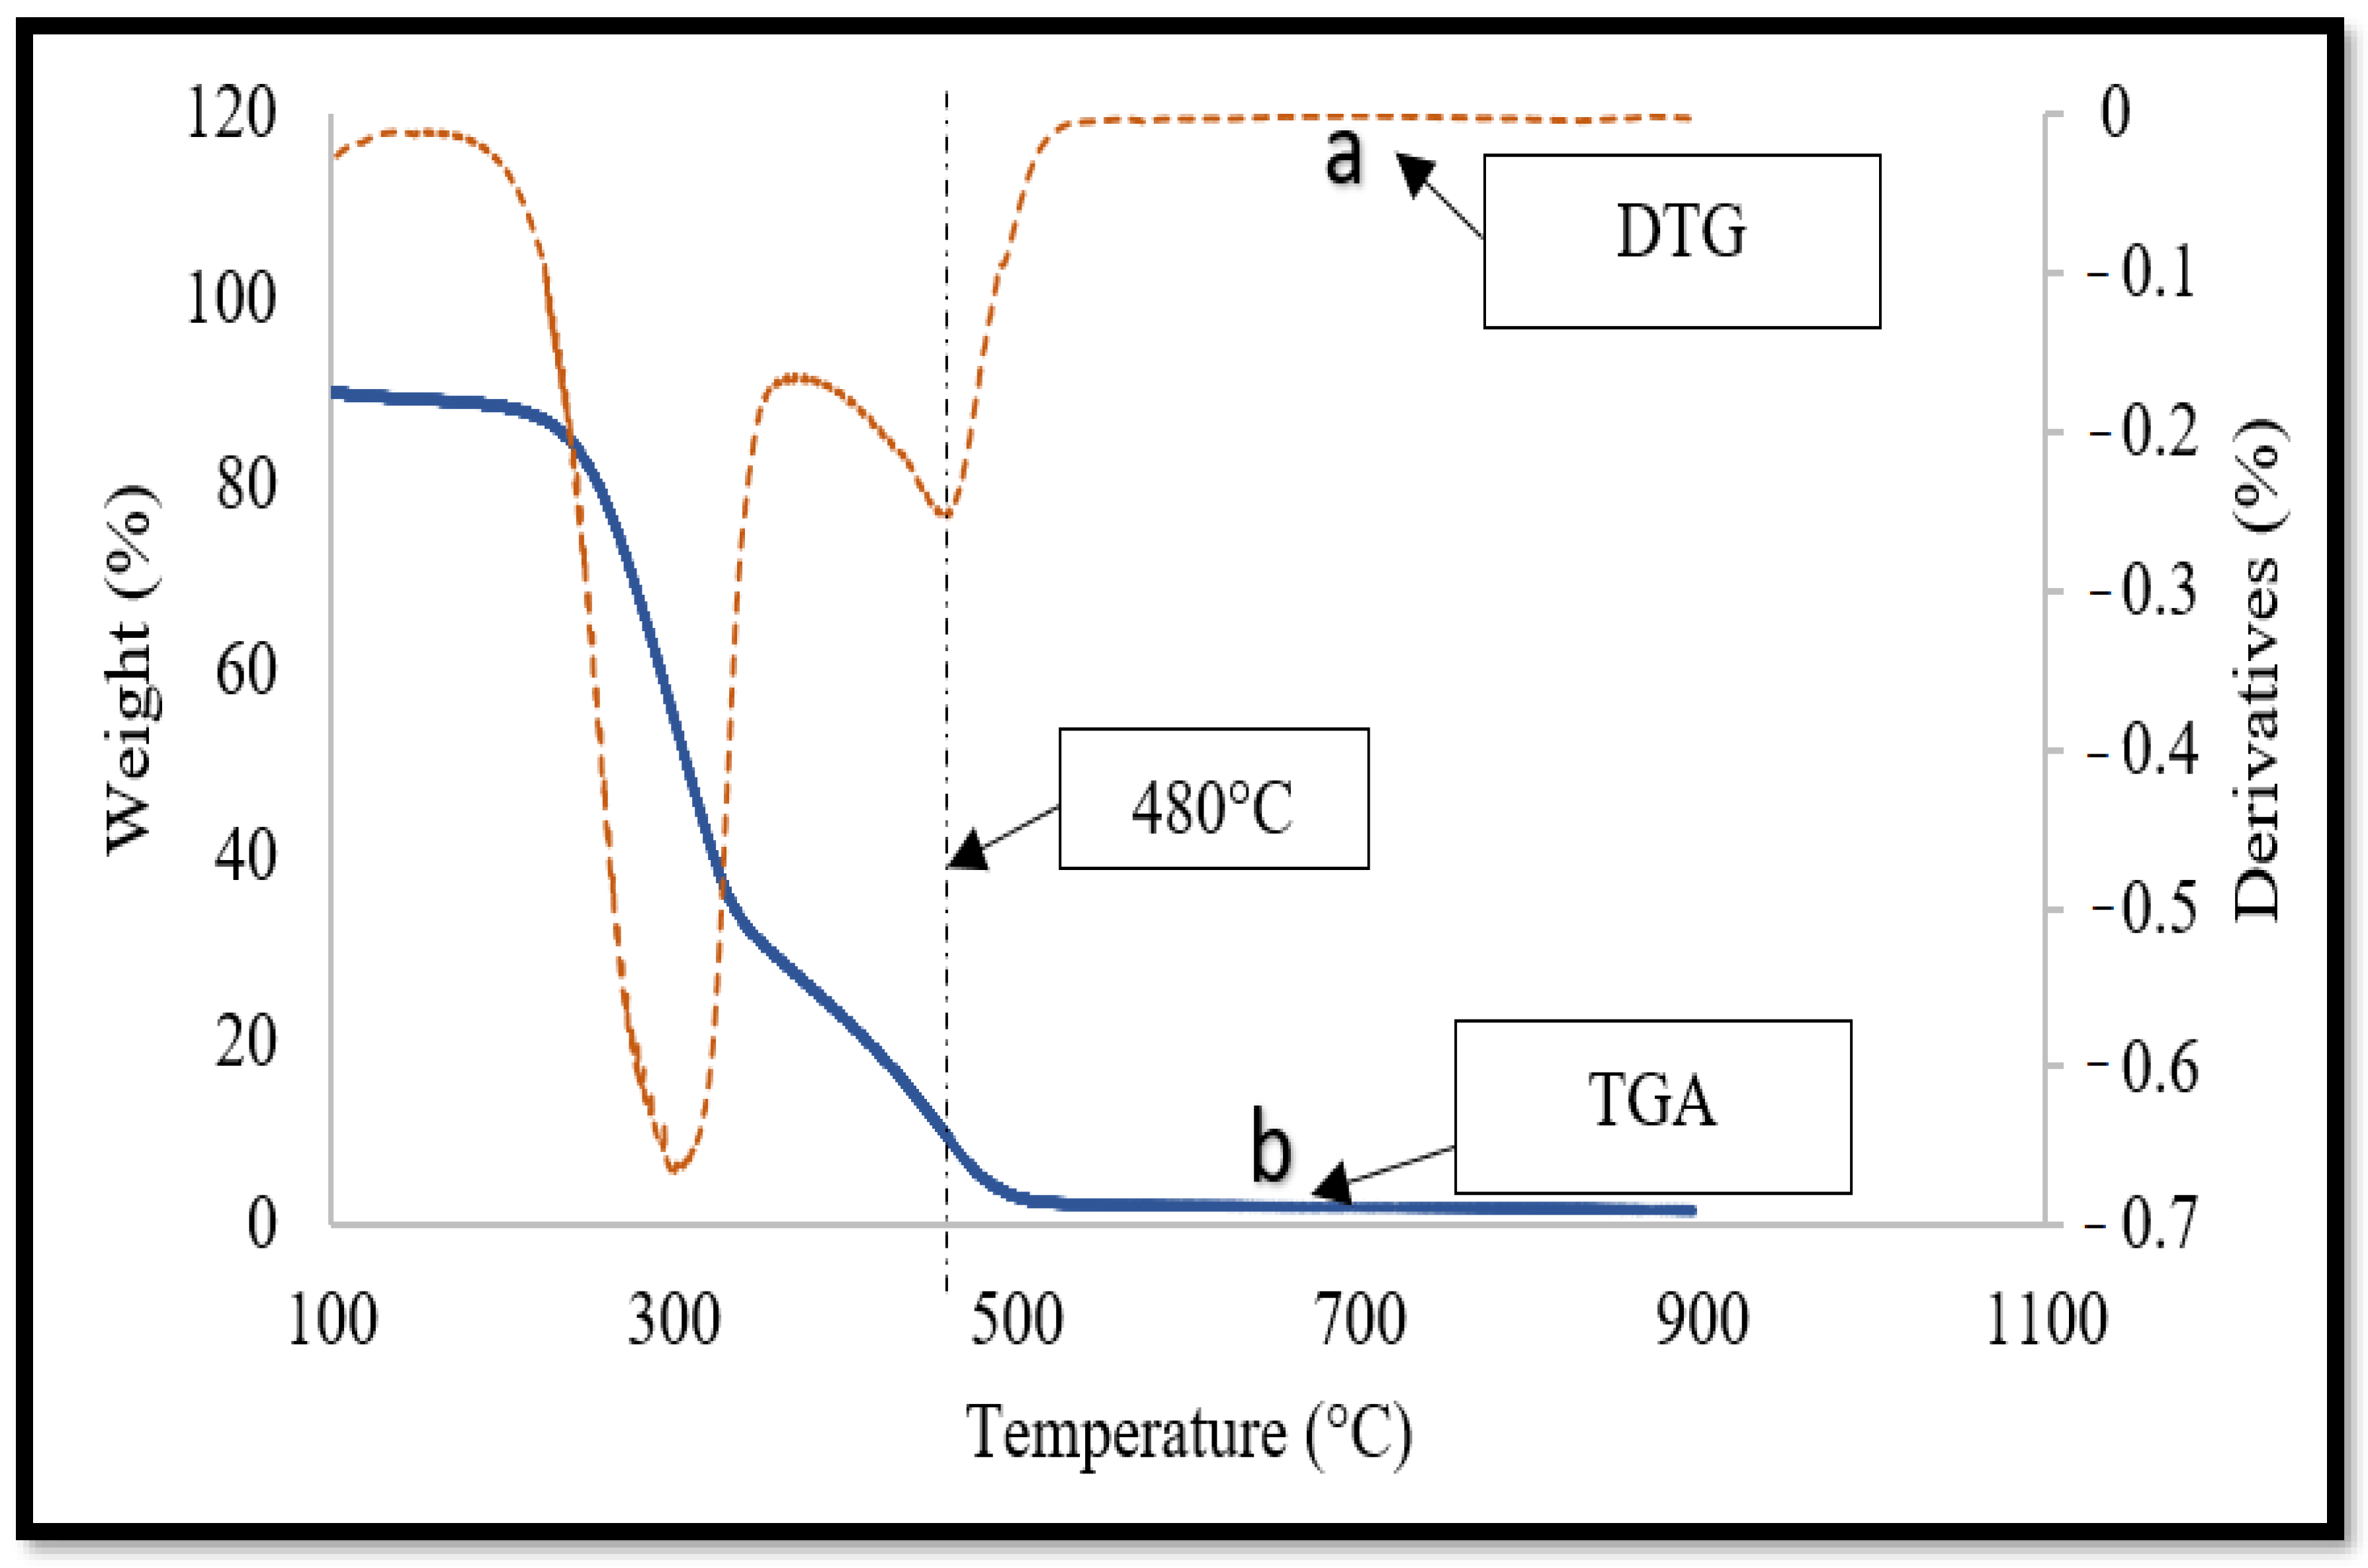
3.2. Thermal Degradation (TGA Analysis)

The pyrolysis weight loss profiles (TGAs) and related derivative weight loss profiles (DTGs) of OPP were generated using heat rates of 10 °C min−1 in an inert nitrogen flow, as shown in Figure 2 and Figure 3. The peak appearance in the DTG profile that corresponds to the greatest mass loss rate is represented by the temperature ranges for the peak appearance.
When the heating rate is increased, the TGA and DTG profiles are shifted from about 30 °C to a higher temperature profile (i.e., towards the right). Aside from that, increasing the heating rate leads to less weight loss, as shown by the TGA profile (Figure 2). Poor heat transmission from the surrounding environment to the inside of the solid is thought to be responsible for this occurrence. When the heating rate is high, the biomass has a shorter residence time to devolatilize, resulting in a greater concentration of solid residue.
It should be noted that although increasing the heating rate skews the TGA and DTG profiles towards the higher temperature side, it does not change the shape of either the TGA or DTG profile. In accordance with the TGA profile, the pyrolysis of OPP proceeded in three major phases, i.e., (I) moisture evaporation and light volatiles removal (30–80 °C), (II) rapid de-volatilization, mostly degradation of hemicellulose (80–340 °C), (III) char formation from the degradation of cellulose, and the slow de-volatilization of lignin (340–480 °C), and (IV) > 480 °C shows a horizontal line, which represents the depletion of fixed carbon and the amount of final unburned residual called ash content at the final temperature. The results are comparable with another study conducted by Nyamful et al. [45], which utilized oil palm kernel shells as activated carbon.
Hence, from the TGA and DTG results, the carbonization temperatures of 460, 480, and 500 °C were set for this study, since it involved a variety of low, medium, and high temperatures in order to obtain an optimum yield, in addition to having good physicochemical properties.

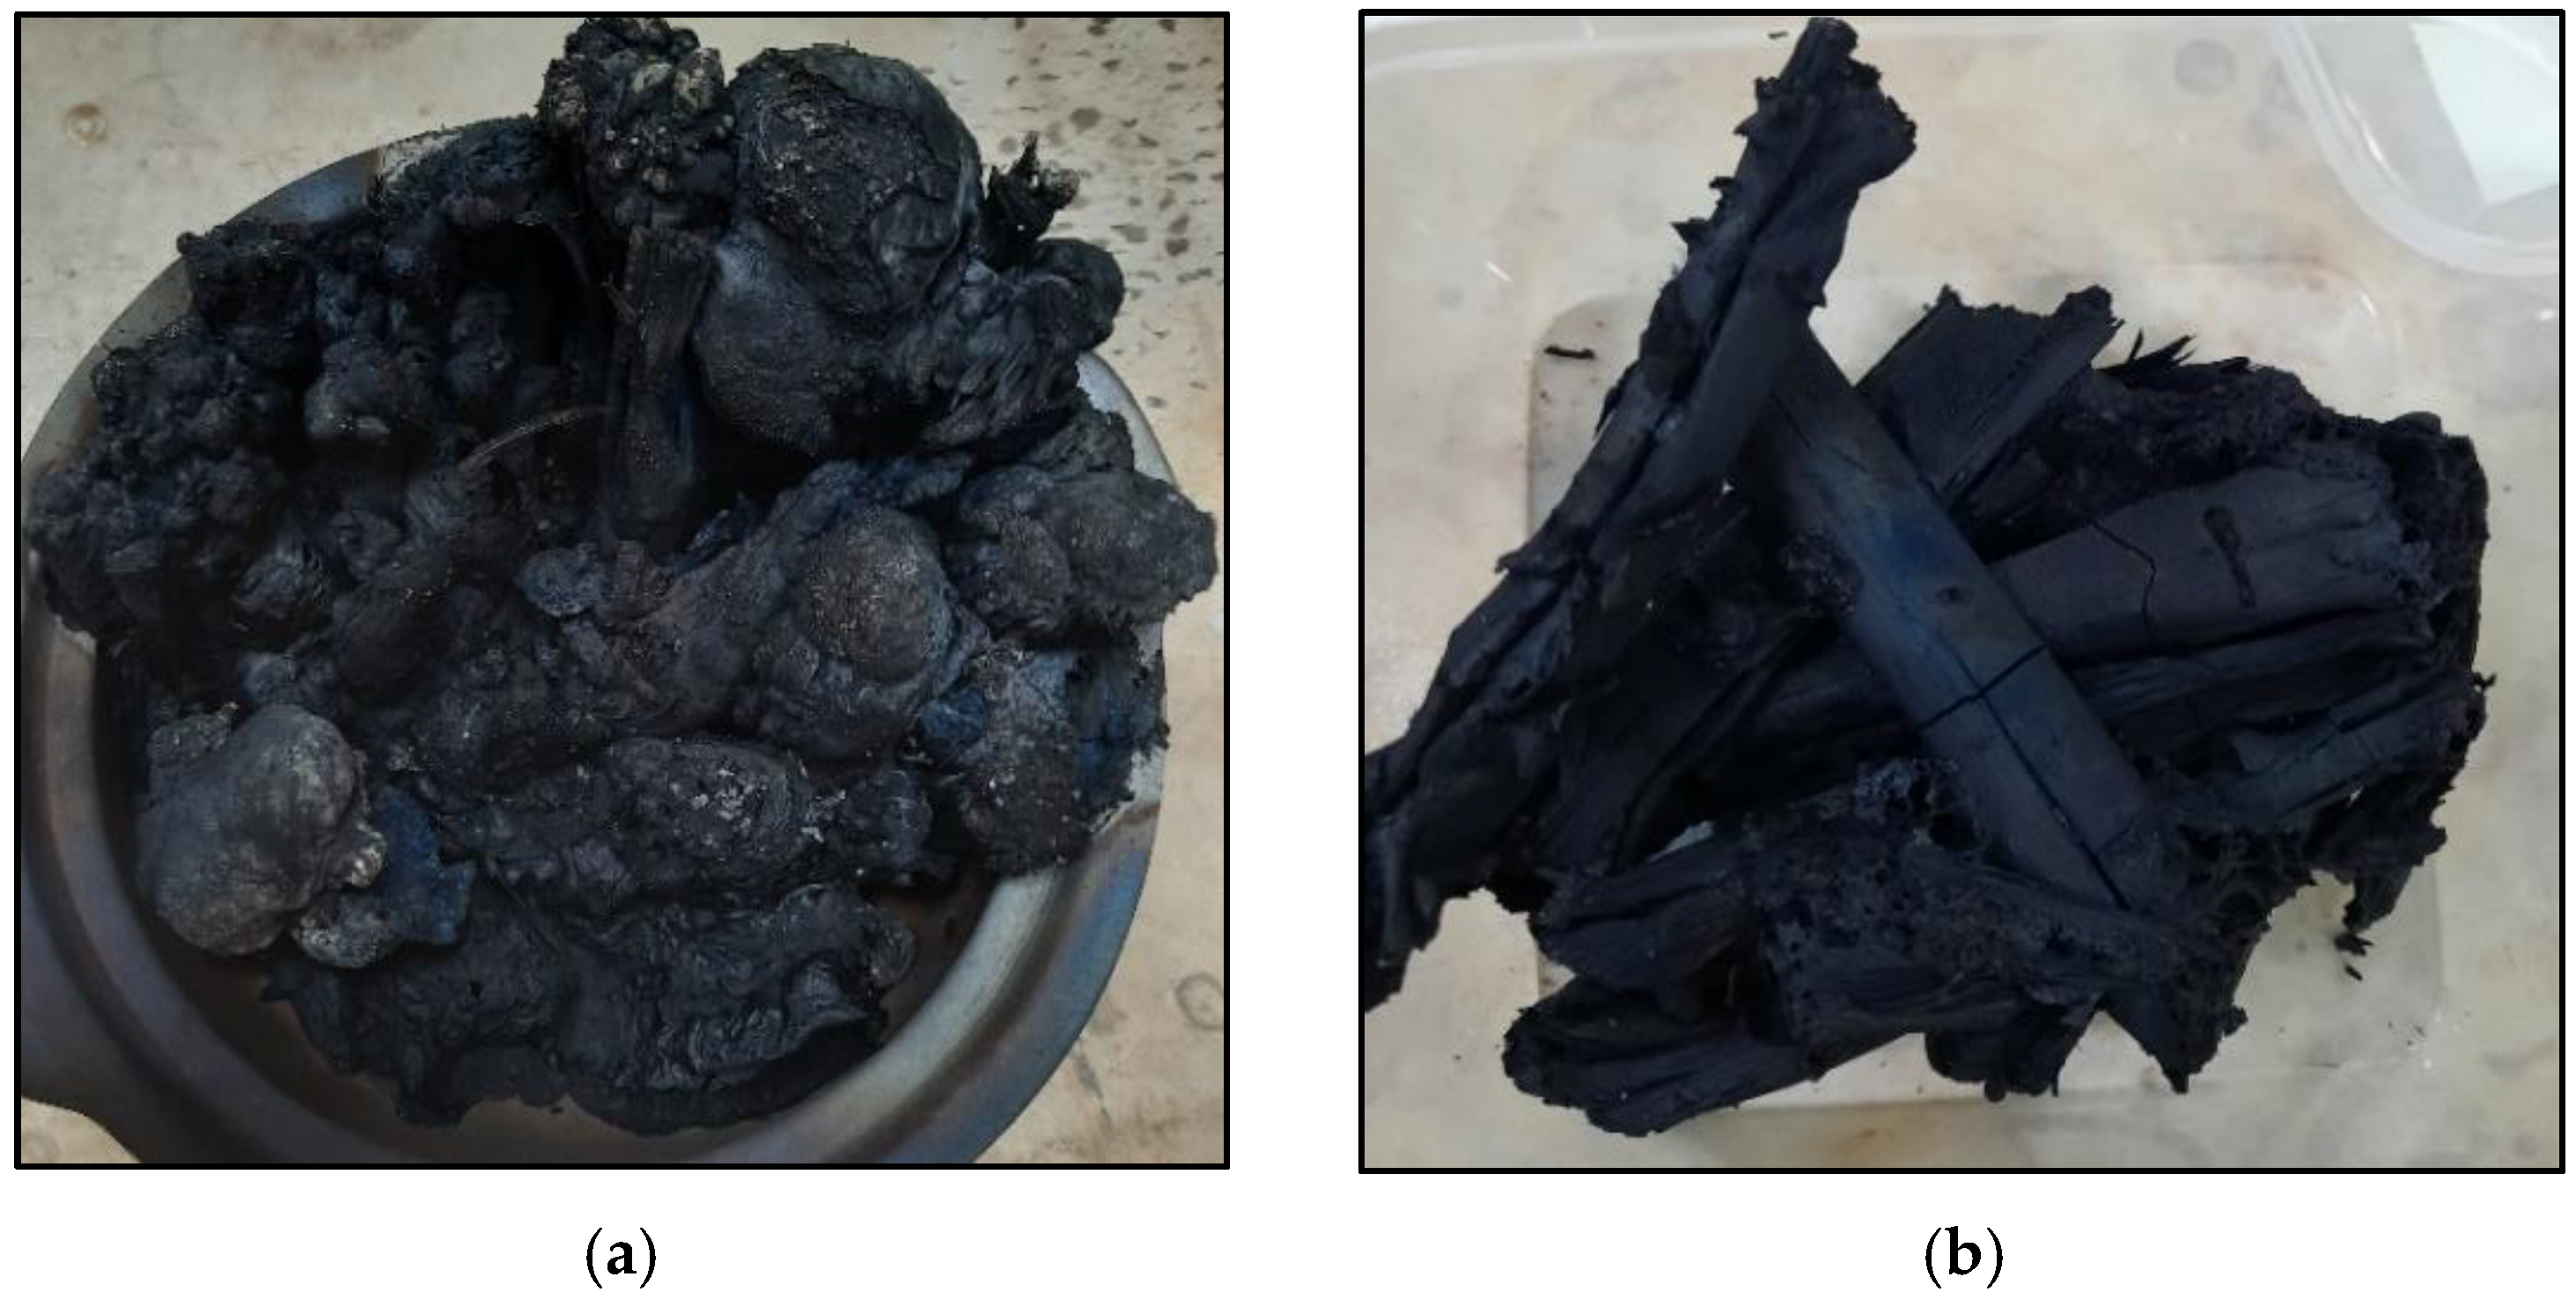
3.3. Yield Percentage

Yield analysis was carried out in order to predetermine the capability of oil palm petiole-activated carbon (OPP-AC) as an adsorbent. The yield of OPP-AC was calculated by dividing the mass of the resultant AC by the initial mass of the raw material used for activation described in Equation (1) [46]. The percentage yield of OPP-AC is performed at various carbonization temperatures and expressed in Table 2.
The results show that the yields of OPP-AC impregnated with KOH are higher than HNO3. The ranges were 60–90 and 40–60%, respectively. The yield is comparable to that obtained in Maulina and Anwari’s [47] studies, which also utilized oil palm waste as AC. Moreover, according to Ukanwa et al. [48], the use of KOH, in the temperature range of 230–650 °C, results in a high char yield. Temperatures of 460 °C to 480 °C resulted in a significant increase in yield, which then gradually decreased at 500 °C. This was in agreement with TGA analysis results, whereby after 480 °C the profile shows a horizontal line, which represents the depletion of fixed carbon and indirectly affects the final weight of OPP-AC.
Additional characterization was made on OPP-AC activated at 480 °C for both HNO3 and KOH and labeled as 10HNO480 and 10KOH480, respectively. Depending on the type of activation agents used, different precursors react differently to give a variety of surface areas, pore volumes, and yield. The reaction of the activating agent with cellulose, hemicellulose, lignin, or polysaccharide in carbon precursor leads to various activation mechanisms [25]. Figure 3a,b show the 10HNO480 and 10KOH480.

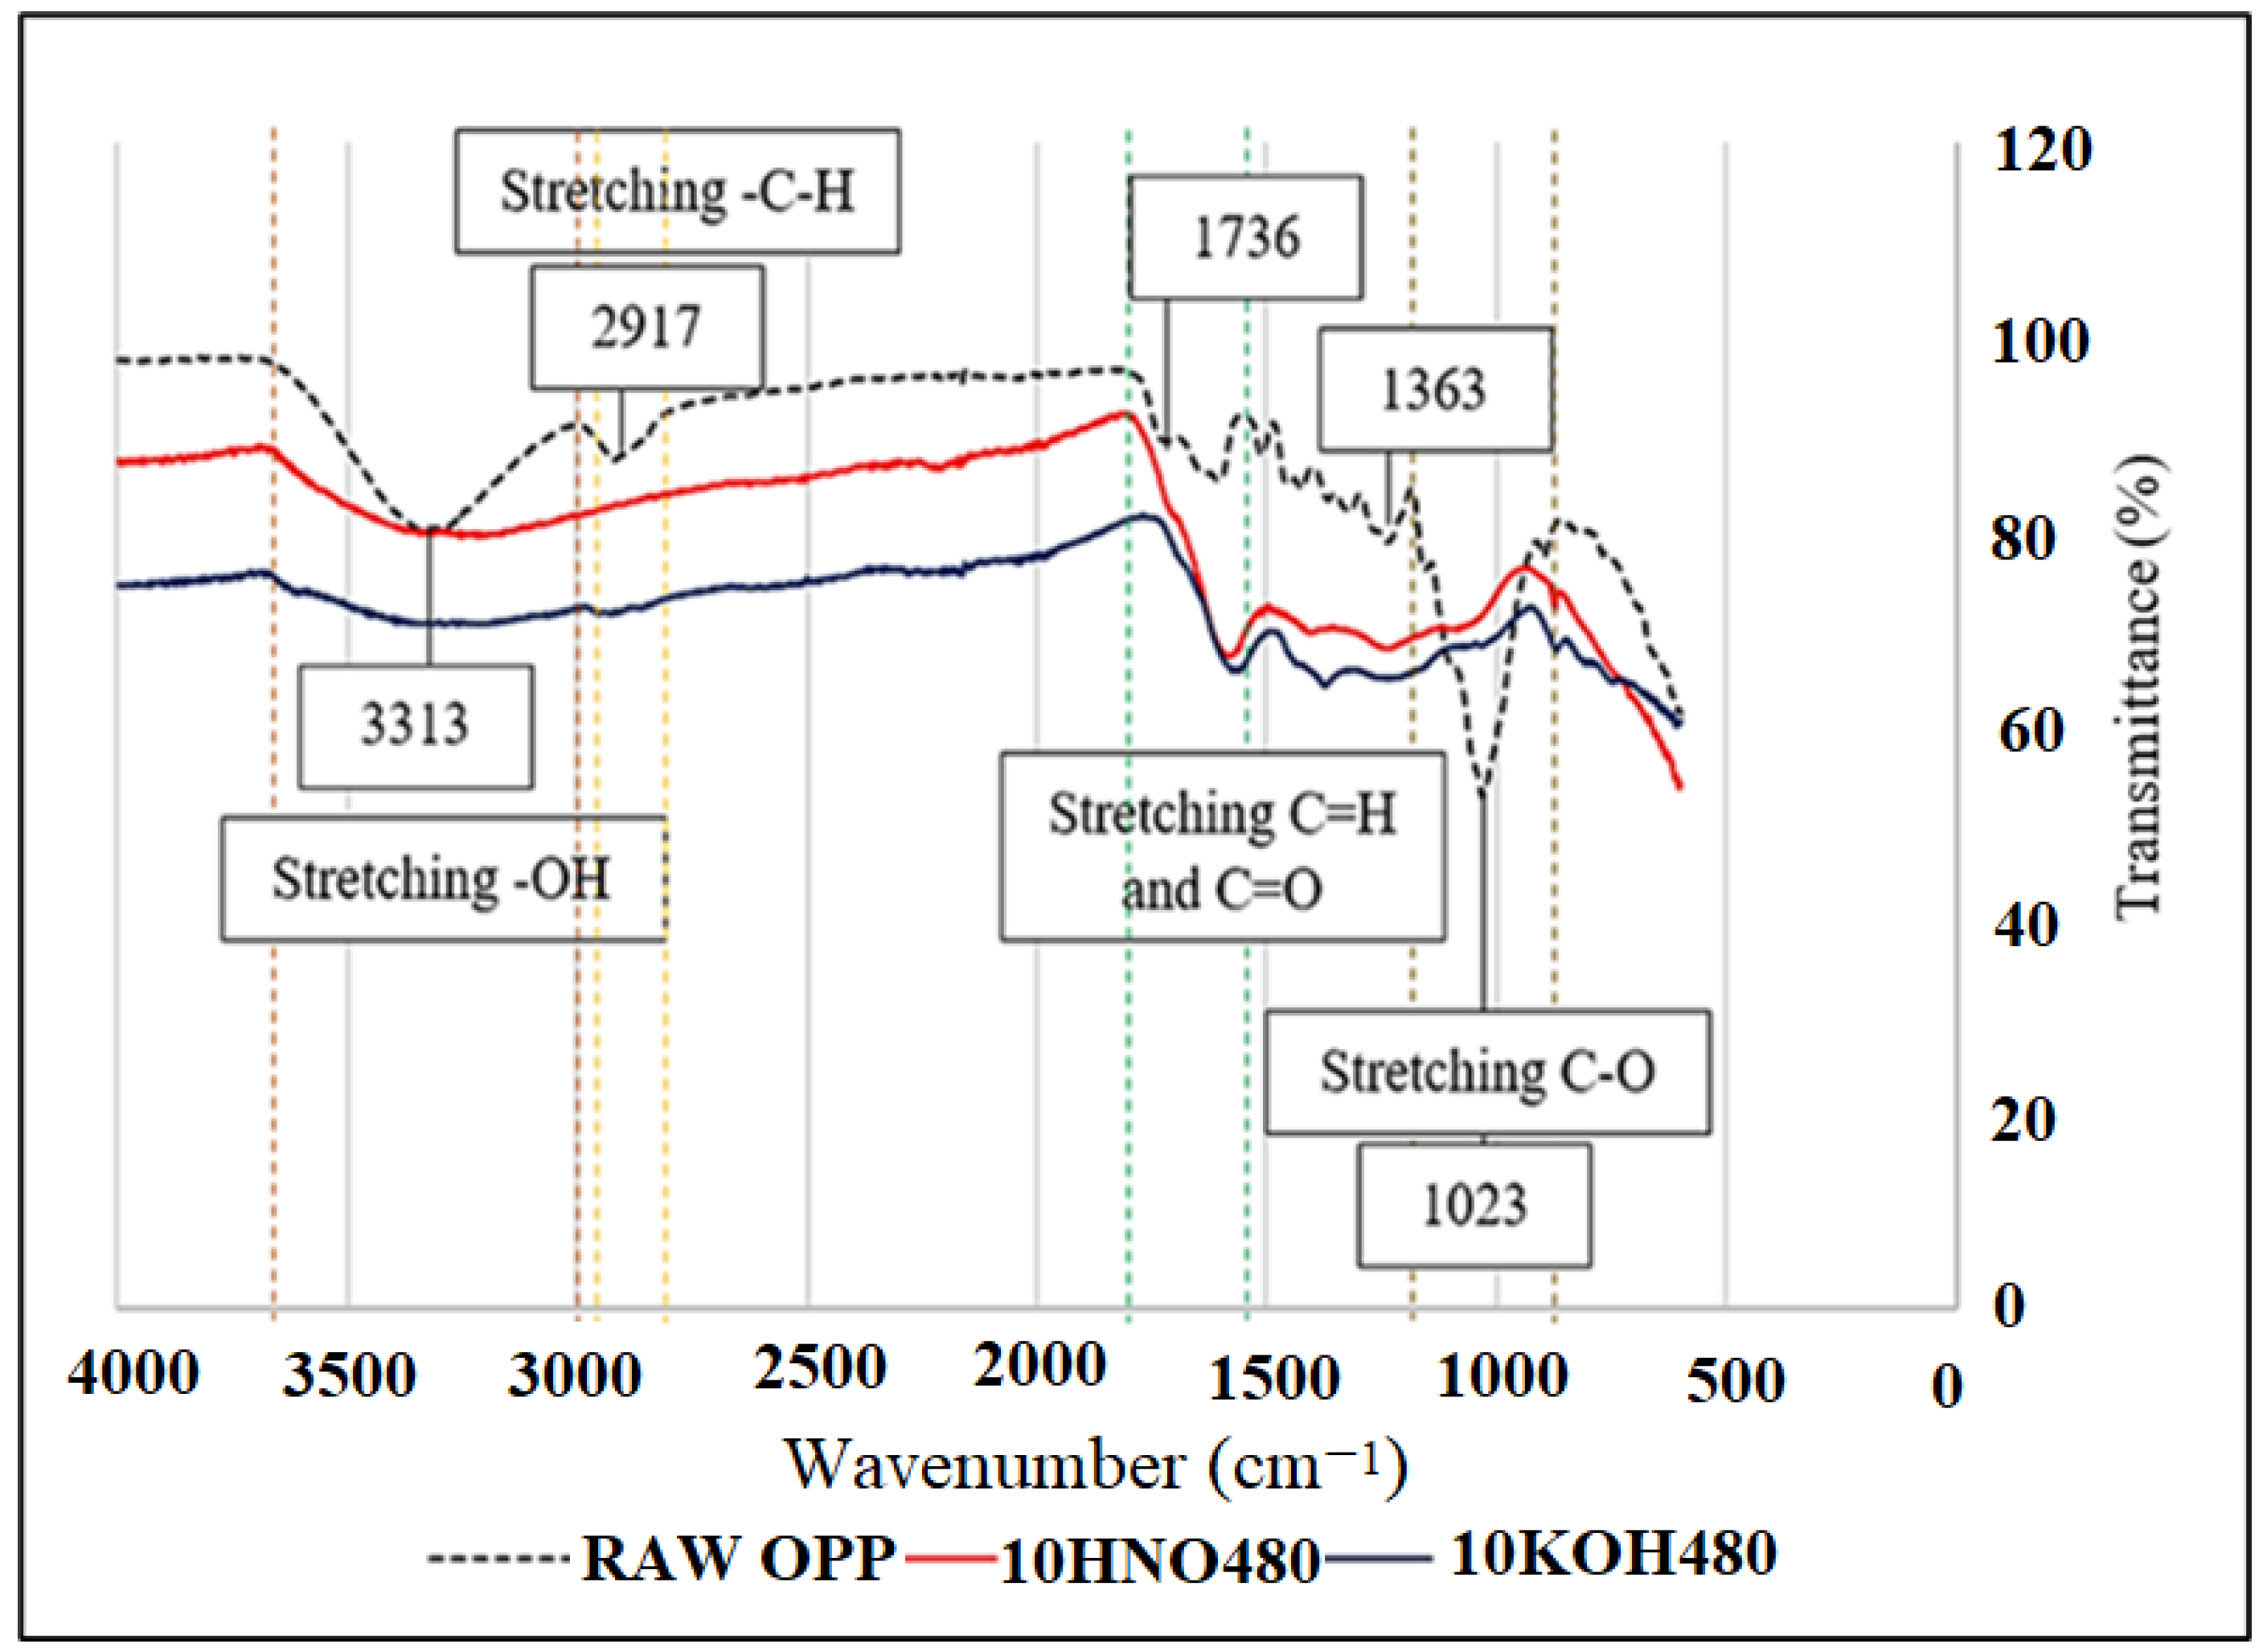
3.4. Fourier Transform Infrared (FTIR) Spectroscopy

The functional groups present in raw OPP and OPP-AC were identified using Fourier transform infrared spectroscopy (FTIR). This also provides information on the effect of the activation process that was carried out as evidence of the phase transformation that occurred in both precursors and AC. Most lignocellulosic materials tend to have almost the same spectra [49].
The existing frequency peak of C-O stretching for raw OPP was detected at around 1000–1200 cm−1, which represents the structure of lignin. The identified peak also represents the functional group of cellulose and hemicellulose structure. Other typical frequency peaks that occurred in raw OPP in this study include 3313 cm−1 (–OH), aliphatic. Some of the peaks are also consistent with findings, which represent the stretching of the C–O functional group [50]. It can be suggested from carbonyl, ethers, and alcohol groups, which are normally present in plant cellulose. As shown in Figure 4, the C–H group is at 2917 cm−1, the amide C=O group is at around 1602 cm−1, and moderate intensity stretching is at 1229 cm−1.
Figure 4 illustrates that the raw OPP, 10HNO480, and 10KOH480 all displayed bands at 3500–3300 cm−1, which corresponds to the O–H stretch in alcohols, phenols, and adsorbed water. This was attributed to the O–H stretching vibration of hydroxyl functional groups. The band is more intense for the raw OPP, which means that this fraction contains many more alcohols, phenols, and absorbed water than 10HNO480 and 10KOH480.
During the carbonization and activation processes, most of the adsorption peaks of functional groups disappeared [51]. The most notable example was the vibrations of bands at 2905 cm−1. This band is assigned to aliphatic C–H stretching, which identifies the composition of polysaccharides in cellulose and hemicellulose, respectively [52]. This band was only visible in raw-OPP and vanished once it was carbonized.
Another example was at bands 1228 and 1029 cm−1. Similar to Hidayu et al. [53], raw OPP showed these bands, which corresponded to the stretching of the C–O functional group. However, these bands disappeared, and the surface became broad at the 10HNO480 and 10KOH480 surfaces. The disappearances of adsorption peaks at 10HNO480 and 10KOH480 could be due to the decomposition of adsorbed water and hydroxyl groups, which indicates the raw OPP spectrum was vaporized as volatile materials when the heat was supplied to the sample [52,54]. According to Hidayu et al. [53], this demonstrates that the activation procedure was completed successfully.
At 1000–1100 cm−1, which includes C–O in carboxylic acid, alcohols, and esters, a significant reduction was also observed. A similar pattern of reduction was also found by Hesas et al. [55] using different types of agricultural waste. In addition to the reduction and disappearance of adsorption peaks, new peaks were observed in the 10HNO480 spectra at 1595 cm−1, which can be attributed to asymmetric and symmetric vibration of the nitro (−NO2) group. This suggests that the HNO3 functionalization also introduces nitrogen-containing functional groups on the surface of the OPP-AC [21]. Gokce and Aktas [56] also reported on the use of HNO3 to modify waste tea-activated carbon.

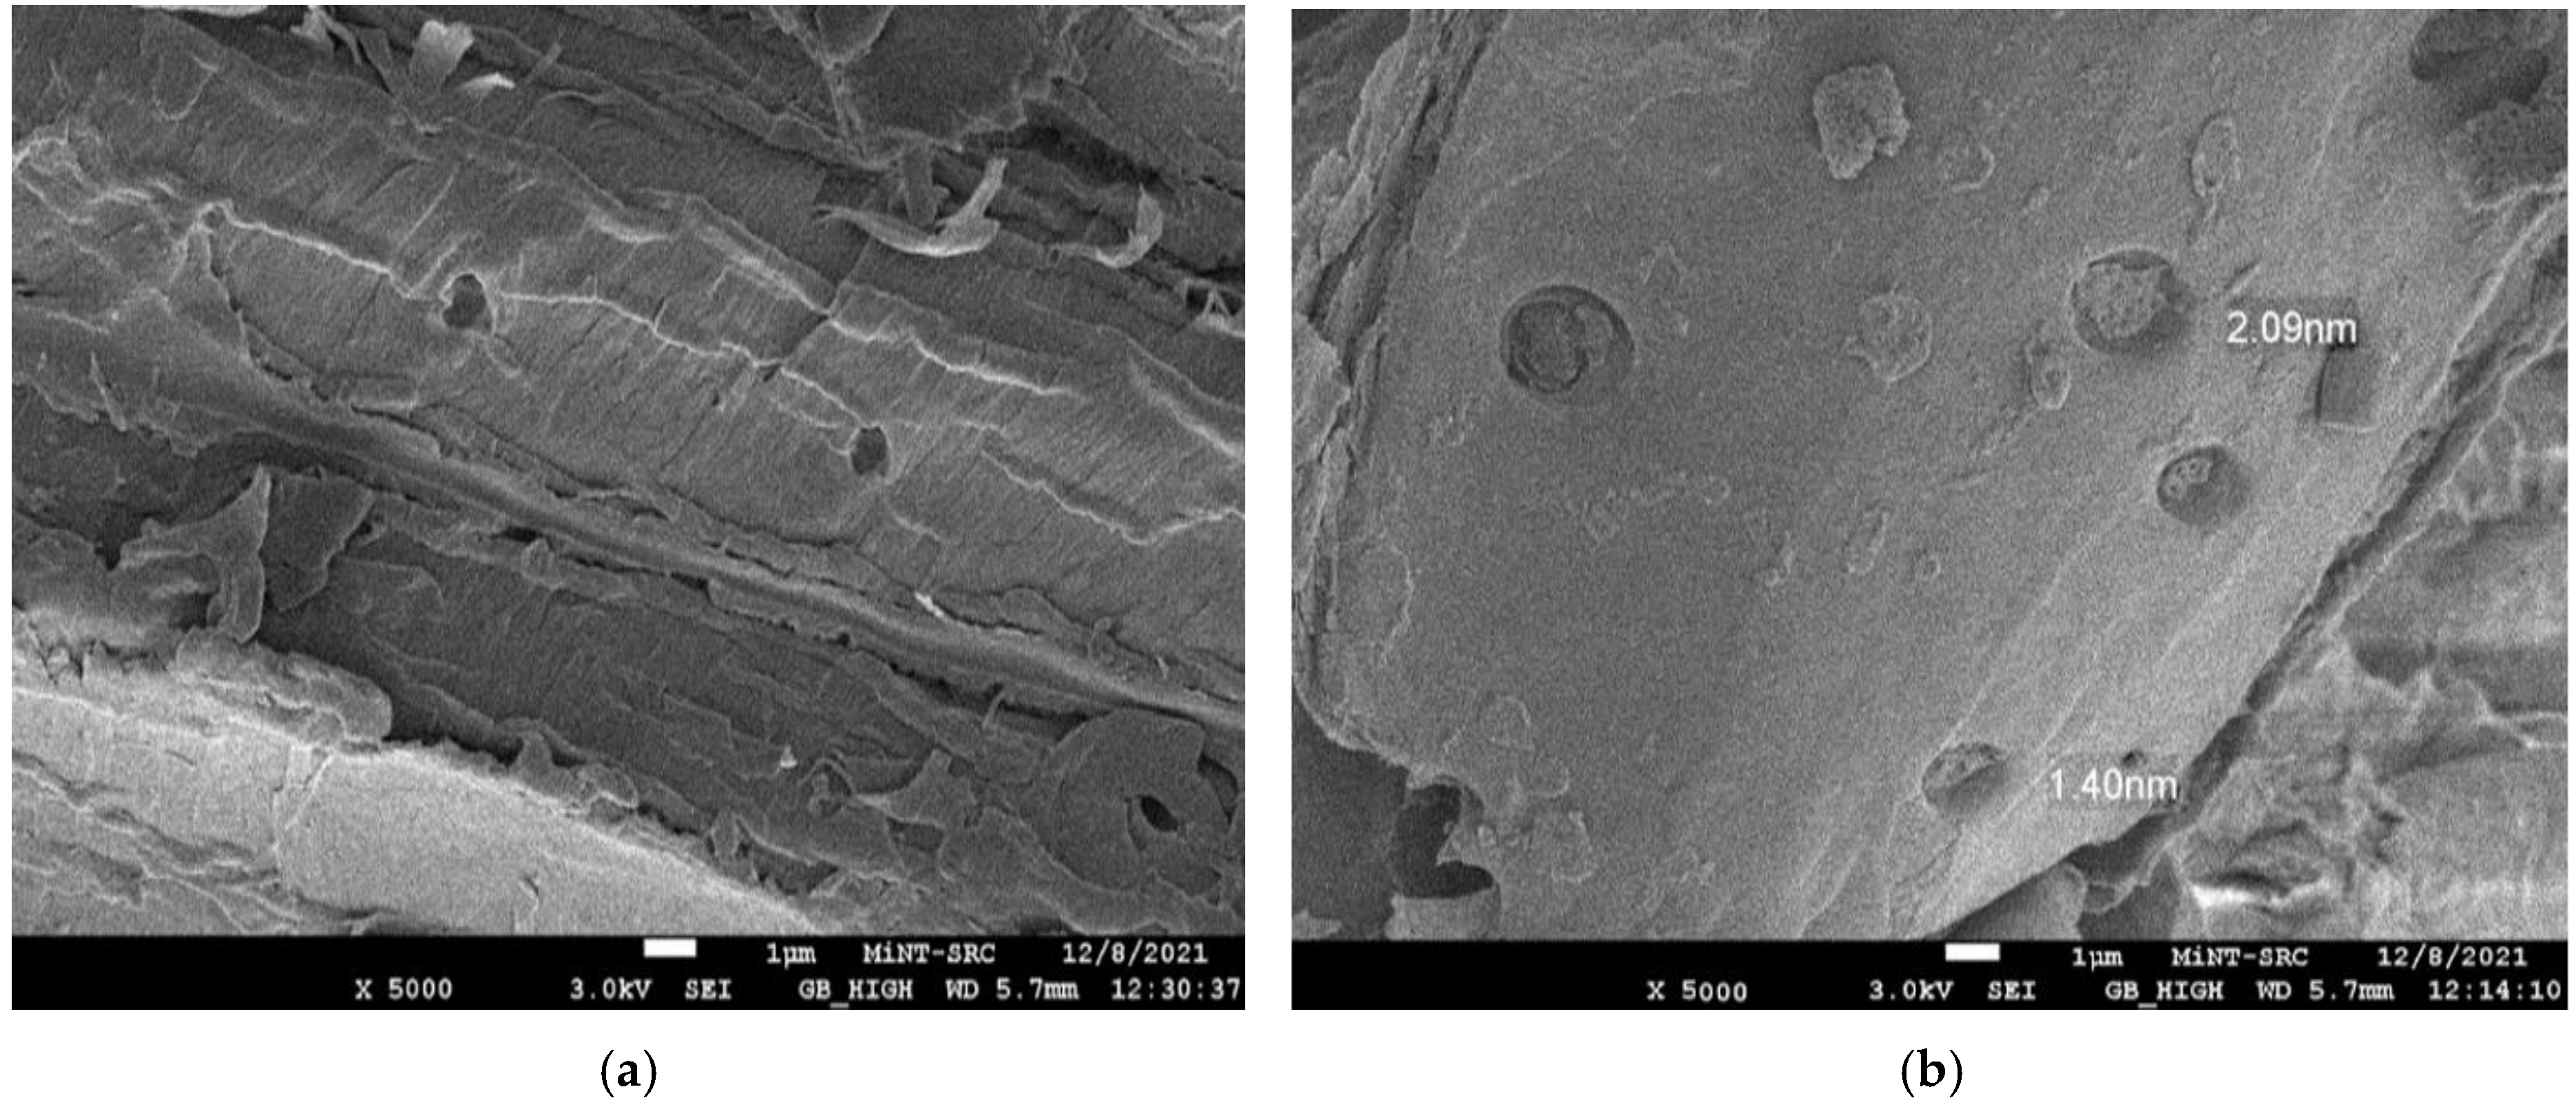
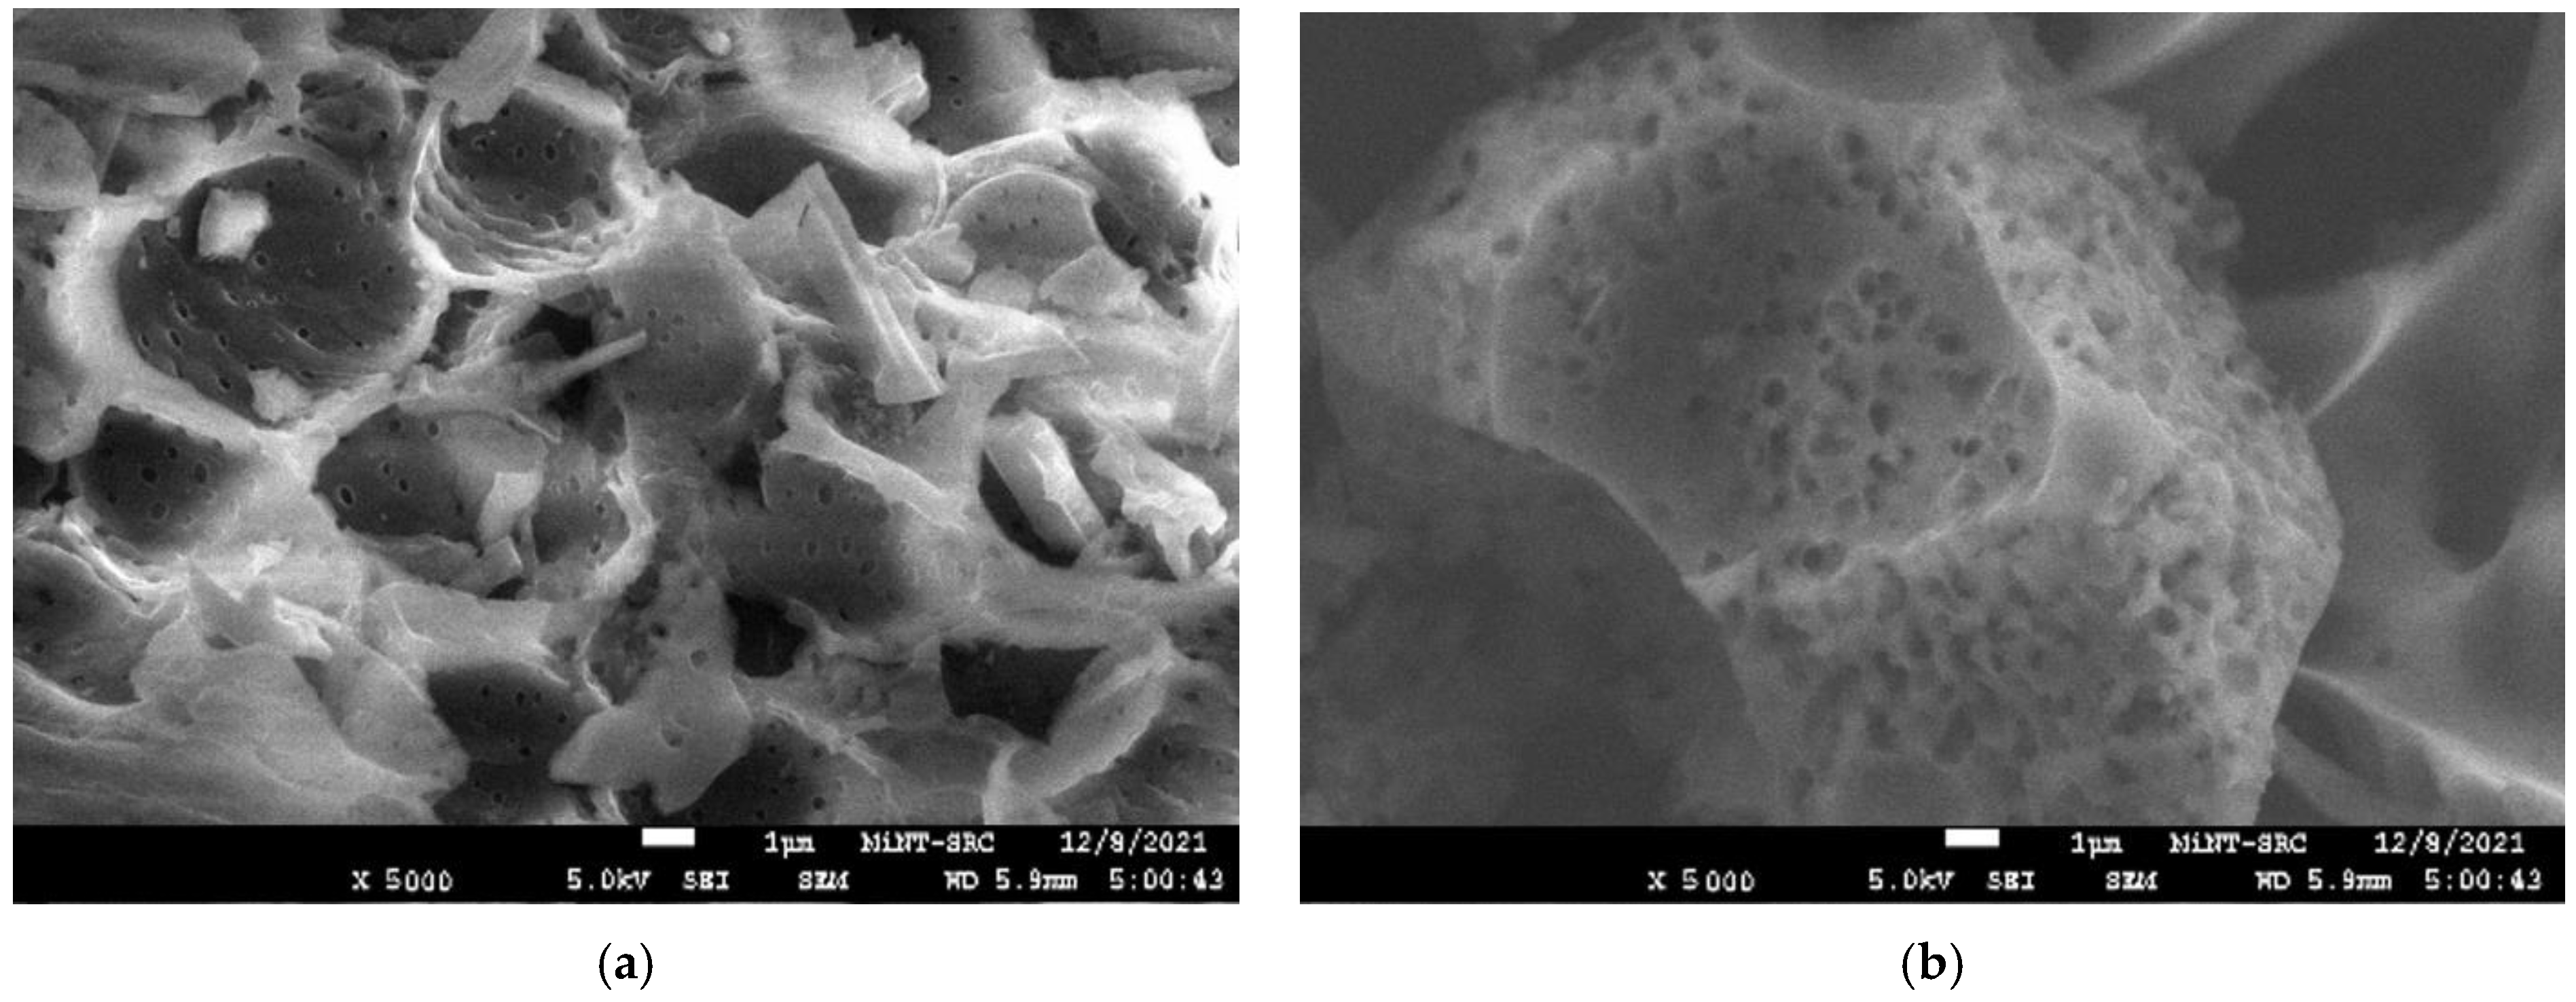
3.5. Field Emission Scanning Electron Microscopy (FESEM)

The morphological changes as the effect of impregnation and carbonization temperature of the OPP-AC product were observed using FESEM analysis. Figure 5a,b depict the surface morphology of OPP before it was activated. It shows a thick and flat pattern with small fractures in between. This was attributed to the high amount of lignin, a phenolic polymer that gives the plant structural strength and gives it a hard and rough wood-like structure. In Figure 5b, the precursors were found to have a compacted surface with a shallow and clogged pore pattern on it. This can be due to the reaction of the pretreatment and heating process during oven drying. From Figure 5a,b, the surface is clearly illustrated as an unsatisfied adsorptive material due to the presence of the non-porous OPP surface.
The most noticeable differences between the activation processes employing different chemical bases are the patterns created on the surface of the OPP-AC, as shown in Figure 6a,b. AC impregnated with KOH and HNO3 has a more homogeneous and comb-like pattern, whereas AC impregnated with KOH has significantly smaller pores and sparse distribution. Similar pore development on the surfaces of AC is also observed in the Okman et al. [57] study, in which the pattern of grape seeds impregnated with KOH produces a sponge-like structure with many holes. The pore size for AC activated with KOH was from 1.255 to 2.118 nm at 480 °C. Meanwhile, pore sizes in AC activated with HNO3 ranged from 4.9 nm to 6.8 nm.

3.6. Brunuer, Emmet, and Teller (BET) Surface Area and Pore Distributions Analysis

The physical components such as the specific surface area, micropore volume, and pore size are the most relevant to evaluate the capacity of adsorption. Porous materials are most commonly described in terms of pore diameters calculated from gas sorption data [58]. Conventions proposed by the International Union of Pure and Applied Chemistry (IUPAC) for categorizing pore sizes and gas sorption isotherms indicate the link between porosity and sorption [59].
Table 3 shows the specific surface area and pore size distribution of raw OPP, 10HNO480, and 10KOH480. As can be seen in Table 3, the average pore diameters of 10HNO480 and 10KOH480 are 5.89 and 1.43 nm, respectively. According to the International Union of Pure and Applied Chemistry (IUPAC) classifications, the pores can be divided into macropores (d > 50 nm), mesopores (2 < d < 50 nm), and micropores (d < 2 nm). This indicates that 10HNO480 is mesopore-adsorbent and 10KOH480 is micropore-absorbent.
The surface areas occurring through BET are noticed to be 883.3 and 372.4 m2/g for 10KOH480 and 10HNO480, respectively. Meanwhile, raw OPP attained SBET 0.579 m/g, which suggested the development of the porous structure after the activation process. This value is comparable to that study by Rugayah et al. [60] that utilized oil palm kernel shells as AC. It is clearly shown that the dehydration process by the chemical activating agent increases the surface area and porosity. Additionally, the results demonstrate that this study’s KOH-AC has a dominantly microporous structure, while the HNO-AC exhibits a mesoporous structure.

3.7. Batch Adsorption
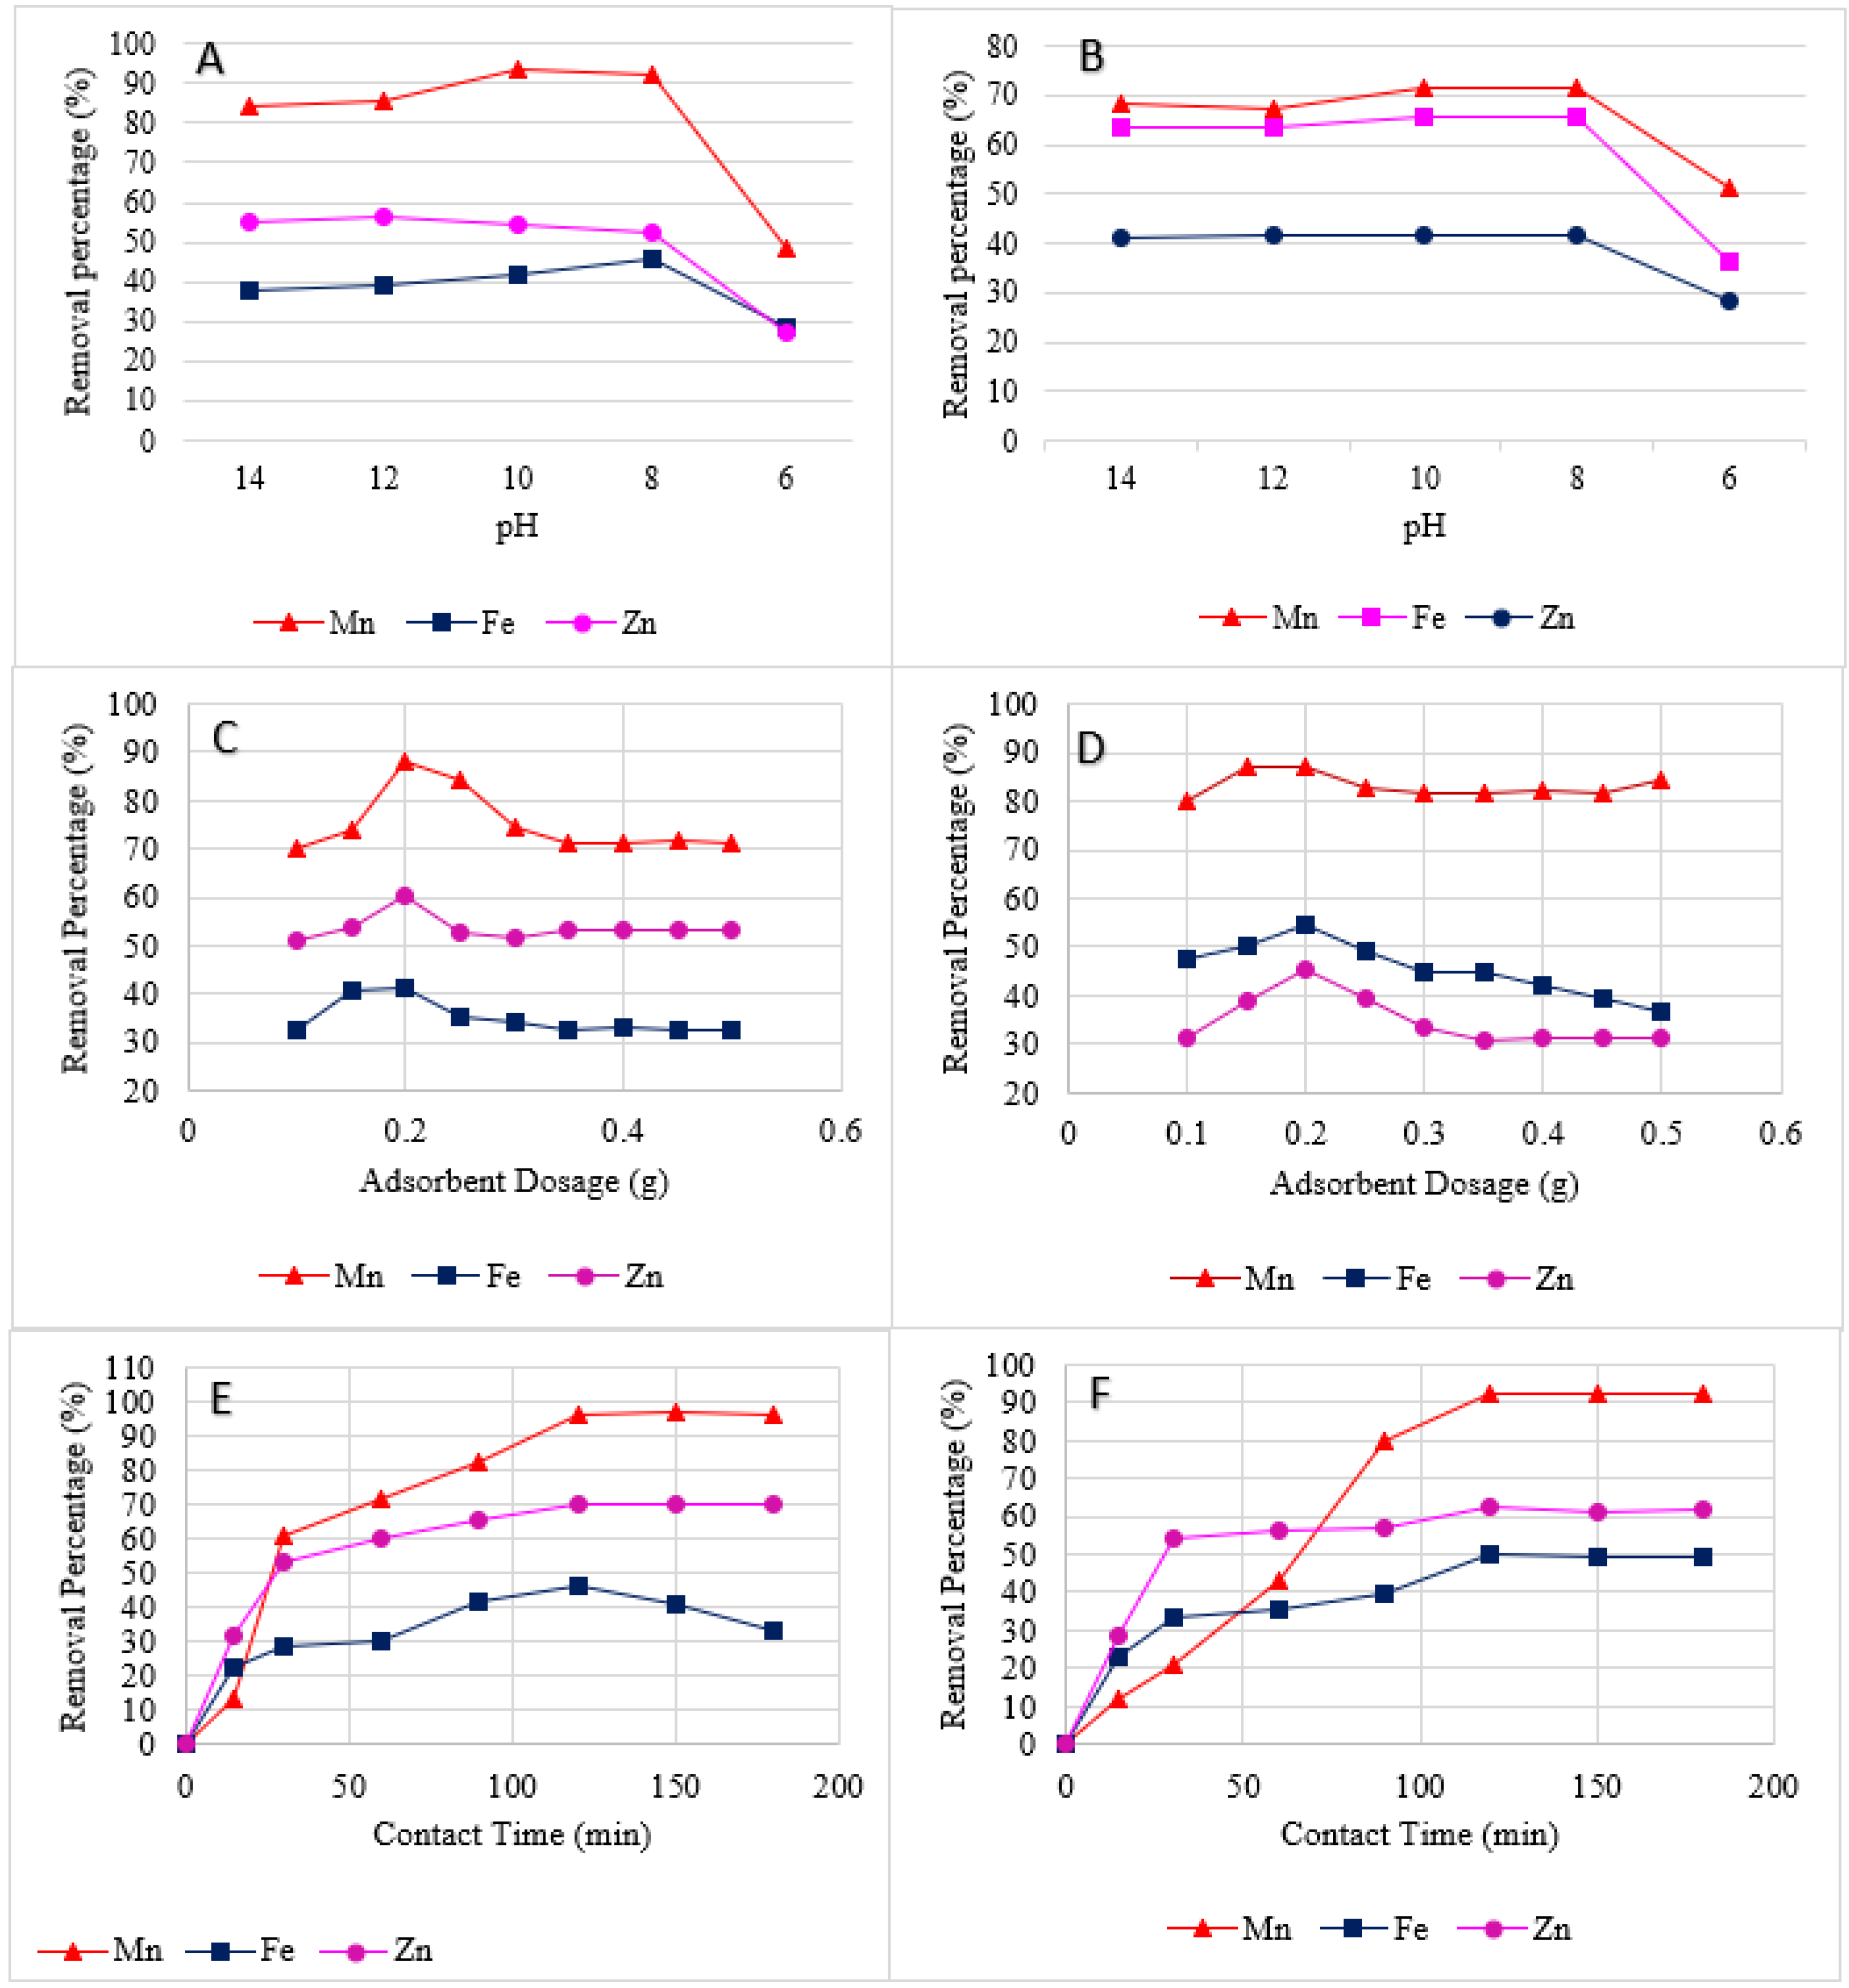
The optimum adsorption removal of a composite adsorbent was investigated under a variety of conditions, including pH, adsorbent dosage, and contact time, which is an important parameter in determining absorption ability.

3.7.1. Effect of pH

In the batch adsorption study, pH is a significant component that will affect the adsorption process by altering the surface charge distribution of the utilized adsorbents [61,62]. The pH-related effects on the heavy metals (Mn, Fe, and Zn) in wastewater from the processing of wood were observed in the ranges of 6 and 14, as shown below (6, 8, 10, 12, and 14). Figure 7A,B clearly show the best results are obtained on both OPP-ACs when using pH 8, respectively, for Mn, Fe, and Zn from fiberboard processing wastewater.
The optimal pH of both 10KOH480 and 10HNO480 is eight. Based on the results, 10KOH480 provides a higher removal percentage of Mn compared with 10HNO480. The percentage removal of 10KOH480 and 10HNO480 is, respectively, 93.62% and 71.72% for Mn, 47.87% and 65.86% for Fe, and 54.42% and 41.52% for Zn at optimal pH.
Briefly, it can be observed that removal patterns for all the adsorbents increased as the pH of the water sample was increased, until the optimum pH was 8. This was due to the deprotonation of oxygen functional groups, which increased the active sites for heavy metal ions chelation and significantly increased the AC adsorption capacity [63]. The results also show that the different metal ions in the solution have different competitive adsorption effects [37]. For 10KOH480, the degree of influence from large to small was as follows: Mn > Fe > Zn, while for 15HNO480: Mn > Zn > Fe. Since the ion radius of Mn is smaller than that of other ions, the ability of Mn to compete for adsorption sites is higher than other ions, and the repulsive force is stronger to other metal ions after adsorption.

3.7.2. Effect of Adsorbent Dosage

Adsorbent dosage is a significant factor in investigating the quantitative uptake of pollutants. The results of Fe, Mn, and Zn removal by using various dosages of the 10KOH480 and 10HNO480 are shown in Figure 7C,D, respectively. A clear trend can be seen for the effect of adsorbent dosage. As expected, by increasing the amount of adsorbent, the removal of metals increased as well until it reaches the optimum stages. The highest adsorption percentage in this study was recorded on Mn removal using 10KOH480, which is 88% when 0.2 g of adsorbate was used. In contrast, 0.3 g/L of 10HNO480 is needed to remove 87% of Mn. By increasing the adsorbent dosage, a more active site for adsorption was available. This explains the trend where an increase in adsorbent dosage resulted in more removal of any pollutants [64,65].

3.7.3. Effect of Contact Time

Contact time shows a marked influence on the adsorption efficiency and can be used to elucidate the kinetics of the adsorption process [66]. Theoretically, the increase in contact time leads to an increase in removal percentage until it reaches a saturated level. The optimum pHs and adsorbent dosages of 10KOH480 and 10HNO480 were set constant to determine the optimum contact time. As can be seen in Figure 7E,F, low removal of Mn, Fe, and Zn from the wastewater using OPP-AC was recorded during the first 30 min of contact time. This behavior was due to the dissociation of water molecules that bore different types of pollutants and required a certain period of time for the reaction to occur effectively.
Overall, the results show that the optimal contact time at the highest removal percentages is 120 min for both 10KOH480 and 10HNO480. Comparing KOH-impregnated AC and HNO3-impregnated AC, 10KOH480 shows higher removal percentage, which is 96.14% for Mn and 70.05% for Zn but slightly lower for Fe with 45.93%. This may be due to the microporous pore structure of 10KOH480. According to Hui and Zaini [67], microporous activated carbon is most widely and suitably used for the adsorption of micropollutants and heavy metal ions. Because of its small pore diameter (<2 nm), larger size molecules (macropollutants) are therefore prevented from entering the pores.
In accordance with the results, the percentage removal and adsorption capacity trends for metals removal became invariable after 120 min, indicating a decrease in the available active adsorption sites on the composite adsorbent. This was due to time, which resulted in a limited mass transfer of the adsorbate molecules from the bulk liquid to the external surface of the composite adsorbent [68,69]. According to Mustapha et al. [70], the slow uptake in the later stages is most likely due to an attachment-controlled process caused by fewer available active sites for sorption, whereas the slight decrease in percentage removal with increasing contact time may be due to adsorbent surface saturation followed by subsequent adsorption and desorption.

3.8. Removal of Mn, Fe, and Zn under Optimum Conditions

The adsorption procedure was performed at optimum conditions obtained in previous experiments. For the OPP-AC after activation process using KOH and HNO3, the samples were added to a 100 mL solution containing Mn, Fe, and Zn ions and agitated at 125× g. The highest removal percentage (%) under optimal conditions is listed in Table 4. This is the moment at which the treatment becomes stable, and no additional adsorption may occur due to the saturation of the surface area.

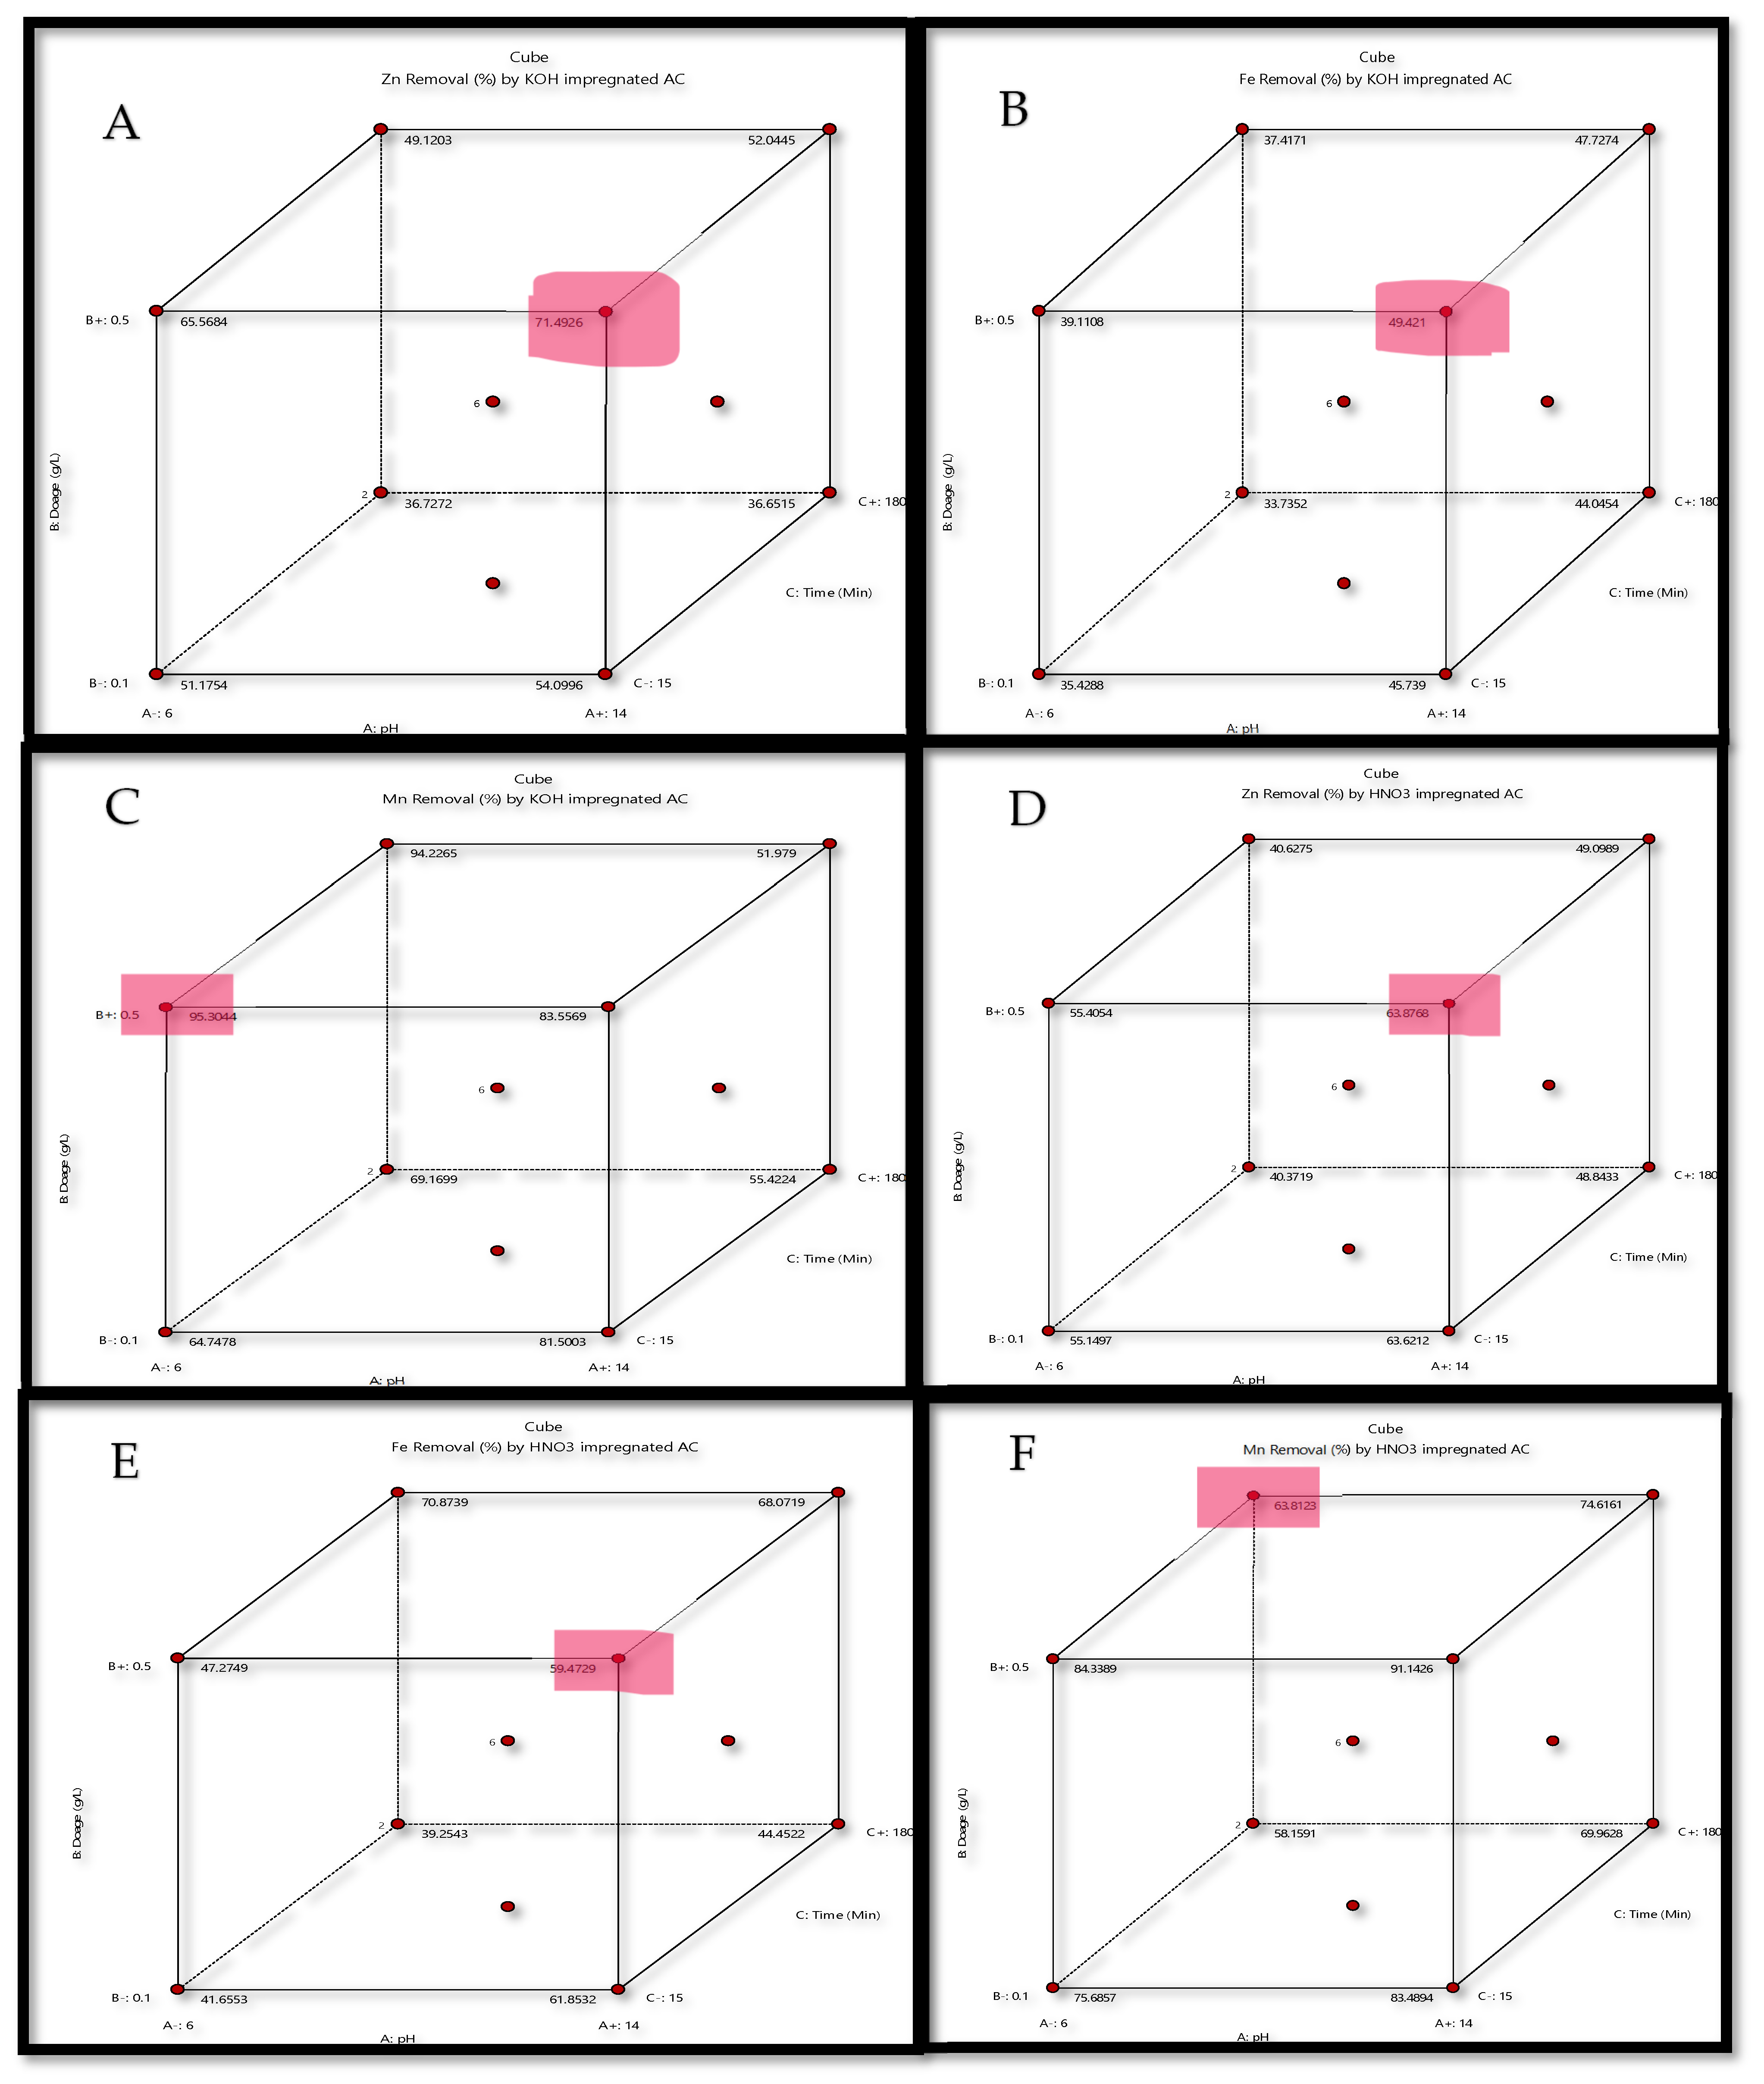
3.9. Prediction of Mn, Fe, and Zn Removal using the RSM Model

3.9.1. Analysis of Variance

Through 20 iterations, the central composite design (CCD) approach was utilized to maximize the removal of Mn, Fe, and Zn ions from the solution. To show that the models were acceptable, an ANOVA was conducted, and the quality of the fitted model was evaluated using the F-value, p-value, and coefficient of determination. Table 5 shows the results of the models used to fit the experimental data in the form of an ANOVA for Mn, Fe, and Zn removal. Given that the p-values were less than 0.05, and the adjusted R2 was more than 0.95, all of the models were significant at the 5% confidence level, as illustrated in Table 5. The models’ projected response is more accurate the higher the F-value. According to the results of the current study, the values of adjusted R2 for Mn, Fe, and Zn impregnated AC with KOH were 0.9967, 0.9619, and 0.9802, and for Mn-, Fe-, and Zn-impregnated AC with HNO3 they were 0.9886, 0.9656, and 0.9515. A high R2 value near 1 indicates strong agreement between the experimental and model findings within the experimentally reasonable range, and it suggests that a desired and acceptable agreement with adjusted R2 is required for successful model fit [71]. The models provided in Table 5 were thus found to be sufficient to predict the data from the experimental removal of Mn, Fe, and Zn based on the statistical findings. Three models, namely the 2FI model for Mn removal by KOH-impregnated AC and HNO3-impregnated AC, the linear model for Fe by KOH-impregnated AC and Zn by HNO3-impregnated AC, and the quadratic model for Zn by KOH-impregnated AC and Fe by HNO3-impregnated AC, are significant model terms in the current study.
Additionally, the following equations describe the prediction models for the removal of Mn, Fe, and Zn by KOH- and HNO3-impregnated AC:
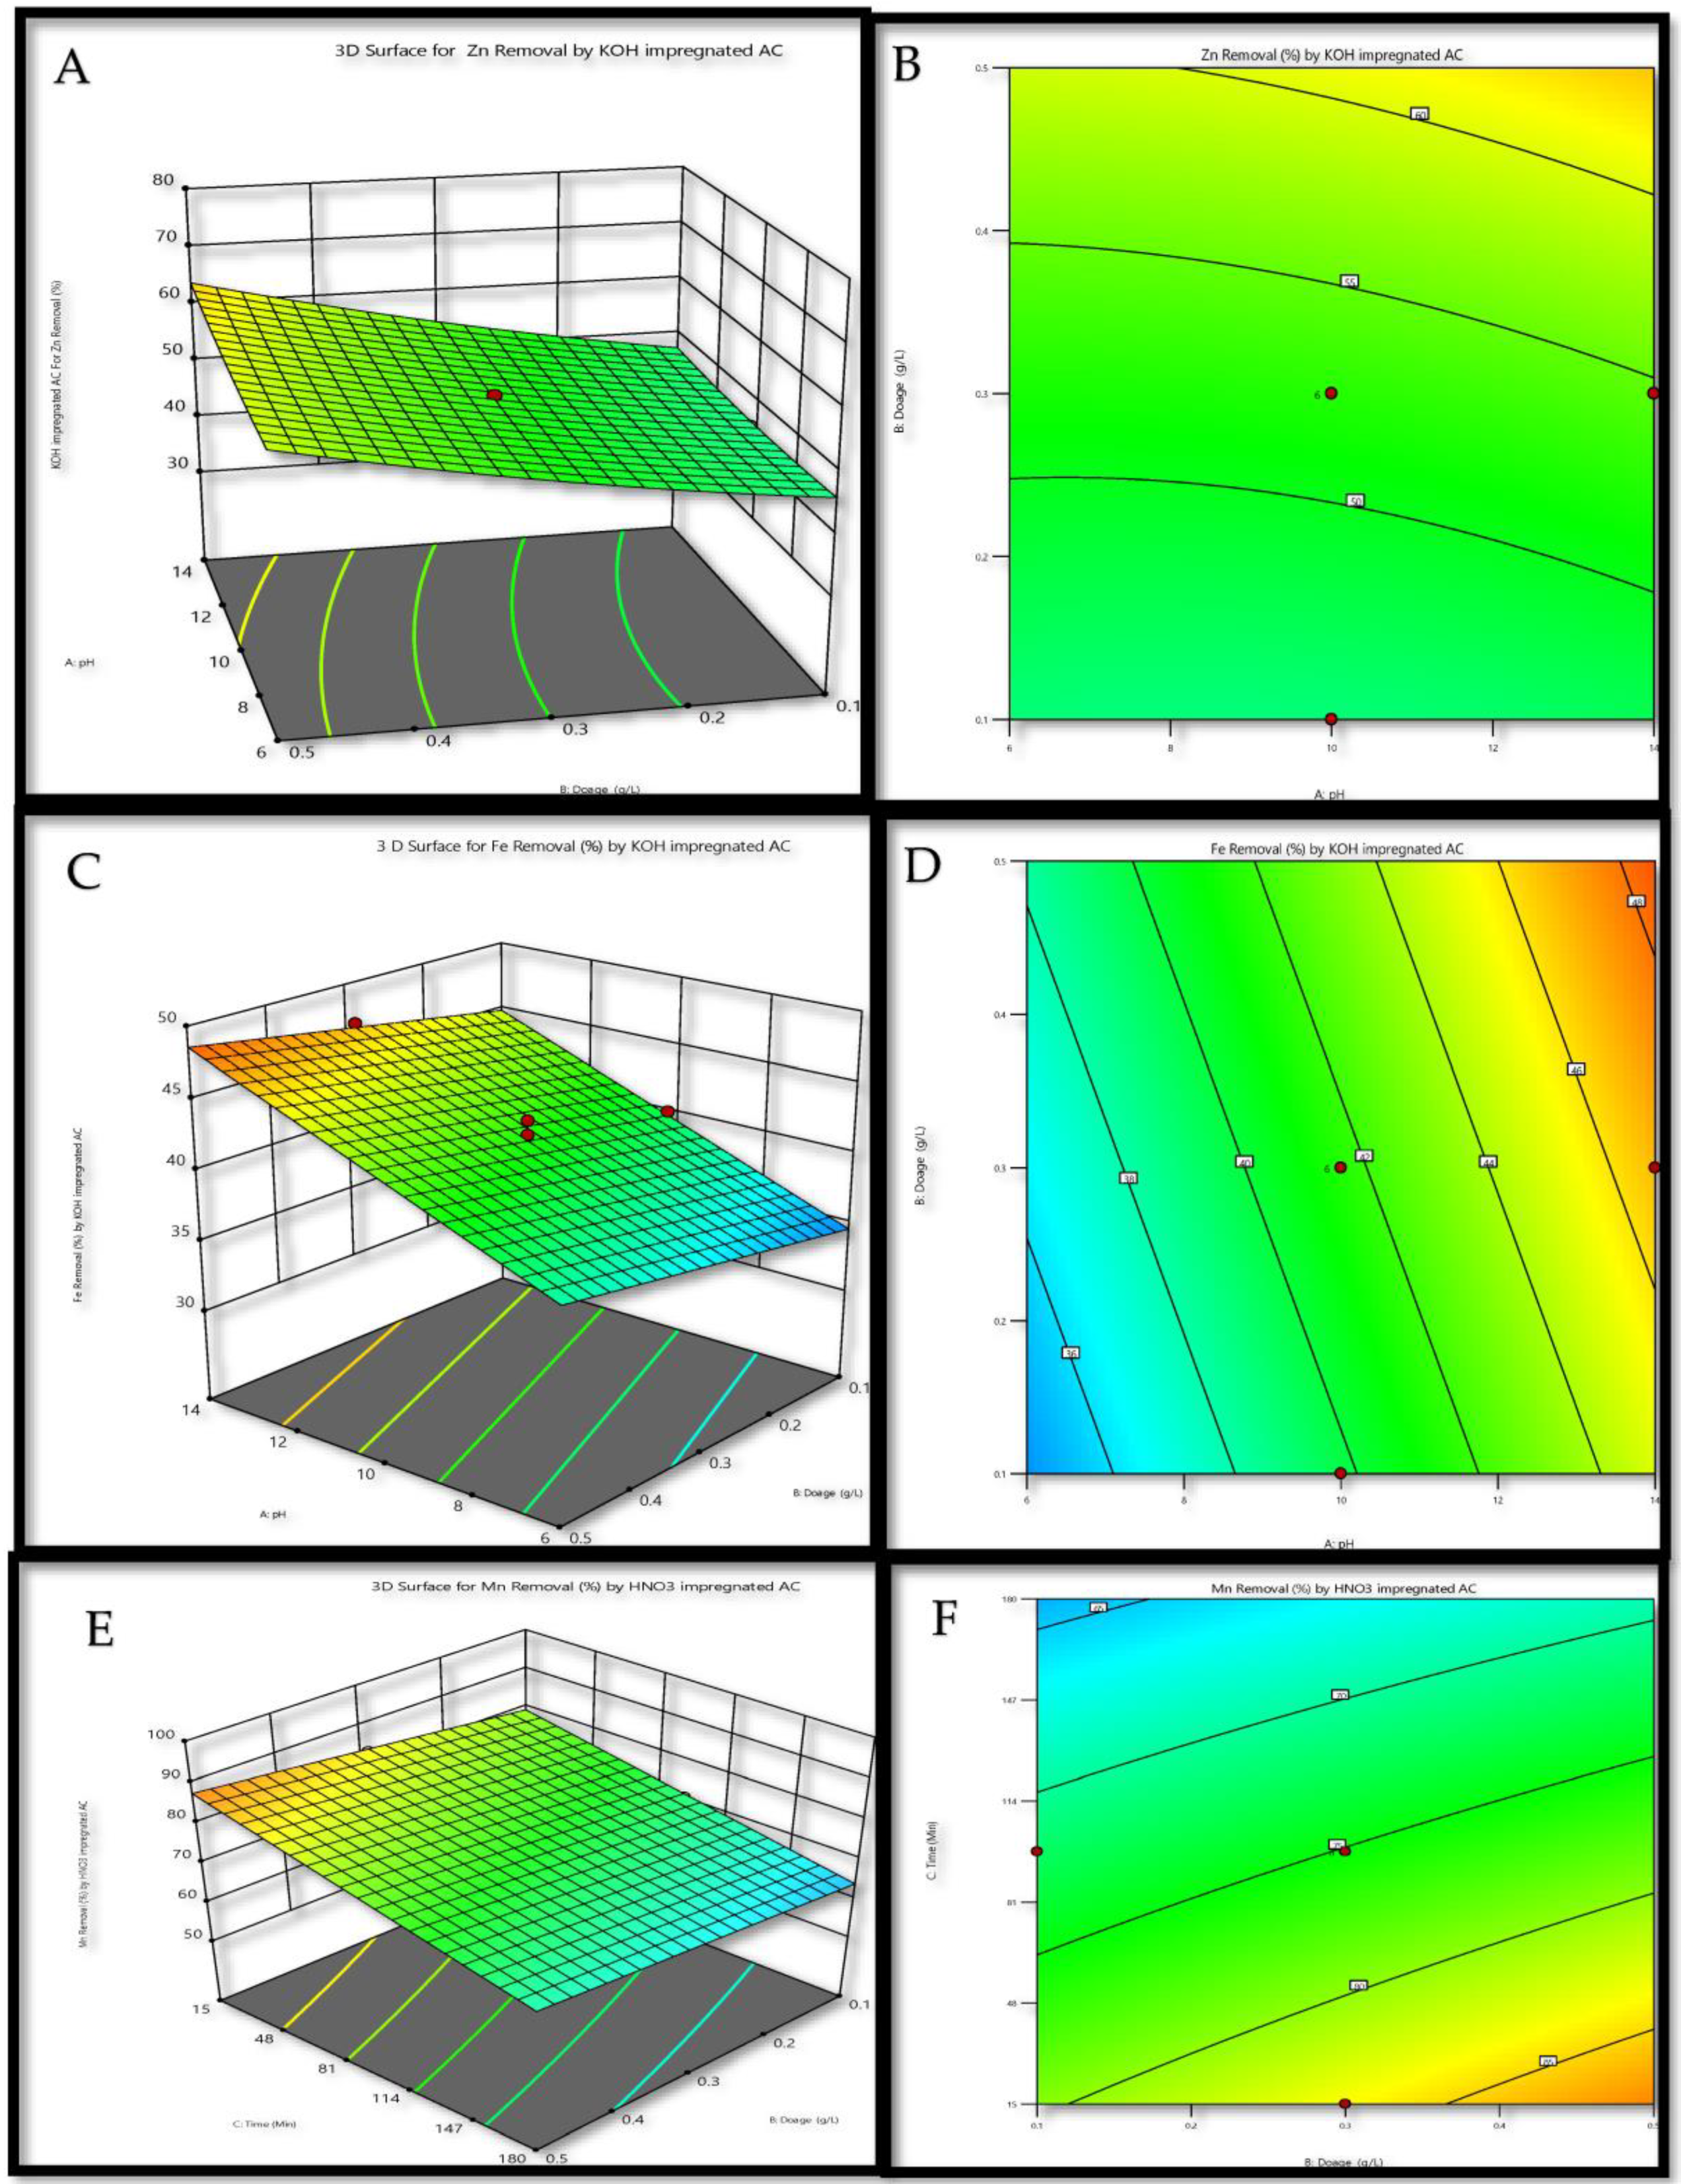
  • Zn Removal by KOH impregnated
AC   = 52.3672 + 1.46211 ×   A   + 7.44651 ×   B   + 8.47408 ×   C   + 0.75 ×   AB   + 0.75 ×   AC   + 0.5 ×   BC   + 0.771065 ×   A 2 + 1.07081 × B 2 + 2.09909 ×   C 2
  • Fe Removal (%) by KOH impregnated
  AC   = 41.5781 + 5.15511 ×   A   + 1.84097 ×   B   + 0.846808 ×   C
  • Mn Removal (%) by KOH impregnated
  AC = 74.4884 + 6.37378 ×   A   + 6.77829 ×   B   + 6.78895 ×   C   + 7.125 ×   AB   + 7.625 ×   AC   + 1.375 ×   BC ;
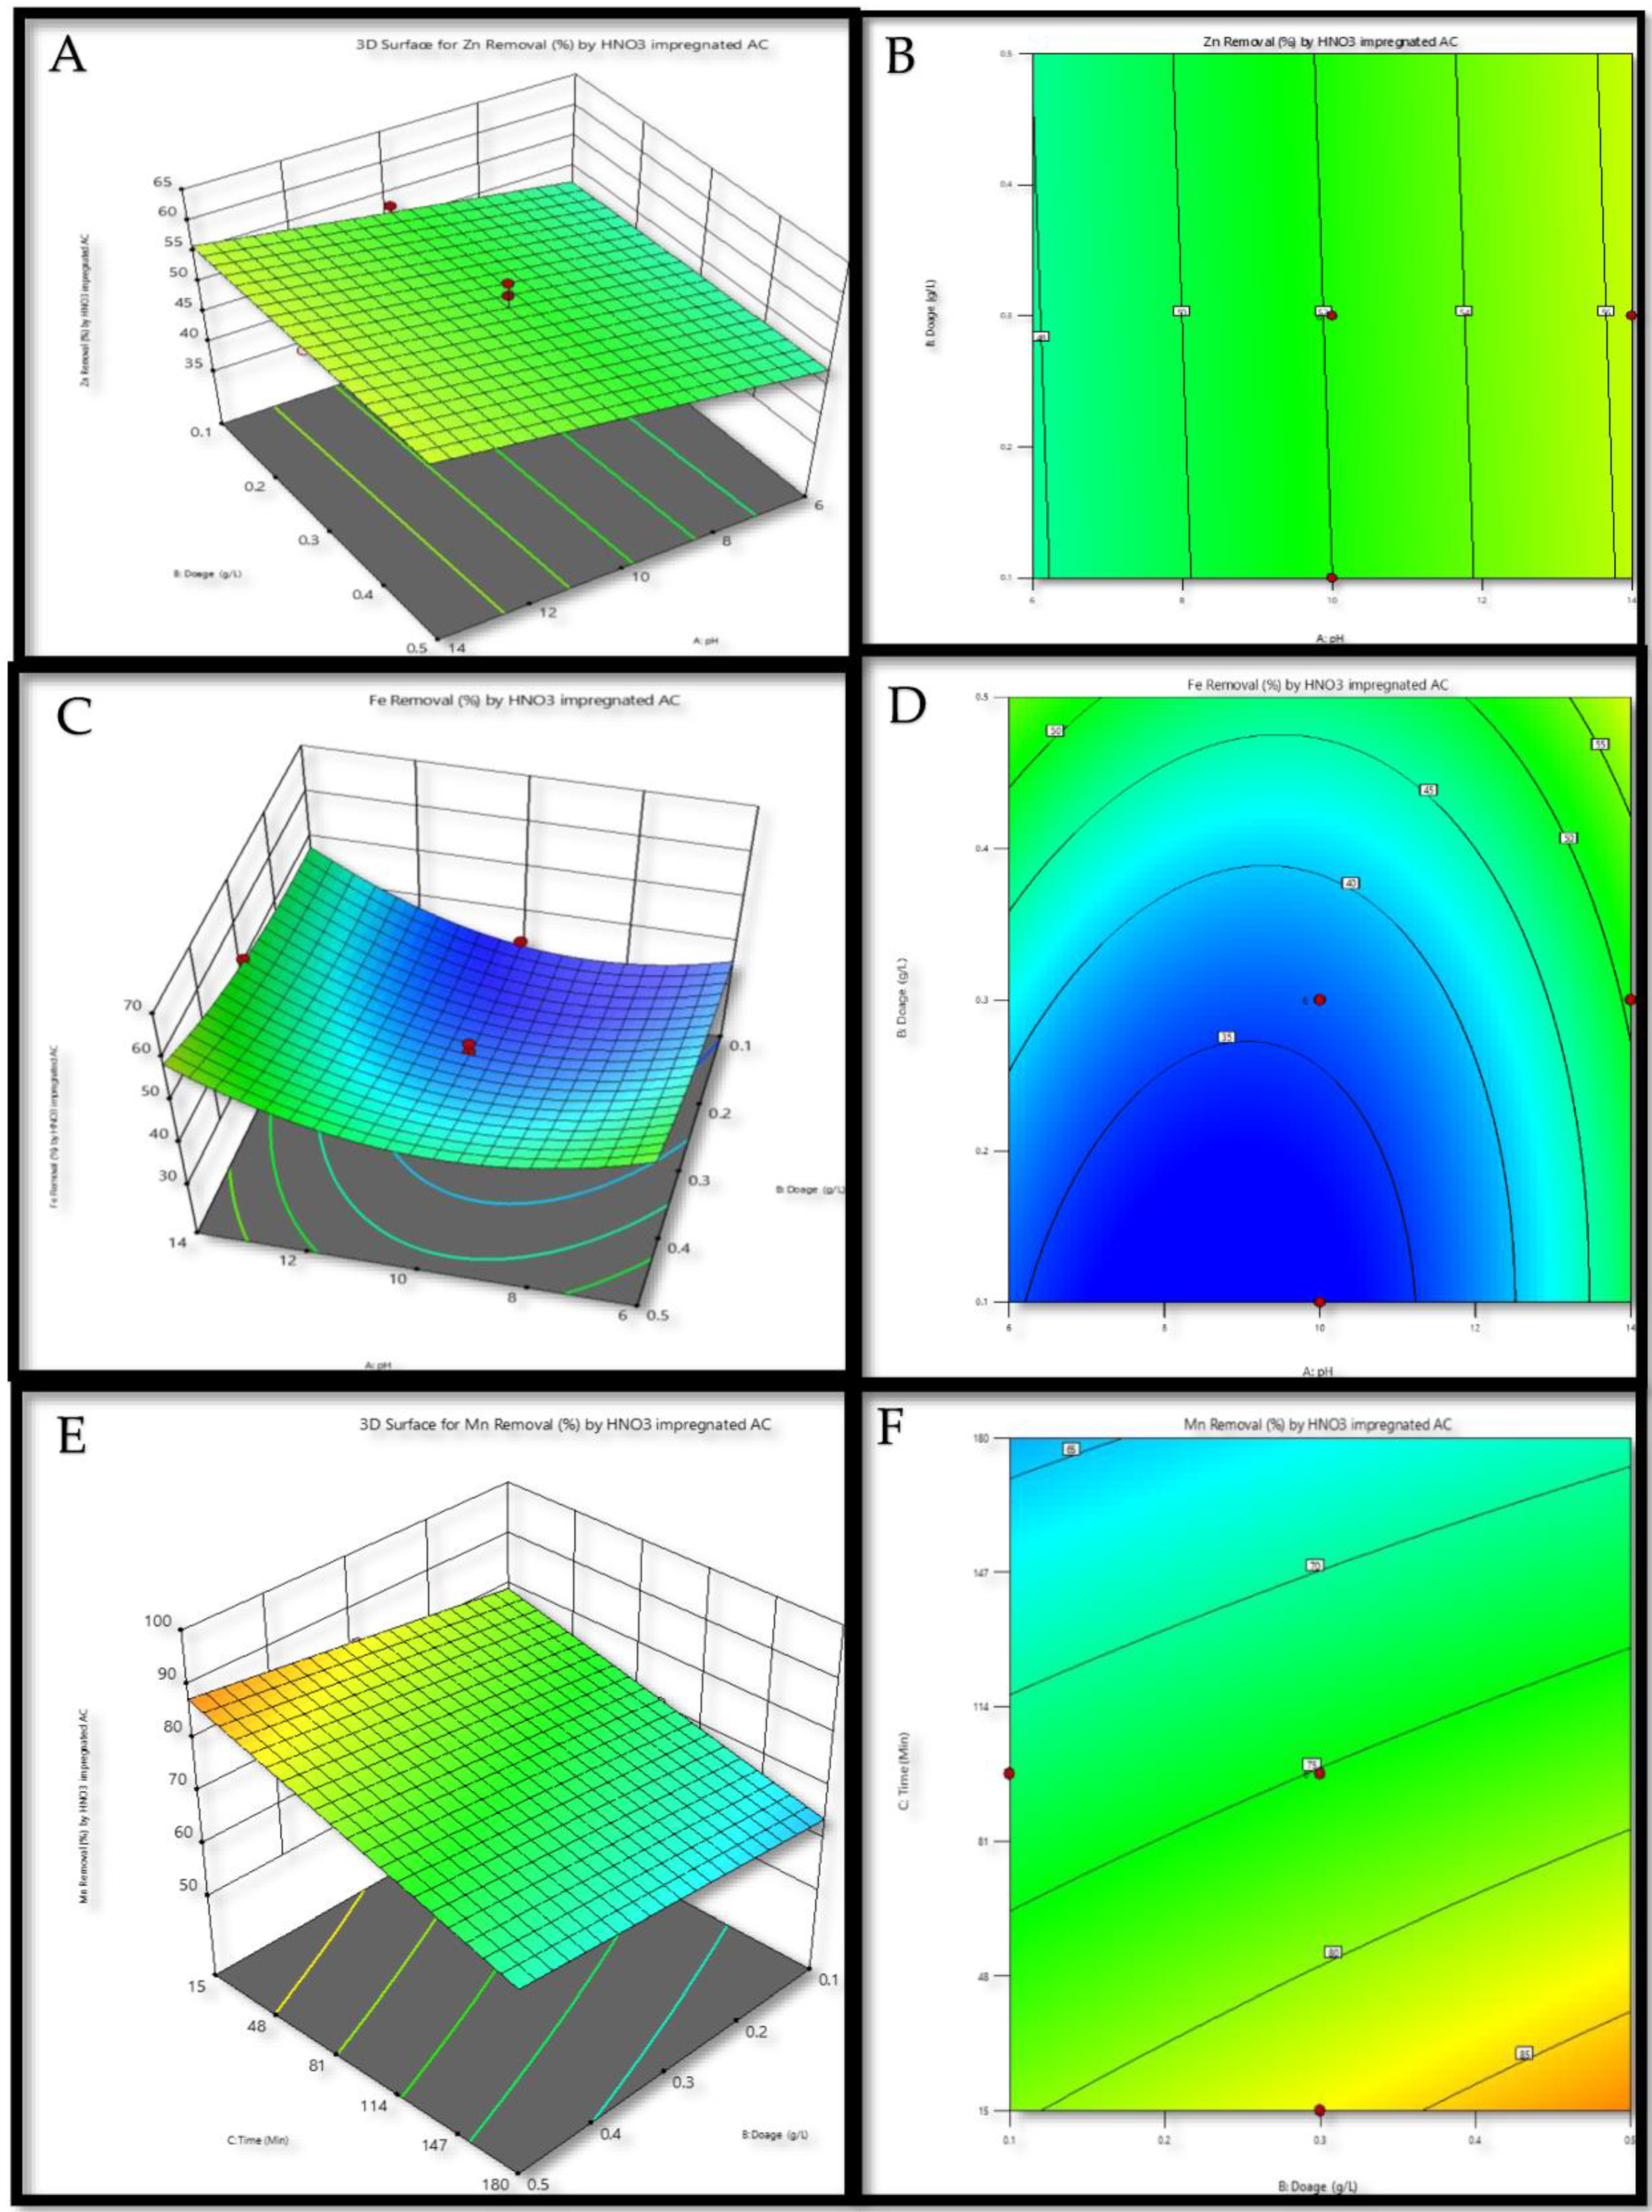
  • Mn Removal (%) by HNO_(3) impregnated
  AC = 69.2799 + 0.961262 ×   A   + 24.19 ×   B   + 0.119858 ×   C   + 0.3125 ×   AB   + 0.0030303 ×   AC   + 0.0454545 ×   BC
  • Zn Removal by HNO_(3 ) impregnated
AC = 52.1243 + 4.23571 ×   A   + 0.127807 ×   B   + 7.38892 ×   C ;
  • Fe Removal (%) by HNO_3 impregnated
  AC   = 36.4747 + 4.34898 ×   A   + 7.30982 ×   B   + 1.5495 ×   C   + 2 ×   AB   + 3.75 ×   AC   + 6.5 ×   BC   + 9.88754 × A 2 + 2.95883 ×   B 2 + 4.7925 ×   C 2
where: A: pH, B: dosage, and C: time.
In order to establish the model with the highest degree of accuracy, the predictions removing data were also subjected to error analysis and coefficient of determination (R2) analysis. The results are shown in Table 6. The highest observed and predicted removal efficiencies are for Mn (97% and 95%, respectively), whereas the lowest observed and predicted efficiencies are for Fe (46% and 49%, respectively). Table 6 shows that the predicted removal efficiency has low values for MSE, RMSE, MAD, and MAPE, and the R2 values are more than 0.95 for all three metals. As a consequence, AC impregnated with
KOH or HNO3 may be used as a natural adsorbent to remove Mn, Fe, and Zn ions. Error analysis showed that RSM models best reflect the removal data.
In addition, the optimal conditions for the removal of Mn, Fe, and Zn according to the prediction were also shown in Figure 8 as a cube plot, with the highest removal being highlighted in red on the cube. According to Figure 9, the highest removal was achieved for Zn and Fe by KOH-impregnated AC (Figure 8A,B, as well as Zn and Fe by HNO3-impregnated AC (Figure 8D,E) at higher pH, adsorbent dosage, and lower contact time; however, the highest removal was achieved for Mn by KOH-impregnated (Figure 8C) and HNO3-impregnated AC (Figure 8F) at higher adsorbent dosage, lower pH, and contact time.

3.9.2. Three-Dimensional Surface and Contour Plots for Mn, Fe, and Zn Removal

The Design Expert 13 software (version 13) was used to create three-dimensional (3D) surface response and contour plots in order to analyze the interaction correlations between independent factors and certain models’ responses. The response surface models created to predict the removal of Mn, Fe, and Zn were considered reasonable in light of the findings [72].
Figure 9A–D show the three-dimensional response surface of the combined influence of pH and adsorbent dose when the contact time was kept at its optimal level (t = 120 min). As a consequence, high pH (10–14) and high adsorbent dose (0.4, 0.5 g/L) yielded the highest Zn removal by KOH-impregnated AC, as shown in Figure 9A,B and Fe removal by KOH-impregnated AC, as shown in Figure 9C,D, while low pH (6) and low adsorbent dosage (0.1, 0.2 g/L) yielded poorer metal removal. While the pH was kept at its optimal level (pH = 8), Figure 9E,F show the three-dimensional response surface and contour plot of the combined influence of contact time and adsorbent dose for Mn percentage removal. As a consequence, KOH-impregnated AC demonstrated optimal Mn removal at low contact time (15–48 min) and high adsorbent dosage (0.4, 0.5 mg/L), KOH-impregnated AC demonstrated optimum Fe removal at low contact time (15–48 min) and adsorbent dosage (0.4, 0.5 g/L). In addition, the optimum pH and adsorbent dosage under optimal contact conditions (t = 120 min) are shown on a three-dimensional response surface in Figure 10A–D. Therefore, as demonstrated in Figure 10A,B, Zn removal by HNO3-impregnated AC is the greatest at high pH (13–14) and high adsorbent dose (0.3, 0.5 g/L), but Fe removal is the worst at low pH (6–8) and low adsorbent dosage (0.1–0.3 mg/L). Figure 9E,F illustrate a three-dimensional response surface and contour plot of the combined impact of contact time and adsorbent dosage for Mn % removal while the pH was maintained at the optimum level (pH = 8). Therefore, HNO3-impregnated AC was found to be most effective at removing Mn when soaked in water for just 15 to 48 min at a high adsorbent dose (0.4 or 0.5 g/L), and the most effective at removing Fe when exposed to water for only 15 to 48 min at a high adsorbent dosage (0.3–0.5 g/L). Furthermore, according to the results of three-dimensional plots reported by Suwannahong et al. [73], the removal capacity for Cu (II) removal influenced all variable factors, particularly pH and dose, and it was found that these variables had an impact on Cu (II) removal efficiency. Moreover, Suwannahong et al. [74] used the classified reduced quadratic models to map the response surface in three dimensions (3D) and determine the optimum operating parameters for the Fenton oxidation process’s effectiveness in removing color and COD (Chemical Oxygen Demand, mg/L). They demonstrated how the Fenton oxidation process’s color and COD efficiency were predicted by the reduced quadratic model. The perturbation plots were also used to compare the impacts of all variable components under the optimum operating circumstances in terms of the percent range for color and COD removal effectiveness through the Fenton oxidation process.

4. Conclusions

From the results of the current study, it can be concluded that KOH and HNO3 can produce activated carbon (AC) with a faster process and low activation temperature. The optimal activated carbon of both KOH and HNO3 was obtained at conditions (10% impregnation ratio, 480 °C activation temperature, and 20 min activation time) which resulted in 883.3 and 372.4 m2/g surface areas, respectively.
The AC produced also possesses good pore development and high carbon yield. The activation process modifies more functional groups such as hydroxyl groups, carbonyl groups, and aromatic compounds than untreated raw material, which could enhance the adsorbent’s performance. The 10KOH480 is highly microporous (pores with a size of fewer than 2 nm or 20 Å) when compared with that produced through HNO3. On the other hand, 10HNO480 has resulted in mesoporous (pores with sizes between 2 and 50 nm or 20 and 500 Å) carbon material.
This has resulted in a higher adsorption percentages of metal pollutants from wastewater using KOH, which are 96.14% for Mn, 70.05% for Zn, and approximately 50% for Fe at optimum parameters of pH, adsorbent dosage, and contact time. However, further optimum values of parameters such as temperature, metal initial concentration, and shaking speed could be considered in the future for more detailed results.
The predicted versus actual values of Mn, Fe, and Zn removal show an adequate agreement between real data and those gained from the models. Consequently, all predictive models achieved in this study can be used to predict heavy metal removal with high sufficiently and accuracy.

Supplementary Materials

The following supporting information can be downloaded at: https://www.mdpi.com/article/10.3390/su15086734/s1, Figure S1. The Picture of oil palm petiole (OPP) that has been extracted from oil palm fronds. The leaf was exiled from the oil palm fronds and only the petiole of the oil palm was employed in our study.

Author Contributions

Conceptualization, data curation, formal analysis, resources, visualization, writing—original draft, writing—review and editing, S.A.; supervision, resources, conceptualization, project administration, writing—original draft, writing—review and editing, W.A.H.A.; supervision, resources, funding acquisition, visualization, N.O.; validation and formal analysis, F.S.K.; investigation and formal analysis, S.S.; data curation, validation, funding acquisition, H.A.T.; data curation and validation, A.M.A.A. All authors have read and agreed to the published version of the manuscript.

Funding

This research was supported by the Ministry of Higher Education (MOHE) through Fundamental Research Grant Scheme (FRGS) (FRGS/1/2019/WAB05/UTHM/02/7) and Universiti Tun Hussein Onn Malaysia (UTHM) through Tier 1 (vot H618). Wahid Ali Hamood Altowayti extends his gratitude to Universiti Teknologi Malaysia (UTM) for financial sponsorship and the Post-Doctoral Fellowship Scheme under UTM Professional Development Research University Grant (06E27).

Institutional Review Board Statement

Not applicable.

Informed Consent Statement

Not applicable.

Data Availability Statement

Not applicable.

Acknowledgments

The authors fully acknowledged the Ministry of Higher Education (MOHE) for funding this work through the Fundamental Research Grant Scheme (FRGS) (FRGS/1/2019/WAB05/UTHM/02/7) and Universiti Tun Hussein Onn Malaysia (UTHM) through Tier 1 (vot H618). Wahid Ali Hamood Altowayti extends his gratitude to Universiti Teknologi Malaysia (UTM) for financial sponsorship and the Post-Doctoral Fellowship Scheme under UTM Professional Development Research University Grant (06E27).

Conflicts of Interest

The authors declare no conflict of interest.

References

  1. Kloch, M.; Toczyłowska-Mamińska, R. Toward optimization of wood industry wastewater treatment in microbial fuel cells—Mixed wastewaters approach. Energies 2020, 13, 263. [Google Scholar] [CrossRef]
  2. Bouchareb, R.; Derbal, K.; Özay, Y.; Bilici, Z.; Dizge, N. Combined natural/chemical coagulation and membrane filtration for wood processing wastewater treatment. J. Water Process Eng. 2020, 37, 101521. [Google Scholar] [CrossRef]
  3. Saltberg, A.; Brelid, H.; Theliander, H. Removal of metal ions from wood chips during acidic leaching 1: Comparison between Scandinavian softwood, birch and eucalyptus. Nord. Pulp Pap. Res. J. 2006, 21, 507–512. [Google Scholar] [CrossRef]
  4. Portenkirchner, K.; Draxler, J.; Somitsch, W.; Stassen, O. Combined waste air and wastewater treatment plant for the wood panel industry. Eng. Life Sci. 2003, 3, 465–468. [Google Scholar] [CrossRef]
  5. Santos, R.B.; Gomide, J.L.; Hart, P.W. Impact of wood chips leaching pretreatment on wood chemical composition. Tappi J. 2015, 14, 9–14. [Google Scholar] [CrossRef]
  6. Lepine, C.; Christianson, L.; Soucek, D.; McIsaac, G.; Summerfelt, S. Metal leaching and toxicity of denitrifying woodchip bioreactor outflow—Potential reuse application. Aquac. Eng. 2021, 93, 102129. [Google Scholar] [CrossRef]
  7. Senthil Kumar, P.; Saravanan, A.; Anish Kumar, K.; Yashwanth, R.; Visvesh, S. Removal of toxic zinc from water/wastewater using eucalyptus seeds activated carbon: Non-linear regression analysis. IET Nanobiotechnol. 2016, 10, 244–253. [Google Scholar] [CrossRef]
  8. Moreno, J.C.; Gómez, R.; Giraldo, L. Removal of Mn, Fe, Ni and Cu ions from wastewater using cow bone charcoal. Materials 2010, 3, 452–466. [Google Scholar] [CrossRef]
  9. Yunus, M.A.M.; Ibrahim, S.; Altowayti, W.A.H.; San, G.P.; Mukhopadhyay, S.C. Selective membrane for detecting nitrate based on planar electromagnetic sensors array. In Proceedings of the 2015 10th Asian Control Conference (ASCC), Kota Kinabalu, Malaysia, 31 May–3 June 2015; IEEE: Piscataway, NJ, USA, 2015; pp. 1–6. [Google Scholar]
  10. Duan, D.; Chen, D.; Huang, L.; Zhang, Y.; Zhang, Y.; Wang, Q.; Xiao, G.; Zhang, W.; Lei, H.; Ruan, R. Activated carbon from lignocellulosic biomass as catalyst: A review of the applications in fast pyrolysis process. J. Anal. Appl. Pyrolysis 2021, 158, 105246. [Google Scholar] [CrossRef]
  11. Anisuzzaman, S.; Joseph, C.G.; Daud, W.M.A.B.W.; Krishnaiah, D.; Yee, H.S. Preparation and characterization of activated carbon from Typha orientalis leaves. Int. J. Ind. Chem. 2015, 6, 9–21. [Google Scholar] [CrossRef]
  12. Urbain, K.; Aim, S.E.; Jacques, A.Y.; Albert, T. Adsorption of iron and zinc on commercial activated carbon. J. Environ. Chem. Ecotoxicol. 2013, 5, 168–171. [Google Scholar]
  13. Bakar, N.A.; Othman, N.; Yunus, Z.M.; Altowayti, W.A.H.; Al-Gheethi, A.; Asharuddin, S.M.; Tahir, M.; Fitriani, N.; Mohd-Salleh, S.N.A. Nipah (Musa Acuminata Balbisiana) banana peel as a lignocellulosic precursor for activated carbon: Characterization study after carbonization process with phosphoric acid impregnated activated carbon. Biomass Convers. Biorefinery 2021, 1–14. [Google Scholar] [CrossRef]
  14. El-Bendary, N.; El-Etriby, H.K.; Mahanna, H. High performance removal of iron from aqueous solution using modified activated carbon prepared from corn cobs and luffa sponge. Desalin. Water Treat. 2021, 213, 348–357. [Google Scholar] [CrossRef]
  15. Ayob, S.; Othman, N.; Altowayti, W.A.H.; Khalid, F.S.; Bakar, N.A.; Tahir, M.; Soedjono, E.S. A review on adsorption of heavy metals from wood-industrial wastewater by oil palm waste. J. Ecol. Eng. 2021, 22, 249–265. [Google Scholar] [CrossRef]
  16. Dungani, R.; Aditiawati, P.; Aprilia, S.; Yuniarti, K.; Karliati, T.; Suwandhi, I.; Sumardi, I. Biomaterial from oil palm waste: Properties, characterization and applications. Palm Oil 2018, 31, 1–6. [Google Scholar]
  17. Ooi, Z.X.; Teoh, Y.P.; Kunasundari, B.; Shuit, S.H. Oil palm frond as a sustainable and promising biomass source in Malaysia: A review. Environ. Prog. Sustain. Energy 2017, 36, 1864–1874. [Google Scholar] [CrossRef]
  18. Said, F.M.; Hamid, N.F.; Razali, M.A.-A.; Daud, N.F.S. Lignocellulosic of Oil Palm Biomass to Chemical Product via Fermentation. In Elaeis guineensis; IntechOpen: London, UK, 2021. [Google Scholar]
  19. Zubaidah, S.; Putri Hartoyo, A.P.; Sihombing, J.K.; Herliyana, E.N.; Darmawan, S.; Sari, N.R.; Prabowo, M.N.I.; Hermawan, I.; Maulida, I.; Solikhin, A. Oil palm empty fruit bunch valorization for activated and non-activated carbon nanoparticles and its heavy-metal-removal efficiency. Water Sci. Technol. 2021, 83, 2652–2668. [Google Scholar] [CrossRef]
  20. Selvam, K.; Sudhakar, C.; Uma Maheswari, S.; Poonkothai, M.; Shri Devi, S.; Vijayakumar, N. Synthesis of activated carbon from Borassus flabellifer empty fruit bunch waste and their application in chromium (VI) removal. Int. J. Environ. Anal. Chem. 2021, 1–12. [Google Scholar] [CrossRef]
  21. Ibrahim, I.; Tsubota, T.; Hassan, M.A.; Andou, Y. Surface functionalization of biochar from oil palm empty fruit bunch through hydrothermal process. Processes 2021, 9, 149. [Google Scholar] [CrossRef]
  22. Ujile, A.; Okwakwam, C. Adsorption process of iron, cadmium, copper, lead from aqueous solution using palm bunch adsorbent. Chem. Process Eng. Res. 2018, 55, 11–21. [Google Scholar]
  23. Baby, R.; Hussein, M.Z. Ecofriendly approach for treatment of heavy-metal-contaminated water using activated carbon of kernel shell of oil palm. Materials 2020, 13, 2627. [Google Scholar] [CrossRef] [PubMed]
  24. Ajala, A.K.; Otunola, O.O.; Oyeniyan, W.O. Adsorption of Lead and Iron from Industrial Wastewater using Melon (Citrullus Colocynthis) Husk Activated Carbon. Int. J. Eng. Res. Technol. (IJERT) 2020, 9, 1638–1642. [Google Scholar]
  25. Gao, Y.; Yue, Q.; Gao, B.; Li, A. Insight into activated carbon from different kinds of chemical activating agents: A review. Sci. Total Environ. 2020, 746, 141094. [Google Scholar] [CrossRef] [PubMed]
  26. Yasin, Y.; Mohamad, M.; Ahmad, F.B. The application of response surface methodology for lead ion removal from aqueous solution using intercalated tartrate-Mg-Al layered double hydroxides. Int. J. Chem. Eng. 2013, 2013, 1–7. [Google Scholar] [CrossRef]
  27. Nicholas, A.F.; Hussein, M.Z.; Zainal, Z.; Khadiran, T. The effect of surface area on the properties of shape-stabilized phase change material prepared using palm kernel shell activated carbon. Sci. Rep. 2020, 10, 15047. [Google Scholar] [CrossRef]
  28. Angın, D.; Altintig, E.; Köse, T.E. Influence of process parameters on the surface and chemical properties of activated carbon obtained from biochar by chemical activation. Bioresour. Technol. 2013, 148, 542–549. [Google Scholar] [CrossRef]
  29. Song, J.; Wang, L.; Song, G. Research on influence factors on determination of specific surface area of carbon materical by N2 adsorption method. J. Appl. Sci. Eng. Innov. 2014, 1, 77–82. [Google Scholar]
  30. Altowayti, W.A.H.; Dahawi, A.A.; Shahir, S. Significance of bio-treatment by acid washing for enlargement of arsenic desorption in indigenous arsenic-resistant bacteria from gold mine. Malays. J. Fund. Appl. Sci. 2020, 16, 190–195. [Google Scholar] [CrossRef]
  31. Allozy, H.G.A.; Abd Karim, K.J. Removal of copper ions from aqueous solutions using poly (vinylbenzyl chloride). Malays. J. Anal. Sci. 2020, 24, 978–991. [Google Scholar]
  32. Auta, M.; Hameed, B. Optimized waste tea activated carbon for adsorption of Methylene Blue and Acid Blue 29 dyes using response surface methodology. Chem. Eng. J. 2011, 175, 233–243. [Google Scholar] [CrossRef]
  33. Ahmad, A.; Hameed, B. Effect of preparation conditions of activated carbon from bamboo waste for real textile wastewater. J. Hazard. Mater. 2010, 173, 487–493. [Google Scholar] [CrossRef]
  34. Alslaibi, T.M.; Abustan, I.; Ahmad, M.A.; Foul, A.A. Application of response surface methodology (RSM) for optimization of Cu2+, Cd2+, Ni2+, Pb2+, Fe2+, and Zn2+ removal from aqueous solution using microwaved olive stone activated carbon. J. Chem. Technol. Biotechnol. 2013, 88, 2141–2151. [Google Scholar] [CrossRef]
  35. Alshalif, A.F.; Irwan, J.; Tajarudin, H.A.; Othman, N.; Al-Gheethi, A.; Shamsudin, S.; Altowayti, W.A.H.; Abo Sabah, S. Optimization of bio-foamed concrete brick strength via bacteria based self-healing and bio-sequestration of CO2. Materials 2021, 14, 4575. [Google Scholar] [CrossRef]
  36. Altowayti, W.A.H.; Shahir, S.; Eisa, T.A.E.; Nasser, M.; Babar, M.I.; Alshalif, A.F.; AL-Towayti, F.A.H. Smart Modelling of a Sustainable Biological Wastewater Treatment Technologies: A Critical Review. Sustainability 2022, 14, 5353. [Google Scholar] [CrossRef]
  37. Chan, L.; Cheung, W.; Allen, S.; McKay, G. Error analysis of adsorption isotherm models for acid dyes onto bamboo derived activated carbon. Chin. J. Chem. Eng. 2012, 20, 535–542. [Google Scholar] [CrossRef]
  38. Altowayti, W.A.H.; Othman, N.; Al-Gheethi, A.; Dzahir, N.H.b.M.; Asharuddin, S.M.; Alshalif, A.F.; Nasser, I.M.; Tajarudin, H.A.; Al-Towayti, F.A.H. Adsorption of Zn2+ from Synthetic Wastewater Using Dried Watermelon Rind (D-WMR): An Overview of Nonlinear and Linear Regression and Error Analysis. Molecules 2021, 26, 6176. [Google Scholar] [CrossRef]
  39. Altowayti, W.A.H.; Salem, A.A.; Al-Fakih, A.M.; Bafaqeer, A.; Shahir, S.; Tajarudin, H.A. Optimization of As (V) Removal by Dried Bacterial Biomass: Nonlinear and Linear Regression Analysis for Isotherm and Kinetic Modelling. Metals 2022, 12, 1664. [Google Scholar] [CrossRef]
  40. Othmani, A.; John, J.; Rajendran, H.; Mansouri, A.; Sillanpää, M.; Chellam, P.V. Biochar and activated carbon derivatives of lignocellulosic fibers towards adsorptive removal of pollutants from aqueous systems: Critical study and future insight. Sep. Purif. Technol. 2021, 274, 119062. [Google Scholar] [CrossRef]
  41. Yunus, Z.M.; Al-Gheethi, A.; Othman, N.; Hamdan, R.; Ruslan, N.N. Removal of heavy metals from mining effluents in tile and electroplating industries using honeydew peel activated carbon: A microstructure and techno-economic analysis. J. Clean. Prod. 2020, 251, 119738. [Google Scholar] [CrossRef]
  42. Hameed, A.; Khurshid, S.; Adnan, A. Synthesis and characterization of carboxymethyl cellulose based hydrogel and its applications on water treatment. Adsorption 2020, 5, 8. [Google Scholar] [CrossRef]
  43. Maulina, S.; Iriansyah, M. Characteristics of activated carbon resulted from pyrolysis of the oil palm fronds powder. IOP Conf. Ser. Mater. Sci. Eng. 2018, 309, 012072. [Google Scholar] [CrossRef]
  44. Wahyuningsih; Abidin, Z.; Yulianto, M.E.; Hartati, I.; Yohana, E. Preparation and characterization of oil palm shell activated carbon by alkali chemical activation method. AIP Conf. Proc. 2018, 1977, 020028. [Google Scholar]
  45. Nyamful, A.; Nyogbe, E.K.; Mohammed, L.; Zainudeen, M.; Darkwa, S.; Phiri, I.; Mohammed, M.; Ko, J. Processing and characterization of activated carbon from coconut shell and palm kernel shell waste by H3PO4 activation. Ghana J. Sci. 2020, 61, 91–104. [Google Scholar] [CrossRef]
  46. Kumar, A.; Jena, H.M. Preparation and characterization of high surface area activated carbon from Fox nut (Euryale ferox) shell by chemical activation with H3PO4. Results Phys. 2016, 6, 651–658. [Google Scholar] [CrossRef]
  47. Maulina, S.; Anwari, F. Utilization of oil palm fronds in producing activated carbon using Na2CO3 as an activator. IOP Conf. Ser. Mater. Sci. Eng. 2018, 309, 012087. [Google Scholar] [CrossRef]
  48. Ukanwa, K.S.; Patchigolla, K.; Sakrabani, R.; Anthony, E.; Mandavgane, S. A review of chemicals to produce activated carbon from agricultural waste biomass. Sustainability 2019, 11, 6204. [Google Scholar] [CrossRef]
  49. Arundina, R.Y.; Permana, I.; Togatorop, E.R.S.; Ismadi, I.; Kusumah, S.S.; Budiman, I.; Subyakto, S.; Marlina, R. Synthesis and Characterization of Activated Carbon from Lignocellulosic Biomass: Oil Palm Empty Fruit Bunches and Mahogany Sawdust. J. Bahan Alam Terbarukan 2021, 10, 81–88. [Google Scholar] [CrossRef]
  50. Al-Swaidan, H.M.; Ahmad, A. Synthesis and characterization of activated carbon from Saudi Arabian dates tree’s fronds wastes. In Proceedings of the 3rd International Conference on Chemical, Biological and Environmental Engineering (IPCBEE), Singapore, 23–25 September 2011; Citeseer: Singapore, 2011; pp. 25–31. [Google Scholar]
  51. Zainol, M.M.; Amin, N.A.S.; Asmadi, M. Preparation and characterization of impregnated magnetic particles on oil palm frond activated carbon for metal ions removal. Sains Malays. 2017, 46, 773–782. [Google Scholar] [CrossRef]
  52. Kaewtrakulchai, N.; Kaewmeesri, R.; Itthibenchapong, V.; Eiad-Ua, A.; Faungnawakij, K. Palm oil conversion to bio-jet and green diesel fuels over cobalt phosphide on porous carbons derived from palm male flowers. Catalysts 2020, 10, 694. [Google Scholar] [CrossRef]
  53. Hidayu, A.; Sukor, M.; Mohammad, N.; Elham, O.; Azri, N.; Azhar, M.; Jalil, M. In Preparation of activated carbon from palm kernel shell by chemical activation and its application for β-carotene adsorption in crude palm oil. J. Phys. Conf. Ser. 2019, 1349, 012103. [Google Scholar] [CrossRef]
  54. Maulina, S.; Mentari, V.A. In Comparison of functional group and morphological surface of activated carbon from oil palm fronds using phosphoric acid (H3PO4) and nitric acid (HNO3) as an activator. IOP Conf. Ser. Mater. Sci. Eng. 2019, 505, 012023. [Google Scholar] [CrossRef]
  55. Hesas, R.H.; Daud, W.M.A.W.; Sahu, J.; Arami-Niya, A. The effects of a microwave heating method on the production of activated carbon from agricultural waste: A review. J. Anal. Appl. Pyrolysis 2013, 100, 1–11. [Google Scholar] [CrossRef]
  56. Gokce, Y.; Aktas, Z. Nitric acid modification of activated carbon produced from waste tea and adsorption of methylene blue and phenol. Appl. Surf. Sci. 2014, 313, 352–359. [Google Scholar] [CrossRef]
  57. Okman, I.; Karagöz, S.; Tay, T.; Erdem, M. Activated carbons from grape seeds by chemical activation with potassium carbonate and potassium hydroxide. Appl. Surf. Sci. 2014, 293, 138–142. [Google Scholar] [CrossRef]
  58. Sultana, M.; Rownok, M.H.; Sabrin, M.; Rahaman, M.H.; Alam, S.N. A review on experimental chemically modified activated carbon to enhance dye and heavy metals adsorption. Clean. Eng. Technol. 2022, 6, 100382. [Google Scholar] [CrossRef]
  59. ALOthman, Z.A. A review: Fundamental aspects of silicate mesoporous materials. Materials 2012, 5, 2874–2902. [Google Scholar] [CrossRef]
  60. Rugayah, A.; Astimar, A.; Norzita, N. Preparation and characterization of activated carbon from palm kernel shell by physical activation with steam. J. Oil Palm Res. 2014, 26, 251–264. [Google Scholar]
  61. Yankovych, H.; Novoseltseva, V.; Kovalenko, O.; Behunova, D.M.; Kanuchova, M.; Vaclavikova, M.; Melnyk, I. New perception of Zn (II) and Mn (II) removal mechanism on sustainable sunflower biochar from alkaline batteries contaminated water. J. Environ. Manag. 2021, 292, 112757. [Google Scholar] [CrossRef]
  62. Mohanta, J.; Dey, B.; Dey, S. Sucrose-triggered, self-sustained combustive synthesis of magnetic nickel oxide nanoparticles and efficient removal of malachite green from water. ACS Omega 2020, 5, 16510–16520. [Google Scholar] [CrossRef]
  63. Aziz, R.; Li, C.; Salleh, M.; Saleh, M. In Removal of Iron and Manganese from Palm Oil Mill Effluent (POME) using Activated Clinoptilolite Zeolite. IOP Conf. Ser. Earth Environ. Sci. 2021, 765, 012029. [Google Scholar] [CrossRef]
  64. Liu, Y.; Xu, X.; Qu, B.; Liu, X.; Yi, W.; Zhang, H. Study on adsorption properties of modified corn cob activated carbon for mercury ion. Energies 2021, 14, 4483. [Google Scholar] [CrossRef]
  65. Altowayti, W.A.H.; Algaifi, H.A.; Bakar, S.A.; Shahir, S. The adsorptive removal of As (III) using biomass of arsenic resistant Bacillus thuringiensis strain WS3: Characteristics and modelling studies. Ecotoxicol. Environ. Saf. 2019, 172, 176–185. [Google Scholar] [CrossRef] [PubMed]
  66. Aziz, N.I.A.; Othman, N.; Altowayti, W.A.H.; Yunus, Z.M.; Fitriani, N.; Din, M.F.M.; Fikri, F.M. Hardness Removal of Groundwater Through Sand, Zeolite And Rice Husk Activated Carbon. Malays. J. Anal. Sci. 2021, 25, 605–621. [Google Scholar]
  67. Hui, T.S.; Zaini, M.A.A. Potassium hydroxide activation of activated carbon: A commentary. Carbon Lett. 2015, 16, 275–280. [Google Scholar] [CrossRef]
  68. Azman, A.; Ngadi, N.; Khairunnisa, D.; Zaini, A.; Jusoh, M.; Arsad, A. Effect of adsorption parameter on the removal of aspirin using tyre waste adsorbent. Chem. Eng. 2019, 72, 157–162. [Google Scholar]
  69. Inglezakis, V.J.; Balsamo, M.; Montagnaro, F. Liquid–solid mass transfer in adsorption systems—An overlooked resistance? Ind. Eng. Chem. Res. 2020, 59, 22007–22016. [Google Scholar] [CrossRef]
  70. Mustapha, S.; Ndamitso, M.; Abdulkareem, A.; Tijani, J.; Mohammed, A.; Shuaib, D. Potential of using kaolin as a natural adsorbent for the removal of pollutants from tannery wastewater. Heliyon 2019, 5, e02923. [Google Scholar] [CrossRef]
  71. Alshalif, A.F.; Juki, M.I.; Tajarudin, H.A.; Othman, N.; Al-Gheethi, A.A.; Shamsudin, S.; Altowayti, W.; Sabah, S.A. Optimisation of self-healing of bio-foamed concrete bricks pores using Bacillus tequilensis under different temperature and CO2 curing conditions. Sci. Rep. 2022, 12, 2682. [Google Scholar] [CrossRef]
  72. Alshalif, A.F.; Irwan, J.; Tajarudin, H.A.; Othman, N.; Al-Gheethi, A.; Shamsudin, S.; Altowayti, W.A.H.; Sabah, S.A. Factors Affecting Carbonation Depth in Foamed Concrete Bricks for Accelerate CO2 Sequestration. Sustainability 2021, 13, 10999. [Google Scholar] [CrossRef]
  73. Suwannahong, K.; Sirilamduan, C.; Deepatana, A.; Kreetachat, T.; Wongcharee, S. Characterization and Optimization of Polymeric Bispicolamine Chelating Resin: Performance Evaluation via RSM Using Copper in Acid Liquors as a Model Substrate through Ion Exchange Method. Molecules 2022, 27, 7210. [Google Scholar] [CrossRef]
  74. Suwannahong, K.; Wongcharee, S.; Kreanuarte, J.; Kreetachat, T. Pre-treatment of acetic acid from food processing wastewater using response surface methodology via Fenton oxidation process for sustainable water reuse. J. Sustain. Dev. Energy Water Environ. Syst. 2021, 9, 1–18. [Google Scholar] [CrossRef]
Figure 1. Lignocellulosic of OPP and other oil palm waste used as precursors for AC preparation.
Sustainability 15 06734 g001
Figure 2. DTG (a) and TGA (b) curve of raw-OPP.
Sustainability 15 06734 g002
Figure 3. (a) OPP-AC after activation process using KOH (b) OPP-AC after activation using HNO3.
Sustainability 15 06734 g003
Figure 4. FTIR of raw OPP, 10HNO480, and 10KOH48.
Sustainability 15 06734 g004
Figure 5. (a,b) surface morphology of raw OPP.
Sustainability 15 06734 g005
Figure 6. (a,b) surface morphology of 10HNO480 and 10KOH480.
Sustainability 15 06734 g006
Figure 7. (A), effect of pH percentage on Zn, Fe, and Mn removal by KOH impregnated AC; (B), pH on Zn, Fe, and Mn removal by HNO3-impregnated AC; (C), effect of adsorbent dosage on Zn, Fe, and Mn removal by KOH-impregnated AC; (D), effect of adsorbent dosage on Zn, Fe, and Mn removal by HNO3-impregnated AC; (E), effect of contact time on Zn, Fe, and Mn removal by KOH-impregnated AC; (F), effect of contact time on Zn, Fe, and Mn removal by HNO3-impregnated AC.
Sustainability 15 06734 g007
Figure 8. Cube plot of (A) Zn removal % using KOH-impregnated AC; (B) Fe removal % using KOH-impregnated AC; (C) Mn removal % using KOH-impregnated AC; (D) Zn removal % using HNO3-impregnated AC; (E) Fe removal % using HNO3-impregnated AC; (F) Mn removal % using HNO3-impregnated AC.
Sustainability 15 06734 g008
Figure 9. Response surface and contour plots for (A,B) Zn removal by KOH-impregnated AC; (C,D) Fe removal by KOH-impregnated AC; (E,F) Mn removal by KOH-impregnated AC.
Sustainability 15 06734 g009
Figure 10. Response surface and contour plots for (A,B) Zn removal by HNO3 impregnated AC, (C,D) Fe removal by HNO3 impregnated AC, and (E,F) Mn removal by HNO3 impregnated AC.
Sustainability 15 06734 g010
Table 1. Independent variables and their coded levels for CCD.
NameUnitsLowHigh−Alpha+Alpha
A [X1]pH 614314
B [X2]Dosageg/L0.10.5−0.050.7
C [X3]TimeMin15180−47242
Table 2. Percentage yield of activated carbon from oil palm petiole.
Temperature (°C)Percentage Yield (%)
KOHHNO3
46078.446.56
48091.453.46
5006749
Table 3. Porous structures of raw OPP and OPP-AC impregnated with KOH and HNO3.
SBET (m2/g)Vtotal
(cm3/g)
Vmicro
(cm3/g)
Vmeso
(cm3/g)
Raw OPP0.579---
10KOH480883.30.4600.3100.150
10HNO480372.40.260.1200.140
Table 4. Mn, Fe, and Zn removal from wastewater using modified activated carbon under optimum conditions.
pHAdsorption Dosage (g/L)Contact Time (min)Removal Percentage (%)
KOH-impregnated AC andMn120.215097
Fe100.212046
Zn80.212070
HNO3-impregnated ACMn100.212093
Fe100.212066
Zn80.212062
Table 5. Mn, Fe, and Zn removal from wastewater using modified activated carbon under optimum conditions.
ModelF-Valuep-ValueAdjusted R²Predicted R²
KOH-impregnated ACMn2 FI970.81<0.00010.99670.9900
FeLinear160.95<0.00010.96190.9423
ZnQuadratic105.32<0.00010.98020.9190
HNO3-impregnated ACMn2FI276.06<0.00010.98860.9037
FeQuadratic60.17<0.00010.96560.9137
ZnLinear125.18<0.00010.95150.9389
Table 6. Mn, Fe, and Zn removal from wastewater using modified activated carbon under optimum conditions.
Type of ACMetalRemovalMeanMSERMSEMADMAPE
ExperimentPrediction
KOH-impregnated ACMn979524220.0210.9978
Fe464939330.0650.9679
Zn707111110.0140.9896
HNO3-impregnated ACMn939124220.0210.9922
Fe6670416440.0610.9819
Zn626311110.0160.9591
Disclaimer/Publisher’s Note: The statements, opinions and data contained in all publications are solely those of the individual author(s) and contributor(s) and not of MDPI and/or the editor(s). MDPI and/or the editor(s) disclaim responsibility for any injury to people or property resulting from any ideas, methods, instructions or products referred to in the content.

