
Carbon Footprint of a Large Yellow Croaker Mariculture Models Based on Life-Cycle Assessment
Abstract
:1. Introduction
2. Material and Method
2.1. Research Objectives and Scope Definition
2.2. Study Area
2.3. Large Yellow Croaker Cage Mariculture
2.4. Division of System Boundaries and Functional Units in LCA
2.5. System Boundaries and Functional Units
2.6. Data Collection
2.7. Computational Process
2.8. Data Processing
3. Results
4. Discussion
4.1. Effect of Mariculture Model on Carbon Footprint
4.2. Impact of Emission Factors on Carbon Footprint
4.3. The Influence of System Boundary on Carbon Footprint
5. Conclusions
Author Contributions
Funding
Institutional Review Board Statement
Informed Consent Statement
Data Availability Statement
Acknowledgments
Conflicts of Interest
References
- FAO. The State of World Fisheries and Aquaculture 2016. Contributing to Food Security and Nutrition for All. 2016. Available online: https://www.fao.org/publications/sofia/2016/en/ (accessed on 12 March 2023).
- Bai, Z.; Schmidt-Traub, G.; Xu, J.; Liu, L.; Jin, X.; Ma, L. A food system revolution for China in the post-pandemic world. Resour. Environ. Sustain. 2020, 2, 100013. [Google Scholar] [CrossRef]
- Liu, O.R.; Molina, R.; Wilson, M.; Halpern, B.S. Global opportunities for mariculture development to promote human nutrition. PeerJ 2018, 6, e4733. [Google Scholar] [CrossRef] [Green Version]
- Jones, A.R.; Alleway, H.K.; McAfee, D.; Reis-Santos, P.; Theuerkauf, S.J.; Jones, R.C. Climate-friendly seafood: The potential for emissions reduction and carbon capture in marine aquaculture. BioScience 2022, 72, 123–143. [Google Scholar] [CrossRef]
- Mazzola, A.; Mirto, S.; La Rosa, T.; Fabiano, M.; Danovaro, R. Fish-farming effects on benthic community structure in coastal sediments: Analysis of meiofaunal recovery. ICES J. Mar. Sci. 2000, 57, 1454–1461. [Google Scholar] [CrossRef] [Green Version]
- Li, R.Y.M.; Wang, Q.; Zeng, L.; Chen, H. A study on public perceptions of carbon neutrality in China: Has the idea of ESG been encompassed? Front. Environ. Sci. 2023, 10, 1032. [Google Scholar] [CrossRef]
- Wackernagel, M.; Rees, W. Our Ecological Footprint: Reducing Human Impact on the Earth; New Society Publishers: Gabriola Island, BC Canada, 1998; Volume 9. [Google Scholar]
- Williams, A.S. Life Cycle Analysis: A Step by Step Approach; TR-040; Illinois Sustainable Technology Center TR Series: Champaign, IL, USA, 2009. [Google Scholar]
- Muthu, S.S. (Ed.) LCA Based Carbon Footprint Assessment; Springer: Berlin/Heidelberg, Germany, 2021. [Google Scholar]
- Muñoz, M.; Reul, A.; Guijarro, B.; Hidalgo, M. Carbon footprint, economic benefits and sustainable fishing: Lessons for the future from the Western Mediterranean. Sci. Total Environ. 2022, 865, 160783. [Google Scholar] [CrossRef] [PubMed]
- Liang, D.; Lu, H.; Guan, Y.; Feng, L. Drivers for decoupling carbon footprint pressure from economic growth in China’s provinces. Geogr. Sustain. 2022, 3, 258–267. [Google Scholar] [CrossRef]
- Wu, X.; Li, C.; Guo, J.; Wu, X.; Meng, J.; Chen, G. Extended carbon footprint and emission transfer of world regions: With both primary and intermediate inputs into account. Sci. Total Environ. 2021, 775, 145578. [Google Scholar] [CrossRef]
- Fan, W.; Huang, S.; Yu, Y.; Xu, Y.; Cheng, S. Decomposition and decoupling analysis of carbon footprint pressure in China’s cities. J. Clean. Prod. 2022, 372, 133792. [Google Scholar] [CrossRef]
- Gao, J.; Lin, M.J.; Ren, S.H. Economic analysis of negative externalities of large yellow croaker cage culture. Fish. Mod. 2010, 6, 62–65. [Google Scholar]
- Sovacool, B.K.; Brown, M.A. Twelve metropolitan carbon footprints: A preliminary comparative global assessment. Energy Policy 2010, 38, 4856–4869. [Google Scholar] [CrossRef]
- Liao, M.; Jia, J.; Han, G.; Wang, G.; Zhang, Z.; Wu, G. Reduced carbon footprint inequality in China: Evidence from latest household survey data. J. Clean. Prod. 2022, 384, 135342. [Google Scholar] [CrossRef]
- He, B.; Liu, Y.; Zeng, L.; Wang, S.; Zhang, D.; Yu, Q. Product carbon footprint across sustainable supply chain. J. Clean. Prod. 2019, 241, 118320. [Google Scholar] [CrossRef]
- Huang, W.; Wu, F.; Han, W.; Li, Q.; Han, Y.; Wang, G.; Wang, Z. Carbon footprint of cotton production in China: Composition, spatiotemporal changes and driving factors. Sci. Total Environ. 2022, 821, 153407. [Google Scholar] [CrossRef]
- Brentrup, F.; Küsters, J.; Kuhlmann, H.; Lammel, J. Environmental impact assessment of agricultural production systems using the life cycle assessment methodology: I. Theoretical concept of a LCA method tailored to crop production. Eur. J. Agron. 2004, 20, 247–264. [Google Scholar] [CrossRef]
- Brentrup, F.; Küsters, J.; Lammel, J.; Barraclough, P.; Kuhlmann, H. Environmental impact assessment of agricultural production systems using the life cycle assessment (LCA) methodology II. The application to N fertilizer use in winter wheat production systems. Eur. J. Agron. 2004, 20, 265–279. [Google Scholar] [CrossRef]
- Chang, C.C.; Chang, K.C.; Lin, W.C.; Wu, M.H. Carbon footprint analysis in the aquaculture industry: Assessment of an ecological shrimp farm. J. Clean. Prod. 2017, 168, 1101–1107. [Google Scholar] [CrossRef]
- Hou, H.; Zhang, Y.; Ma, Z.; Wang, X.; Su, P.; Wang, H.; Liu, Y. Life cycle assessment of tiger puffer (Takifugu rubripes) farming: A case study in Dalian, China. Sci. Total Environ. 2022, 823, 153522. [Google Scholar] [CrossRef]
- Perez-Lopez, P.; Ledda, F.D.; Bisio, A.; Feijoo, G.; Perino, E.; Pronzato, R.; Moreira, M.T. Life cycle assessment of in situ mariculture in the Mediterr-anean Sea for the production of bioactive compounds from the sponge Sarcotragus spinosulus. J. Clean. Prod. 2017, 142, 4356–4368. [Google Scholar] [CrossRef]
- Bohnes, F.A.; Laurent, A. LCA of aquaculture systems: Methodological issues and potential improvements. Int. J. Life Cycle Assess. 2019, 24, 324–337. [Google Scholar] [CrossRef] [Green Version]
- Wang, L.; Wang, Y.; Du, H.; Zuo, J.; Li, R.Y.M.; Zhou, Z.; Bi, F.; Garvlehn, M.P. A comparative life-cycle assessment of hydro-, nuclear and wind power: A China study. Appl. Energy 2019, 249, 37–45. [Google Scholar] [CrossRef]
- Konstantinidis, E.; Perdikaris, C.; Gouva, E.; Nathanalides, C.; Bartzanas, T.; Anestis, V.; Skoufos, I. Assessing environmental impacts of sea bass cage farms in Greece and Albania using life cycle assessment. Int. J. Environ. Res. 2020, 14, 693–704. [Google Scholar] [CrossRef]
- Henriksson, P.J.; Dickson, M.; Allah, A.N.; Al-Kenawy, D.; Phillips, M. Benchmarking the environmental performance of best management practice and genetic improvements in Egyptian aquaculture using life cycle assessment. Aquaculture 2017, 468, 53–59. [Google Scholar] [CrossRef]
- Philis, G.; Ziegler, F.; Gansel, L.C.; Jansen, M.D.; Gracey, E.O.; Stene, A. Comparing life cycle assessment (LCA) of salmonid aquaculture production systems: Status and perspectives. Sustainability 2019, 11, 2517. [Google Scholar] [CrossRef] [Green Version]
- Ziegler, F.; Winther, U.; Hognes, E.S.; Emanuelsson, A.; Sund, V.; Ellingsen, H. The carbon footprint of Norwegian seafood products on the global seafood market. J. Ind. Ecol. 2013, 17, 103–116. [Google Scholar] [CrossRef]
- Ayer, N.; Martin, S.; Dwyer, R.L.; Laurin, L. Environmental performance of copper-alloy net-pens: Life cycle assessment of Atlantic salmon grow-out in copper-alloy and nylon net-pens. Aquaculture 2016, 453, 93–103. [Google Scholar] [CrossRef]
- Chen, X.; Samson, E.; Tocqueville, A.; Aubin, J. Environmental assessment of trout farming in France by life cycle assessment: Using bootstrapped principal component analysis to better define system classification. J. Clean. Prod. 2015, 87, 87–95. [Google Scholar] [CrossRef]
- Silvenius, F.; Grönroos, J.; Kankainen, M.; Kurppa, S.; Mäkinen, T.; Vielma, J. Impact of feed raw material to climate and eutrophication impacts of Finnish rainbow trout farming and comparisons on climate impact and eutrophication between farmed and wild fish. J. Clean. Prod. 2017, 164, 1467–1473. [Google Scholar] [CrossRef]
- Nhu, T.T.; Le, Q.H.; ter Heide, P.; Bosma, R.; Sorgeloos, P.; Dewulf, J.; Schaubroeck, T. Inferred equations for predicting cumulative exergy extraction throughout cradle-to-gate life cycles of Pangasius feeds and intensive Pangasius grow-out farms in Vietnam. Resour. Conserv. Recycl. 2016, 115, 42–49. [Google Scholar] [CrossRef]
- Mungkung, R.; Aubin, J.; Prihadi, T.H.; Slembrouck, J.; van der Werf, H.M.; Legendre, M. Life cycle assessment for environmentally sustainable aquaculture management: A case study of combined aquaculture systems for carp and tilapia. J. Clean. Prod. 2013, 57, 249–256. [Google Scholar] [CrossRef]
- Santos, A.A.O.; Aubin, J.; Corson, M.S.; Valenti, W.C.; Camargo, A.F.M. Comparing environmental impacts of native and introduced freshwater prawn farming in Brazil and the influence of better effluent management using LCA. Aquaculture 2015, 444, 151–159. [Google Scholar] [CrossRef]
- Avadí, A.; Vázquez-Rowe, I.; Symeonidis, A.; Moreno-Ruiz, E. First series of seafood datasets in ecoinvent: Setting the pace for future development. Int. J. Life Cycle Assess. 2020, 25, 1333–1342. [Google Scholar] [CrossRef]
- Le Feon, S.; Thévenot, A.; Maillard, F.; Macombe, C.; Forteau, L.; Aubin, J. Life Cycle Assessment of fish fed with insect meal: Case study of mealworm inclusion in trout feed, in France. Aquaculture 2019, 500, 82–91. [Google Scholar] [CrossRef]
- Basto-Silva, C.; Guerreiro, I.; Oliva-Teles, A.; Neto, B. Life cycle assessment of diets for gilthead seabream (Sparus aurata) with different protein/carbohydrate ratios and fishmeal or plant feedstuffs as main protein sources. Int. J. Life Cycle Assess. 2019, 24, 2023–2034. [Google Scholar] [CrossRef]
- García García, B.; Rosique Jiménez, C.; Aguado-Giménez, F.; García García, J. Life cycle assessment of seabass (Dicentrarchus labrax) produced in offshore fish farms: Variability and multiple regression analysis. Sustainability 2019, 11, 3523. [Google Scholar] [CrossRef] [Green Version]
- Lozano, S.; Iribarren, D.; Moreira, M.T.; Feijoo, G. Environmental impact efficiency in mussel cultivation. Resour. Conserv. Recycl. 2010, 54, 1269–1277. [Google Scholar] [CrossRef]
- Ren, C.; Wang, Z.; Zhang, Y.; Zhang, B.; Chen, L.; Xi, Y.; Song, K. Rapid expansion of coastal aquaculture ponds in China from Landsat observations du-ring 1984–2016. Int. J. Appl. Earth Obs. Geoinf. 2019, 82, 101902. [Google Scholar]
- Xu, C.; Su, G.; Zhao, K.; Xu, X.; Li, Z.; Hu, Q.; Xu, J. Current status of greenhouse gas emissions from aquaculture in China. Water Biol. Secur. 2022, 100041. [Google Scholar] [CrossRef]
- Costello, C.; Cao, L.; Gelcich, S.; Cisneros-Mata, M.Á.; Free, C.M.; Froehlich, H.E.; Golden, C.D.; Ishimura, G.; Maier, J.; Macadam-Somer, I.; et al. The future of food from the sea. Nature 2020, 588, 95–100. [Google Scholar] [CrossRef]
- Zhang, S.; Zhao, X.; Feng, K.; Hu, Y.; Tillotson, M.R.; Yang, L. Do mariculture products offer better environment and nutritional choices compared to land-based protein products in China? J. Clean. Prod. 2022, 372, 133697. [Google Scholar] [CrossRef]
- Yang, L.; Hao, X.; Shen, C.; An, D. Assessment of carbon sink capacity and potential of marine fisheries in China under the carbon neutrality target. Resour. Sci. 2022, 44, 716–729. [Google Scholar] [CrossRef]
- Ahmed, N.; Thompson, S. The blue dimensions of aquaculture: A global synthesis. Sci. Total Environ. 2019, 652, 851–861. [Google Scholar] [CrossRef] [PubMed]
- Bao-Tong, H.U. Cage culture development and its role in aquaculture in China. Aquac. Fish. Manag. 1994, 24, 305–310. [Google Scholar] [CrossRef]
- De Silva, S.S.; Phillips, M.J. A review of cage aquaculture: Asia (excluding China). In FAO Fisheries Technical Paper; FAO: Rome, Italy, 2007; Volume 498, p. 21. [Google Scholar]
- Tacon, A.G.; Halwart, M. Cage aquaculture: A global overview. In FAO Fisheries Technical Paper; FAO: Rome, Italy, 2007; Volume 498, p. 3. [Google Scholar]
- Mo, W.Y.; Man, Y.B.; Wong, M.H. Use of food waste, fish waste and food processing waste for China’s aquaculture industry: Needs and challenge. Sci. Total Environ. 2018, 613, 635–643. [Google Scholar] [CrossRef]
- Cheng, S.Q.; Shi, J.G.; Yuan, R.; Li, S.H.; Chen, X.X.; Xiao, J.; Sun, B. Current situation and future development direction of seawater cage industry in China. Fish. Sci. Technol. Inf. 2022, 6, 369–376+380. [Google Scholar]
- Yu, J.X.; Xu, L.J. The 2020 National Fishery Economy Statistical Bulletin was released. Fish. Sci. Technol. Inf. 2021, 5, 297. [Google Scholar]
- Koričan, M.; Perčić, M.; Vladimir, N.; Soldo, V.; Jovanović, I. Environmental and economic assessment of mariculture systems using a high share of renewable energy sources. J. Clean. Prod. 2022, 333, 130072. [Google Scholar] [CrossRef]
- Di, X.; Nie, Z.; Yuan, B.; Zuo, T. Life cycle inventory for electricity generation in China. Int. J. Life Cycle Assess. 2007, 12, 217–224. [Google Scholar] [CrossRef]
- Hu, Z.Y.; Peiqiang, T.; Diming, L.; Yaoqing, D. Assessment of life cycle energy consumption and emissions for several kinds of feedstock based biodiesel. Trans. CSAE 2006, 11, 141–146. [Google Scholar]
- Li, M. Life Cycle Asscement of Polythene Plastic Production and Wastes Polythene Plastic Reclamation Technology; Harbin Institute of Technology: Harbin, China, 2008; Available online: https://kns.cnki.net/KCMS/detail/detail.aspx?dbname=CMFD2011&filename=2009290732.nh (accessed on 12 March 2023).
- Xiao, R.; Zhang, Y.; Liu, X.; Yuan, Z. A life-cycle assessment of household refrigerators in China. J. Clean. Prod. 2015, 95, 301–310. [Google Scholar] [CrossRef]
- Bolin, C.A.; Smith, S.T. Life cycle assessment of borate-treated lumber with comparison to galvanized steel framing. J. Clean. Prod. 2011, 19, 630–639. [Google Scholar] [CrossRef]
- Shen, W.; Cao, L.; Li, Q.; Zhang, W.; Wang, G.; Li, C. Quantifying CO2 emissions from China’s cement industry. Renew. Sustain. Energy Rev. 2015, 50, 1004–1012. [Google Scholar] [CrossRef]
- Nakano, K.; Ando, K.; Takigawa, M.; Hattori, N. Life cycle assessment of wood-based boards produced in Japan and impact of formaldehyde emissions during the use stage. Int. J. Life Cycle Assess. 2018, 23, 957–969. [Google Scholar] [CrossRef]
- Duan, Z.; Huang, Q.; Zhang, Q. Life cycle assessment of mass timber construction: A review. Build. Environ. 2022, 221, 109320. [Google Scholar] [CrossRef]
- Ribeiro, F.B.; Do Nascimento, F.A.C.; da Silva, M.A.V. Environ-mental performance analysis of railway infrastructure using life cycle assessment: Selecting pavement projects based on global warming potential impacts. J. Clean. Prod. 2022, 365, 132558. [Google Scholar] [CrossRef]
- Pernet, F.; Browman, H.I. The future is now: Marine aquaculture in the anthropocene. ICES J. Mar. Sci. 2021, 78, 315–322. [Google Scholar] [CrossRef]
- Xie, Z.; Song, W.; Xiong, Y. Green and efficient cage culture technology for large yellow croaker. Chin. Aquac. 2021, 9, 68–72. [Google Scholar]
- Cruickshank, G.J.; Thomson, B.C.; Muir, P.D. Modelling Management Change on Production Efficiency and Methane Output within a Sheep Flock; Ministry of Agriculture and Forestry: Wellington, New Zealand, 2008. [Google Scholar]
- Xu, C.; Su, G.; Zhao, K.; Wang, H.; Xu, X.; Li, Z.; Xu, J. Assessment of greenhouse gases emissions and intensity from Chinese marine aquaculture in the past three decades. J. Environ. Manag. 2023, 329, 117025. [Google Scholar] [CrossRef]
- Soares, D.C.; Henry-Silva, G.G. Emission and absorption of greenhouse gases generated from marine shrimp production (Litopeneaus vannamei) in high salinity. J. Clean. Prod. 2019, 218, 367–376. [Google Scholar] [CrossRef]
- Cellura, M.; Cusenza, M.A.; Longo, S. Energy-related GHG emissions balances: IPCC versus LCA. Sci. Total Environ. 2018, 628, 1328–1339. [Google Scholar] [CrossRef] [PubMed]
- Chen, X.; Corson, M.S. Influence of emission-factor uncertainty and farm-characteristic variability in LCA estimates of environmental impacts of French dairy farms. J. Clean. Prod. 2014, 81, 150–157. [Google Scholar] [CrossRef]
- Henriksson, P.J.; Guinée, J.B.; Kleijn, R.; de Snoo, G.R. Life cycle assessment of aquaculture systems—A review of methodologies. Int. J. Life Cycle Assess. 2012, 17, 304–313. [Google Scholar] [CrossRef] [PubMed] [Green Version]
- Roy, P.; Nei, D.; Orikasa, T.; Xu, Q.; Okadome, H.; Nakamura, N.; Shiina, T. A review of life cycle assessment (LCA) on some food products. J. Food Eng. 2009, 90, 1–10. [Google Scholar] [CrossRef]
- Selin, N.E. Carbon Footprint. Encyclopedia Britannica. Available online: https://www.britannica.com/science/carbon-footprint. (accessed on 14 September 2022).


| Material Input | DWWWRC | TPC |
|---|---|---|
| Diesel/kg | 46.21 | 310.69 |
| Electricity/(kW·h) | 13.53 | 17.41 |
| PE/kg | 64.45 | 72.61 |
| Cement/kg | 1.80 | 6.31 |
| Compound feed/kg | 336 | 1736 |
| Fresh feed/kg | 3364 | 6844 |
| PA/kg | 0.079 | 8.45 |
| Timber/m3 | 0 | 13.19 |
| Refrigerator/unit | 1 | 1 |
| Classification | PE | Cement | Timber | PA | Diesel | Refrigerator |
|---|---|---|---|---|---|---|
| 1T | 1T | 1 m3 | 1T (37%) | 1 kg | 1 | |
| CO2/kg | 9.11 × 101 | 6.98 × 10² | 1.45 × 10² | 1.69 × 10² | 6.07 × 10⁻¹ | 2.66 × 10³ |
| CO/kg | 2.64 × 100 | 1.26 × 10⁻¹ | 1.36 × 10⁻¹ | 9.77 × 100 | 3.88 × 10⁻⁴ | 1.01 × 100 |
| CH4/kg | 0.00 × 100 | 8.97 × 10⁻¹ | 1.36 × 101 | 3.78 × 100 | 1.18 × 10⁻⁴ | 1.15 × 101 |
| NOx/kg | 1.03 × 100 | 1.38 × 100 | 3.65 × 10⁻¹ | 0.00 × 100 | 6.71 × 10⁻¹ | 7.19 × 100 |
| Material Name | Weight (kg) | Distance (km) | Oil Consumption (kg) | |||
|---|---|---|---|---|---|---|
| TPC | DWWWRC | TPC | DWWWRC | TPC | DWWWRC | |
| Timber | 6.20 × 10³ | 0 | 8.94 × 101 | 0 | 9.26 × 101 | 0 |
| Compound feed | 1.74 × 10³ | 3.36 × 10² | 7.29 × 10² | 7.29 × 10² | 2.12 × 10² | 4.09 × 101 |
| Cement | 6.30 × 100 | 1.80 × 100 | 2.30 × 10² | 2.30 × 10² | 2.42 × 10⁻¹ | 6.91 × 10⁻² |
| Refrigerator | 5.00 × 101 | 5.00 × 101 | 2.30 × 10² | 2.30 × 10² | 1.92 × 100 | 1.92 × 100 |
| PE | 7.26 × 101 | 6.45 × 101 | 4.11 × 10² | 4.11 × 10² | 4.98 × 100 | 4.43 × 100 |
| PA | 8.48 × 100 | 7.86 × 10⁻² | 2.88 × 10² | 2.88 × 10² | 4.08 × 10⁻¹ | 3.78 × 10⁻³ |
| Name | Unit | DWWWRC | TPC |
|---|---|---|---|
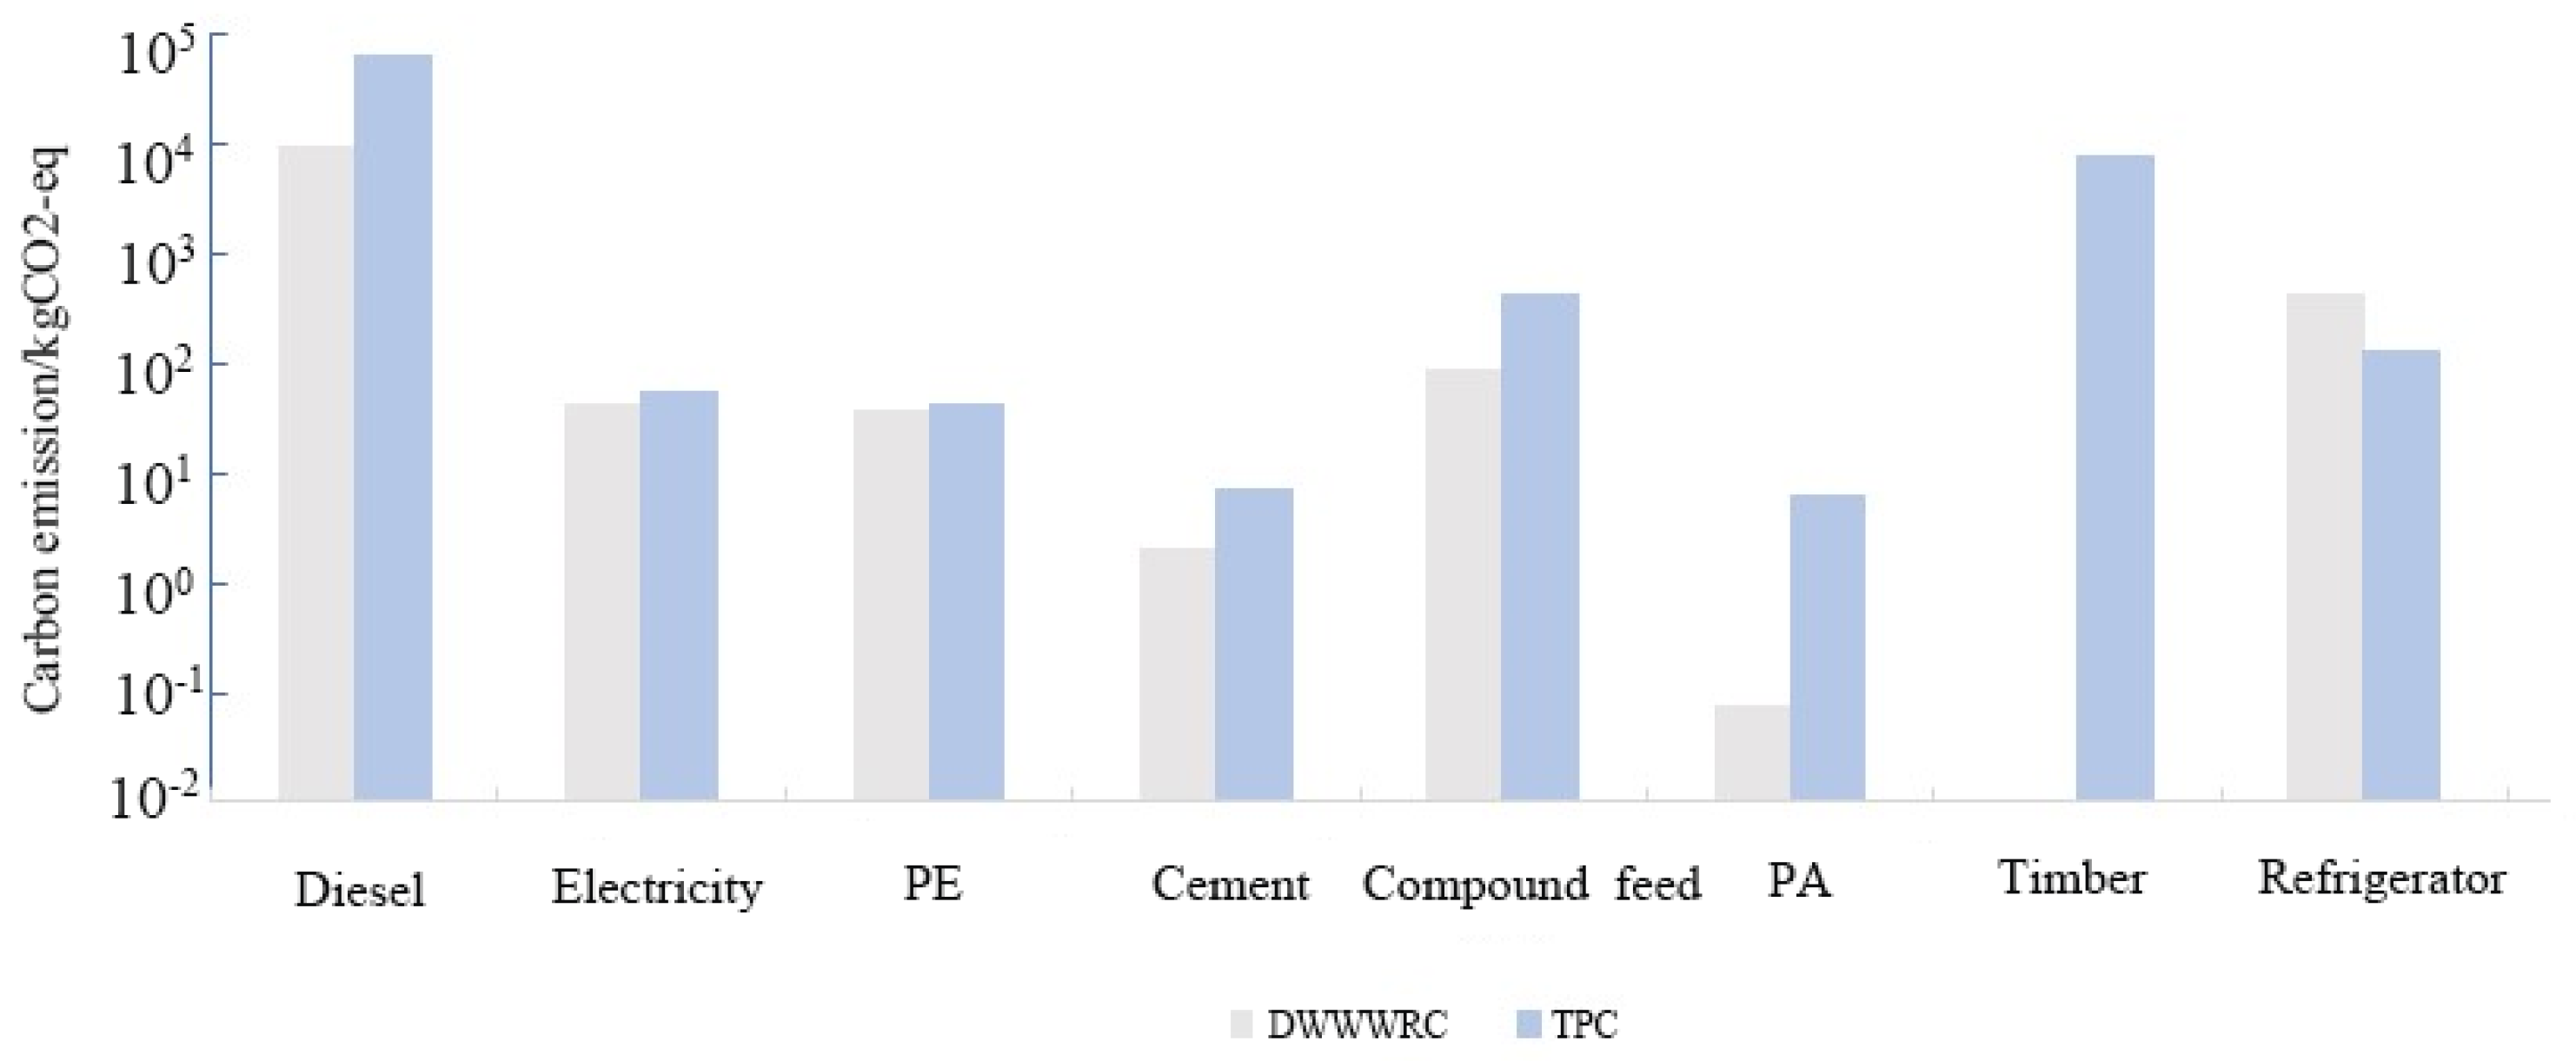
| Diesel | kgCO2-eq | 9.95 × 10³ | 6.69 × 10⁴ |
| Electricity | kgCO2-eq | 4.34 × 101 | 5.56 × 101 |
| PE | kgCO2-eq | 3.89 × 101 | 4.38 × 101 |
| Cement | kgCO2-eq | 2.09 × 100 | 7.32 × 100 |
| Compound feed | kgCO2-eq | 8.74 × 101 | 4.51 × 10² |
| PA | kgCO2-eq | 7.83 × 10⁻² | 6.46 × 100 |
| Timber | kgCO2-eq | 0.00 × 100 | 7.93 × 10³ |
| Refrigerator | kgCO2-eq | 4.33 × 10² | 1.37 × 10² |
| Total CO2 emissions | kgCO2-eq | 1.055 × 10⁴ | 7.553 × 10⁴ |
| Process | DWWWRC | TPC | ||
|---|---|---|---|---|
| Material production | 8.44 × 101 | 0.80% | 8.04 × 10³ | 10.64% |
| Breeding process | 5.20 × 10² | 4.90% | 5.94 × 10² | 0.79% |
| Material transport | 9.95 × 10³ | 94.30% | 6.69 × 10⁴ | 88.57% |
Disclaimer/Publisher’s Note: The statements, opinions and data contained in all publications are solely those of the individual author(s) and contributor(s) and not of MDPI and/or the editor(s). MDPI and/or the editor(s) disclaim responsibility for any injury to people or property resulting from any ideas, methods, instructions or products referred to in the content. |
© 2023 by the authors. Licensee MDPI, Basel, Switzerland. This article is an open access article distributed under the terms and conditions of the Creative Commons Attribution (CC BY) license (https://creativecommons.org/licenses/by/4.0/).
Share and Cite
Liu, J.; Gui, F.; Zhou, Q.; Cai, H.; Xu, K.; Zhao, S. Carbon Footprint of a Large Yellow Croaker Mariculture Models Based on Life-Cycle Assessment. Sustainability 2023, 15, 6658. https://doi.org/10.3390/su15086658
Liu J, Gui F, Zhou Q, Cai H, Xu K, Zhao S. Carbon Footprint of a Large Yellow Croaker Mariculture Models Based on Life-Cycle Assessment. Sustainability. 2023; 15(8):6658. https://doi.org/10.3390/su15086658
Chicago/Turabian StyleLiu, Jingyi, Feng Gui, Qian Zhou, Huiwen Cai, Kaida Xu, and Sheng Zhao. 2023. "Carbon Footprint of a Large Yellow Croaker Mariculture Models Based on Life-Cycle Assessment" Sustainability 15, no. 8: 6658. https://doi.org/10.3390/su15086658