Article

Passengers’ Perception of Satisfaction and Its Relationship with Travel Experience Attributes: Results from an Australian Survey

1
School of Engineering, RMIT University, Melbourne 3000, Australia
2
School of Business IT and Logistics, RMIT University, Melbourne 3000, Australia
*
Author to whom correspondence should be addressed.
Sustainability 2023, 15(8), 6645; https://doi.org/10.3390/su15086645
Submission received: 31 January 2023 / Revised: 4 April 2023 / Accepted: 13 April 2023 / Published: 14 April 2023
(This article belongs to the Section Sustainable Transportation)

Abstract

:
Rail, one of the most sustainable modes of transport, is vital in carrying mass passengers in many urban cities. Passengers’ satisfaction with railway services is mostly discussed in the context of service quality in the literature. However, limited studies have considered other attributes that may influence passengers’ satisfaction, such as their travel experience and issues encountered. This study aims to systematically model passengers’ satisfaction and its relationship with travel experience attributes. This paper makes a theoretical contribution by proposing a conceptual model that evaluates the overall satisfaction of passengers through four attribute groups, including traveller attributes, trip attributes, service attributes, and other attributes. The model is tested with the 429 valid responses collected from a passenger survey targeting Metro train users in Melbourne, Australia. Result shows that the best-fitted model is produced only when all attribute groups are considered together, for which 60% of the variation in overall satisfaction is accountable. It is found that all attribute groups have at least one variable included in the final model, and the service attribute group has the greatest influence. The best model has nine significant variables, with eight having positive associations to the overall satisfaction and one variable (GroupTravel) having a negative association. This finding suggests that consideration of other attributes is also important besides the service attributes, and hence advances our scientific understanding of train passengers’ satisfaction with train services. The public transport sector and the operators can use this knowledge to improve service and increase passenger satisfaction.

1. Introduction

In many modern cities, a great deal of effort has been made to develop and improve the public transport services so that it can better cope with the increasing travel demand and enhance livability. In Australia, the fast-growing population in major cities has brought many new challenges to public transport operations. Melbourne city offers the public various modes of public transport such as Metro trains, trams, and buses. The metropolitan rail network offers an environment-friendly way to move people with excellent effectiveness and efficiency. According to the patronage data, Melbourne Metro has a significantly higher customer base compared to other forms of public transportation, such as trams and buses [1]. As the service operator, Metro Trains Melbourne (Metro for short) is responsible for rail network operations in Melbourne. The network covers 998 kilometres of track, 15 lines, and 222 stations, with over 220 trains servicing 450,000 commuters daily [2]. Providing a good service level and maintaining a high passenger satisfaction rate is the key to attracting new train users while retaining the existing ones. Public Transport Victoria (PTV for short) is committed to delivering quality customer service and helping to improve the travel experience [3].
Customer feedback and satisfaction are taken seriously in any organisation that provides product or service to the public. In the context of public transport, satisfaction is a common measure to evaluate the degree to which a passenger is satisfied with the transport services. It has become increasingly important to understand and measure passenger satisfaction. By understanding what factors contribute to passenger satisfaction, train service providers can focus on improving their services, keeping existing users, and attracting new users.
Researchers have made a great deal of effort to identify the factors influencing passenger satisfaction. Some literature has explored how service quality affects satisfaction [4,5,6,7,8,9,10,11,12,13], while other studies have also examined the impact of demographic variables such as gender and age group [6,7,14]. However, there may be additional factors that contribute to passenger satisfaction yet to be identified. One such factor is the nature of the trips, which can affect the travel experience and, in turn, influence satisfaction. This includes factors such as travel time, waiting time, travel in group, and carrying items onboard. Additionally, travellers may encounter different issues while travelling by train and may have different expectations, which can also affect the level of satisfaction. Therefore, there is a need to include an “other attributes” group to capture this additional information.
In short, existing literature has mainly explored the relationship between passengers’ satisfaction with service attributes. Few studies have considered specific trip attributes that may influence passengers’ satisfaction, such as their trip characteristics, common issues encountered, and main expectations. To the best of our knowledge, no previous research has systematically developed and tested a conceptual model for passenger satisfaction by considering traveller attributes, trip attributes, service attributes, and other attributes (e.g., passengers’ issues and expectations). This study explores this important knowledge gap by systematically modelling train passengers’ satisfaction and its relationship with travel experience attributes. Specifically, this study develops and tests a conceptual model that evaluates the overall satisfaction of passengers through four attribute groups, including traveller attributes, trip attributes, service attributes, and other attributes (e.g., issues and passengers’ expectations).

2. Literature Review

The level of services that the train operator aims to provide to the public could directly or indirectly influence every train user’s satisfaction. According to Beirão and Cabral [15], to increase the use of public transport, service should be designed and performed to suit the level of service required by the customers.

2.1. Customer Satisfaction and Service Quality

This section discusses various literature related to customer satisfaction and service quality in the context of public transportation. According to Peterson and Wilson [16], customer satisfaction is one of the most widely studied concepts in marketing. In the field of public transportation, customer satisfaction is defined as “the overall level of attainment” of a passengers’ expectations [6]. Service quality can be measured with different indicators and described in different aspects. Friman and Fellesson studied the relationship between overall satisfaction and three service performance measures, including frequency, seat, and travel time [17]. More factors has been examined in recent studies. Service quality is measured by 19 variables, including information provision, network coverage, ticketing, service frequency, dealing with complaints, facility and vehicle cleanliness, vehicle safety, safety at terminal and stop, onboard information, and more [18].
Improvements in service quality can make public transport services more attractive, thus leading to increased patronage. Many studies support that there is a strong link between service quality and customer satisfaction [9,18]. It is worth pointing out that the actual service attributes may not always be reflected objectively in the mind of the customers. We need to understand how the service aspects are seen from the perspective of the train passengers. To measure the perceptions of service quality, a SERVQUAL model was developed by Parasuraman using a multiple-item scale for measuring [19]. This SERVQUAL model soon became widely accepted and adopted in research in many fields, including public transport. For instance, the SERVQUAL model was adapted to the public transport field to assess the relationship between service quality and customer satisfaction with bus services in Canada [10].

2.2. Public Transport Customer Satisfaction Measures

In general, customers rate their satisfaction on qualitative scales. The largest published rail passenger satisfaction survey is the National Rail Passenger Survey (NRPS), which is conducted twice a year in the UK [11]. It uses six levels, including very pleased, pleased, mediocre, unpleased, very unpleased, and unknown, to evaluate customer satisfaction. The survey questionnaire examines passengers’ opinions about different aspects of rail trips, such as safety, punctuality/reliability, level of crowding, value for money, etc.
While investigating public transport satisfaction in Australia, it is found that the satisfaction measurements are not consistently used by the major metropolitan rail operators across the nation. In Western Australia, the overall satisfaction with the train service is measured through a five-point scale [20]. Another indicator used to measure customer experience is the Net Promoter Score (NPS). This method involves a single question asking the survey participants to rate the likelihood of recommending a service or product on a scale of ten. Participants who rate 0–6, 7 & 8, and 9 & 10 are classified as detractors, passives, and promoters, respectively. The NPS index is derived by subtracting the percentage of detractors from the percentage of promoters [21]. In New South Wales, the overall satisfaction with the train service is measured through a seven-point scale [22]. In Victoria, the overall satisfaction with metropolitan train services is measured by the customer satisfaction index, which is the percentage of satisfied customers. Prior to 2009, satisfaction was rated on a six-point scale. Since April 2009, satisfaction has been rated on a scale of ten. Key service aspects/indicators include staff service, information, service delivery, value for money, authorised officers, stations/stops, comfort, safety, Myki ticketing, and likelihood to recommend [23].

2.3. Customer Satisfaction Models

One of the common methods to model customer satisfaction is through regression. As seen in many literatures, multinomial regression is widely used to examine the relationship between service attributes and customer satisfaction [24,25,26,27,28]. In recent years, a case study about bus service satisfaction in Madrid also used multiple regression to reveal the importance of service attributes [8]. In another study conducted in Jakarta, Indonesia, public transport passengers’ satisfaction was modelled by the multiple regression method. Out of the four factors tested, it was found that image, perceived value, and perceived usefulness are significant, but perceived ease of use is not significant to the satisfaction [29].
Another commonly used method to model customer satisfaction is ordinal logistic regression. This method has been applied in many industries [30,31,32] as well as in the field of public transport [5,8,33,34]. Multinomial logit modelling is another common method [4,35]. Factor analysis, path-based model, and structural equation model (SEM) were also used to identify factors and analyse the causal relationship between satisfaction and factors [36,37,38,39].
In recent years, new approaches have been introduced to study passenger satisfaction. Based on a case study conducted in Queensland, Australia, rail users’ satisfaction was modelled using Bayesian Network [40]. Although the application of this method in assessing passenger satisfaction is novel, the model structure seems rather complex. Another study investigated the public transport services in the Swedish city of Karlstad. This study applied the fuzzy set Qualitative Comparative Analysis (fsQCA) method. The authors claimed that travel satisfaction is a multidimensional and complex phenomenon where satisfaction with multiple service quality attributes interplay and jointly contribute to high overall travel satisfaction [41].
In summary, there are many modelling approaches that can be used to study passenger satisfaction. Some might be relatively new and advanced but are often limited to a specific case or data set. Among all the methods we examined, linear regression seems to be a simple yet powerful way of modelling customer satisfaction.

3. Methodology

One of the main objectives of this research is to reveal the relationship between train passengers’ overall satisfaction and the attributes of interest. A clear understanding of passengers’ travel behavior, needs, and expectations helps address the research objectives. The research framework and hypotheses are proposed at the beginning of this section, followed by a detailed discussion of data collection and analysis methods.

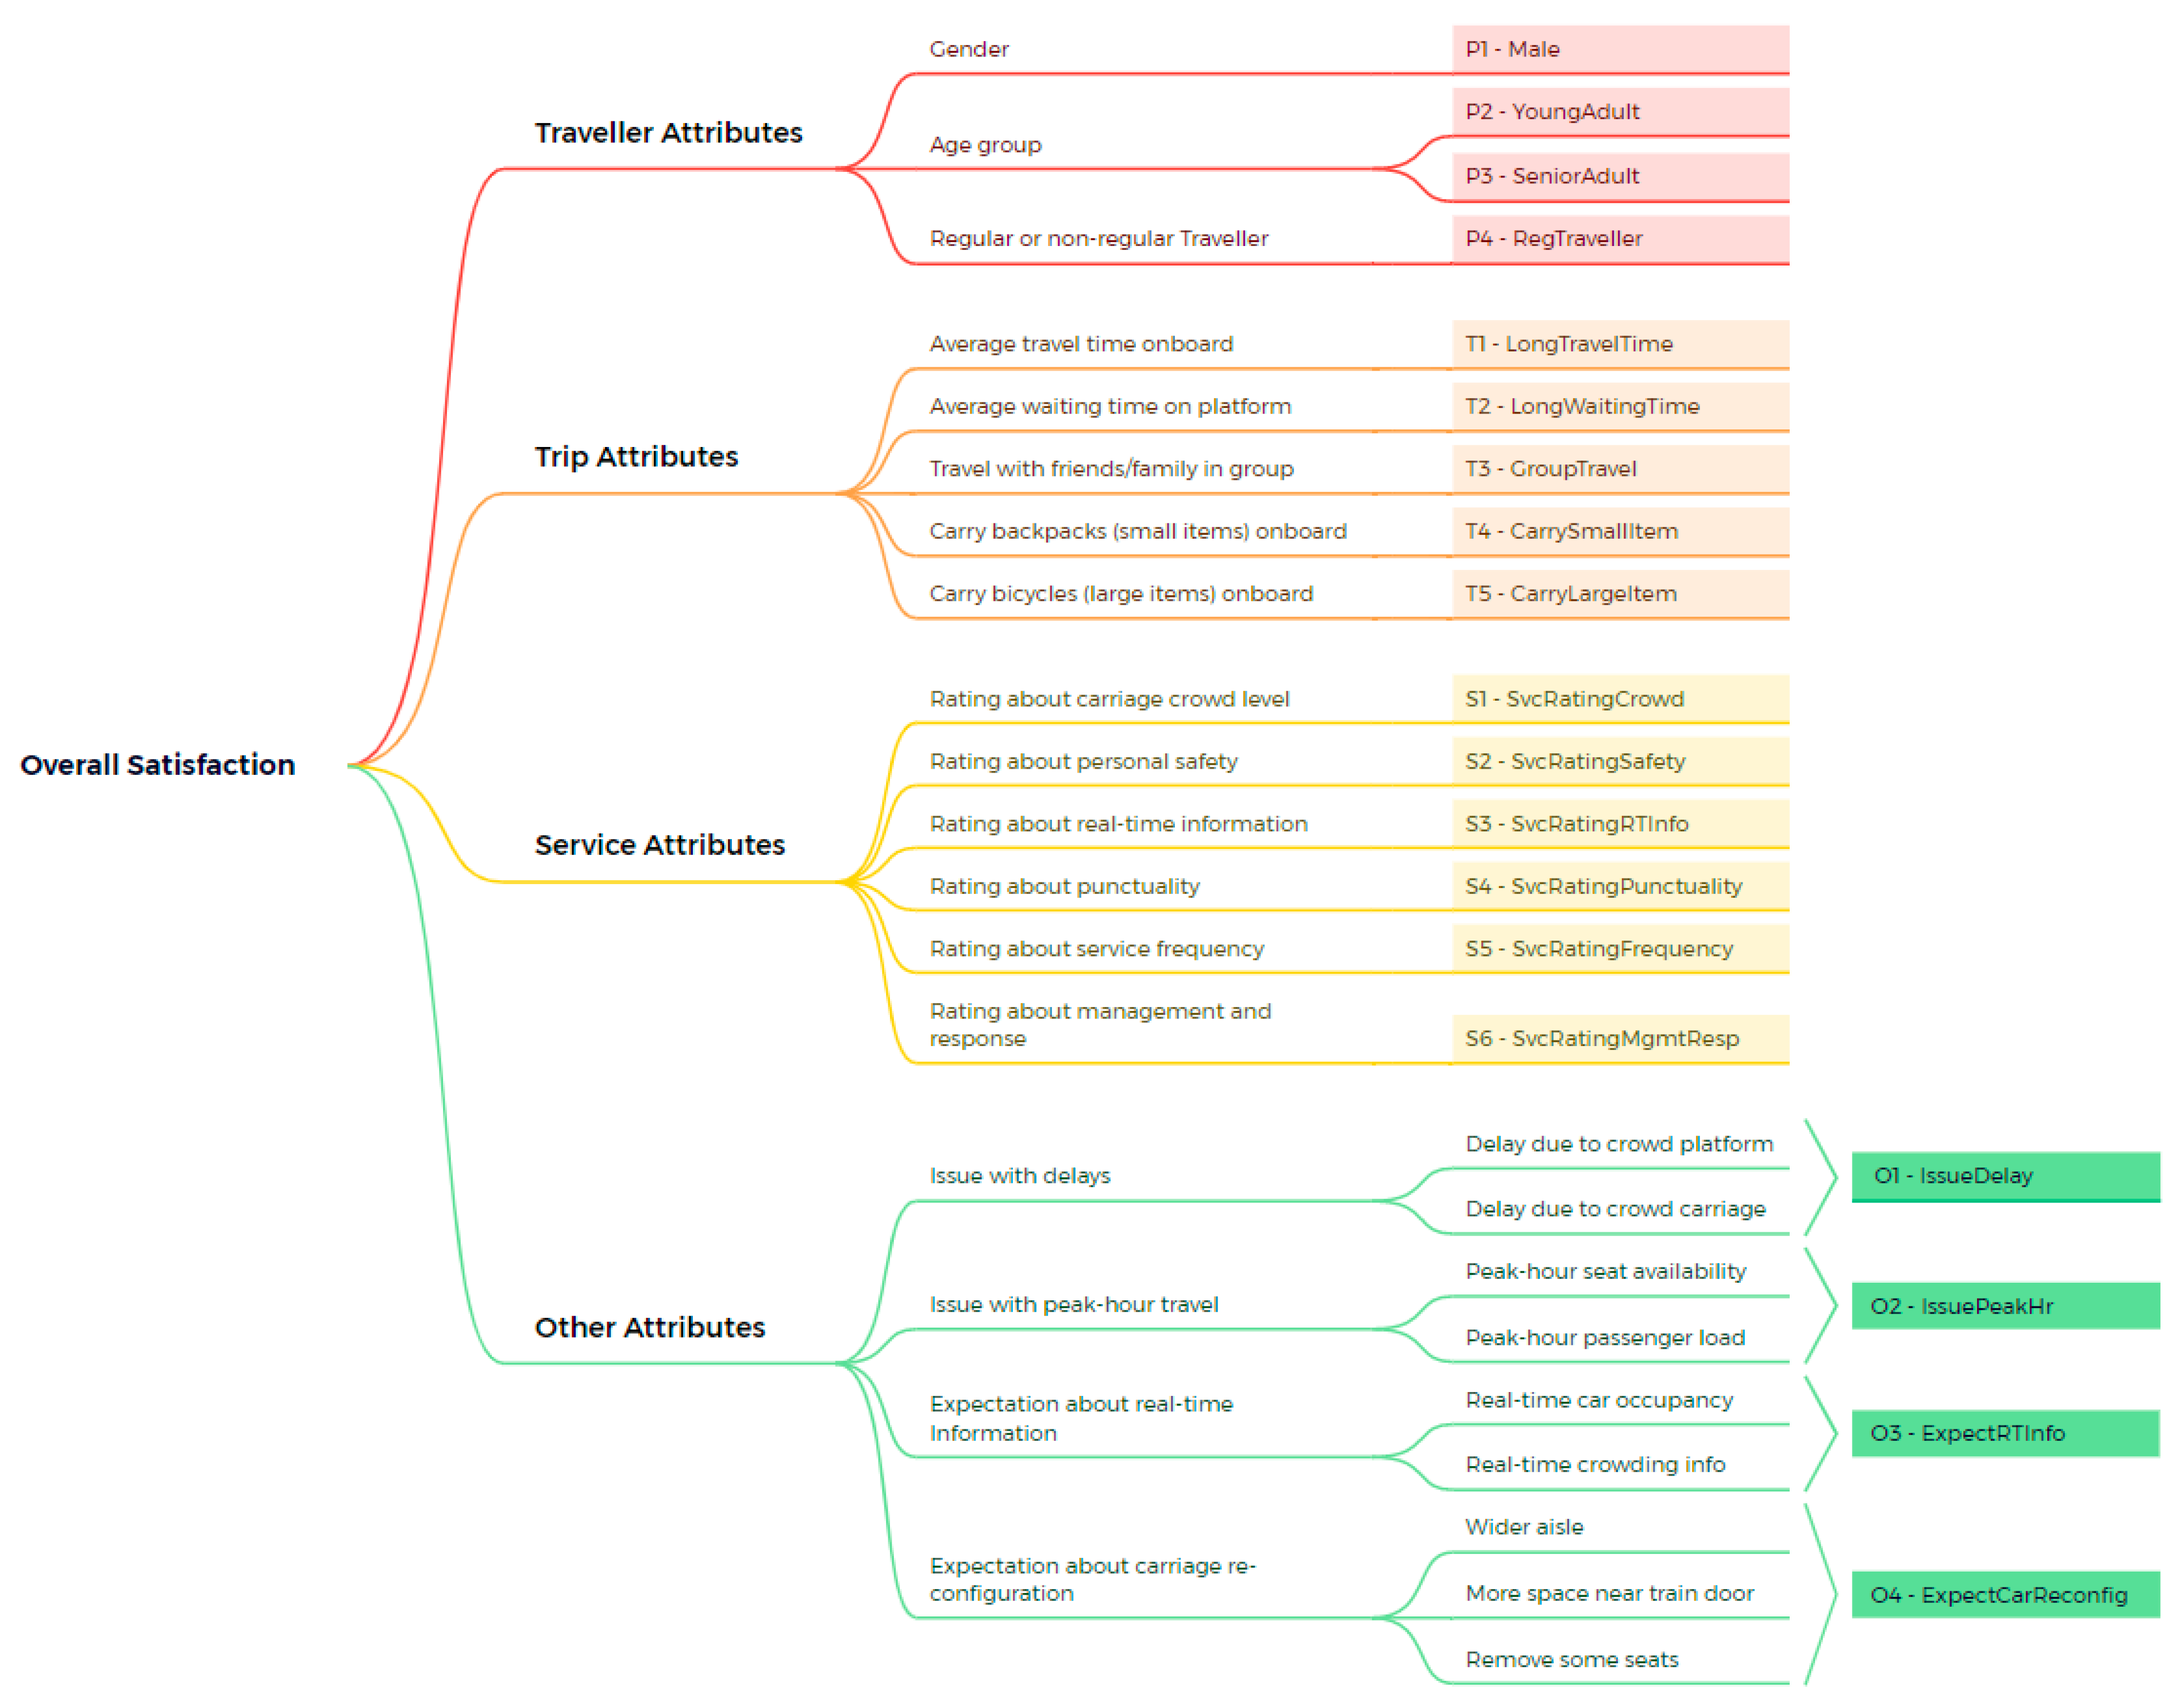
3.1. Research Framework and Hypotheses

The literature shows that there are various ways of grouping variables and attributes when studying customer satisfaction. To streamline the process, the overall conceptual framework of this study is presented in Figure 1. Four attributes, including traveller attributes, trip attributes, service attributes, and other attributes, are proposed in the conceptual framework.
Traveller attributes, such as age and gender, are used in this study to capture the travellers’ tastes and preferences, which are expected to have a significant influence on satisfaction. In the literature, traveller attributes are either used as segmentation or listed as main attributes influencing satisfaction [8,42,43,44]. As such, three items, namely, gender, age group, and regular or non-regular traveller, are included under “traveller attributes”.
Likewise, trip attributes, such as travel time and waiting time, are expected to have a significant negative influence on travellers’ satisfaction. Therefore, five items under “trip attributes” are hypothesised to have an influence on passengers’ satisfaction, as shown in Figure 1.
Service attributes, such as train frequency and punctuality, are expected to have a significant positive influence on satisfaction. As seen in the literature, service attributes are included in many satisfaction models [6,7,11,13,14]. As such, six attributes that are common in the literature are proposed under “service attributes”. Finally, it is hypothesised that other attributes, such as delays and expectations about train services, may also influence passengers’ satisfaction; hence, four items under “other attributes” are considered in the conceptual framework.
The fundamental assumption is that there is a linear relationship between overall satisfaction and all the attributes. Each of the attribute groups contributes to satisfaction to a certain extent. Under these four attribute groups, a total of 19 variables are tested. Among all the 19 listed variables, some may make a positive contribution and some may make a negative contribution. The contribution can be large, medium, or small. If negligible, it will not be included in the final model.

3.2. Survey and Data Collection

One of the most common methods of understanding customer satisfaction is through questionnaire surveys. An online survey was used to collect the relative information to address the research objectives. This survey was approved by RMIT University’s Human Research Ethics Committee in early 2021 (Reference: 2021-23822-13326). The following sections of the survey are relevant to this paper:
  • A section about passengers’ characteristics and their travel patterns.
  • A section with hypothetical statements to capture issues and expectations about train travel.
  • A section about overall satisfaction and service ratings.
The market research firm, Qualtrics, was engaged to conduct the survey online. The service provider invited its users aged 18+ and based in Melbourne to fill out the survey. A filter question was used to ensure that only those who have used the Melbourne Metro train services in the recent two years can proceed with the survey. Our recruitment strategy aimed to have similar gender representation to Census data, which was validated after data collection. A soft launch in February 2021 tested the survey. With minor updates, the full-scale survey was then conducted in March 2021. At the end, a total of 431 responses were received. After removing two outlier cases where gender is unspecified, 429 valid samples are kept for analysis. This sample size is more than enough based on the following guidance. The Krejcie and Morgan table [45] is well acceptable for sample size determination. As general guidance, a sample size of 384 is recommended for a population of 1 million and above, allowing a 5% margin of error and a 95% confidence level.

3.3. Questions and Measurements
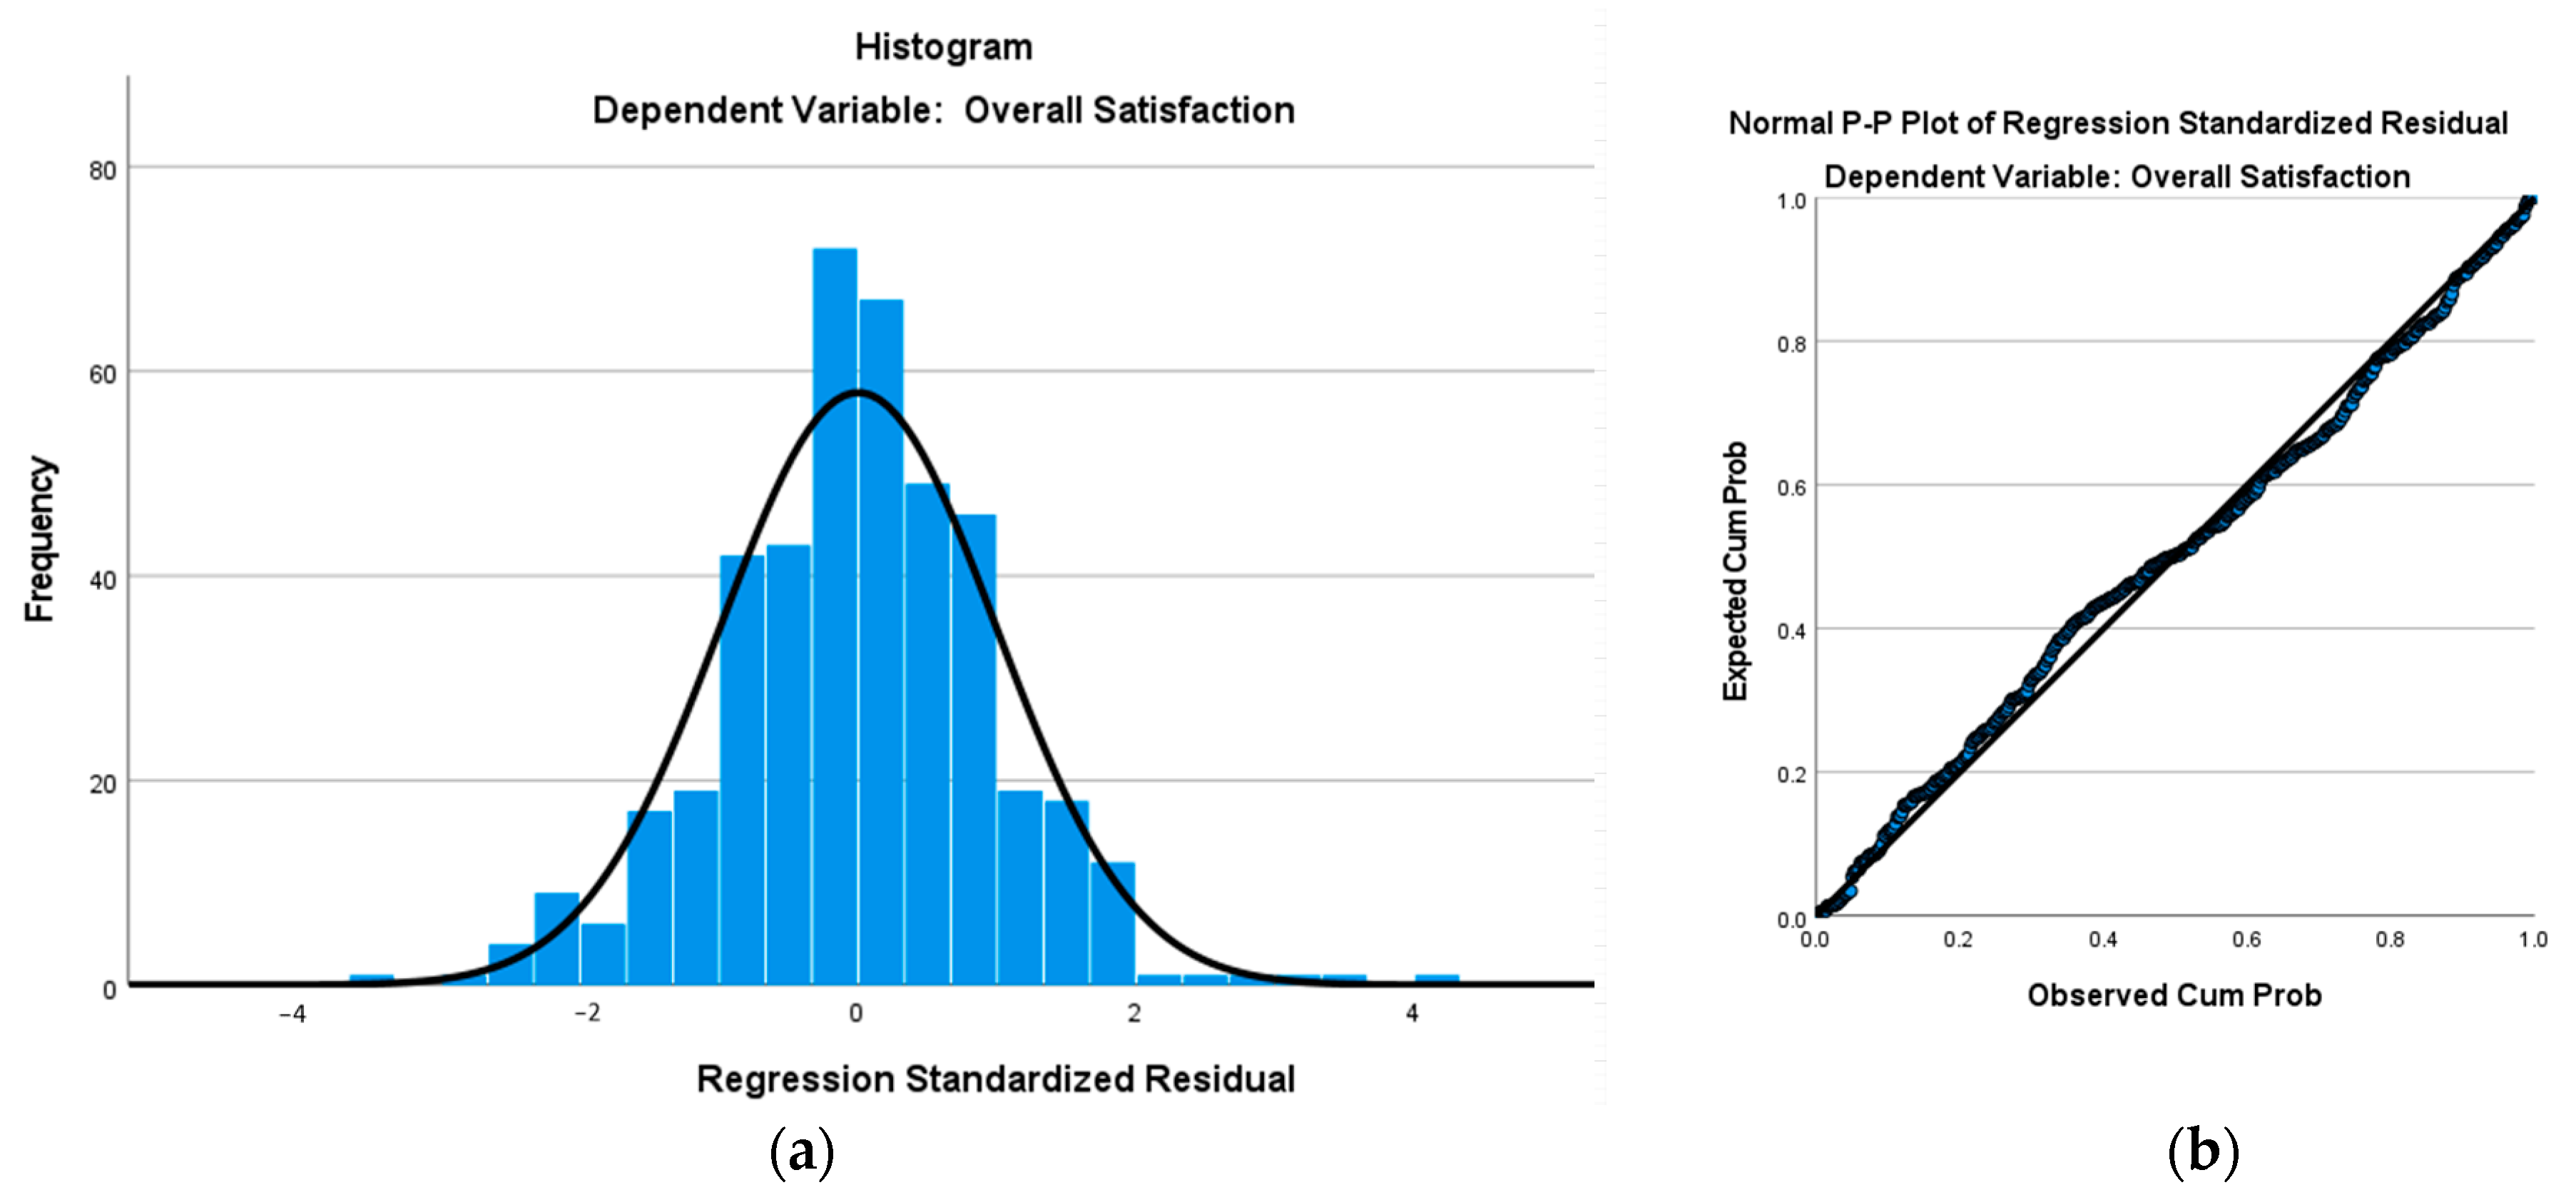
Multiple-choice questions were used in the section to reveal the passenger and trip characteristics. Survey participants needed to select the gender, age group, and frequency of travel that best describes them. In the data analysis, male was selected as the gender reference group. The answer to the age group question was transformed into two binary variables, YoungAdult and SeniorAdult. YoungAdult = 1 if the age group was reported as “18–29”; otherwise, 0. SeniorAdult = 1 if the age group was reported as “60 and over”; otherwise, 0. The frequency of travel question was later used to classify the user into regular traveller vs. non-regular traveller. If the travel frequency was reported as “1–4 days per week” or “5 days per week or more”, then RegTraveller = 1; otherwise, 0. In other words, people who travel less frequently than once per week are defined as non-regular train users.
Information on five trip characteristics was collected. The survey participants needed to select the options that best describe a typical one-way trip. To understand the influence of long journey time and waiting time on service satisfaction, two binary variables were created accordingly. LongTravelTime = 1 if the average travel time was reported as longer than 45 min; otherwise, 0. LongWaitingTime = 1 if the average waiting time was reported as longer than 15 min; otherwise, 0. Other than trip time questions, participants were also asked “How often do you travel with friends/family”; “How often do you carry backpacks or bags of similar size onboard”; “How often do you carry large items such as bicycle, luggage, pram, shopping trolley, etc. onboard”. The responses to these three items were recorded using a 5-point scale, ranging from 1 = “never” to 5 = “always”. To understand the influence of travel in a group and travel with items on service satisfaction, three binary variables were created. GroupTravel = 0 if the frequency of travel in group was reported as never or rarely; otherwise, 1. TravelSmallItem = 0 if the frequency of travel with small item was reported as never or rarely; otherwise, 1. TravelLargeItem = 0 if the frequency of travel with a large item was reported as never or rarely; otherwise, 1.
Overall satisfaction of the train service and service ratings of different aspects were also captured in this study. For the overall satisfaction, participants were asked “Overall, in a scale from 0–10, how satisfied are you with the Melbourne Metro Train services”. For the service ratings, participants were asked to rate the train services for six different aspects, including “crowd level in the carriage”, “personal safety”, “real-time information”, “punctuality”, “service frequency”, and “management and response to disruption”. The rating scores were recorded using a 5-point scale (1–5), where a larger value indicates a higher rating.
Issues and expectations about train travel were captured in this study using several questions. Statements of similar nature were grouped together to address different issues or expectations. Issues with delays were reflected by two statements: one captured the issue with delay due to crowded platform; the other one captured the issue with delay due to crowded carriage. Issues with peak-hour travel were reflected by two statements: issue with peak-hour seat availability and issue with passenger load over-capacity. Participants’ responses were recorded using a 5-point scale, ranging from 1 = “strongly disagree” to 5 = “strongly agree”. The average score of the items that were related to each of the two issues were computed to represent each issue, with a higher score indicating that participants experienced greater issues.
Similarly, hypothetical statements about expectations were evaluated using a 5-point scale, where 1 = “strongly disagree” and 5 = “strongly agree”. Expectation about real-time information was reflected by two statements: “use real-time car occupancy data to facilitate boarding”, and “make real-time crowding information available to improve comfort”. Expectation about carriage re-configuration was reflected by three statements: “having wider aisle to encourage passengers to move further into the carriage”, “clearing up more space near the train door to help the passengers move quickly in/out”, and “removing some seats to improve space and capacity in the carriage”. Again, the average scores were computed to represent each expectation, with a higher score indicating that participants had a greater expectation.

3.4. Data Analysis

The data collected from the survey were processed in IBM SPSS Statistics 27. A reliability check was performed on the Likert Scale questions. Cronbach’s Alpha value, 0.70, is widely considered as acceptable [46]. Our result shows the Cronbach’s Alpha value is 0.861, which indicates a high level of internal consistency for the service rating scale in our study. The standard deviation values of the aggregated variables are also calculated and presented in the result section.
A number of statistical techniques were used to understand and analyse the data. To address objective 1, descriptive statistics were used to examine the demographic profile of customers. To address objective 2, descriptive statistics were used to explain the overall satisfaction score and service ratings. To address objective 3, descriptive statistics were used to reveal the level of issue and expectations about train travel. To address objective 4, regression analysis was performed to explore the impact of these attributes on overall customer satisfaction and to test the proposed research hypothesis.
Considering that the dependent variable, customer overall satisfaction, is rated between 1 to 10 in this study, it can reasonably be treated as a continuous measure; thus, multiple regression method is chosen. As mentioned earlier in Section 3.1, independent variables were studied and grouped as traveller-related attributes, trip-related attributes, service-related attributes, and other attributes. Some of the individual variables were in binary form, whereas some were in scale. The key assumptions of linear regression are checked and discussed in the result section below.

4. Results and Discussion

The results are presented and discussed in four parts. Firstly, the demographic profile of respondents and the characteristics of their train travel are presented. Secondly, overall satisfaction results and six aspects of service ratings are presented. Thirdly, the issues and expectations about train travel are examined. Fourthly, the relationship between overall customer satisfaction about Melbourne Metro train services and the attributes is analysed. Lastly, we provide some discussion about the key findings from this study and the comparison of our findings with prior research on passenger satisfaction.

4.1. Personal Characteristics and Travel Characteristics

To effectively test the proposed conceptual framework, it is important to have a comprehensive understanding of both the personal characteristics of travellers and their trip characteristics. Detailed descriptive statistics about the respondents’ profile and their trips are presented in Table 1.
Our survey sample’s gender and age group distribution were compared to the 2021 Census data [47]. It was found that there is no statistically significant difference in gender distribution between the two data sources (χ2 = 1.29, df = 1, p = 0.26). Moreover, there is no statistically significant difference in age group distribution between the two data sources (χ2 = 3.8, df = 3, p = 0.28).
In terms of travel frequency, it is found that 58.7% of the respondents are regular train users who use the train more than one day per week. Trip characteristics are reflected by questions such as average onboard journey time, average platform waiting time, frequency of travel in a group such as friends or family, frequency of travel with small items carried onboard such as backpacks, and frequency of travel with large items carried onboard such as bicycles. The result shows that a typical one-way trip is commonly reported between 15 and 45 min (total 77.9%). The average waiting time on the platform is commonly reported as 5–15 min (84.3%).
The frequency of travelling with friends/family or with small/large items is also examined. The results show that it is common for the passengers to travel in groups (69.5% reported sometimes and more often). Travelling with small items is even more commonly reported (74.6% reported sometimes and more often), while travelling with large items is not as common (28.4% reported sometimes and more often).

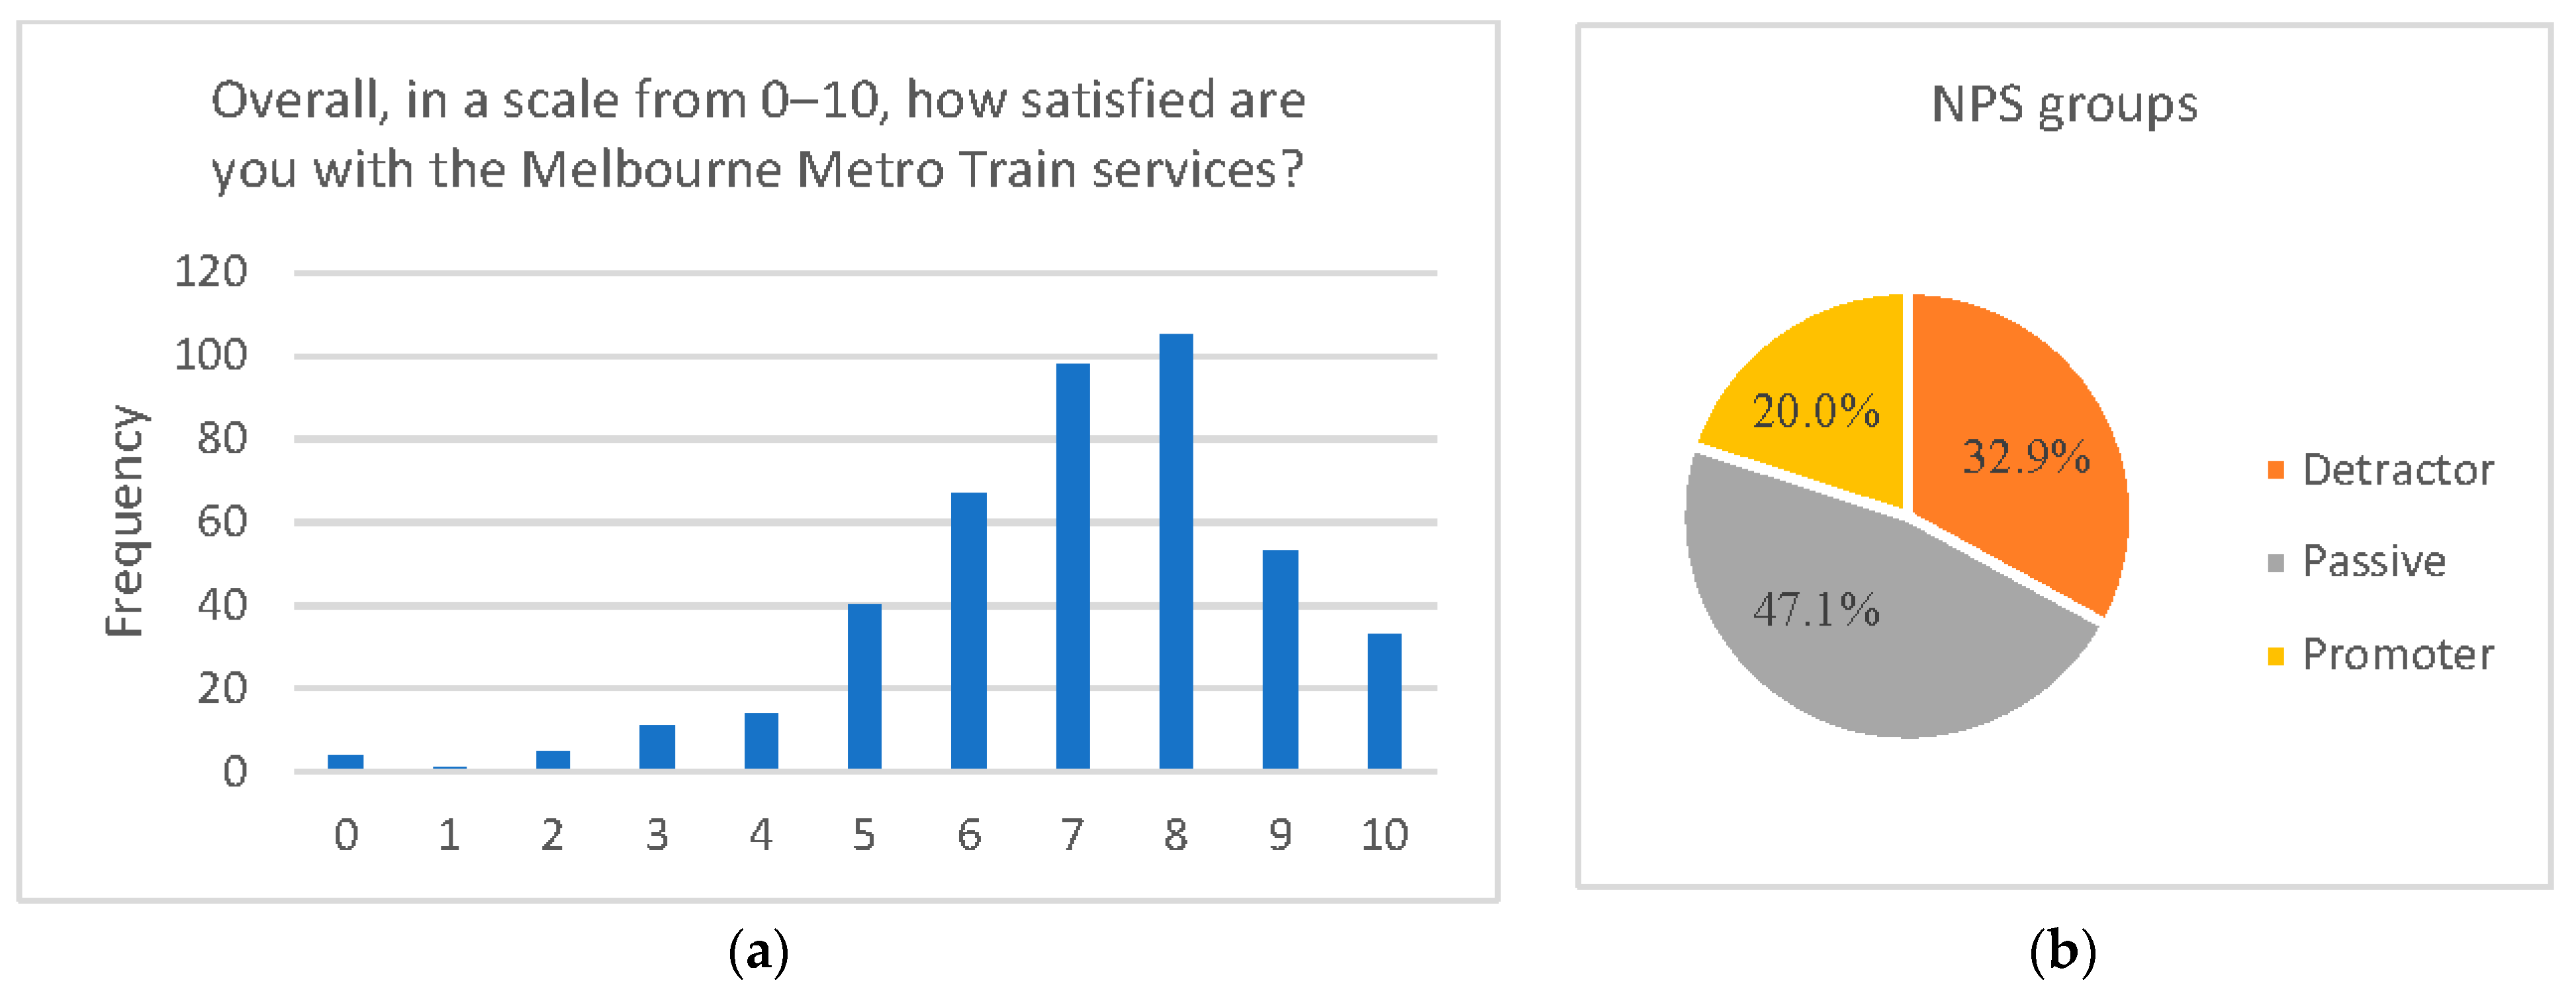
4.2. Service Ratings and Overall Satisfaction

As shown in Figure 2a, the overall satisfaction scores are distributed in a bell-shaped curve centered around 7 and 8. The average satisfaction score is 7.04, with 1.87 standard deviation. The median satisfaction score is 7 and the mode is 8. The result shows that 82.5% of the respondents scored 6 and above, indicating that Melbourne train users are fairly satisfied with the overall service. The overall satisfaction score may seem quite encouraging, but when the score is translated into Net Promoter Score (NPS), it reveals more insights. According to the concept of NPS [21], people who score 0 to 6 are the unhappy customers that belong to the “Detractor” group; people who score 7 or 8 are in the “Passive” group; people who score 9 or 10 are in the “Promoter” group. The difference of the percentage value between the “Promoter” and the “Detractor” is the NPS. The higher the positive NPS, the better the service is perceived by the users. As seen in Figure 2b, our results show that there are 20.0% promoters, 47.1% passives, and 32.9% detractors. Therefore, we work out a negative 13 NPS for Melbourne Metro services, which indicates some room for improvement.
Service quality is important to public transport organisations as it is closely linked with passenger satisfaction. Ratings on different service aspects were then examined to better understand the customers’ needs and to develop targeted strategies to improve service. Detailed descriptive statistics about the service attribute ratings are presented in Table 2. As can be seen, the rating score for most of the aspects is over 3, which implies general satisfaction. The highest average rating of 3.57 goes to “Service frequency”. The second highest rating of 3.46 goes to “Personal safety”. This is followed by “Punctuality” at 3.44, “Real-time information” at 3.43, and “Management & response to disruption” at 3.39. “Crowd level in the carriage” is the only aspect that is rated below 3 and has the lowest average rating of 2.98, which is not statistically different to 3; t (428) = −0.454, p = 0.65.

4.3. Other Issues and Expectations

Apart from traveller attributes, trip attributes, and service attributes, four other attributes were also studied to uncover the issues and expectations reported by the respondents, and these thus provide critical knowledge about customers’ satisfaction from a different angle. The individual items listed under different variables are collapsed into integrated measures by taking the average scores. The details are presented in Table 3.
From the result, we can tell that the issue with peak-hour travel has a higher mean score than the issue with delays, indicating that there are more issues experienced during the peak hour (either having difficulty of finding a seat or suffering from over-capacity) compared to general delays. Apart from the issues reported, we can also learn from the expectations. According to Churchill and Surprenant, expectations reflect anticipated performance [48]. The result shows that passengers’ expectation of real-time information is higher compared to carriage re-configuration. Among the proposed solutions for carriage reconfiguration, clearing more space near the train door is more popular compared to removing some seats in the carriage. It is important to understand passengers’ needs and expectations so that design solutions can be developed or considered that are tailored to their needs.

4.4. Relationship between the Overall Satisfaction and Attributes

According to our conceptual framework described in Section 2, several regression analyses were conducted to reveal the relationship between customer satisfaction with Melbourne train travel and the four groups of attributes. Models with different combinations of variables were tested. The details are presented in Table 4 below. The main assumptions about linear regression are checked and discussed together with the result.
Models 1–4 tested the variables grouped by different attributes. Checking the R square and Adjusted R square values, we can clearly see that, when using traveller-related or trip-related attributes as predictors, these models do not fit the data well enough. In model 1, only 4% of the variation in customer satisfaction is accountable. Model 2 has even lower R square and adjusted R square values. Model 3, with six independent variables, provides a much better fit to the data, where 58% of the variation in customer satisfaction is explained by the service attributes. Using other attributes in Model 4 results in 19% of variation being accountable.
The comparison of Models 1–4 shows that service attributes contribute the most, followed by other attributes, traveller attributes, and trip attributes. The prediction power from the strongest to the weakest is ranked as: Model 3 (using service attributes), Model 4 (using other attributes), Model 1 (using traveller attributes), and Model 2 (using trip attributes). We can also see that all four models passed the F test, indicating that these models are significantly improved compared to an intercept-only model. This result provides empirical support to the proposed conceptual framework. It seems that traveller attributes, trip attributes, service attributes, and other attributes are the right attribute groups to include.
When testing all nineteen independent variables together, we followed the standard regression approach in SPSS and performed the regression using three different methods, including forward selection, backward elimination, and stepwise method [49,50]. We set the rule for variable selection as using the probability of F at 0.05 for entry and 0.10 for removal. As a result, the final model using the backward elimination method produced the best overall fit among all the models tested. The best-fitted model, Model 5, has nine significant independent variables. The overall regression model was statistically significant (R2 = 0.60, F (9, 419) = 69.66, p < 0.001).
In order to understand the direction and extent of influence on overall satisfaction, the coefficients of the variables were checked. The details are presented in Table 5. When using the traveller attributes in Model 1, the t-test result shows that Male and SeniorAdult do not significantly predict overall satisfaction. On the contrary, YoungAdult and RegTraveller do make a significant prediction. YoungAdult is negatively correlated to overall satisfaction (β = −0.497, p = 0.021), while RegTraveller is positively correlated (β = 0.597, p = 0.002). People who are less than 30 years old tend to rate their overall satisfaction lower than those who are 30 and above. Regular travellers who use train services at least once a week tend to rate overall satisfaction higher. This finding is consistent with a study conducted in Sweden, which suggests that more frequent PT users are significantly more satisfied [8].
When using the trip attributes in Model 2, only one variable, CarryLargeItem, is found to be significant (β = 0.574, p = 0.006). Interestingly, people who are more likely to carry large items onboard tend to give higher satisfaction scores. As a matter of fact, it is less common to see people bringing large items (such as bicycles, trolleys, or prams) onboard during peak hours. Perhaps those who need to take large items onboard would deliberately choose to travel during the off-peak period, thus having a higher satisfaction. Further investigations are required to fully explain the phenomenon. Other variables, including LongTravelTime, LongWaitingTime, GroupTravel, and CarrySmallItem, were tested to be insignificant to the overall satisfaction.
When using the service attributes in Model 3, five out of six service aspects were proven significant. Safety rating (β = 0.291, p < 0.001), Real-time Information rating (β = 0.356, p < 0.001), Punctuality rating (β = 0. 507, p < 0.001), Frequency rating (β = 0. 303, p < 0.001), Management and Response rating (β = 0. 233, p = 0.002) all positively associated with the overall satisfaction. There is only one variable in this group that tested insignificant, which is SvcRatingCrowd (β = 0. 115, p = 0.141). As pointed out by Börjesson and Rubensson [5], only when crowding levels are high does crowding become critical to satisfaction. As a matter of fact, the SvcRatingCrowd variable could have become significant if the confidence level was lowered to 85%. In short, Punctuality has the highest weighting among all service aspects, followed by Real-time Information, Frequency, Safety, Management, and then Crowd Level in Carriage. The finding is similar to a study about bus service satisfaction, where punctuality, frequency, and driving security were identified as the top three most important attributes [7]. Our finding is also consistent with the NRPS survey result conducted in the UK, which found that punctuality remains the biggest influencing factor on satisfaction [11].
Model 4 tested the other attributes. Three variables: IssueDelay, IssuePeakHr, and ExpectRTInfo, were found to be significant at a 95% confidence interval. One variable, ExpectCarReconfig, was found significant at a 90% confidence interval. Two issue-related variables, Issue with delays (β = −0.224, p = 0.013), and Issue with peak-hour travel (β = −0.908, p < 0.001), were negatively associated with overall satisfaction. Judging by the magnitude of the beta values, we can tell that IssuePeakHr weighs more in explaining overall satisfaction. As one of the questions used to calculate IssuePeakHr is about seat availability during peak hours, this finding can be supported by another study conducted in the Netherlands, which found that having a seat on the train is essential to the overall experience [51]. Apart from these two issue-related variables, two expectation-related variables were found to be positively associated with overall satisfaction: expectation about real-time Information (β = 0.325, p = 0.011) and expectation about carriage re-configuration (β = 0.218, p = 0.092). The sign of these beta values makes good sense. People who experience more issues, either with delay or with peak-hour travel, will be more likely to score lower on satisfaction. On the other hand, a higher expectation score shows a positive attitude towards potential changes and improvement. Thus, having higher expectations about real-time information or carriage configuration will be more likely to result in a higher satisfaction score. In general, with more issues reported, lower overall satisfaction is expected. With higher expectations identified, higher satisfaction is expected.
The final model, Model 5, has nine significant independent variables: one from the traveller attribute group, one from the trip attribute group, one from the other attribute group, and six from the service attribute group. There is only one variable, GroupTravel (β = −0.261, p = 0.047), which presents a negative coefficient. It seems that people who are more likely to travel with friends/family (i.e., in a group) tend to rate lower overall satisfaction. On the contrary, reflected by the positive coefficients, the other eight variables positively contribute to overall satisfaction. Judging by the variable SeniorAdult (β = 0. 494, p = 0.005), senior people who are 60 years old and above tend to score higher in overall satisfaction. This finding is consistent with what was found in Model 1, that young people tend to rate satisfaction lower. However, this result conflicts with the findings from a survey that examines passengers’ rating of NSW train service quality. Thevathasan and Balachandran cited Douglas Economics (2006)’s work claiming that older respondents who aged 60 plus tended to rate lower about the overall service [52]. They also pointed out that there was little difference in overall rail service ratings by different gender. This finding is consistent with our result. Both Model 1 and Model 5 confirm that gender variable Male is insignificant to our satisfaction model.
While examining the influence from other attributes in Model 5, ExpectRTInfo (β = 0.189, p = 0.030) shows that people who have a higher expectation about real-time car occupancy and crowding information, by average, give slightly higher satisfaction scores. With regards to the service attributes, all six service rating variables are found to be positively associated with overall satisfaction. This is consistent with the findings from Model 3. The coefficients of the service aspects demonstrate similar order of importance. Punctuality again has the highest weighting, followed by Real-time Information, and Frequency. Surprisingly, Management took over the next place, leaving Safety now falling behind a little bit. Again, the smallest weighting goes to the Crowd level in the carriage.
To check one of the key assumptions about linear regression, multicollinearity, we deployed the common methods include examining the correlation matrix between predictor variables and calculating variance inflation factors (VIFs). The correlation analysis result shows that the correlation coefficients between the predictor variables all fall below 0.7. A commonly acceptable rule is that multicollinearity may become a problem where correlations are greater than 0.8 [53]. According to this, our correlation check raises no concern of multicollinearity. Apart from the correlation test, VIF was also calculated and checked. VIF less than 4 is commonly accepted [54]. As can be seen in Table 5, the VIF values in our models are all well below the threshold, which also confirms that there is no violation of multi-collinearity assumption. It is worth noting that other key assumptions about linear regression were also checked. The details are presented in Figure 3. The result shows that the P-P plot generally lines up along a 45-degree line, indicating that the assumption about the normality of errors is satisfied.

5. Discussion and Conclusions

This study systematically modelled passengers’ satisfaction and its relationship with travel experience attributes by surveying Melbourne’s Metro train users. In the following sub-sections, theoretical contributions from this study are discussed, followed by practical implications, limitations, and future prospects.

5.1. Discussion

The result of the study supports the proposed hypotheses and confirms that there is a linear relationship between overall passengers’ satisfaction and travel experience attributes. The assumptions of linear regression were validated, and five significant models were presented, each incorporating different combinations of variables. The key findings from these models are summarised and discussed in the following paragraphs.
Model 1 tested the “traveller attributes” group. One key finding is that males tend to rate slightly higher overall satisfaction. However, the association between gender and overall satisfaction is not statistically significant. This result largely aligns with previous studies [42,43]. An inconsistent finding in the airline satisfaction study [44] is not surprising, as the nature of the transport mode is different for rail. The result confirms a significant association between age group variables and overall satisfaction. It is found that young adults have a negative influence, while senior adults have a positive influence. This result largely aligns with previous studies [8,14,42,43]. An inconsistent finding is found in the airline satisfaction study [44]. It is also found that regular travellers tend to rate overall satisfaction higher. This finding is consistent with existing literature [8].
Model 2 tested the “trip attributes” group. It was found that LongTravelTime and LongWaitingTime are both insignificant to overall satisfaction. This finding is new and different to an earlier study on passengers’ satisfaction with Dublin Bus [4]. We believe our result is not random, judging by the high p values. It simply reflects the Melbourne metro train users’ perceptions. The other key finding is that passengers who are more likely to travel in a group tend to rate lower overall satisfaction. This is an original discovery, as this variable was not tested in any existing passenger satisfaction model. One possible explanation is that passengers travelling in a group may encounter more difficulties finding suitable seating or space to stay together. Another finding is that CarrySmallItem is insignificant to overall satisfaction, while CarryLargeItem is significant. The result shows passengers who are more likely to carry large items onboard tend to give higher satisfaction scores. This is an original discovery, as this variable was not tested in any existing passenger satisfaction model. This result is not surprising, as carrying a small item onboard is generally easier and may not have as significant an impact on the travel experience compared to carrying a large item.
Model 3 tested the “service attributes” group. One of the key findings is that all service rating variables are positively associated with overall satisfaction. This finding is highly consistent with existing literature [10,12,37,38]. It is also found that the top three service aspects in terms of the degree of the association are Punctuality, Real-time Information, and Frequency. In general, our results largely align with previous studies. Two attributes (punctuality and frequency) out of the top three aspects are commonly listed as the most important service attributes in the existing literature [6,7,11,13,14].
Model 4 tested the “other attributes” group. It was found that passengers who experienced more issues, either with delay or with peak-hour travel, will be more likely to score lower on satisfaction. This is an original discovery, as these variables were not tested in any existing passenger satisfaction model. The results appear to be logical and in line with our expectations. This finding can be supported by [43], where complaints were found to be negatively correlated to satisfaction. Another key finding shows that passengers with higher expectations about real-time information or carriage configuration will be more likely to rate a higher satisfaction score. Our results largely align with previous studies. This finding adds to the existing knowledge, where the authors suggested that the research could be enriched by identifying a range of other issues and factors influencing the expectations [9].
By comparing four individual models, we can conclude that Model 3 (using service attributes) has the best overall goodness of fit, followed by Model 4 (using other attributes), Model 1 (using traveller attributes), and Model 2 (using trip attributes). It is found that, when all the attribute groups are working together, the best model is produced, where 60% of the variation in overall satisfaction is accountable in Model 5. At least one variable from each attribute group is presented in the final model. All six variables from the service attribute group are significant. Among the nine variables that were significant, eight variables (including SeniorAdult, ExpectRTInfo, and six servicing rating variables) are positively associated with overall satisfaction, while only one variable (GroupTravel) is negatively associated with overall satisfaction.
This study uses a comprehensive approach to examine train passengers’ satisfaction, incorporating four groups of attributes. Hidden factors that are often omitted in previous research are reflected in the “other attributes” group. For example, the “other attributes” group can capture passengers’ perceptions about common travel issues such as crowded platform/carriages and difficulties experienced during peak hours. Moreover, the “other attributes” group can capture passengers’ expectations on train and platform design features. In short, having the “other attributes” group enables us to identify the key issues and primary expectations, making it possible to use this knowledge to improve overall satisfaction.
This paper makes a theoretical contribution by structuring the framework, where not only traveller attributes, trip attributes, and service attributes are accountable, but also other attributes are captured in the overall satisfaction model. With “issues” and “expectations” grouped under other attributes, customer satisfaction can be further explained from a different angle. The proposed tree-structure framework makes adding or removing branches easier and flexible. Four groups of attributes can work together to produce a better-fitted model. Alternatively, groups of attributes can be used separately. The result shows that, in the absence of any other groups of attributes, the rest can still produce a significant model and explain a certain amount of variation in overall satisfaction.

5.2. Practical Implications

One of the practical implications of this research is to reveal which aspect of service quality is most valuable to the passengers. Evidence shows that Punctuality is the most influential one among all service aspects, then, in sequence, Real-time Information, Frequency, Management, Safety, and finally, Crowd Level in Carriage. Interestingly, Safety has a slightly higher weighting than Management when we tested the model with service attributes only. By considering passengers’ issues and expectations, it will further increase the passengers’ satisfaction. The operator and public sector can use this knowledge to improve the level of service, thus increasing overall customer satisfaction. According to the weightings, Punctuality, Real-time Information, and Frequency should receive relatively higher priority. On the other hand, taking into the existing service rating into consideration, aspects with average lower ratings might have larger room for improvement. In that case, train operators should pay more attention to improving the dissatisfaction associated with Carriage Crowd Level, Safety, and Management.

5.3. Limitations and Future Prospects

Despite the new findings, there are some limitations in this study. Some potential significant variables might have been left out due to the scope of the research. There is a scope to conduct a thorough investigation on a wider range of attributes. For example, the future models could test more social economic factors such as income, education, employment, etc. It can also test more trip attributes such as time of day travelled, distance travelled, trip purpose, etc. More service attributes such as pricing/ticketing, comfort, accessibility, and reliability can also be tested if data become available. Likewise, perceptions of passengers with different mobility needs (e.g., wheelchairs, crutches, visual impairments) can be considered in the future. In doing so, new significant attributes might be discovered and added to the model to enrich the research.
The data from this study was limited to Melbourne, Australia. In the future, a similar survey can be conducted in different Australian states or other countries to gain insight into geographical bias. Likewise, the survey and the approach used in this study may be adopted in the future to gain insight into passengers’ satisfaction regarding other public transport modes, such as trams and buses.

Author Contributions

Conceptualization, J.Y., N.S. and R.T.; methodology, J.Y.; software, J.Y.; formal analysis, J.Y.; investigation, J.Y.; data curation, J.Y.; writing—original draft preparation, J.Y.; writing—review and editing, J.Y., N.S. and R.T.; supervision, N.S. and R.T.; funding acquisition, N.S. and R.T. All authors have read and agreed to the published version of the manuscript.

Funding

This research received financial support for the PhD stipend of the first co-author (Jie Yang) from the Rail Manufacturing Cooperative Research Centre (funded jointly by participating rail organisations and the Australian Federal Government’s Business Cooperative Research Centres Program) through Project R3.7.13—Optimizing railway carriage design for improved dispersion, capacity and safety.

Institutional Review Board Statement

The online questionnaire survey in this study was approved by RMIT University’s Human Research Ethics Committee on 13 January 2021 (Reference: 2021-23822-13326).

Informed Consent Statement

Informed consent was obtained from all subjects involved in the study.

Data Availability Statement

Data is unavailable due to ethics application restrictions.

Conflicts of Interest

The authors declare no conflict of interest. The funders had no role in the design of the study; in the collection, analyses, or interpretation of data; in the writing of the manuscript; or in the decision to publish the results.

References

  1. Victoria Department of Transport—Patronage. Available online: https://dtp.vic.gov.au/about/data-and-research/patronage/ (accessed on 7 March 2023).
  2. Who We Are | Metro Trains. Available online: https://www.metrotrains.com.au/who-we-are/ (accessed on 5 January 2023).
  3. Feedback and Complaints—Public Transport Victoria. Available online: https://www.ptv.vic.gov.au/footer/customer-service/feedback-and-complaints/ (accessed on 7 January 2023).
  4. Cantwell, M.; Caulfield, B.; O’mahony, M. Examining the Factors that Impact Public Transport Commuting Satisfaction. J. Public Transp. 2009, 12, 1–21. [Google Scholar] [CrossRef] [Green Version]
  5. Börjesson, M.; Rubensson, I. Satisfaction with crowding and other attributes in public transport. Transp. Policy 2019, 79, 213–222. [Google Scholar] [CrossRef]
  6. Tyrinopoulos, Y.; Antoniou, C. Public transit user satisfaction: Variability and policy implications. Transp. Policy 2008, 15, 260–272. [Google Scholar] [CrossRef]
  7. Guirao, B.; García-Pastor, A.; López-Lambas, M.E. The importance of service quality attributes in public transportation: Narrowing the gap between scientific research and practitioners’ needs. Transp. Policy 2016, 49, 68–77. [Google Scholar] [CrossRef]
  8. Abenoza, R.F.; Cats, O.; Susilo, Y.O. Travel satisfaction with public transport: Determinants, user classes, regional disparities and their evolution. Transp. Res. Part A Policy Pract. 2017, 95, 64–84. [Google Scholar] [CrossRef] [Green Version]
  9. Brito, C.; Fonseca, F.; Pinto, S. Service Quality and Customer Satisfaction in Public Transports. Int. J. Qual. Res. 2010, 4, 125–130. [Google Scholar]
  10. Amponsah, C.T.; Adams, S. Service quality and customer satisfaction in public transport operations. Int. J. Serv. Oper. Manag. 2016, 25, 531–549. [Google Scholar] [CrossRef]
  11. National Rail Passenger Survey—NRPS—Spring 2020—Main Report and Other Documents—Transport Focus. Available online: https://www.transportfocus.org.uk/publication/national-rail-passenger-survey-nrps-spring-2020-main-report/ (accessed on 2 January 2023).
  12. Islam. Measuring Customer’s Satisfaction on Bus Transportation. Am. J. Econ. Bus. Adm. 2014, 6, 34–41. [Google Scholar]
  13. Zefreh, M.M.; Hussain, B.; Sipos, T. In-depth analysis and model development of passenger satisfaction with public transportation. KSCE J. Civ. Eng. 2020, 24, 3064–3073. [Google Scholar] [CrossRef]
  14. Mouwen, A. Drivers of customer satisfaction with public transport services. Transp. Res. Part A Policy Pract. 2015, 78, 1–20. [Google Scholar] [CrossRef]
  15. Beirão, G.; Cabral, J.S. Understanding attitudes towards public transport and private car: A qualitative study. Transp. Policy 2007, 14, 478–489. [Google Scholar] [CrossRef]
  16. Peterson, R.A.; Wilson, W.R. Measuring customer satisfaction: Fact and artifact. J. Acad. Mark Sci. 1992, 20, 61–71. [Google Scholar] [CrossRef]
  17. Friman, M.; Fellesson, M. Service Supply and Customer Satisfaction in Public Transportation: The Quality Paradox. J. Public Transp. 2009, 12, 57–69. [Google Scholar] [CrossRef] [Green Version]
  18. Lai, W.T.; Chen, C.F. Behavioral intentions of public transit passengers-The roles of service quality, perceived value, satisfaction and involvement. Transp. Policy 2011, 18, 318–325. [Google Scholar] [CrossRef]
  19. Parasuraman, A.; Zeithaml, V.; Berry, L. SERVQUAL: A multiple-item scale for measuring consumer perceptions of service quality. J. Retail. 1988, 64, 12–40. [Google Scholar]
  20. Passenger Surveys. Available online: https://www.transperth.wa.gov.au/about/Surveys-Statistics/passenger-surveys (accessed on 22 December 2022).
  21. Reichheld, F. The one number you need to grow. Harv. Bus. Rev. 2004, 82, 133. [Google Scholar]
  22. Customer Satisfaction Index. 2022. Available online: https://www.transport.nsw.gov.au/news-and-events/reports-and-publications/customer-satisfaction-index (accessed on 2 January 2023).
  23. Track Record—Quarterly Track Record. Available online: https://www.ptv.vic.gov.au/footer/data-and-reporting/track-record/ (accessed on 2 January 2023).
  24. Danaher, P.J.; Gallagher, R.W. Telecom New Zealand. Business 1997, 31, 122–133. [Google Scholar]
  25. Janković, S.R.; Marković, M.G.; Brand, A. Relationship between attribute and overall customer satisfaction: A case study of online banking services. Zb Veleučilišta U Rijeci 2014, 2, 1–12. [Google Scholar]
  26. Ha, H.; Janda, S. An empirical test of a proposed customer satisfaction model in e-services. J. Serv. Mark. 2008, 22, 399–408. [Google Scholar] [CrossRef]
  27. Mumtaz, H.; Islam, A.; Ariffin, K.H.K.; Karim, A. Customers Satisfaction on Online Shopping in Malaysia. Int. J. Bus. Manag. 2011, 6, 162–169. [Google Scholar] [CrossRef] [Green Version]
  28. Singh, J.; Kaur, G. Customer satisfaction and universal banks: An empirical study. Int. J. Commer. Manag. 2011, 21, 327–348. [Google Scholar] [CrossRef]
  29. Sumaedi, S.; Bakti, I.G.M.Y.; Rakhmawati, T.; Astrini, N.J.; Widianti, T.; Yarmen, M. Factors influencing public transport passengers’ satisfaction: A new model. Manag. Environ. Qual. An. Int. J. 2016, 27, 585–597. [Google Scholar] [CrossRef]
  30. Shiwakoti, N.; Jiang, H.; Nguyen, A.D. Passengers’ perception of safety and its relationship with demographics, service quality, satisfaction and loyalty in airlines sector—A case study of Vietnam to Australia route. Transp Policy 2022, 124, 194–202. [Google Scholar] [CrossRef]
  31. Lundahl, N.; Vegholm, F.; Silver, L. Technical and functional determinants of customer satisfaction in the bank-SME relationship. Manag. Serv. Qual. 2009, 19, 581–594. [Google Scholar] [CrossRef]
  32. Eygu, H.; Gulluce, A.C. Determination of Customer Satisfaction in Conservative Concept Hotels by Ordinal Logistic Regression Analysis. J. Financ. Risk Manag. 2017, 6, 269–284. [Google Scholar] [CrossRef] [Green Version]
  33. Mokonyama, M.; Venter, C. Incorporation of customer satisfaction in public transport contracts—A preliminary analysis. Res. Transp. Econ. 2013, 39, 58–66. [Google Scholar] [CrossRef]
  34. Monsuur, F.; Enoch, M.; Quddus, M.; Meek, S. Modelling the impact of rail delays on passenger satisfaction. Transp. Res. Part A Policy Pract. 2021, 152, 19–35. [Google Scholar] [CrossRef]
  35. Shiwakoti, N.; Stasinopoulos, P.; Vincec, P.; Qian, W.; Hafsar, R. Exploring how perceptive differences impact the current public transport usage and support for future public transport extension and usage: A case study of Melbourne’s tramline extension. Transp. Policy 2019, 84, 12–23. [Google Scholar] [CrossRef]
  36. Laura, E.; Gabriella, M. Service Quality Attributes Affecting Customer Satisfaction for Bus Transit. J. Public Transp. 2007, 10, 21–34. [Google Scholar]
  37. Zhang, C.; Liu, Y.; Lu, W.; Xiao, G. Evaluating passenger satisfaction index based on PLS-SEM model: Evidence from Chinese public transport service. Transp. Res. Part A Policy Pract. 2019, 120, 149–164. [Google Scholar] [CrossRef]
  38. Ibrahim, A.N.H.; Borhan, M.N.; Yazid, M.R.M.; Rahmat, R.A.; Yukawa, S. Factors influencing passengers’ satisfaction with the light rail transit service in alpha cities: Evidence from Kuala Lumpur, Malaysia using structural equation modelling. Mathematics 2021, 9, 1954. [Google Scholar] [CrossRef]
  39. Li, L.; Gao, T.; Yu, L.; Zhang, Y. Applying an integrated approach to metro station satisfaction evaluation: A case study in Shanghai, China. Int. J. Transp. Sci. Technol. 2022, 11, 780–789. [Google Scholar] [CrossRef]
  40. Chakraborty, S.; Mengersen, K.; Fidge, C.; Ma, L.; Lassen, D. A Bayesian Network-based customer satisfaction model: A tool for management decisions in railway transport. Decis. Anal. 2016, 3, 4. [Google Scholar] [CrossRef] [Green Version]
  41. Sukhov, A.; Lättman, K.; Olsson, L.E.; Friman, M.; Fujii, S. Assessing travel satisfaction in public transport: A configurational approach. Transp. Res. Part D Transp. Environ. 2021, 93, 102732. [Google Scholar] [CrossRef]
  42. Jiang, H.; Zhang, Y. An investigation of service quality, customer satisfaction and loyalty in China’s airline market. J. Air Transp. Manag. 2016, 57, 80–88. [Google Scholar] [CrossRef]
  43. Oyewole, P. Consumer’s socio-demographic characteristics and satisfaction with services in the airline industry. Serv. Mark. Q. 2001, 23, 61–80. [Google Scholar] [CrossRef]
  44. Clemes, M.D.; Gan, C.; Kao, T.H.; Choong, M. An empirical analysis of customer satisfaction in international air travel. Innov. Mark. 2008, 4. Available online: https://www.businessperspectives.org/images/pdf/applications/publishing/templates/article/assets/2229/IM_en_2008_2_Clemes.pdf (accessed on 1 March 2023).
  45. Krejcie, R.V.; Morgan, D.W. Determining sample size for research activities. Educ. Psychol. Meas. 1970, 30, 607–610. [Google Scholar] [CrossRef]
  46. Hair, J.F.; Black, W.C.; Babin, B.J.; Anderson, R.E.; Tatham, R.L. Multivariate Data Analysis, 6th ed.; Prentice Hall: Hoboken, NJ, USA, 2006. [Google Scholar]
  47. Search Census Data. Available online: https://www.abs.gov.au/census/find-census-data/search-by-area (accessed on 22 December 2022).
  48. Churchill, G.A., Jr.; Surprenant, C. An investigation into the determinants of customer satisfaction. J. Mark. Res. 1982, 19, 491–504. [Google Scholar] [CrossRef]
  49. Draper, N.R.; Smith, H. Applied Regression Analysis; John Wiley & Sons: Hoboken, NJ, USA, 1998. [Google Scholar]
  50. Leech, N.L.; Barrett, K.C.; Morgan, G.A. IBM SPSS for Intermediate Statistics: Use and Interpretation; Routledge: London, UK, 2014. [Google Scholar]
  51. Van Hagen, M.; Bron, P. Enhancing the Experience of the Train Journey: Changing the Focus from Satisfaction to Emotional Experience of Customers. Transp. Res. Procedia. 2014, 1, 253–263. [Google Scholar] [CrossRef] [Green Version]
  52. Thevathasan, A.; Balachandran, B. Customers perceptions of metropolitan train services in Melbourne. In Proceedings of the 30th Australasian Transport Research Forum, Melbourne, Austrilia, 25–27 September 2007; pp. 1–15. [Google Scholar]
  53. Field, A. Discovering Statistics Using IBM SPSS Statistics; Sage: Newcastle upon Tyne, UK, 2013. [Google Scholar]
  54. O’brien, R.M. A caution regarding rules of thumb for variance inflation factors. Qual. Quant. 2007, 41, 673–690. [Google Scholar] [CrossRef]
Figure 1. Research conceptual framework.
Sustainability 15 06645 g001
Figure 2. (a) Overall satisfaction distribution; (b) NPS groups.
Sustainability 15 06645 g002
Figure 3. (a) Residual Histogram; (b) P-P plot.
Sustainability 15 06645 g003
Table 1. Descriptive Statistics about travellers and trips.
ItemsCategoryFrequency(%)
GenderMale17641.0
Female25359.0
Age Group18–2910825.2
30–4419144.5
45–597417.2
60 and over5613.1
Travel FrequencyOccasionally11226.1
less than once a week6515.2
1–4 days per week13932.4
5 days per week or more11326.3
Travel Timeless than 15 min184.2
15–30 min16237.8
30–45 min17240.1
more than 45 min7717.9
Waiting Timeless than 5 min4811.2
5–10 min26160.8
10–15 min10123.5
more than 15 min194.4
Travel in GroupNever368.4
Rarely9522.1
Sometimes16738.9
Often10223.8
Always296.8
Carry Small ItemNever419.6
Rarely6815.9
Sometimes13932.4
Often11125.9
Always7016.3
Carry Large ItemNever17240.1
Rarely13531.5
Sometimes6615.4
Often4310.0
Always133.0
Table 2. Descriptive statistics about six service aspects.
Service AttributesMeanSD
Service aspect 1—Crowd level in carriage2.981.06
Service aspect 2—Personal safety3.461.07
Service aspect 3—Real-time information3.431.04
Service aspect 4—Punctuality3.440.96
Service aspect 5—Service frequency3.570.98
Service aspect 6—Management and response to disruption3.391.07
Table 3. Descriptive Statistics about other attributes.
VariablesMeanSDItemsMeanSD
O1—IssueDelays2.570.91Delay due to the crowded platform2.610.97
Delay due to the crowded carriage2.521.05
O2—IssuePeakHr3.550.87Peak-hour seat availability3.561.15
Peak-hour passenger load3.541.06
O3—ExpectRTInfo3.960.68Real-time car occupancy4.000.80
Real-time crowding info3.910.88
O4—ExpectCarRe-config3.750.67Wider aisle3.890.86
More space near train door3.930.84
Remove some seats3.451.04
Table 4. Regression model comparison.
NoModelsRegressionANOVA
IV TestedSignificant IVR SquareAdj. R SquareFSig.
1P1-P4Constant *, P2 *, P4 *0.040.034.92<0.001
2T1-T5Constant *, T5 *0.030.022.420.031
3S1-S6Constant *, S2–S6 *0.580.5898.11<0.001
4O1-O4Constant *, O1–O3 *, O4 **0.190.1825.45<0.001
5AllP3 *, T3 *, O3 *, S1–S6 *0.600.5969.66<0.001
* Significant at 95% confidence interval; ** Significant at 90% confidence interval.
Table 5. Coefficients comparison.
NoModelsOutputs
VariablesCoef.tSig.VIF
1 (Constant)6.69335.415<0.001
P1Male0.1690.9100.3631.060
P2YoungAdult−0.497−2.3110.0211.110
P3SeniorAdult0.4141.4320.1531.205
P4RegTraveller0.5973.0840.0021.153
2 (Constant)6.67531.181<0.001
T1LongTravelTime−0.010−0.0430.9661.055
T2LongWaitingTime0.0850.1900.8501.049
T3GroupTravel0.2801.4010.1621.058
T4CarrySmallItem0.0100.0450.9641.086
T5CarryLargeItem0.5742.7760.0061.086
3 (Constant)0.8603.2350.001
S1SvcRatingCrowd0.1151.4760.1411.965
S2SvcRatingSafety0.2913.942<0.0011.785
S3SvcRatingRTInfo0.3564.684<0.0011.815
S4SvcRatingPunctuality0.5075.865<0.0012.002
S5SvcRatingFrequency0.3033.697<0.0011.871
S6SvcRatingMgmtResp0.2333.0590.0021.917
4 (Constant)8.73313.015<0.001
O1IssueDelay−0.224−2.5030.0131.012
O2IssuePeakHr−0.908−9.558<0.0011.033
O3ExpectRTInfo0.3252.5490.0111.141
O4ExpectCarReconfig0.2181.6910.0921.120
5 (Constant)0.1010.2520.801
P3SeniorAdult0.4942.850.0051.021
T3GroupTravel−0.261-1.9920.0471.088
O3ExpectRTInfo0.1892.1750.0301.053
S1SvcRatingCrowd0.1622.0820.0382.044
S2SvcRatingSafety0.2713.701<0.0011.817
S3SvcRatingRTInfo0.3704.939<0.0011.823
S4SvcRatingPunctuality0.4755.572<0.0012.020
S5SvcRatingFrequency0.2863.544<0.0011.885
S6SvcRatingMgmtResp0.2833.710<0.0011.984
Disclaimer/Publisher’s Note: The statements, opinions and data contained in all publications are solely those of the individual author(s) and contributor(s) and not of MDPI and/or the editor(s). MDPI and/or the editor(s) disclaim responsibility for any injury to people or property resulting from any ideas, methods, instructions or products referred to in the content.

