Article

Research on the Performance Recovery Strategy Model of Hangzhou Metro Network Based on Complex Network and Tenacity Theory

School of Economics and Management, Liaoning University of Technology, Jinzhou 121001, China
*
Author to whom correspondence should be addressed.
Sustainability 2023, 15(8), 6613; https://doi.org/10.3390/su15086613
Submission received: 20 March 2023 / Revised: 31 March 2023 / Accepted: 6 April 2023 / Published: 13 April 2023

Abstract

:
Based on complex networks and resilience theory, the structural characteristics and post-disaster performance recovery process of the urban metro network are studied to determine the best repair strategy for metro network performance under different scenarios. Specifically: (1) The space-L method is used to model the Hangzhou metro network, and MATLAB software is used to calculate the characteristic parameter values of the Hangzhou metro network structure; (2) A model of the post-disaster resilience of the Hangzhou metro network was constructed, and network efficiency was used as the evaluation index of the resilience level and resilience of the metro network; (3) The performance recovery process of the metro network under different scenarios was simulated and the optimal recovery strategy of the post-disaster metro network was obtained. The results show that the degree values of the Hangzhou metro network nodes are all generally low; the average passage path between nodes is long and the nodes are scattered, which makes the convenience of residents’ travel low. In addition, the degree index and the betweenness have some influence on the recovery order of the failed nodes. Finally, the genetic algorithm solves the post-disaster optimal recovery strategy of the metro network with good results.

1. Introduction

With the continuous advancement of China’s domestic urbanization process and the continuous development of the domestic economy, the population sizes of many cities are maintaining a rising trend, which is accompanied by a rising demand for urban residents to travel. In order to supply residents with more efficient, convenient, and green ways to travel, more and more cities are building metros [1,2,3,4]. Although the opening of a metro can greatly alleviate the traffic pressure in a city, a variety of metro accidents are also on the rise, which would cause great damage to the metro network and even cause mass casualties in serious cases.
As a result, many scholars have carried out research into accidents in metro operations. Among them, some scholars have studied fire incidents in metro networks. Wu et al. [5] used a fire incident in a metro station as a background and analyzed the escape process of people to give suggestions for the evacuation of people in a fire incident. Based on neural network theory, Ji et al. [6] studied the location of the source of a fire in a metro station to help people escape from a fire. Meanwhile, some scholars have studied flooding incidents in metro networks. Li et al. [7] conducted an in-depth analysis of the formation mechanism of flooding accidents in metros and constructed an evolutionary network model of metro flooding disaster chains based on the disaster chain theory, which provides significant guidance for the prevention and management of metro flooding accidents. Wang et al. [8] argued that floods can cause major damage to metro networks, and therefore analyzed the process of metro flooding accidents based on Bayesian network theory, in order to provide a reference for the emergency management of flooding accidents in metro networks. In addition, some scholars have also studied seismic hazards in metro networks. Huang et al. [9] argued that geological hazards bring great challenges and risks to the construction work of urban rail transit and other underground space development projects. Zhong et al. [10] analyzed the impact of earthquakes on metro networks and proposed a method for evaluating the seismic resistance of metro station structures. Jia et al. [11] concluded that earthquakes could have a great impact on metro networks, seriously affecting the structural stability and operational safety of metro stations, and they further investigated the seismic resistance of metro stations in Zhengzhou. Pan et al. [12] compared the seismic resistance of metro stations before and after construction so as to provide a basis for the structural optimization of metro stations.
In order to improve the ability to respond to various unexpected events in metro operations, firstly, the structural characteristics of the metro network should be studied in depth. Based on complex network theory, Ye [13] quantified and analyzed the vulnerability characteristics of the Chongqing metro network and identified key metro stations based on the quantified results. Yuan et al. [14] found that disturbances in the external environment would increase the complexity of the metro network and used the Shanghai metro network as an object to analyze the metro network vulnerability change process in-depth. Song et al. [15] established an index system to quantitatively evaluate the vulnerability of metro networks in order to analyze the vulnerability of the structure of urban metro networks and quantitatively analyzed and evaluated the vulnerability of the Beijing metro network. Shen and Gong [16] made an evaluation method for the vulnerability of urban metro networks, and the research results contributed to the safe operation of metro networks. Bernal and Rey [17] used a quantitative and qualitative analysis of the structural characteristics and robustness of metro networks based on a variety of indicators and validated it with the Madrid metro network. Mariñas-Collado et al. [18] analyzed the structural characteristics of the metro of Barcelona, which could be of great help in the planning of the Barcelona metro network in the future. Zhu et al. [19] analyzed the vulnerability factors of Line 2 in the Fuzhou metro network and proposed measures to reduce the structural vulnerability of the metro network, which contributed to the safety of its operation.
In addition, research on the characteristics of urban metro networks has laid a solid foundation for the research on the resilience of metro networks, and the number of related research results has been increasing. Zhang et al. [20] proposed that the resilience of metro networks can be expressed by the index of network efficiency and subsequently verified this finding by using the Shanghai metro network as a research object. Li et al. [21] proposed that the resilience of a transportation network could be reasonably evaluated in terms of both the total loss of network performance and the speed of recovery when finishing the research on the resilience metrics of the transportation network. Zhang et al. [22] used the network efficiency metric to evaluate the performance of a metro network and used the cumulative loss of the network efficiency of a metro network before and after an attack as a criterion for the assessment of the metro network’s resilience. Huang et al. [23] conducted a study on the resilience of metro stations after fire events based on the resilience theory, and the research results have important implications for improving the security management of metro networks. Cui et al. [24] constructed a resilience evaluation model for metro networks and conducted an empirical research study using the Shanghai metro network as the research object. These research results can help metro operation departments to restore the normal operation of metro networks in the shortest time with limited resources and are helpful to enhance the defensive capability and resilience of metro networks against external attacks. This is of great significance for the sustainability of urban metros.
In summary, many scholars have made in-depth studies on the structural characteristics of metro networks, but the characteristics of metro networks vary from city to city due to different development levels and economic levels, as well as different metro scales. In existing research, there are still relatively few studies on the structural characteristics of the metro network in Hangzhou. On this basis, there are also fewer studies that integrate resilience theory into the study of post-disaster recovery of the metro network in Hangzhou. Therefore, against this background, this paper has researched the structural characteristics and resilience of the metro network in Hangzhou. Firstly, based on complex network theory, this study establishes a topology diagram of the Hangzhou metro network through the space-L method. Secondly, this study presents a comprehensive analysis of the structural complexity of the Hangzhou metro network using the node degree, shortest path length, clustering coefficient, and network connectivity indicators. Finally, this research paper further constructs a post-disaster resilience model of the Hangzhou metro network based on resilience theory and genetic algorithm theory and conducts an empirical analysis. The resilience and recovery of the Hangzhou metro network can be measured by observing the magnitude of changes in the network efficiency, and the optimal recovery strategy can be obtained by simulating the post-disaster recovery process of the metro network under different scenarios. This provides a reference for improving the efficiency of the performance recovery of the Hangzhou metro network as well as the management and maintenance of the metro network in Hangzhou.
This paper consists of five sections, and apart from the introduction in Section 1, the remaining four sections are shown below. In Section 2, the basic situation of the metro network in Hangzhou is introduced and a model of the metro network in Hangzhou is developed. In Section 3, the basic structural characteristics of the Hangzhou metro network are analyzed. In Section 4, the performance recovery model of the metro network is established based on the theory of resilience and genetic algorithm theory, and an empirical analysis is carried out with the metro network of Hangzhou as the object. Finally, in Section 5, the conclusions of the study and the implications of the study are given.

2. Modeling of Hangzhou Metro Network

2.1. Basic Composition Structure of Hangzhou Metro Network

Hangzhou is located in East China, specifically, in Zhejiang Province, China, and it is the capital of Zhejiang Province. At the same time, it is also a member of the Yangtze River Delta city cluster. In addition, Hangzhou was the first city in Zhejiang Province to open a metro. In 2003, the construction of the trial project of Hangzhou Metro Line 1 officially began, and in November 2012, the first metro line in Hangzhou officially opened for trial operation, which marked Hangzhou entering the era of rail transportation. As of May 2022, there are 11 Hangzhou metro lines in operation, namely, Hangzhou metro line 1, Hangzhou metro line 2, Hangzhou metro line 3, Hangzhou metro line 4, Hangzhou metro line 5, Hangzhou metro line 6, Hangzhou metro line 7, Hangzhou metro line 8, Hangzhou metro line 9, Hangzhou metro line 10, and Hangzhou metro line 16, with a total operating mileage of about 420 km. The total mileage of the metropolitan area rail transit line network is about 545 km. The relationships between the nodes of the urban metro network were processed to form a clear and concise two-dimensional image, as shown in Figure 1.

2.2. Network Model of Hangzhou Metro Based on Space-L Method

In order to better reflect the connection between metro stations in the city, the space-L method was used to construct the structural topology diagram of the metro traffic network in Hangzhou. According to the actual construction and operation of the Hangzhou metro network, the metro traffic network consisting of Hangzhou metro lines 1 to 10 and line 16 was selected as the research object, and its structural topology diagram is shown in Figure 2. According to the node scale of the Hangzhou metro network, the connection between nodes can be materialized as a 242 × 242 adjacency matrix.

3. Characterization of Hangzhou Metro Network Structure Based on Space-L Model

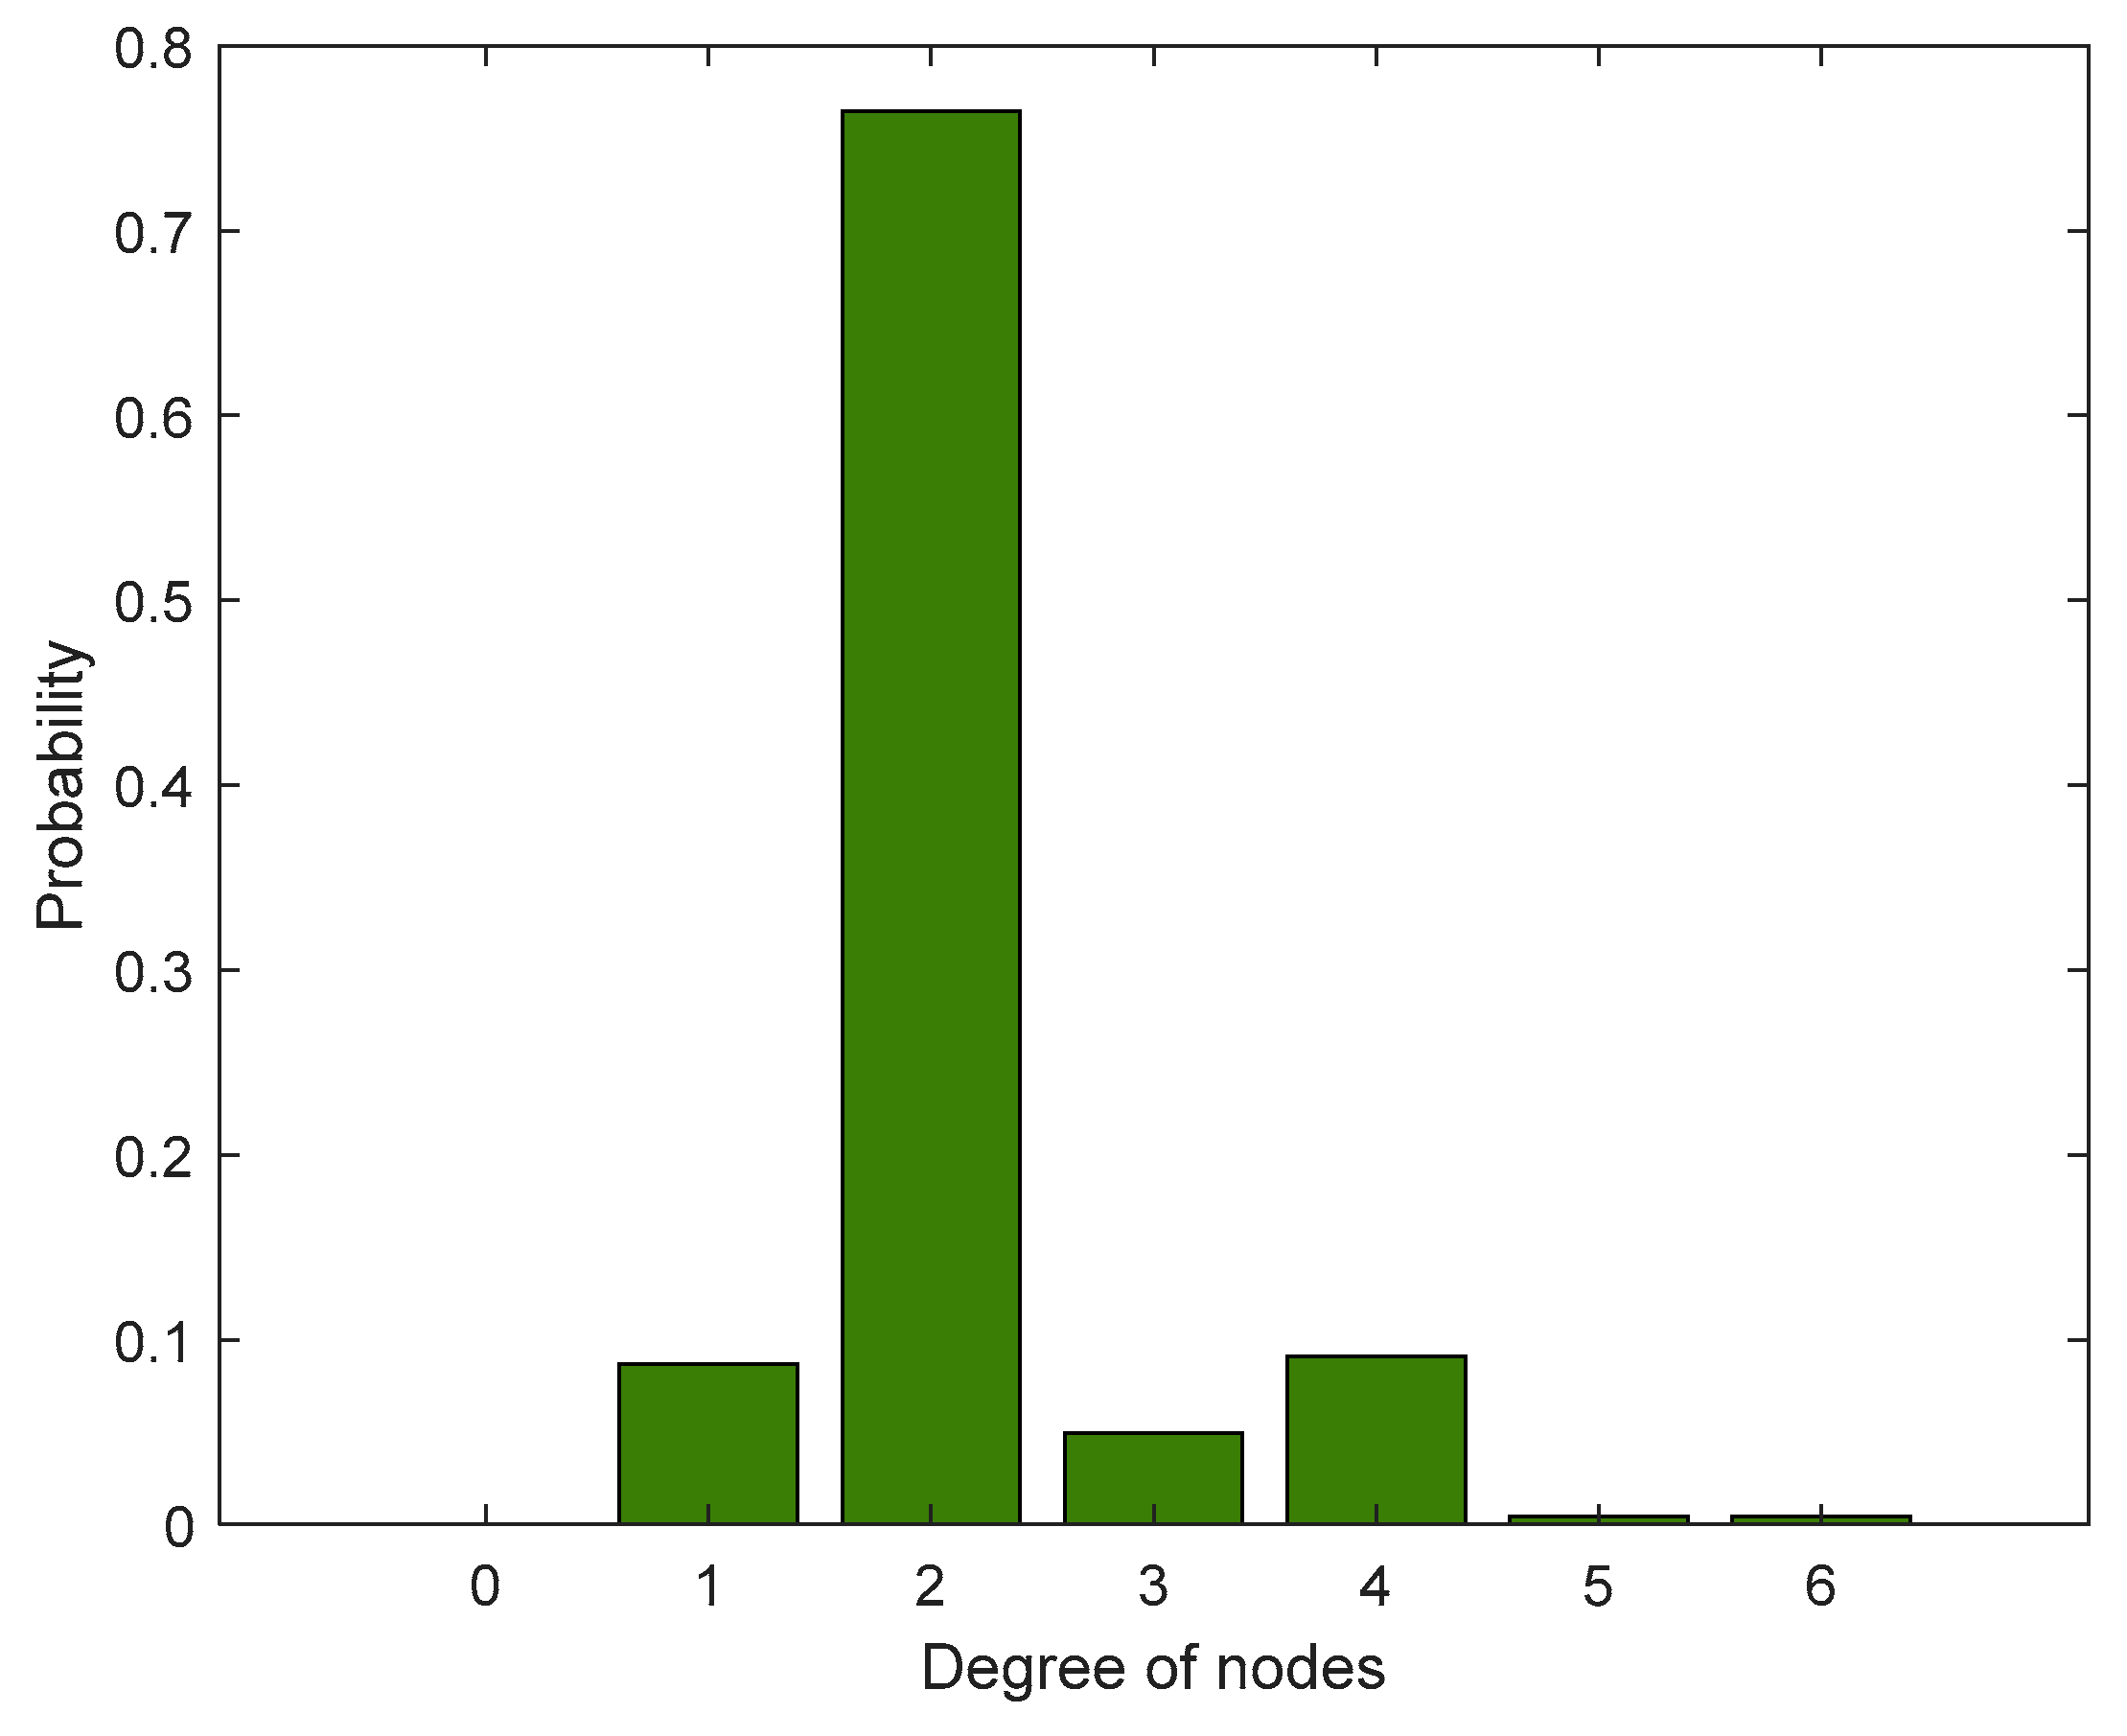
3.1. Characteristics of Node Degree Distribution of Metro Network

Statistically, the Hangzhou metro network contains 242 different stations with 507 network-connected edges. The degree values of the 242 stations in Hangzhou were calculated using MATLAB software, and the distribution probabilities of the nodes’ degree values are counted in Figure 3. The degree values of the nodes in the Hangzhou metro network are mostly concentrated in degree 2, accounting for about 75% of the total number of network nodes. Most of the remaining nodes have degree 4 or 1, a small number of nodes have degree 3, and the number of nodes with degree 5 and degree 6 are both one. The proportion of nodes with degree 4 is 9.09%, the proportion of nodes with degree 1 is 8.68%, the proportion of nodes with degree 3 is 4.96%, and the proportion of nodes with degree 5 and degree 6 is 0.41%. In addition, the average degree of nodes in the Hangzhou metro network is 2.1736, which is because there is a large number of nodes with degree 2 in the network, which are characterized by only undertaking the task of transporting network passengers and not providing interchange and transfer services. Nodes with degree 3 and above are usually the intersection of two or more metro lines, and these nodes need to provide interchange services for passengers, so they are important nodes in the network. Therefore, if a failure occurs, it will cause great impact and damage to the metro network, so the status of these nodes needs extra attention.

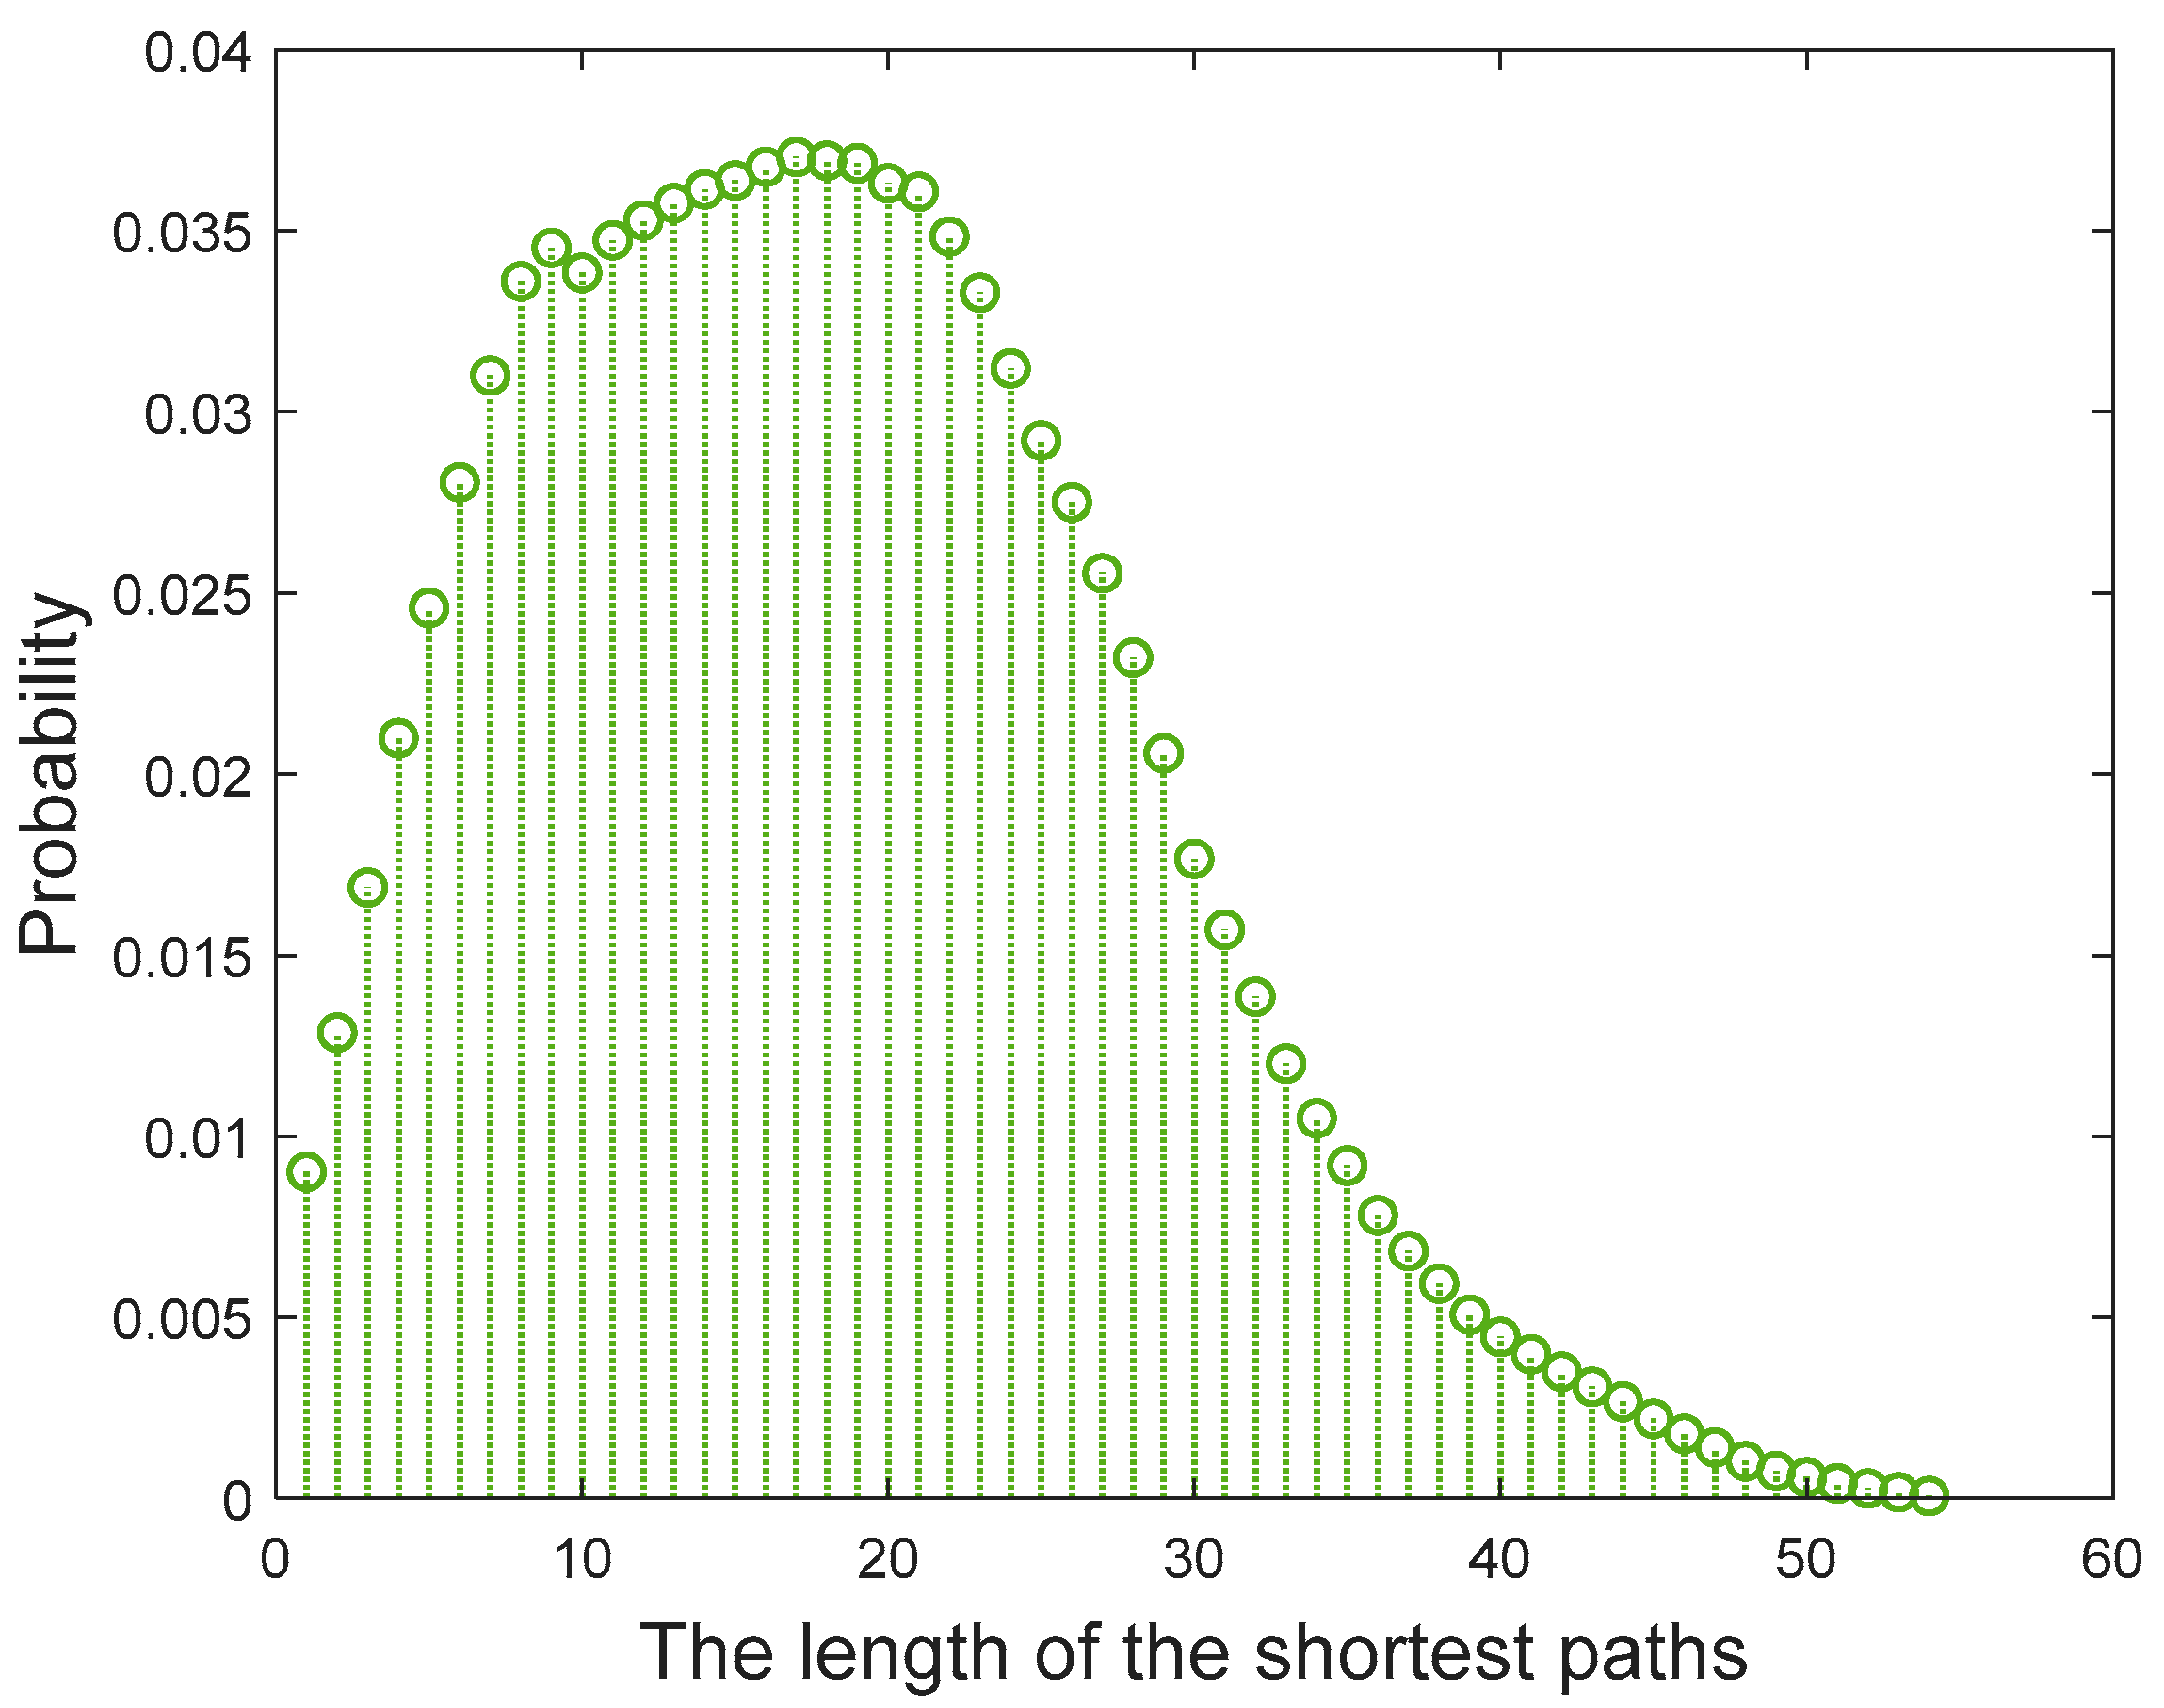
3.2. Distance Distribution Characteristics between Nodes of Hangzhou Metro Network

The distribution of the shortest path length of the Hangzhou metro network is shown statistically in Figure 4. It can be seen that the maximum value of shortest path length and the average shortest path length of the Hangzhou metro network are 54 and 18.2892, respectively, and there is a large gap between them, which means that most travelers can reach their destinations quickly by metro, and the metro lines and metro stations are reasonably planned to meet the emerging demands of most city residents.
Further statistics on the cumulative probability distribution data of the shortest path lengths of the nodes of the Hangzhou metro network are presented in Figure 5. The data show that about more than 78% of the nodes have a shortest path length of over 10, which means that at least 10 edges need to pass between two nodes to achieve connectivity. In addition, 43.87% of the nodes’ shortest paths have a length of more than 20. When the shortest path length rises to 30, the percentage of nodes drops to 13.09%, and when the shortest distance length rises to 40, the percentage of nodes is only 2.64%. Finally, only 0.15% of the metro nodes had a shortest path length of more than 50.
From the distribution of the shortest paths of the Hangzhou metro network stations, any two nodes need to pass through 18.2892 edges on average to achieve connectivity, and the proportion of nodes whose shortest path in the network has a length of more than 20 has exceeded three-quarters, so the residents have higher travel pressure, lower travel convenience, and higher time cost of travel.

3.3. Clustering Analysis of Metro Network

In the study, it was found that the clustering coefficient of the Hangzhou metro network was 0. The distribution of nodes in the network was loose and the degree of aggregation was low. In order to analyze the aggregation degree of network nodes more accurately, the network connectivity index is introduced [25,26], and the connectivity index is expressed by the following formula.
z = E 3 ( n 2 )
where z is the connectivity, and the numerator and denominator are the number of edges and the maximum reachable edges of the metro network, respectively.
The connectivity of the network can be calculated by MATLAB software. The connectivity index is directly related to the number of edges of the network; the more the number of edges of the network, the higher the connectivity of the network. The calculation result shows that the connectivity of the Hangzhou metro network is 0.7042, which indicates that although most of the metro network nodes have only two adjacent nodes, the overall connectivity of the metro network is high. Meanwhile, after analyzing the schematic diagram of the Hangzhou metro network structure shown in Figure 2, it can be seen that the Hangzhou metro network contains a number of closed-loop structures consisting of multiple nodes. These ring structures can contribute to the stability and operational efficiency of the metro network, which is one of the reasons leading to the high connectivity of the Hangzhou metro network. Therefore, in the construction plan of the Hangzhou metro network, the number of such ring-shaped structures can be further increased so that the connectivity of the network and the aggregation of network nodes can be further improved, and the operational efficiency of the whole metro network can be enhanced.

4. Analysis of the Hangzhou Metro Network Performance Recovery Strategy

4.1. Metro Network Resilience Model

4.1.1. Basic Assumptions and Premises

It is assumed that after an external attack on the metro network, there is a certain probability that the attacked stations in the network gradually recover themselves over time and the functionality of the network is subsequently restored. The force that drives this process is defined as the resilience of the metro network. The process of defining the functional recovery of the metro network first needs to satisfy the following five different prerequisites:
(1)
After the metro network undergoes an external attack, the efficiency of the entire network is reduced to a minimum value.
(2)
As the damaged stations are restored, the network efficiency increases simultaneously and rises to the maximum value when the functions of all the damaged stations are restored.
(3)
Once a station in the metro network receives an attack, its function is immediately lost and the functions of neighboring nodes connected to it are also immediately disabled, which is a cascading failure phenomenon.
(4)
The maximum value of the efficiency of the metro network is the efficiency in the initial state, when all metro stations of the network are functioning normally.
(5)
The functions of all damaged nodes are restored, and the time spent on each node is Δ t .
(6)
In a  Δ t time period, only one damaged node’s function can be recovered.

4.1.2. Principle of Calculating the Toughness of Metro Networks

The metro network has a certain degree of toughness, which enables the network to defend against attacks from the outside to a certain extent and enables the network to recover its original functions quickly after being attacked. In the metro network, the network toughness is expressed as the maximum number of nodes that can be damaged in the connected state [27], and the dynamic change of network toughness can be expressed by establishing a two-dimensional coordinate system [28,29], as shown in Figure 6. The metro network suffers from external attacks at the t 0 moment, and the network performance drops to the lowest point. After ( t 1 t 0 ) time, the performance of the metro network returns to the initial state, S ( t ) is the performance level of the metro network at t time, S 0 is the performance level of the metro network after the attack, and S 1 is the initial performance level of the metro network.
If the area of the region where A is located in Figure 6 is defined as the toughness of the network, the area of the region where B is located represents the toughness lost by the metro network throughout the attack, so the formula for calculating the toughness of the network can be defined as the following equation.
R = 1 ( t 1 t 0 ) S 1 t 0 t 1 S ( t ) d t
This paper takes the Hangzhou metro network as the research object and explores the change law of the metro network toughness and resilience by simulating the process of some stations from failure to restoration of function. Assuming an existing metro network consisting of four lines and forty-one nodes together, as shown in Figure 7 below, if five nodes, including nodes 7, 19, 24, 31, and 40, are selected as the initial failure nodes, there are a total of 120 different recovery strategies that can restore the performance of the metro network at this time.
Assuming a recovery strategy of “19 → 7 → 40 → 24 → 31”, restoring the performance of the metro network to its initial state would require five different phases of restoration of the failed metro network nodes: in the first phase, the functionality of station 19 will be restored, and therefore station 19 will be re-established with its adjacent nodes; in the second phase, the functionality of station 7 will be restored, and therefore station 7 will be re-established with its adjacent nodes; in the third phase, the functionality of station 40 will be restored, and therefore station 40 will be re-established with its adjacent nodes; in the fourth phase, the functionality of station 24 will be restored, and therefore station 24 will be re-established with its adjacent nodes; and in the fifth phase, the functionality of station 31 will be restored, and therefore station 31 will be re-established with its adjacent nodes. It can be seen that only one node is restored in each phase, and it is not until the fifth phase is completed that the performance of the metro network is fully restored. At the same time, Huang et al. [30] argued that the resilience of the metro network at different moments is closely related to the network efficiency at the current moment, so we take the network efficiency as a representational parameter of the metro network performance. The network efficiency is defined as shown in Equation (3), which is the average of the sum of the efficiencies of all nodes in the network, while the efficiency of a node refers to the ease and difficulty of information exchange between one node and another node, and usually, the efficiency between two nodes is expressed as the reciprocal of the distance between the two nodes [31]. Therefore, the resilience of the metro network under the recovery strategy “19 → 7 → 40 → 24 → 31” can be defined as shown in Equation (4). The specific forms of Equations (3) and (4) are shown below:
E = i j d i j 1 ( N 1 ) N
where N represents the total number of nodes in the network, and d i j represents the distance between node i and node j .
R = 1 2 × m × E e p = 1 m ( E p E p 1 )
where E e represents the network efficiency of the metro network when it is not under attack; m represents the number of failed nodes in the metro network; p indicates the recovery phase p of this recovery strategy; and E p denotes the network efficiency in phase p .
At this point, based on the principle of genetic algorithm, MATLAB software is used to simulate the recovery process of metro network performance and to filter out the optimal recovery strategy, and the objective function of the genetic algorithm model is defined as follows.
max ( R ) = max ( 1 2 × m × E e p = 1 m ( E p E p 1 ) )

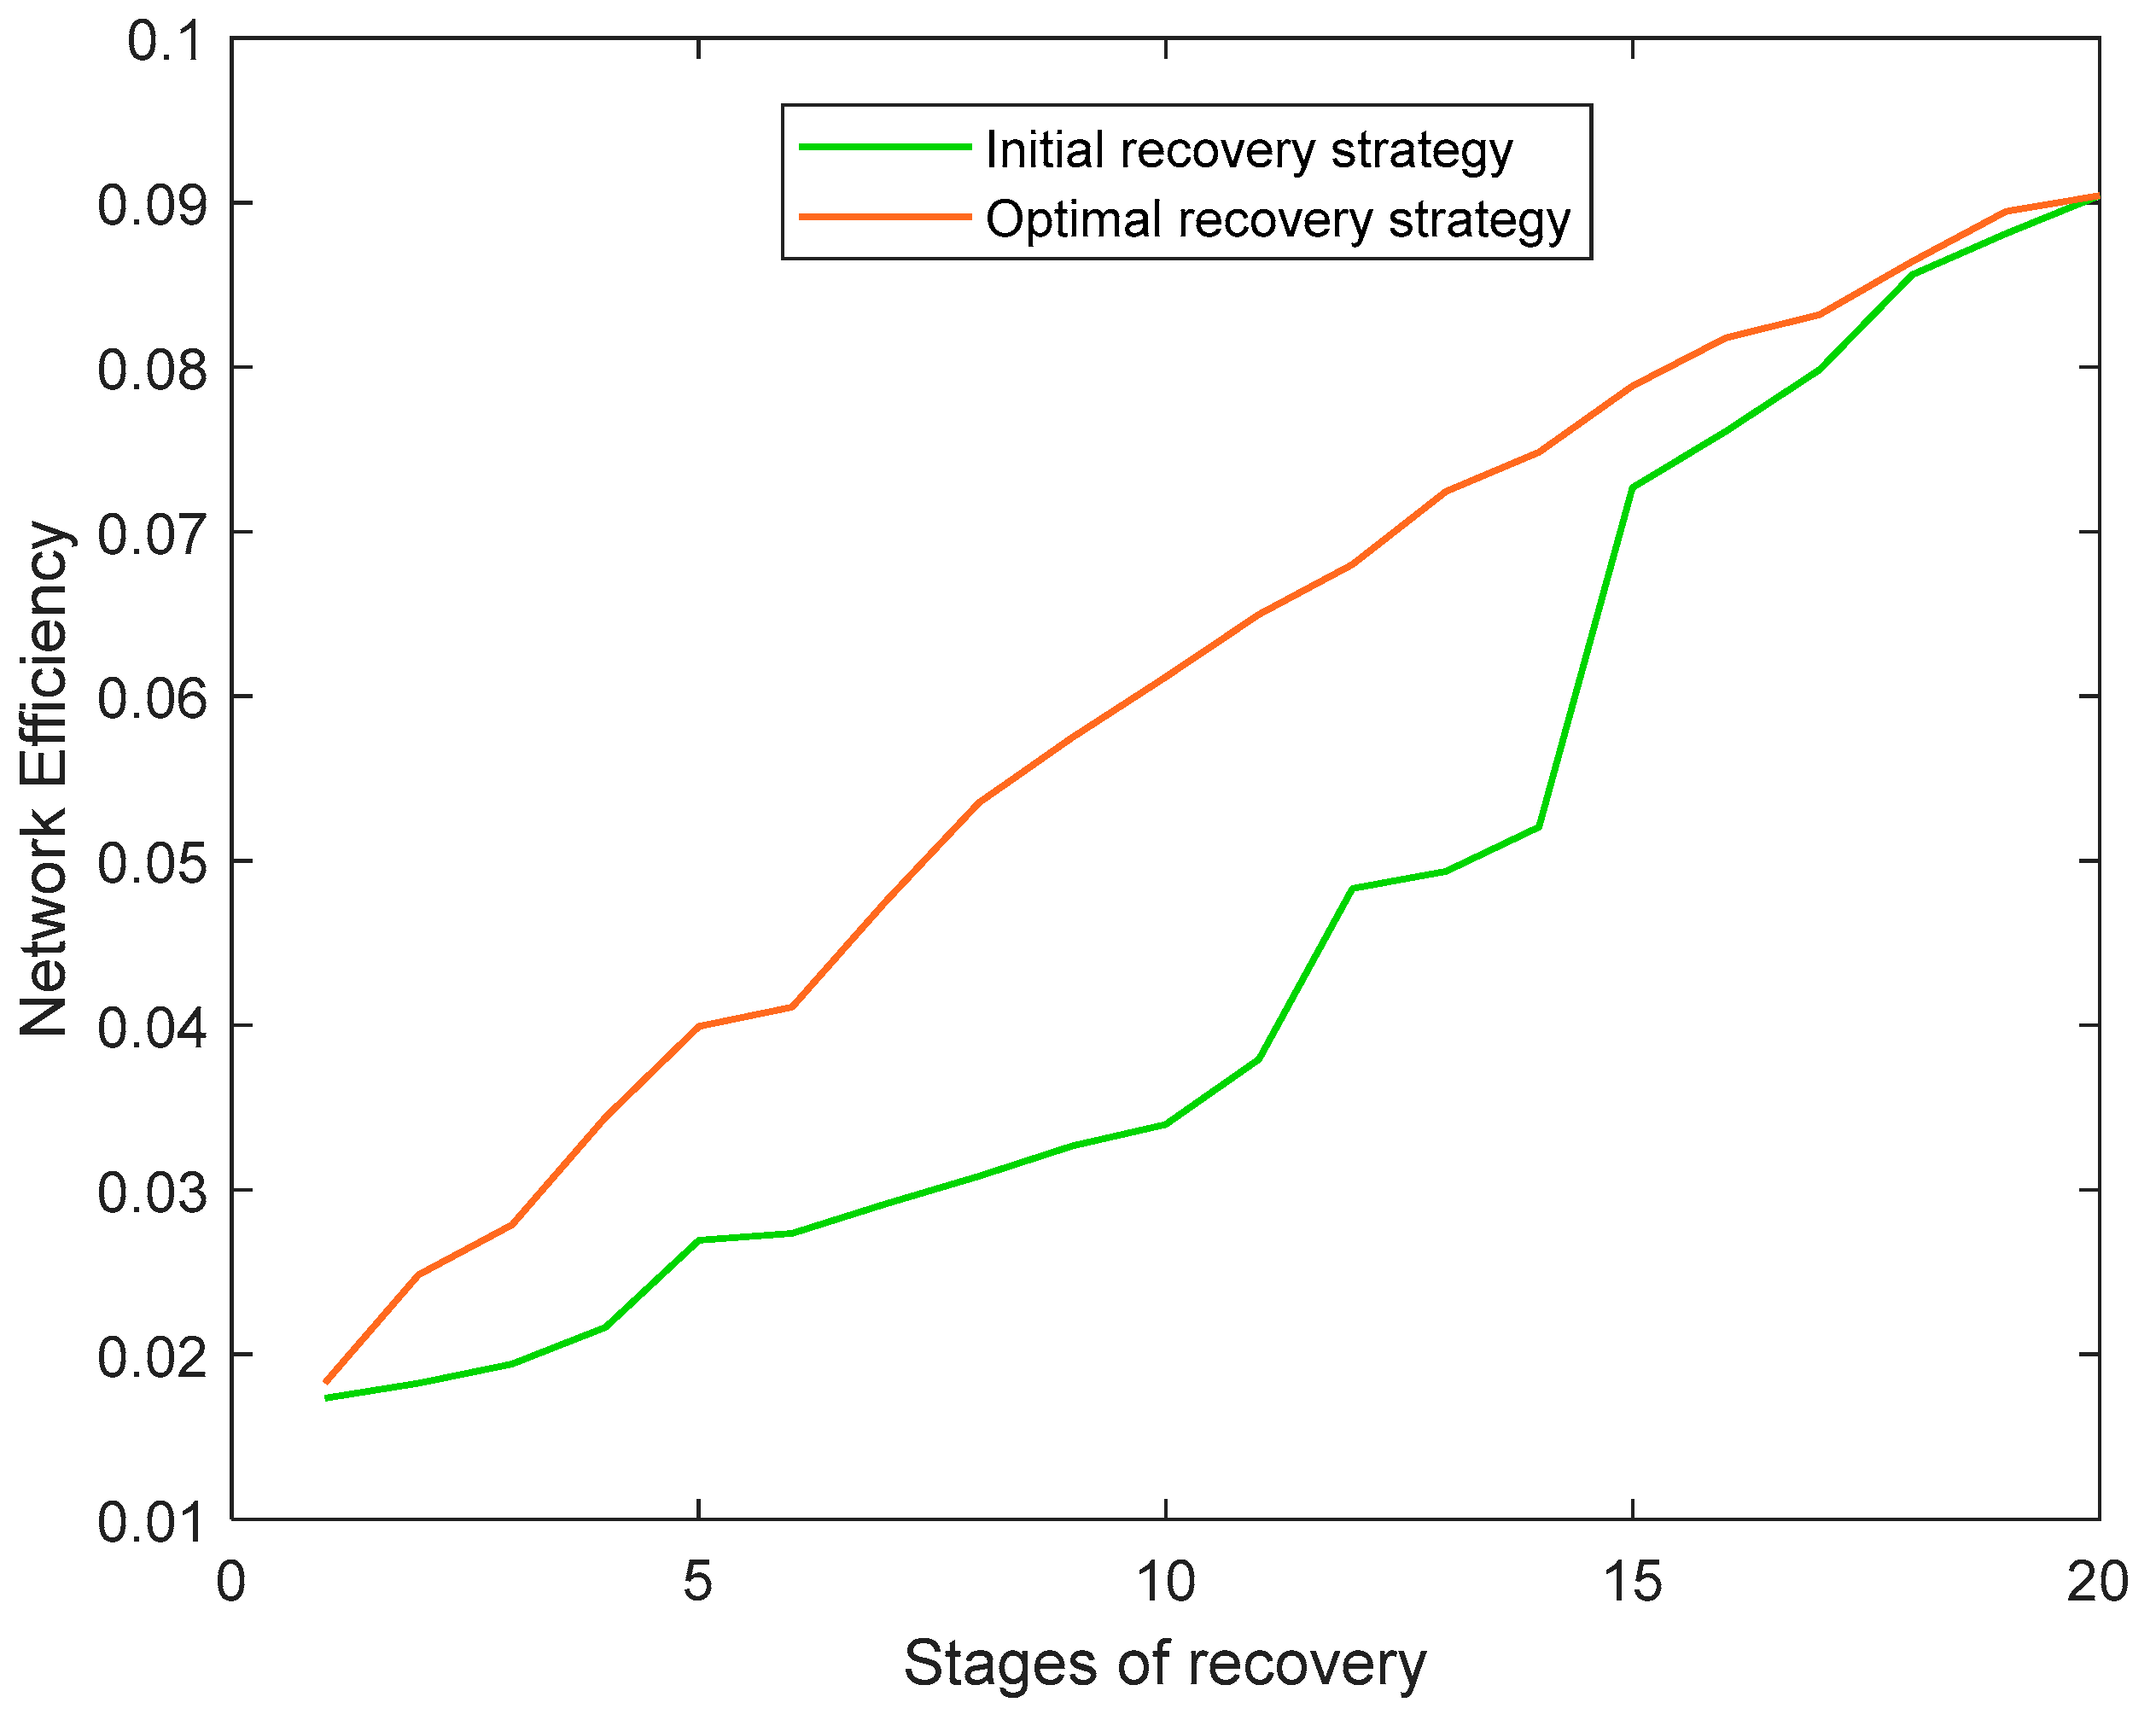
4.2. Simulation Analysis of Post-Disaster Performance Recovery Process of Metro Network

The above part of this paper contains the introduction of the analysis of the basic structural characteristics of the Hangzhou metro network; in this context, the recovery process of the performance of the Hangzhou metro network under different node failure scenarios is further simulated. Firstly, 12 nodes are randomly selected as the initial failure nodes, the number of which is about 5% of the total number of nodes, and the specific information of the nodes is shown in Table 1 below. In addition, another 12 nodes are selected from each of the sets of nodes with degrees 4, 3, 2, and 1, respectively, for comparison tests.
Since 12 nodes are predefined as the initial failure nodes in each simulation scenario, there are 12 recovery stages in the recovery process of the metro network performance. According to the mathematical permutation principle, the 12 nodes are able to form a total of 479,016 different recovery strategies. Due to the huge number of recovery strategies, the genetic algorithm is selected to solve the optimal recovery strategy for the metro network performance under different scenarios. The whole solution process will use the operations of selection, crossover, and variation to generate different recovery strategies. In the experiment, the population size is set to 20, the maximum number of genetic iterations is set to 50, the crossover probability and variation probability are set to 0.8 and 0.2, respectively, and the generation gap is set to 0.7. The evolutionary process is shown in Figure 8 below.
The optimal recovery strategy of the initial population is “205 → 186 → 114 → 67 → 120 → 19 → 118 → 14 → 115 → 50 → 86 → 28” when the maximum recovery of the metro network is 0.7933. The optimal population is obtained after 50 iterations of evolution, and its optimal recovery strategy is “19 → 67 → 114 → 28 → 15 → 86 → 118 → 50 → 186 → 14 → 205 → 120” when the maximum recovery of the metro network is 0.8066. In this optimal mitigation strategy, the first node to be repaired is node 19 (Sanba station) and the last node to be repaired is node 120 (Goujunong station), and after comparing the basic characteristics of these twelve nodes, it was found that the priority nodes to be repaired are all nodes with larger meshes, and their degrees are also larger. The comparison in Figure 9 shows the network performance recovery process of the metro network under the optimal repair strategy of the initial population and the optimal population, and it can be found that the repair effect of the optimal repair strategy of the best population obtained after the evolution is much higher than that of the optimal repair strategy of the initial population.
In addition, 12 nodes in each of the sets of nodes with degrees 1, 2, 3 and 4 are selected for simulation tests, and the simulation test results of the subway network recovery strategy based on the node random selection rule are compared with the simulation test results obtained under these four different scenarios. The comparison results are shown in Figure 10, where scenario 1 is based on the node random selection rule, scenario 2 is the scenario when the node degrees are all one, scenario 3 is the scenario when the node degrees are all two, scenario 4 is the scenario when the node degrees are all three, and scenario 5 is the scenario when the node degrees are all four.
In the scenario where the degrees of the failed nodes are all one, the maximum recovery capacity of the metro network is 0.5647; in the scenario where the degrees of the failed nodes are all two, the maximum recovery capacity of the metro network rises to 0.6582; in the scenario where the degrees of the failed nodes are all three, the maximum recovery capacity of the metro network further rises to 0.7722; and in the scenario where the degrees of the failed nodes are all four, the maximum recovery capacity of the metro network is 0.9490. It is clear that the node degree index has a certain influence on the efficiency of the metro network performance recovery: the higher the degree, the higher the maximum recovery capacity of the metro network in the corresponding scenario. In addition, in the optimal recovery strategies obtained in these four scenarios, the nodes that are repaired in priority are the nodes with larger betweenness, which is more consistent with the results obtained after randomly selecting 12 nodes for simulation.
In order to better investigate the recovery law of the metro network performance, the nodes that are more important for the metro network in Hangzhou were further selected for simulation experiments. Firstly, the data of degree and the data of betweenness of the 242 nodes in the Hangzhou metro network were calculated by using MATLAB; secondly, on this basis, the weights of the betweenness index and degree index were calculated by using the coefficient of variation method [32,33,34], and the importance of the 242 nodes in the Hangzhou metro network could be obtained; finally, the summary statistics of the top 20 nodes were selected to obtain Table 2.
In the experiment, the population size was set to 20, the maximum number of genetic iterations was set to 100, the crossover probability and variation probability were set to 0.8 and 0.2, respectively, and the generation gap was set to 0.7. The initial population underwent a total of 100 iterations of evolution and reached the optimal state after the 29th iteration of evolution, and the final optimal recovery strategy was obtained as “114 → 133 → 193 → 66 → 209 → 105 → 203 → 19 → 67 → 124 → 5 → 88 → 54 → 98 → 11 → 95 → 8 → 15 → 101 → 6”. In this recovery strategy, the node that is recovered first is the node with the highest importance, while the node that is recovered last is the node with the lowest importance. Overall, both the betweenness metric and the degree metric have an impact on the recovery order of nodes, but the degree of their impact differs, with the betweenness metric having a somewhat more significant impact on the recovery order of nodes in comparison. The effect of the optimal mitigation strategy for the initial population and the effect of the optimal mitigation strategy for the population after iterative evolution are shown in Figure 11 below. It is obvious that the optimal recovery strategy obtained by using the genetic algorithm solution can significantly reduce the resilience loss of the metro network, while the metro network performance recovery efficiency is also significantly improved.

5. Conclusions

The focus of this study is to analyze the best solution to repair the performance of the Hangzhou metro network after an external attack, so as to improve the recovery efficiency of the performance of the Hangzhou metro network and avoid major security incidents and economic losses. In order to achieve this goal, this paper first analyzes the complexity of the Hangzhou metro network structure based on complex network theory. Secondly, based on the resilience theory and genetic algorithm theory to establish the post-disaster resilience model of the metro network, the post-disaster performance recovery process of the metro network is simulated under various scenarios and the optimal recovery strategy is solved. The research results show that: (1) The distribution of the degree of nodes in the Hangzhou metro network is more concentrated, and most of the nodes have a degree value of two. However, the extreme difference of the degree of nodes in the Hangzhou metro network is large, with a maximum value of six and a minimum value of one. There are five unit differences between the two, and these data indicate that the nodes are not closely connected to each other. (2) The Hangzhou metro network has several circle-shaped structures, which improves the convenience of travel interchanges. However, the distribution of metro stations is more scattered and the distance between stations is longer, so the network structure has more room for optimization. (3) By comparing the metro network performance recovery process under different scenarios, it is found that the betweenness index has an impact on the priority of node recovery, and the nodes with larger betweenness are more likely to be recovered in priority when other conditions are the same. (4) The genetic algorithm is able to solve the optimal recovery strategy for the metro network performance under different scenarios.
Following the optimal recovery strategy to repair the failed nodes one by one can significantly improve the recovery efficiency of the metro network performance. With the continuous advancement of metro construction projects in Hangzhou, the structure of the Hangzhou metro network will become more and more complex in the future. Based on this background, the research results of this paper can provide a reasonable reference for Hangzhou metro planning as well as experience for metro construction and operation in other cities. In addition, the influence of factors such as manpower, capital, and management level on the recovery efficiency of metro network performance is not considered in the research of this paper, so the research on the recovery law of metro network performance will be further combined with these factors in the future research.

Author Contributions

Conceptualization, X.Y.; methodology, J.W.; software, J.W.; validation, X.Y. and J.W.; formal analysis, J.W.; investigation, X.Y.; resources, X.Y.; data curation, J.W.; writing—original draft preparation, X.Y.; writing—review and editing, X.Y. and J.W.; visualization, J.W.; supervision, X.Y.; project administration, X.Y.; funding acquisition, X.Y. All authors have read and agreed to the published version of the manuscript.

Funding

This work is supported by Scientific Research Project of Education Department of Liaoning Province (LJKMR20220985).

Data Availability Statement

The datasets used and/or analyzed during the current study are available from the corresponding author on reasonable request.

Conflicts of Interest

The authors declare that they have no conflicts of interest to report regarding the present study.

References

  1. Yin, C.C.; Pu, Q.; Li, S.Y. On the Evaluation Index of Service Quality on Urban Rail Transit Based on Passenger Perception. Urban Mass Transit 2014, 17, 78–83+89. [Google Scholar] [CrossRef]
  2. Forestieri, G.; Marseglia, G.; Galiano, G. Recovery and optimization of the former railway transport track in an area of Sud Italy. WIT Trans. Built Environ. 2019, 186, 47–57. [Google Scholar] [CrossRef] [Green Version]
  3. Lin, L.; Ji, G.G.; Tang, L. Evaluation of Urban Rail Transit Operation Service Quality. Railw. Transp. Econ. 2020, 42, 111–116. [Google Scholar] [CrossRef]
  4. Marseglia, G.; Mesa, J.A.; Ortega, F.A.; Piedra de La Cuadra, R.P. A heuristic for the deployment of collecting routes for urban recycle stations (eco-points). Socio-Econ. Plan. Sci. 2022, 82, 101222. [Google Scholar] [CrossRef]
  5. Wu, J.M.; Zhu, S.B.; Hao, X.T.; Hao, S. Research on fire and evacuation simulation of subway transfer station during peak period. Fire Sci. Technol. 2021, 40, 875–879. [Google Scholar]
  6. Jin, J.; Huang, X.; Xu, Q.H. Research on Fire Source Estimation for Deep-buried Metro Station in Fire Accident Based on BP Neural Network. Mod. Tunn. Technol. 2022, 59, 322–331. [Google Scholar] [CrossRef]
  7. Li, H.R.; Ouyang, Z.L.; Jiang, J.; Yang, Q.F.; Liu, B.; Xi, Y.H. Urban Rail Transit Disaster Chain Evolution NetworkModel and Its Risk Analysis-Taking Subway Flood as an Example. Railw. Stand. Des. 2020, 64, 153–157. [Google Scholar] [CrossRef]
  8. Wang, L.; Zhang, C.R.; Huo, Y.N. Construction and evolution analysis of subway flood event scenarios based on Bayes network. Saf. Environ. Eng. 2023, 30, 101–106+172. [Google Scholar] [CrossRef]
  9. Huang, O.B.; Peng, J.B.; Wang, F.Y.; Liu, N.N. Issues and challenges in the development of urban underground space in adverse geological environment. Earth Sci. Front. 2019, 26, 85–94. [Google Scholar] [CrossRef]
  10. Zhong, Z.L.; Shi, Y.B.; Li, J.Q.; Zhao, M.; Du, X.L. Seismic performance assessment of subway station structures considering fuzzy probability of damage states. Chin. J. Geotech. Eng. 2022, 44, 2196–2205. [Google Scholar] [CrossRef]
  11. Jia, Y.J.; Zhang, Y.F.; Du, P.Z. Seismic analysis of a complex subway station in zhengzhou. Earthq. Resist. Eng. Retrofit. 2022, 44, 113–118. [Google Scholar] [CrossRef]
  12. Pan, H.; Han, Y.Z.; Nie, X.F.; Zhang, L.W.; He, J.Z. Seismic performance analysis of a subway transfer station before and after construction in Beijing. Build. Struct. 2022, 52, 826–830. [Google Scholar] [CrossRef]
  13. Ye, Q. Vulnerability Analysis of Rail Transit Based on Complex Network Theory. China Saf. Sci. J. 2012, 22, 122–126. [Google Scholar] [CrossRef]
  14. Yuan, J.F.; Li, Q.M.; Jia, R.Y.; Wang, Z.R. Analysis of Operation Vulnerabilities of Urban Metro Network System. China Saf. Sci. J. 2012, 22, 92–98. [Google Scholar] [CrossRef]
  15. Song, S.X.; Duan, X.H.; Zhao, J.D. Vulnerability Assessment of Mass Passenger Flow in Subway Station Based on Catastrophe Theory. J. Wuhan Univ. Technol. (Inf. Manag. Eng.) 2017, 39, 125–129. [Google Scholar] [CrossRef]
  16. Shen, Y.D.; Gong, J. Vulnerability assessment of urban metro network based on region partitioning. J. Syst. Eng. 2018, 33, 289–297+307. [Google Scholar] [CrossRef]
  17. Bernal, E.F.; Rey, A.M.D. Study of the Structural and Robustness Characteristics of Madrid Metro Network. Sustainability 2019, 11, 3486. [Google Scholar] [CrossRef] [Green Version]
  18. Mariñas-Collado, I.; Frutos Bernal, E.; Santos Martin, M.T.; Martín del Rey, A.; Casado Vara, R.; Gil-González, A.B. A Mathematical Study of Barcelona Metro Network. Electronics 2021, 10, 557. [Google Scholar] [CrossRef]
  19. Zhu, Y.Y.; Li, X.J.; Li, L.L. Research on vulnerability risk assessment of subway network. J. Harbin Univ. Commer. (Nat. Sci. Ed.) 2021, 37, 450–455. [Google Scholar] [CrossRef]
  20. Zhang, D.M.; Du, F.; Huang, H.W.; Zhang, F.; Ayyub, B.M.; Beer, M. Resiliency assessment of urban rail transit networks: Shanghai metro as an example. Saf. Sci. 2018, 106, 230–243. [Google Scholar] [CrossRef]
  21. Li, Z.L.; Jin, C.; Hu, P.; Wang, C. Resilience-based recovery strategy optimization in emergency recovery phase for transportation networks. Syst. Eng.—Theory Pract. 2019, 39, 2828–2841. [Google Scholar] [CrossRef]
  22. Zhang, J.F.; Ren, G.; Ma, J.F.; Gao, J.Y.; Zhu, X. Decision-making method of repair sequence for metro network based on resilience evaluation. J. Transp. Syst. Eng. Inf. Technol. 2020, 20, 14–20. [Google Scholar] [CrossRef]
  23. Huang, Y.J.; Li, S.Q.; Xiang, S.S. Evaluation of Subway Fire Safety Resilience based on AHP-PSO Fuzzy Combination Weighting Method. J. Catastrophol. 2021, 36, 15–20+40. [Google Scholar] [CrossRef]
  24. Cui, X.; Lu, Q.C.; Xu, B.; Li, J. Resilience Evaluation and Failure Recovery Strategy of Metro Network Considering Bus Connection Scenario. Urban Rapid Rail Transit 2023, 36, 93–98. [Google Scholar] [CrossRef]
  25. Yi, C.Q.; Bao, Y.Y.; Jiang, J.C.; Xue, Y.B. Mitigation strategy against cascading failures on social networks. China Commun. 2014, 11, 37–46. [Google Scholar] [CrossRef]
  26. Lai, Q.; Zhang, H.H.; Wang, X.X. Robustness Analysis and Optimization of Urban Public Transport Network Based on Complex Network Theory. Comput. Eng. Appl. 2022, 58, 249–254. [Google Scholar] [CrossRef]
  27. Henry, D.; Ramirez-Marquez, J.E. Generic metrics and quantitative approaches for system resilience as a function of time. Reliab. Eng. Syst. Saf. 2012, 99, 114–122. [Google Scholar] [CrossRef]
  28. Li, R.Q.; Huang, H.; Zhou, R. Resilience curve modelling of urban safety resilience. J. Tsinghua Univ. (Sci. Technol.) 2020, 60, 1–8. [Google Scholar] [CrossRef]
  29. Bruneau, M.; Chang, S.E.; Eguchi, R.T.; Lee, G.C.; O’Rourke, T.D.; Reinhorn, A.M.; Shinozuka, M.; Tierney, K.; Wallace, W.A.; Winterfeldt, D.V. A framework to quantitatively assess and enhance the seismic resilience of communities. Earthq. Spectra 2003, 19, 733–752. [Google Scholar] [CrossRef] [Green Version]
  30. Huang, Y.; Liu, M.R.; Wei, J.G.; Xiong, W.W. Research on Urban Metro Network Recovery Strategy Based on Resilience Curve. J. Catastrophol. 2021, 36, 32–36. [Google Scholar] [CrossRef]
  31. Lv, B.; Guan, X.Y.; Gao, Z.Q. Evaluation and Optimal Recovery Strategy of Metro Network Service Resilience. J. Transp. Syst. Eng. Inf. Technol. 2021, 21, 198–205+221. [Google Scholar] [CrossRef]
  32. Wang, N.; Li, Q.Z.; Zhao, L.C.; Wang, H.Y.; Li, D.Q.; Huang, H.P. Optimization Analysis in Ship Detection with High-resolution SAR Images based on Variation Coefficient Method. Remote Sens. Technol. Appl. 2017, 32, 305–314. [Google Scholar] [CrossRef]
  33. Yu, L.P.; Zheng, K. Comparison and Consideration of Different Objective Weighting Methods in Journal Evaluation. J. Mod. Inf. 2021, 41, 121–130. [Google Scholar] [CrossRef]
  34. Zheng, L.X.; Wang, J.M. Analysis of spatial and temporal evolution characteristics of Wuhan metropolitan area co-location level measurement. Stat. Decis. 2022, 38, 77–81. [Google Scholar] [CrossRef]
Figure 1. Node connection diagram of Hangzhou metro network.
Sustainability 15 06613 g001
Figure 2. Topology of Hangzhou metro network based on space-L method.
Sustainability 15 06613 g002
Figure 3. Distribution of node degree values.
Sustainability 15 06613 g003
Figure 4. Distribution probability of the shortest path length of the metro network.
Sustainability 15 06613 g004
Figure 5. Cumulative distribution probability of shortest paths in the metro network.
Sustainability 15 06613 g005
Figure 6. Schematic diagram of the change law of the toughness of the metro network.
Sustainability 15 06613 g006
Figure 7. Metro network structure diagram.
Sustainability 15 06613 g007
Figure 8. Optimization process of metro network recovery strategy based on random selection rules.
Sustainability 15 06613 g008
Figure 9. Recovery process of metro network performance based on random selection rules.
Sustainability 15 06613 g009
Figure 10. Comparison of the optimization process of recovery strategies based on node degree ranking.
Sustainability 15 06613 g010
Figure 11. Performance recovery process of metro network under a mass critical station failure scenario.
Sustainability 15 06613 g011
Table 1. Information on the nodes.
Node Serial NumberNode Name
114Qianjiang Road Station
15College Road Station
50Hang Xing Road Station
67Shanxian Station
19Sanba Station
28Luting Road Station
86The East Railway Station
118Xintang Station
186Kanshan Station
205Jianghui Road Station
14Xianingqiao Station
120Goujunong Station
Table 2. Statistics of the top 20 nodes in terms of importance.
Ranking of Node
Importance
Node Serial
Number
Node Name
1114Qianjiang Road Station
215College Road Station
3133Passenger Transportation Center Station
466Xintiandi Street Station
519Sanba Station
667Shanxian Station
7124Sanbao Station
811Fengqi Road Station
98City Station
10196Qianjiang Century City Station
1195North Jianguo Road Station
1288Datieguan Station
13101Nanxingqiao Station
14105Zhejiang Chinese Medical University Station
1598Jiangcheng Road Station
1654Hemu Station
175Jiangling Road Station
18209People’s Square Station
19203Changhe Station
206Jinjiang Station
Disclaimer/Publisher’s Note: The statements, opinions and data contained in all publications are solely those of the individual author(s) and contributor(s) and not of MDPI and/or the editor(s). MDPI and/or the editor(s) disclaim responsibility for any injury to people or property resulting from any ideas, methods, instructions or products referred to in the content.

