Article

Experimental Study on the Adhesive Fuel Features of Inclined Wall-Impinging Spray at Various Injection Pressure Levels in a Cross-Flow Field

1
Department of Mechanical Engineering, School of Engineering, University of Birmingham, Edgbaston, Birmingham B15 2TT, UK
2
Mechanical Engineering Program, Graduate School of Advanced Science and Engineering, Hiroshima University, 1-4-1 Kagamiyama, Higashi-Hiroshima 739-8527, Japan
3
Department of Automotive Engineering, Hebei Jiaotong Vocational and Technical College, Shijiazhuang 050035, China
4
College of Power and Energy Engineering, Harbin Engineering University, Harbin 150001, China
*
Author to whom correspondence should be addressed.
Sustainability 2023, 15(7), 6312; https://doi.org/10.3390/su15076312
Submission received: 7 February 2023 / Revised: 25 March 2023 / Accepted: 4 April 2023 / Published: 6 April 2023

Abstract

:
The wall-impingement phenomenon significantly impacts mixture formation, combustible performance, and pollutant release in DISI engines. However, there is insufficient knowledge regarding the behavior of fuel adhesion. Thus, here, we examine adhesive fuel features at various injection pressure levels (5 and 10 MPa) in a cross-flow field (0 to 50 m/s). The RIM optical method was employed to track the expansion and distribution of fuel adhesion. As a result, adhesive fuel features such as area, mass, thickness, and lifetime were assessed. Postprocessing image analysis reveals that fuel adhesion was consistently thinner at the edge region. With increased injection pressure, the cross flow led to a rise in the fuel-adhesion area and mass; however, small changes in pressure did not affect adhesive thickness. Adhesive thickness significantly decreased in the cross flow, indicating enhanced evaporation potential. Furthermore, lifetime prediction was conducted to quantitatively evaluate the impact of cross flow and injection pressure upon fuel adhesion, which could be calculated by examining the decreasing trend in adhesive area. Results show that the lifetime was dramatically reduced with higher cross-flow velocity, and slightly decreased with lower injection pressure. Under injection pressure of 10 MPa, the adhesive lifetime in the cross-flow field of 50 m/s was reduced by 77.5% compared with the static flow field (0 m/s). The experimental results provide corresponding guidance for low-carbon fuel utilization and emission reduction in DISI engines.

1. Introduction

The DISI engine, known for its superior fuel economy and high thermal efficiency, is increasingly popular in the field of ICEs [1]. During the transitional stage towards carbon neutrality, it is also essential to enhance the efficiency and reduce the emissions of ICEs [2]. Nevertheless, DISI engines face challenges arising from increased injection pressure and reduced cylinder volume, which inevitably cause fuel spray impingements on piston or cylinder-wall surfaces [3]. Fuel adhesion can occur after wall impinging, which slows down the fuel evaporation rate and forms a fuel-rich zone just above the wall, leading to an increase in emissions [4,5]. As a result, reducing fuel adhesion is a key strategy in emission mitigation. Therefore, it is very important to explore and comprehend the underlying formation and expansion mechanisms of fuel adhesion on flat walls.
The effects of multiple variables on adhesive fuel features have been thoroughly investigated. Wall parameters such as the impingement distance and angle [6,7], wall roughness [8,9], and temperature [10,11] play a critical role on adhesive features. Wang et al. [6] compared the adhesive features of the initial conditions of dry and wet walls using the laser-induced fluorescence (LIF) optical method. Results demonstrated that the impingement angle was quite important for the distribution of fuel adhesion. Smaller and thicker fuel adhesion was much more likely to appear on the wet-wall surface. According to Cheng et al. [7], the fuel-adhesion area and thickness both decreased as impingement distance increased. Furthermore, the thicker adhesion area increased as the impinging degree decreased. Luo et al. [8] found that the distribution uniformity decreased as wall roughness increased. In addition, Kobayashi et al. [9] found that the lifetime decreased as wall roughness increased. Saito et al. [10] proposed that the fuel-adhesion area is significantly affected by the wall temperature. The influence of the wall temperature was further experimentally and numerically studied by Jüngst et al. [11], who found that the wall temperature determined the fuel-adhesion temperature, and the evaporation rate increased as the wall temperature increased. In addition, injection and ambient parameters such injection and ambient pressure [12,13,14,15], injection duration [16,17], the dwell time of spilt injections [18], injection timing [19], and ambient temperature [19] have a strong effect on adhesive features. Xiao et al. reported that the horizontal diffusion distance of the spray was larger than the width of fuel adhesion [12]. In addition, the fuel-spray expansion was more susceptible to ambient pressure than it was to fuel adhesion. Luo et al. examined adhesive features with various injection and ambient pressure levels at different ambient temperature conditions using the refractive index matching (RIM) optical method [13,14]. They found that fuel adhesion increased with injection pressure in room temperature, but it showed a different tendency in higher ambient temperature. Regardless of ambient temperature, a rise in ambient pressure might enhance fuel adhesion. Maligne et al. discovered that fuel adhesion increased with a longer injection time [16]. Wang et al. investigated split-injection strategies on fuel-adhesion formation [18], and increasing the dwell time could decrease both the concentration and dense adhesion lifetime. Wu et al. postulated that the rate at which fuel adhesion forms increases quickly as the injection timing is brought forward [19]. According to a previous investigation [20,21,22], fuel adhesion was inversely related to ambient temperature, which means that an expanded high-temperature zone helps in accelerating the evaporation and combustion of fuel adhesion. Adhesive-distribution uniformity is improved with an increase in ambient temperature. Furthermore, adhesive fuel features are affected by fuel parameters such as type [23] and temperature [24,25]. Liu et al. [23] proposed that there is a critical adhesive thickness level that triggers boiling behavior, and the critical adhesive thickness of various types of fuel was strongly dependent on their surface tension. Schulz et al. [24] found that fuel adhesion did not always decrease with fuel temperature. When the fuel temperature reached a threshold value, a phenomenon called spray constriction occurs as a result of flashing in which a concentrated mass of fuel adhesion forms in a localized zone. This means that emissions could be increased by delaying the evaporation process. Critical temperatures were developed for various fuel types to prevent fuel adhesion. Most researchers focus on adhesive features created by impinging spray in order to prevent the formation of fuel adhesion. Most of them, however, did not consider the air-flow effect, which should be investigated further because air flow inside the cylinder has an unavoidable effect on adhesive fuel features [26,27].
Recently, Shunsuke et al. [28] simulated a port fuel injection and examined the adhesive fuel features within the intake port. In most cases, cross flow is capable of simulating air-flow movement inside the cylinder [29,30], which is quite important at the end of the exhaust period [31]. A significant number of studies have been performed on the topic of cross flow. Guo et al. focused on free spray from the perspectives of macroscopic spray morphology, flow field analysis, and microscopic droplet distribution [32,33]. Their results showed that the droplets distributed upstream of the flow field were obviously larger than those distributed downstream. Numerous small droplets were blown downstream to form a thin spray region, and their movement speed was similar to the cross-flow velocity. In addition, the spray pattern of the Karman vortex street occurred downstream. However, limited research has focused on wall-impinging spray behavior, particularly adhesive features after impingement. Si et al. [34] investigated the features of the impinging spray from macroscopic and microscopic perspectives, and compared the spray shape before and after the fuel impinging on the wall, and the droplet size and velocity. As a result, the shape of a vortex could be seen in the spray head region, and the overall area could be expanded as the cross-flow velocity increased. Li et al. [35] reported that the dispersion of the wall-impinging spray was enhanced as the cross-flow velocity increased. Furthermore, Zhang et al. quantitatively analyzed the wall-jet vortex formed by the spray impinging on the wall [36]. A contributive factor was proposed to assess the influence degree of cross flow on vortex structures, and the vortex core height could be greatly increased with a cross-flow effect at a higher ambient pressure. Subsequently, the fuel-adhesion mechanism was revealed with a horizontal flat wall in the cross-flow field [37]. Results demonstrated that fuel adhesion alternated between the thick and thin regions. The cross flow could accelerate the evaporation of fuel adhesion. Although some studies focused on wall-impingement spray, no studies have reported on the adhesive features of inclined wall-impinging spray at various injection pressure levels with cross flow, which is quite important for the sustainable design of DISI engines. Additionally, simulation work is important for the prediction of adhesive features, but there is a lack of research on the subject. Safiullah et al. investigated spray and droplet behaviors with various nozzle-hole diameter and injection pressure levels using a simulation tool, finding that smaller holes with higher injection pressure had larger spray angles and better atomization [38,39,40].
The above literature review shows that it is crucial to conduct a comprehensive investigation on the formation and expansion of fuel adhesion in a cross-flow field while considering the effect of injection pressure. To address this research gap, fuel adhesion at various injection pressure levels within a cross-flow environment was analyzed as follows. First, the RIM optical method was employed to acquire the raw images of microscopic fuel adhesion. Next, a MATLAB code was utilized to process the raw images, and adhesive fuel features, including fuel-adhesion area, mass, and thickness could then be obtained. Moreover, the distribution and expansion mechanism of fuel adhesion was further revealed. Lastly, the fuel-adhesion lifetime was predicted using the expansion tendency of the fuel-adhesion area.

2. Experimental Equipment and Method

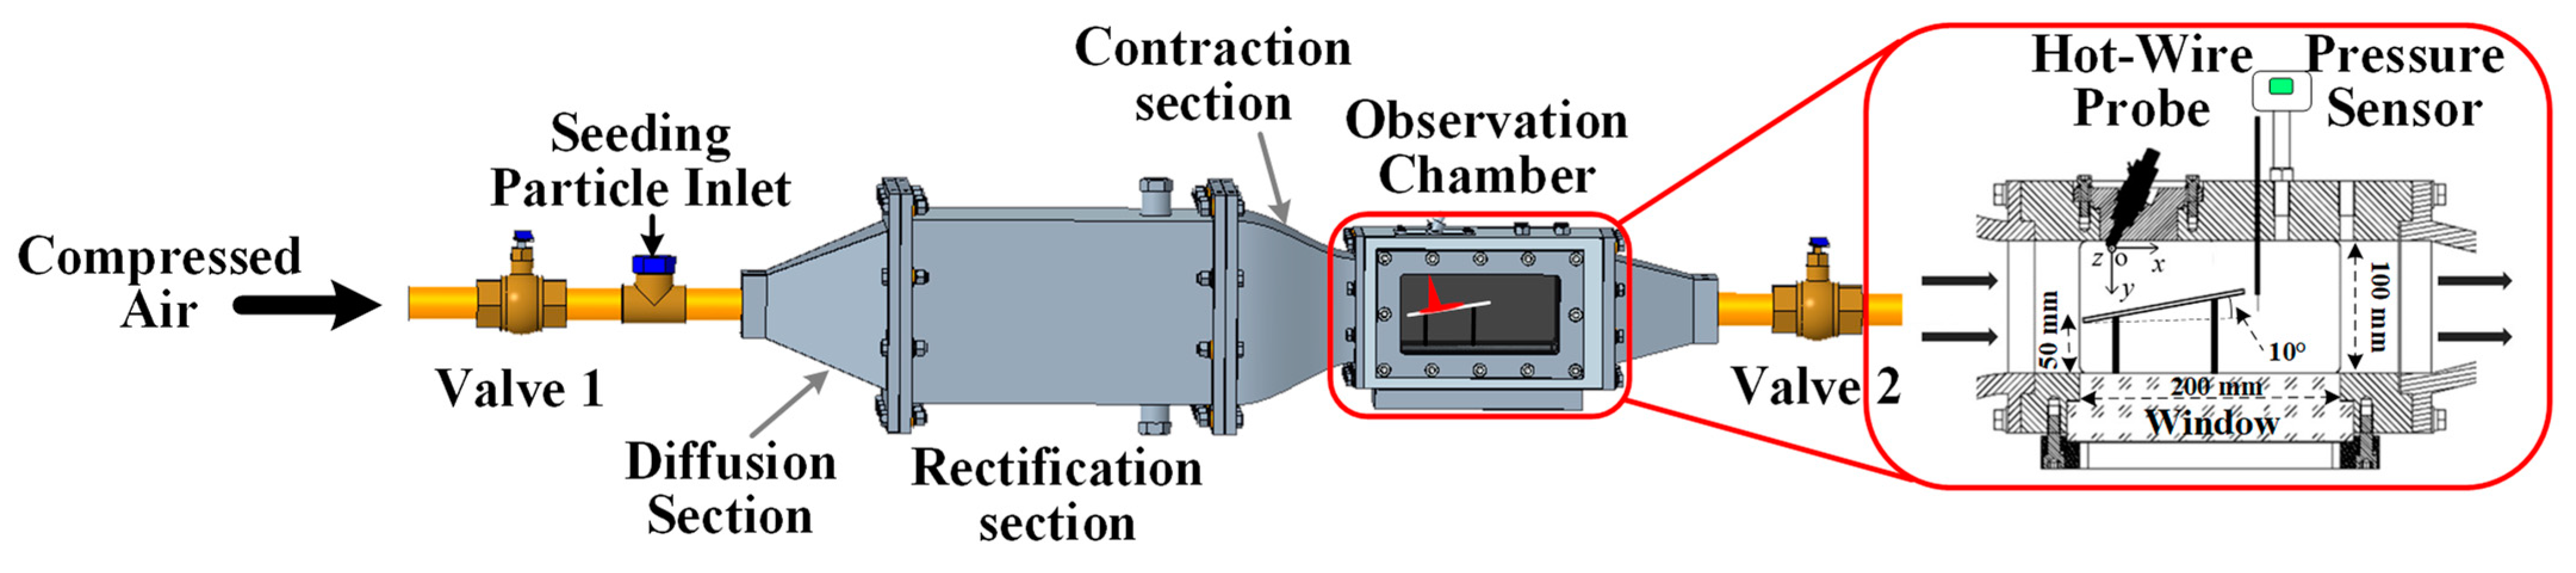
2.1. Wind Tunnel and Experimental Conditions

Figure 1 illustrates the cross-flow wind tunnel and observation chamber that enabled the creation of a uniform cross-flow environment for examining the wall-impingement spray and fuel adhesion. The cross-flow velocity and ambient pressure could be adjusted simultaneously using two throttle valves and metal covers installed upstream and downstream, respectively. For the atmospheric-pressure investigations, the metal cover had to be entirely opened, and the appropriate cross-flow velocity could be achieved by adjusting Throttle Valve 1. For the higher-ambient-pressure investigations, the metal cover had to be kept closed. By adjusting the two valves simultaneously in this case, the desired experimental conditions could be achieved. To complete the wall-impingement experiment, a 7.7 μm rough-surface quartz glass panel was employed at a 10° angle in the observation chamber, allowing fuel spray to impinge upon the inclined wall.
Table 1 presents the comprehensive experimental conditions employed in this work. Toluene, the test fuel, was introduced into the cross-flow environment using a mini-sac single-hole injector at injection pressure of 5 and 10 MPa with a consistent injection pulse of 2.8 ms. The cross-flow velocity varied: 0, 10, 30, or 50 m/s. The experiments were conducted under standard atmospheric pressure and room temperature. Table 1 shows additional experimental parameters.

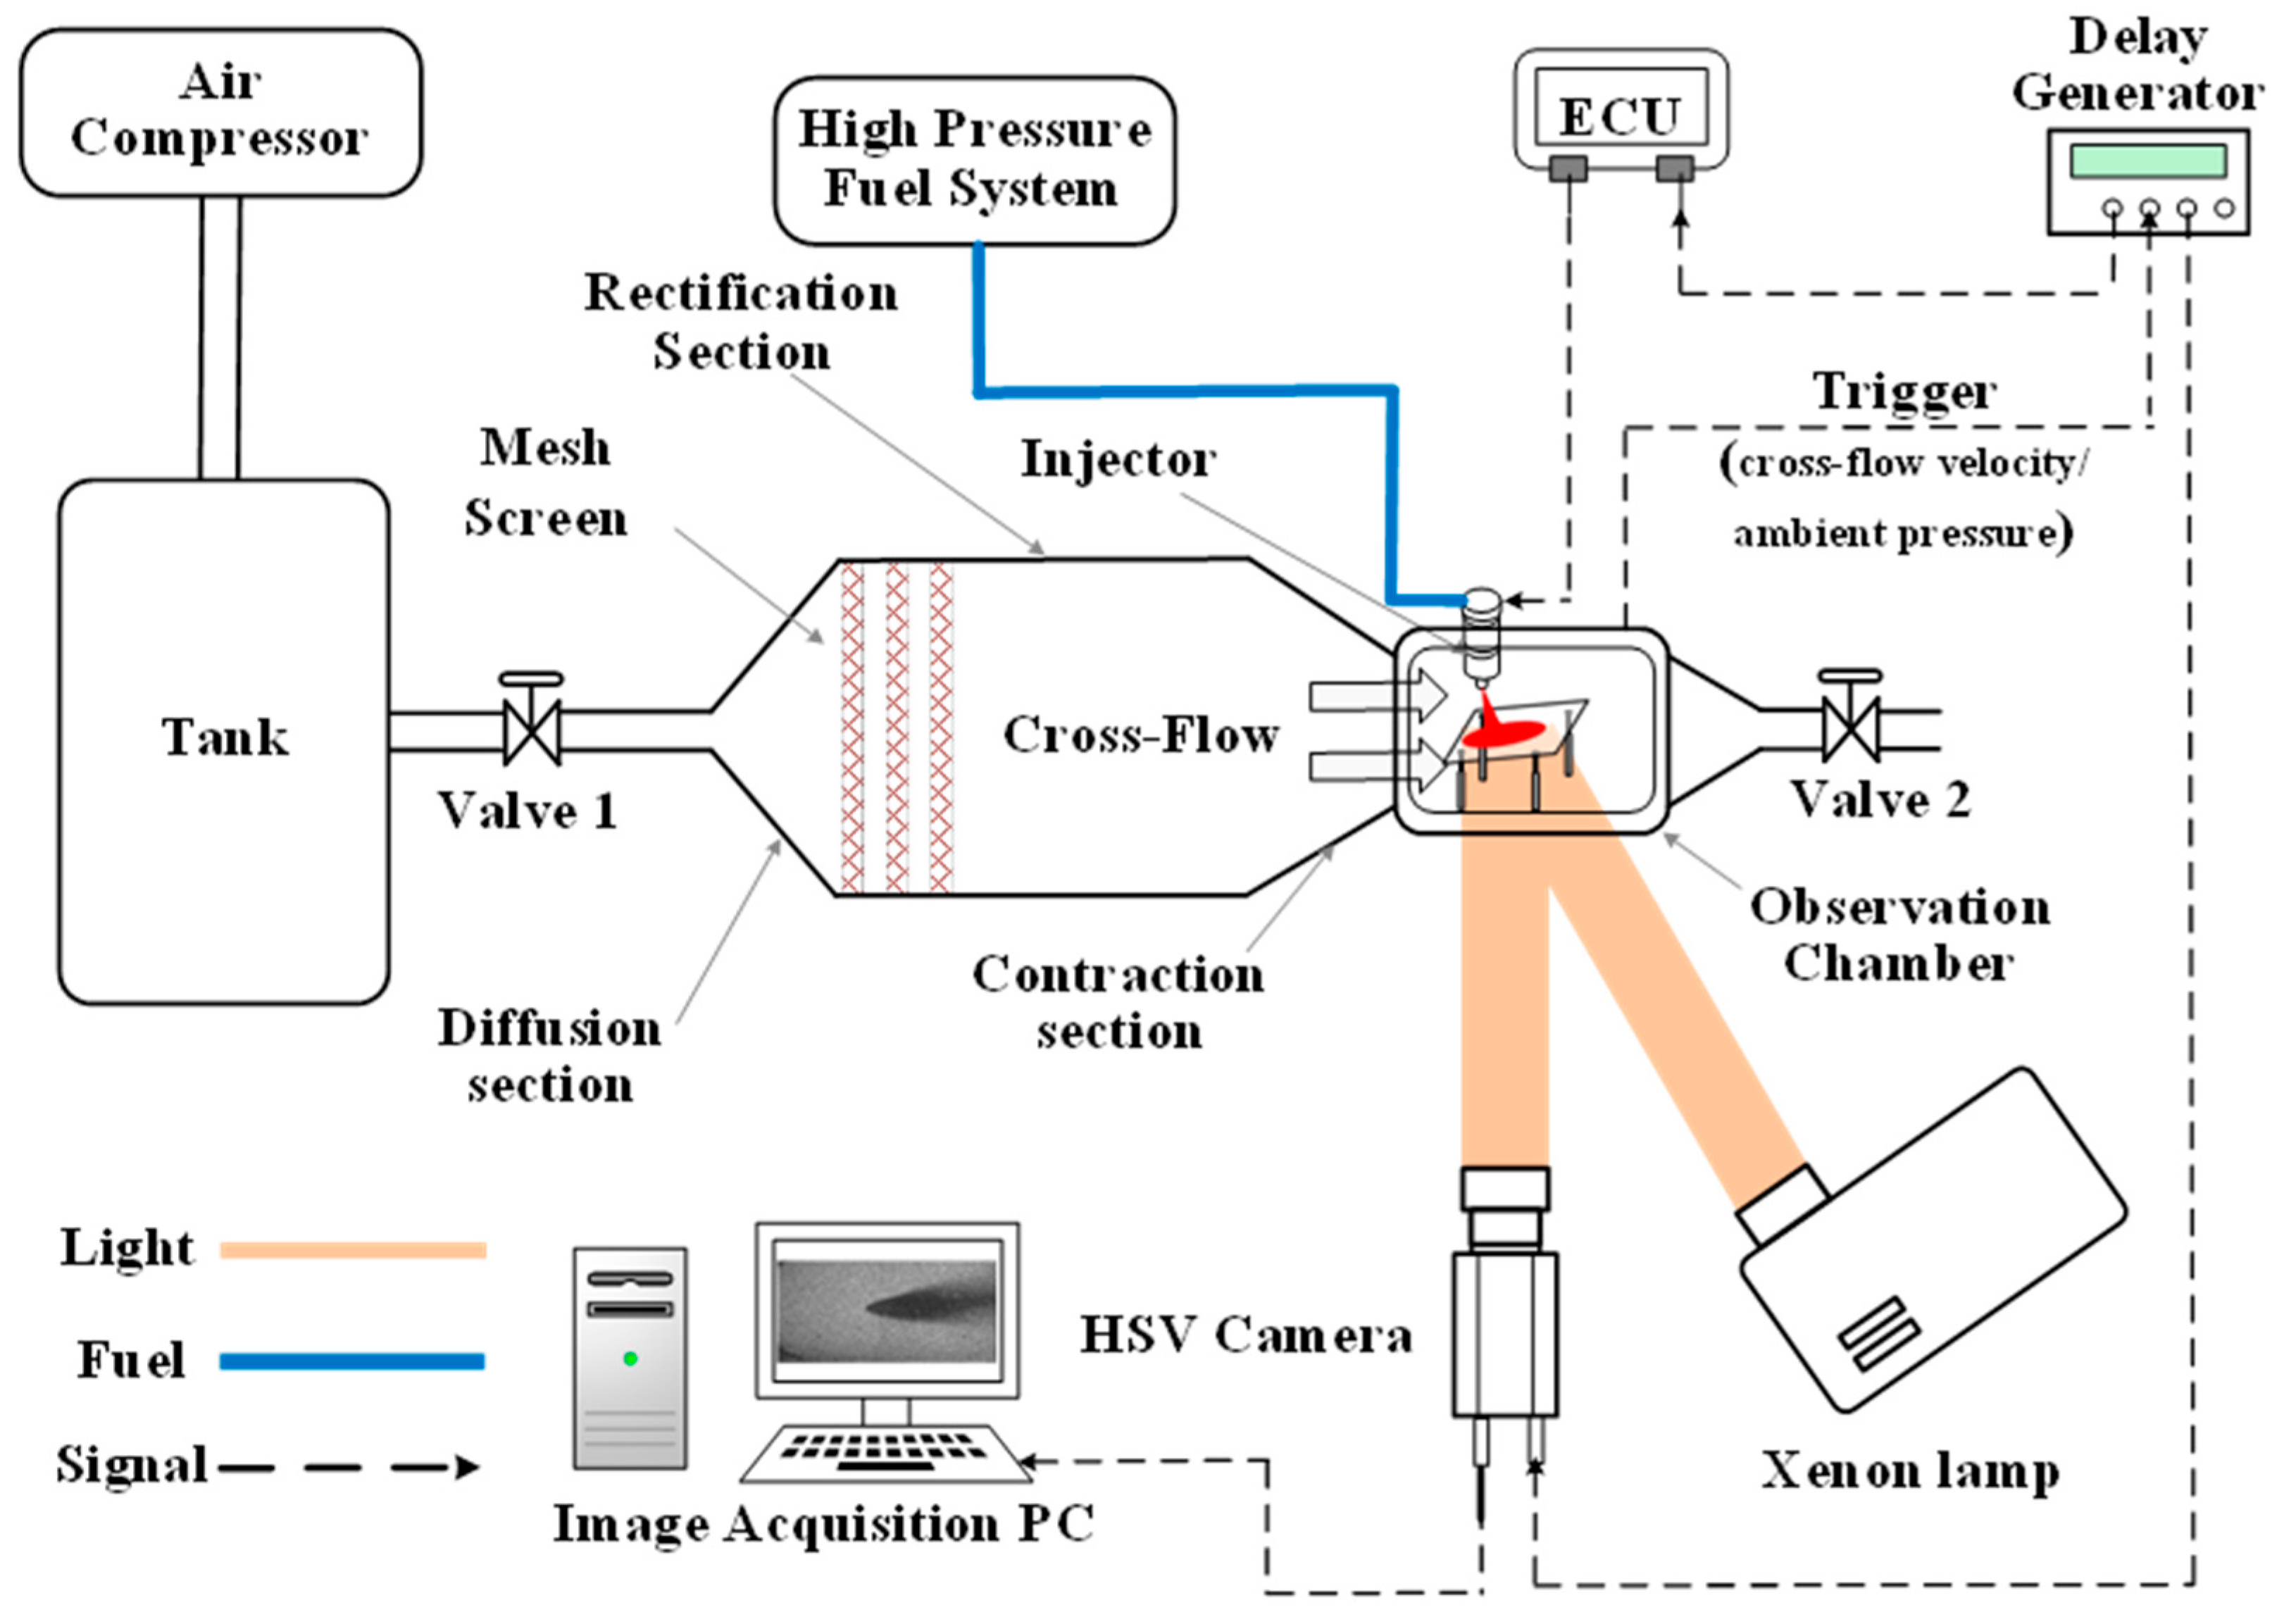
2.2. RIM System Arrangement

Figure 2 depicts the RIM system arrangement that could be utilized to determine the adhesive fuel features. In order to microscopically view the fuel-adhesion distribution, a high-speed video (HSV) camera was positioned beneath the observation chamber, and a xenon lamp light source was positioned diagonally beneath the observation chamber. A hot wire anemometer was employed to measure the cross-flow velocity, and the interior ambient pressure could be directly shown using a digital pressure sensor. The programmable logic controller (PLC) was designed to send a trigger signal to the delay generator, and simultaneously control the injection and photography system when these two signals satisfied our target experimental conditions.

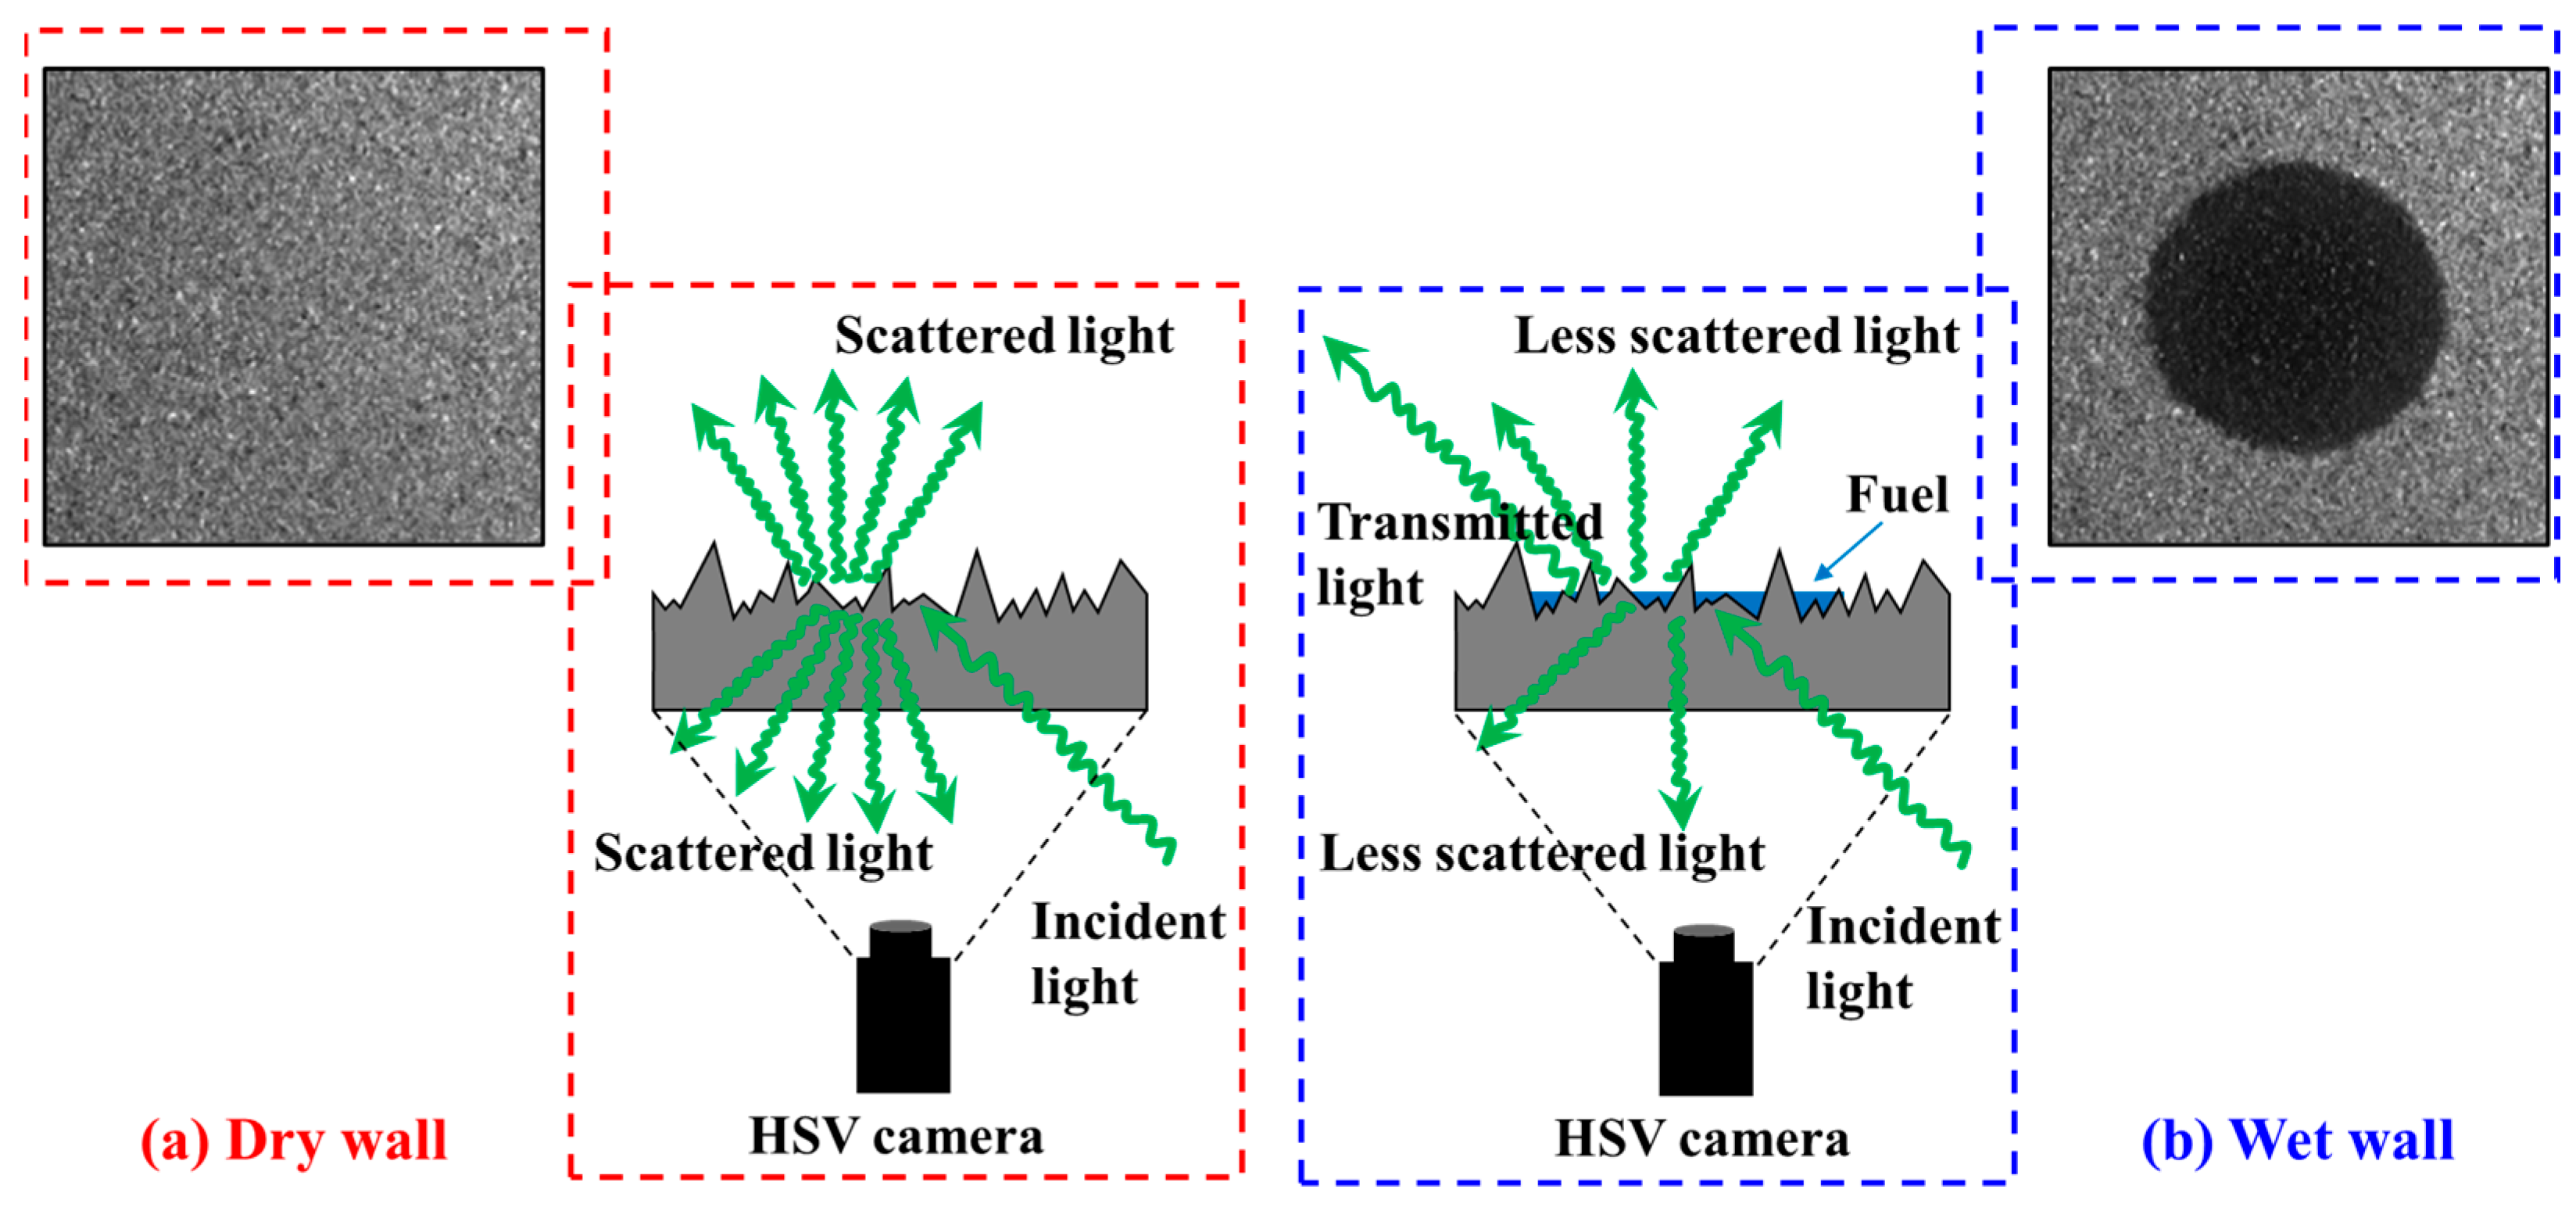
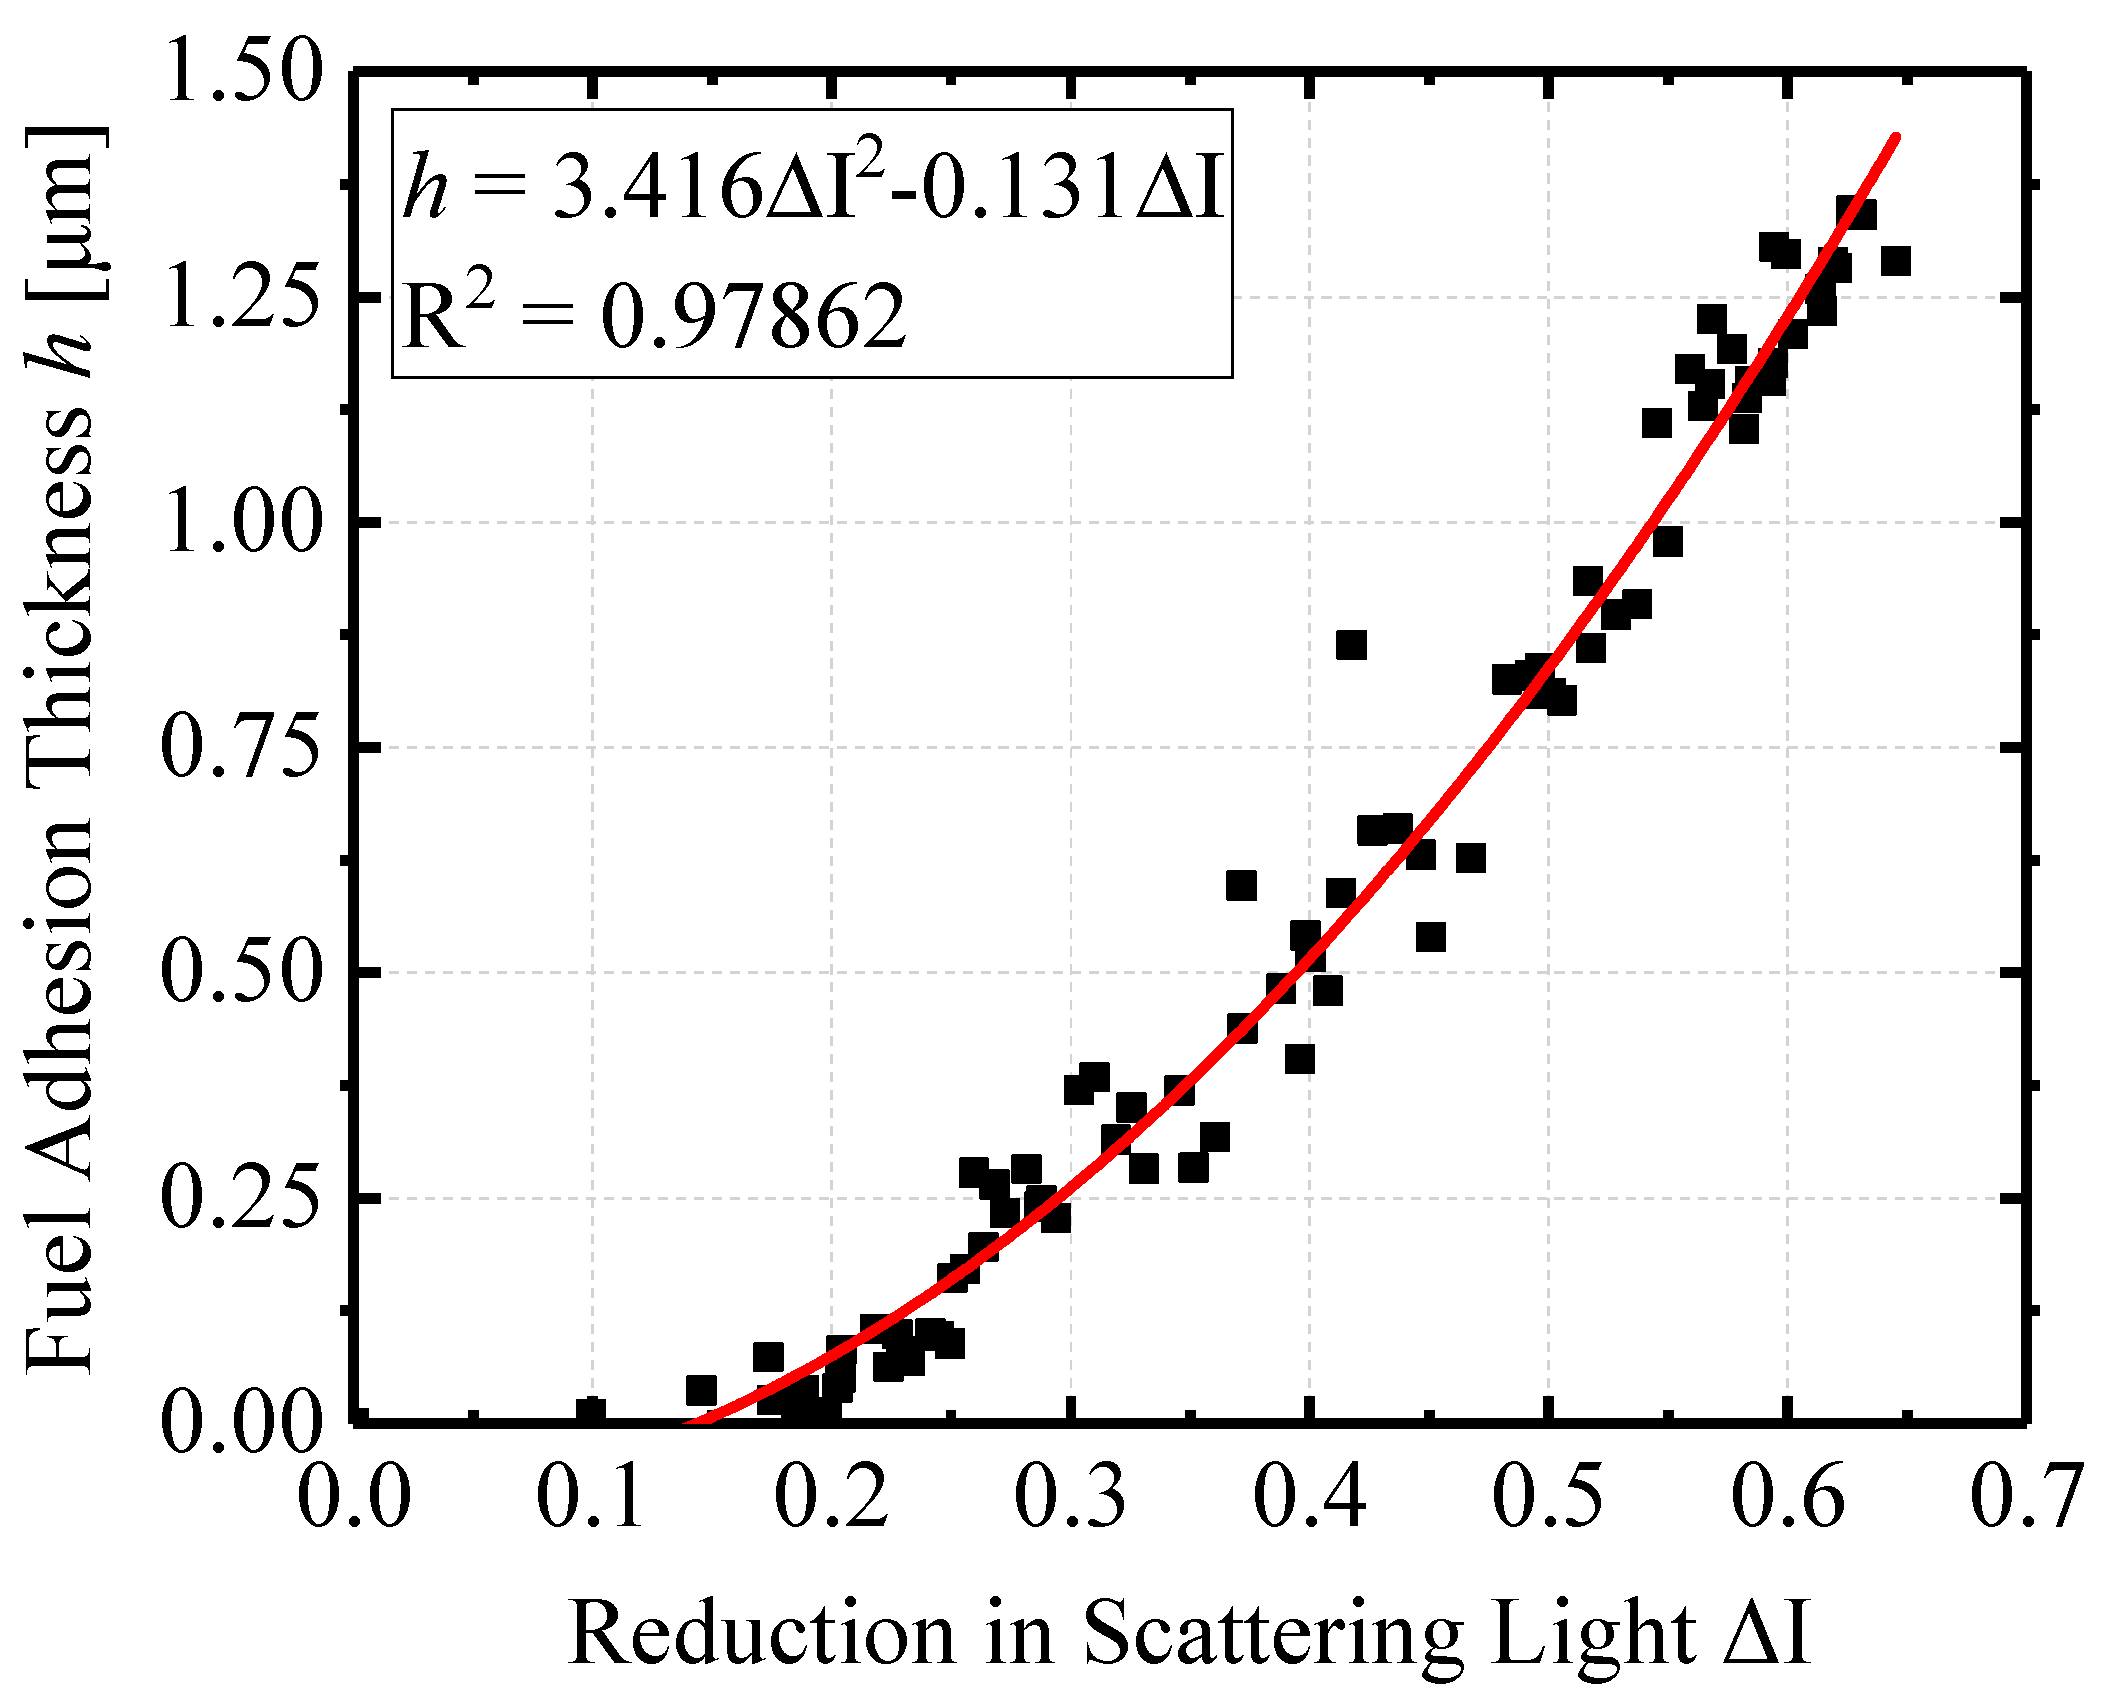
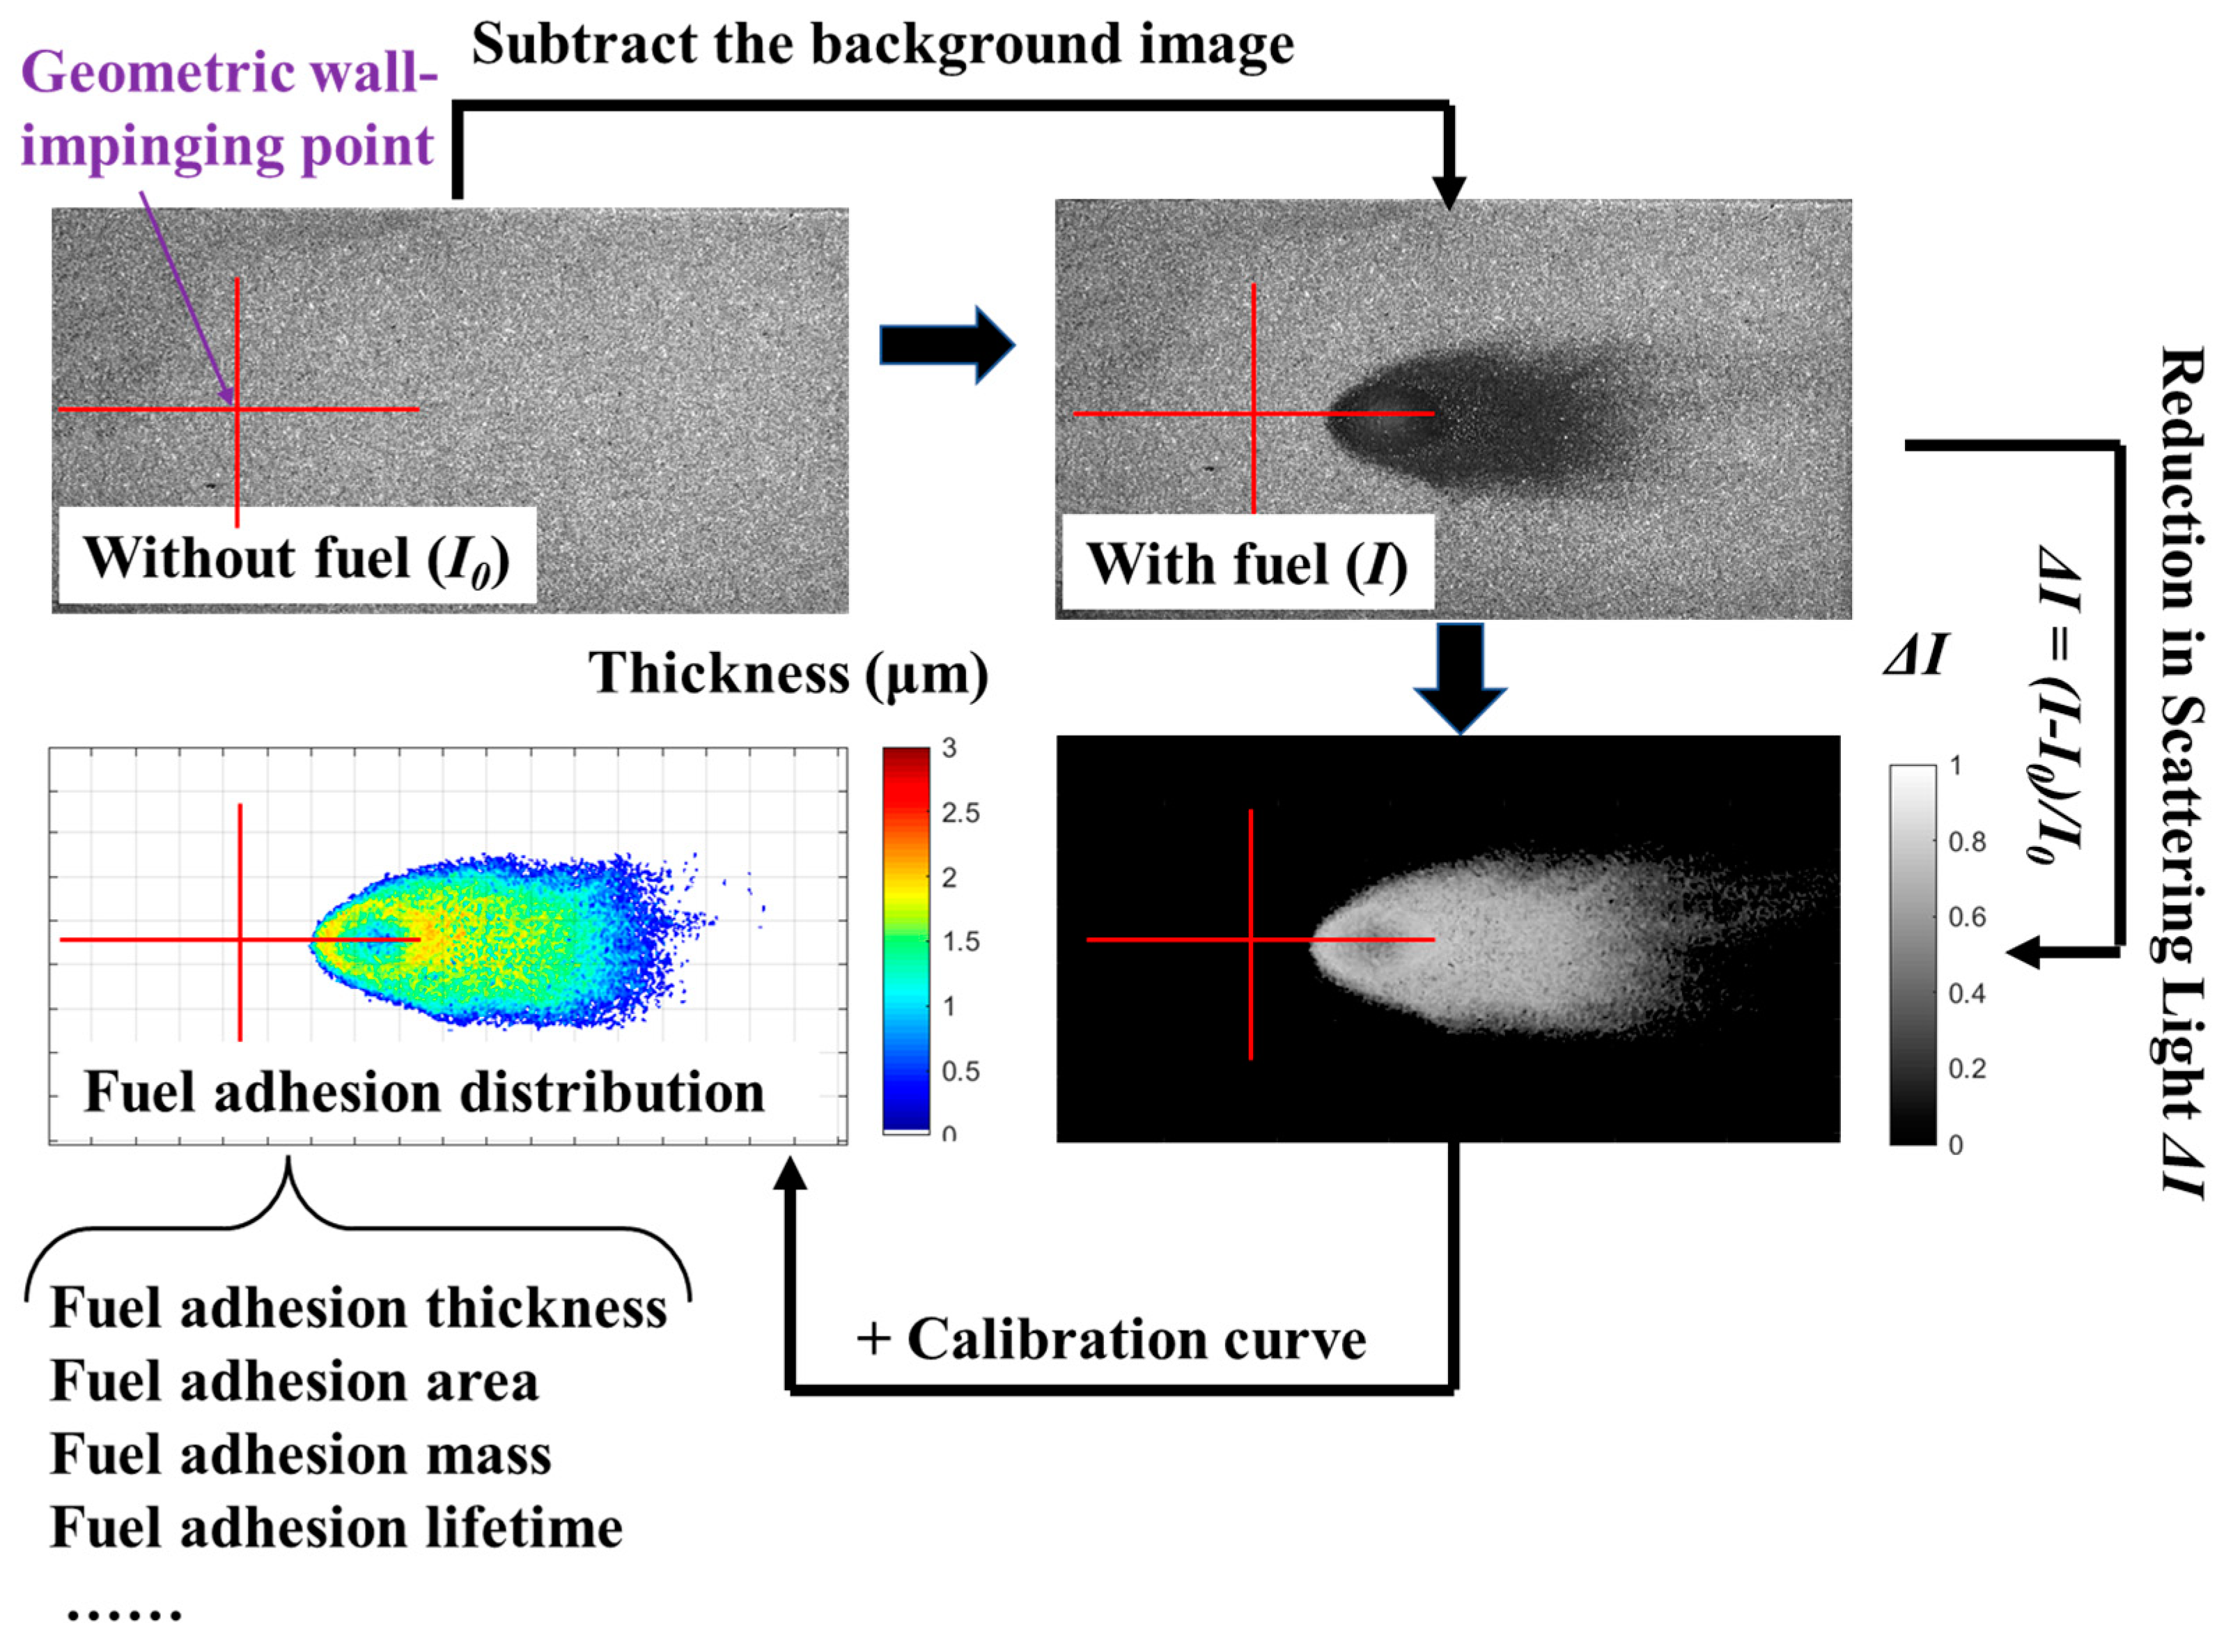
2.3. RIM Principle and Calibration Experiment

The RIM technique was developed by Drake [41] and is predicated on the principle that fuel (1.43–1.49) and quartz glass (1.46) possess comparable refractivity. This principle is shown in Figure 3. When the top surface is dry, light undergoes refraction and diffuse reflection at the glass’s bottom, where it is captured by the HSV camera due to the large difference in refractivity between the glass and air. However, more light passes through after fuel adhesion occurs on the top surface because of the similar refractivity between glass and tested fuel, leading to less light being diffusely reflected and captured by HSV camera. The percentage of transmitted light increases as adhesion thickness increases, which decreases image brightness. More detailed information on the RIM principle can be found in [42,43].
According to the RIM principle, adhesive fuel features could be assessed using this optical method. The reference surface brightness was first I r e f x , y , and I w e t x , y was used to indicate the surface brightness after fuel adhesion. A simple equation is proposed to describe the difference in transmittance Δ I x , y before and after fuel adhesion.
Δ I x , y = 1 I w e t x , y I r e f x , y × 100 % ,
Furthermore, Δ I x , y could be expressed as the f function of the fuel adhesion thickness from the principle of the RIM technique.
Δ I x , y = f h x , y ,
where f has a strong relationship with the surface roughness of the flat wall and the arrangement of the whole optical system, which could be established through calibrating the correlation between the differences in transmittance and fuel adhesion thickness.
In Figure 4, that the horizontal axis shows Δ I x , y , while the vertical axis shows h x , y . A second-order polynomial was used to fit all of the calibration point data to a curve, as shown in Figure 4. Then, Equation (3) was used to express the functional relationship f of this fitting curve. As shown in Figure 4, R2 represents the fit degree of the regression model to the calibration data. The value of R2 reached almost 98%. After the calibration calculation, the RIM optical method could be used to measure adhesion thickness.
h x , y = 3.416 Δ I x , y 2 0.131 Δ I x , y

2.4. Image Processing for Fuel Adhesion

The image processing procedure is shown Figure 5, and detailed information regarding it can be found in [37]. In this work, adhesive fuel features were obtained to evaluate the degree of fuel adhesion. The nozzle tip served as the origin (0, 0) of the coordinate system with the projecting point on the flat wall representing the geometric wall impinging point. All experimental results are the average values obtained from three experiments conducted in identical conditions. Standard deviation is a statistical measure used to express uncertainty associated with experimental results.

3. Results and Discussion

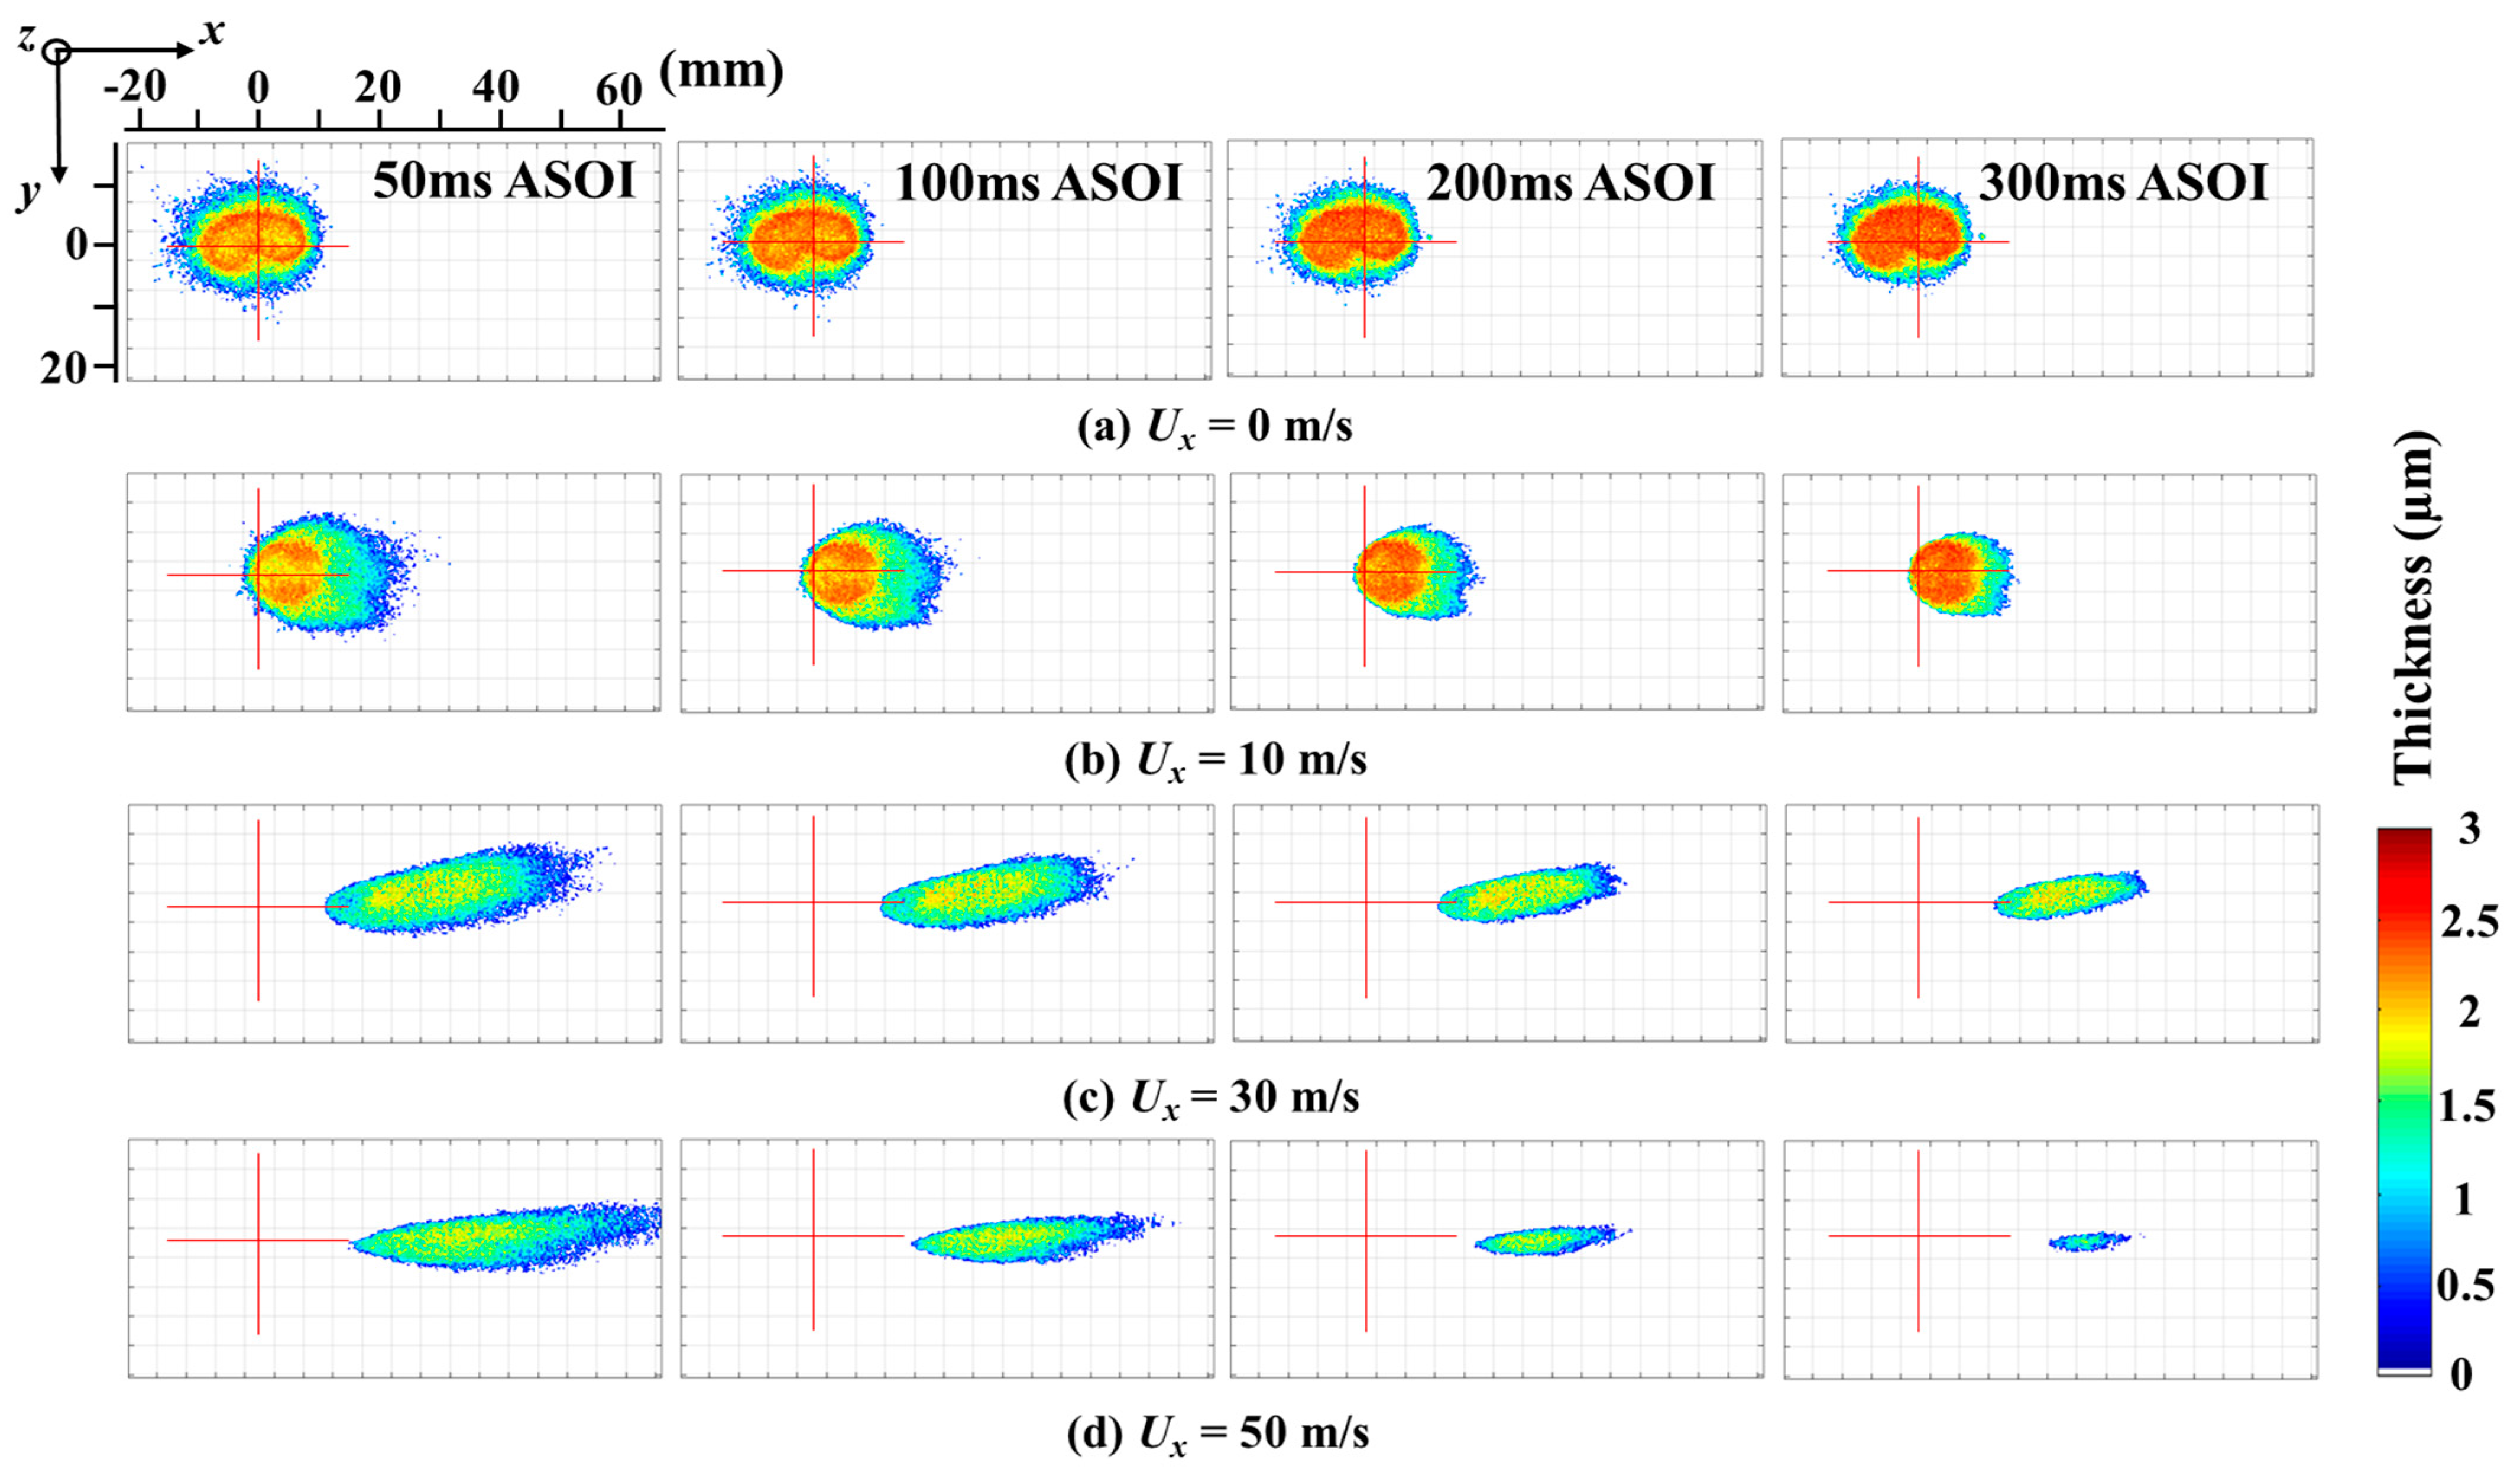
3.1. Formation and Expansion of Fuel Adhesion

Figure 6 and Figure 7 depict the expansion of fuel adhesion after the end of the injection (EOI) under cross flow or not when the injection pressure was set at 5 and 10 MPa.
As shown in Figure 6, the distribution of fuel adhesion was symmetrical without cross flow, but the actual impinging position moved from the geometric wall impinging point to downstream with cross flow. Meanwhile, the adhesion shape gradually tended to be stretched with cross flow. Compared with the horizontal flat wall [37], adhesion was thicker at the actual impinging position, and thinner downstream and at the edge regions when the spray impinged upon the inclined wall. When the cross-flow intensity was not so strong, the adhesion area increased as cross-flow intensity increased. However, when the cross-flow velocity was 50 m/s, the fuel-adhesion area decreased due to the deformation of the spray. In addition, results show that the cross flow particularly accelerated the evaporation of fuel adhesion, which led to the gradual disappearance of the thinner distribution in the edge regions.
In addition, the results of the influence of injection pressure are depicted in Figure 7. Compared to the color of fuel adhesion, the adhesion thickness of the central region increased as injection pressure increased when the cross-flow intensity was insufficient (less than 30 m/s). The fuel-adhesion area also seemed to increase a little as the injection pressure increased in the cross-flow field. Additionally, Pan et al. [44] discovered through microscopic photography that, due to the high horizontal velocity component of the droplets produced with the wall jet, many droplets slid and migrated away from the flat wall rather than adhere. This behavior of the droplets produced by the wall jet could result in a greater decrease in fuel-adhesion area compared with that with the spray width distributed along the horizontal direction.

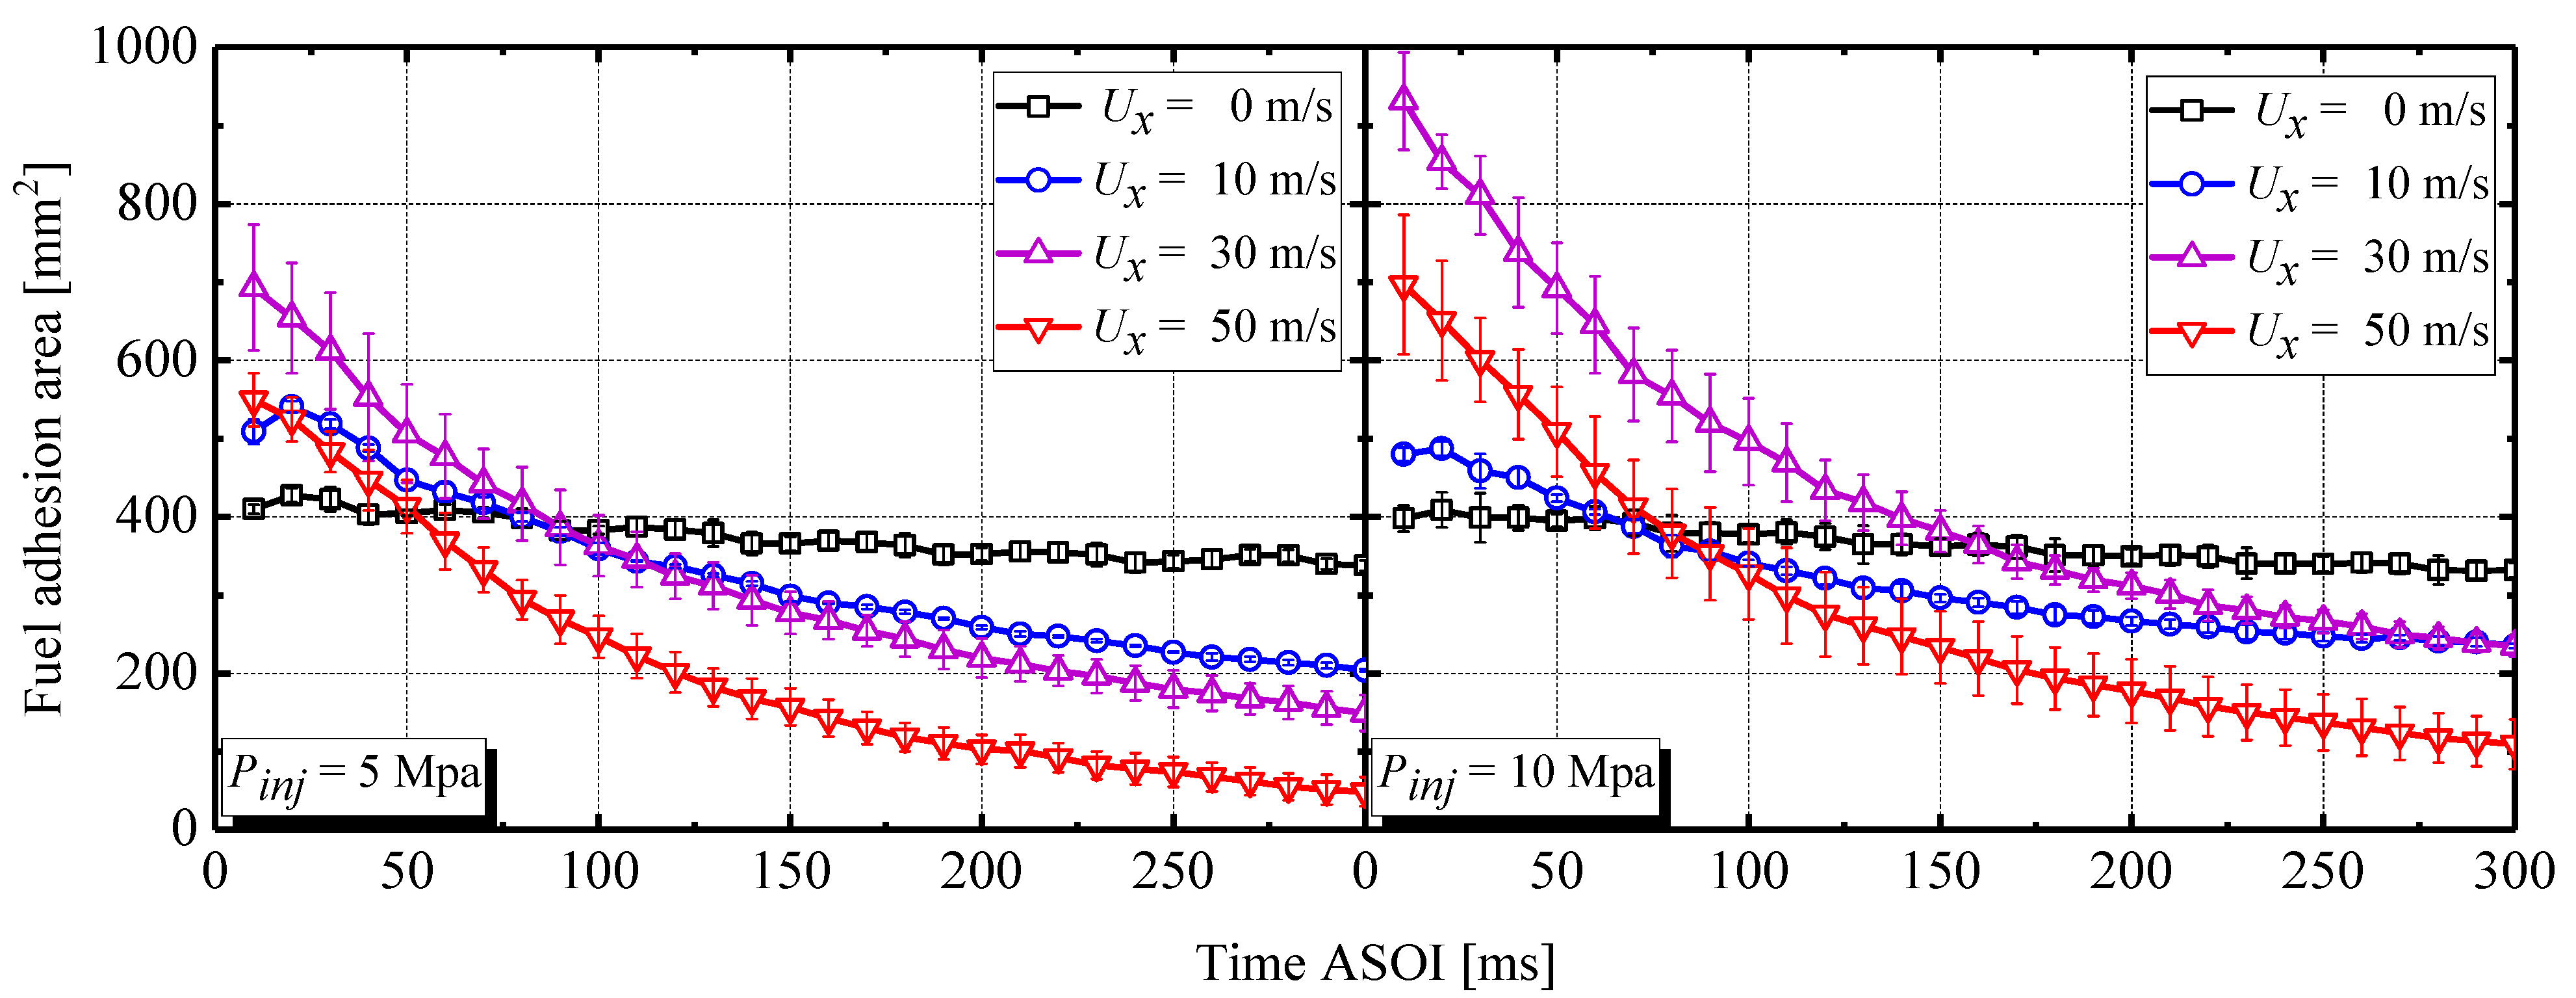
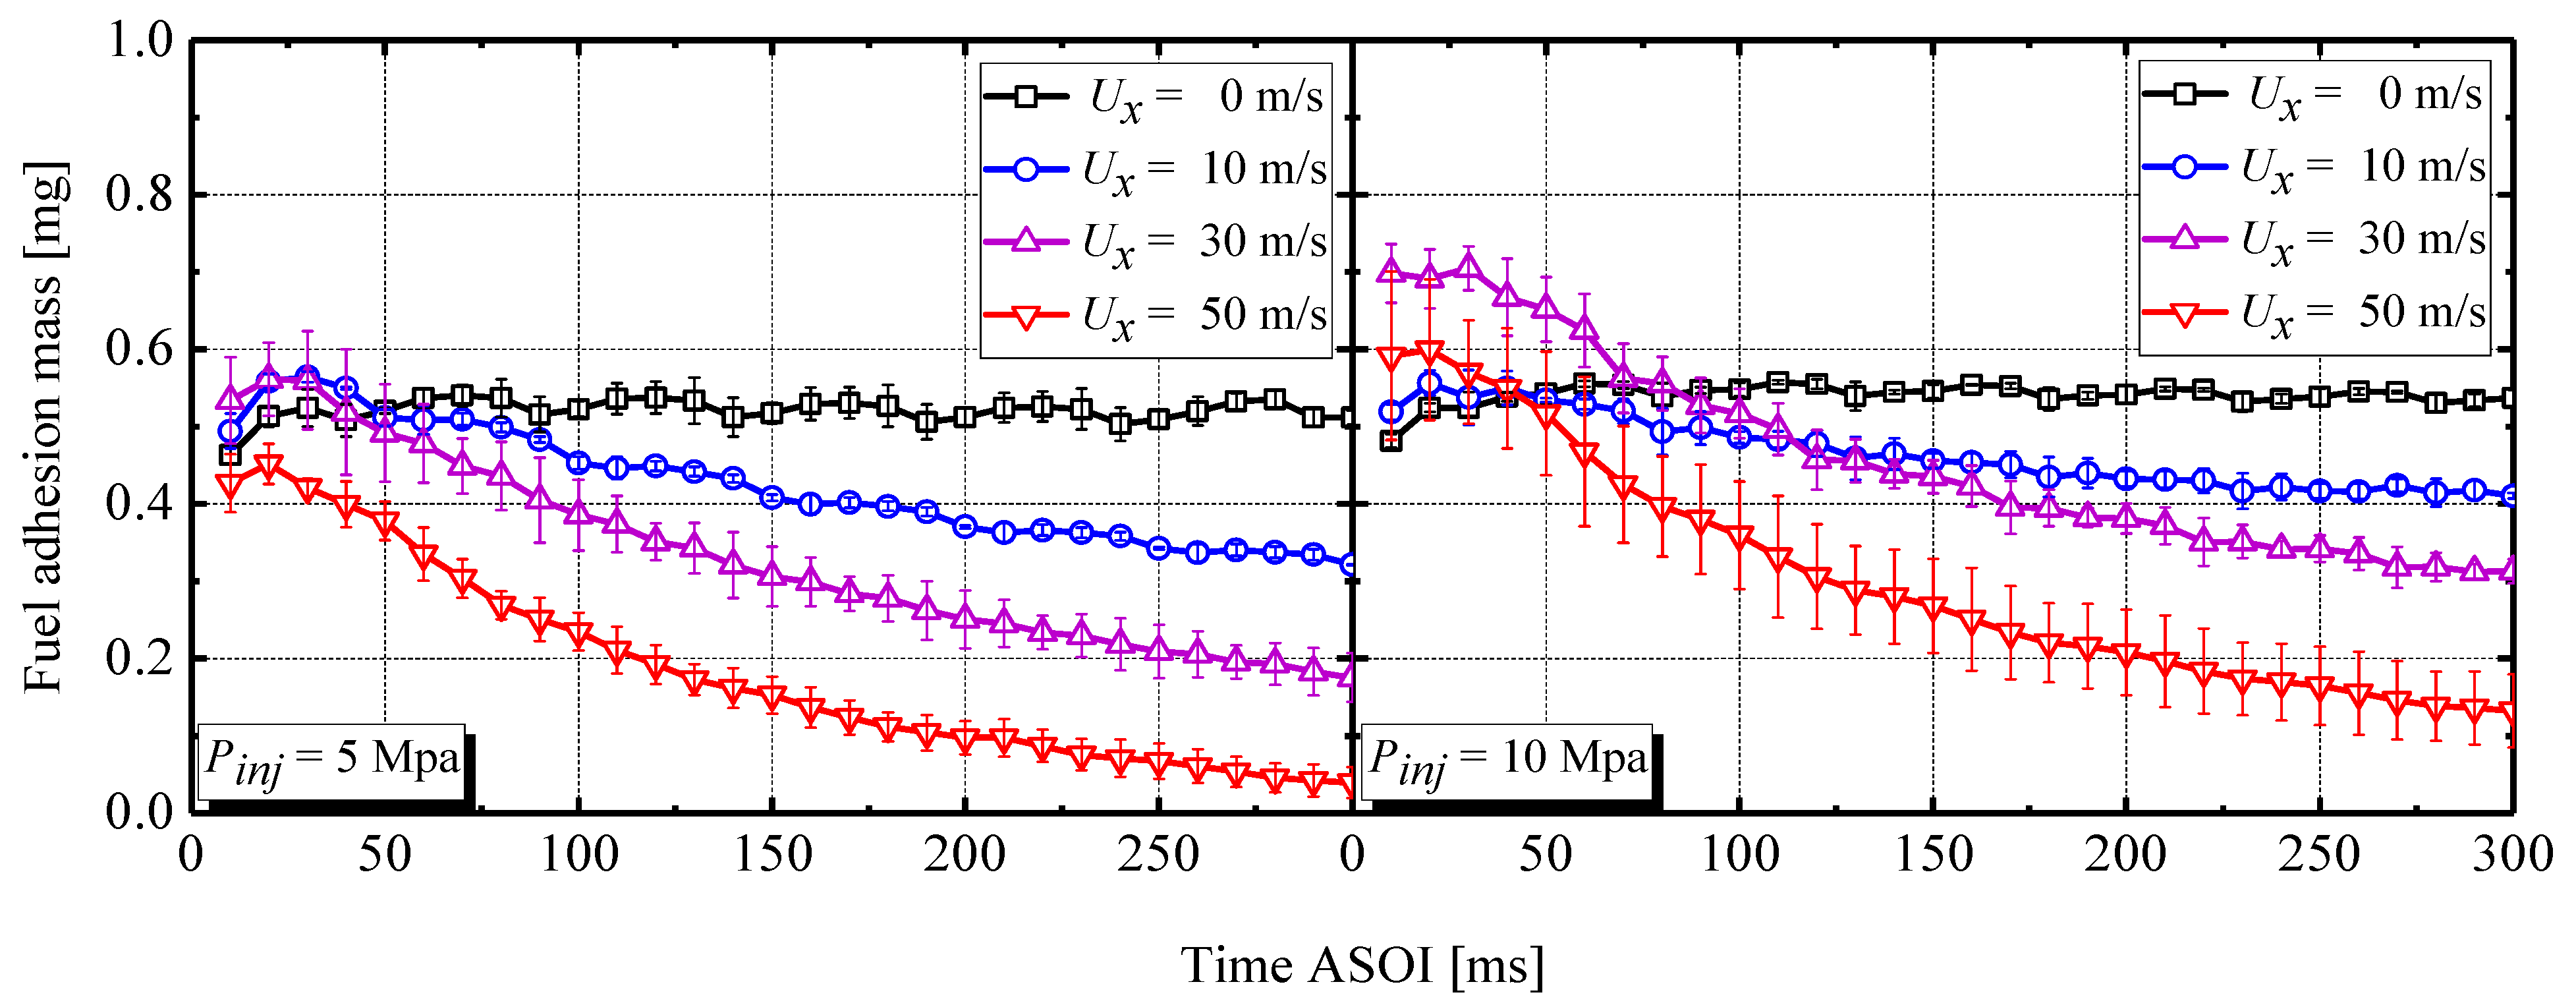
3.2. Fuel-Adhesion Area, Mass, and Thickness

In order to more deeply comprehend the relevant process for the expansion of the fuel adhesion in a cross-flow field, the adhesive features were quantitatively evaluated as shown below. Meanwhile, the quantitative data for 50 ms and 300 ms ASOI can be found in the Appendix A.
Figure 8 demonstrates the area of fuel adhesion after EOI with or without cross flow when the injection pressure was set at 5 and 10 MPa. Regardless of injection pressure, the adhesion area was sharply reduced with time in a cross flow, with a faster decline as cross-flow velocity increased. Nevertheless, since all experiments were conducted at room temperature, the area of fuel adhesion decreased quite slowly without cross flow, confirming the previous conclusion that cross flow augments fuel-adhesion evaporation. The fuel-adhesion area at the initial impinging time was also very different with the increase in cross-flow velocity. If the flow-field intensity was not very strong (less than 30 m/s), the initial fuel-adhesion area increased, which indicates that the cross flow dispersed and distributed the fuel adhesion more. When the flow-field intensity was sufficiently high (50 m/s), however, the initial fuel-adhesion area was significantly reduced. This could be attributed to cross flow enhancing spray atomization and enabling some fragmented droplets to be carried downstream without coming into contact with the wall. Moreover, the injection pressure had a diminishing effect on this phenomenon, leading to a larger initial fuel-adhesion area as the injection pressure rose.
Figure 9 demonstrates the mass of the fuel adhesion after EOI with/without cross flow when the injection pressure was set at 5 and 10 MPa. The fuel-adhesion mass rapidly declined over time in the cross flow, exhibiting a similar trend to that of the fuel-adhesion area. The greatest difference is that, without cross flow, there was little change in the fuel mass attached over time. Although Figure 8 demonstrates that the fuel-adhesion area gradually evaporated over time, Figure 6 and Figure 7 suggest that the thinner fuel adhesions distributed at the edges were more likely to evaporate, resulting in only a slight change in fuel-adhesion mass. Simultaneously, the initial fuel-adhesion mass varied considerably with the increase in flow-field intensity. If the flow intensity was not so strong (less than 30 m/s), the initial fuel adhesion mass increased, which could be attributed to more atomized droplets being entrained by the cross flow and subsequently adhering to the flat wall. When the flow-field intensity was large enough (50 m/s), however, the initial fuel-adhesion mass was significantly decreased. This could be ascribed to the cross flow enhancing spray atomization and enabling more droplets to be carried downstream without coming into contact with the wall. Moreover, this effect was intensified as the injection pressure decreased, leading to a smaller initial fuel-adhesion mass as the injection pressure dropped.
Figure 10a displays the maximal fuel-adhesion thickness after EOI with/without cross flow when the injection pressure was set at 5 and 10 MPa. Results show that the maximal thickness gradually increased because the impinging droplets continually adhered to the flat wall. Figure 10b shows that the average thickness value also rose with time. Subsequently, the rate of increase tended to decelerate. The average thickness initially tended to decrease as the flow field intensity increased. However, results show that the adhesion thickness had an abnormal tendency inside a strong cross flow; for example, the fuel-adhesion thickness dramatically decreased after 200 ms ASOI at injection pressure of 5 MPa, and slightly decreased after 200 ms ASOI at injection pressure of 10 MPa due to the substantial decrease in fuel-adhesion area with strong flow-field intendency. Overall, small changes in the injection pressure had negligible impact on fuel-adhesion thickness.

3.3. Fuel-Adhesion Distribustion

The probability density function (PDF) was utilized so that the distribution uniformity of fuel adhesion could be further comprehended. The minimal value of the distribution interval, which was determined on the basis of each pixel’s thickness value, was 0.05 μm so that proper statistical distribution could be guaranteed.
Figure 11 presents the PDF of fuel adhesion after EOI with/without cross flow when the injection pressure was set at 5 and 10 MPa. The distribution curve shifted to the left side according to the cross-flow results, indicating a decrease in fuel-adhesion thickness as the flow-field intensity increased. Furthermore, adhesion thickness had both thicker and thinner values, as evidenced by the two peaks in Figure 11. Over time, the thinner portion of fuel-adhesion thickness decreased, while the thicker portion increased, demonstrating the transformation between the thin and thick fuel adhesion regions. As shown in Figure 11, the fuel adhesion was concentrated in the 2.0–2.5 μm range without a cross flow and was more focused than that in a cross-flow field. Additionally, the thicker side greew as injection pressure increased.

4. Prediction of Fuel-Adhesion Lifetime

Due to the negative effect of fuel adhesion inside DISI engines, it is essential to know the fuel-adhesion lifetime. Lifetime prediction was used to quantitatively evaluate the effect of flow-field intensity and injection pressure on fuel adhesion, which could be calculated by examining the decreasing trend in adhesion area. Results are shown in Figure 12: the fuel-adhesion lifetime was considerably diminished as the flow-field intensity increased. Under injection pressure of 10 MPa, the adhesion lifetime in the cross-flow field of 50 m/s was reduced by 77.5% compared with that with a static flow field (0 m/s). Concurrently, the fuel-adhesion lifetime experienced a slight reduction with minor changes in injection pressure.

5. Conclusions

In this work, the RIM technology was primarily utilized to investigate adhesive features at various injection-pressure levels in a cross-flow field, which had not previously been reported. The most important conclusions are summed up below.
(1)
The actual position of the wall impingement went downstream with the cross flow, while the edge region was the thinnest at the main impingement area.
(2)
The fuel-adhesion area showed a gradual decrease over time that was related to the fact that the cross flow accelerated the evaporation of fuel adhesion. Moreover, the fuel adhesion area expanded as the injection pressure increased.
(3)
The fuel-adhesion mass obviously decreased with time in the cross-flow field, and the drop speed was proportional to flow-field intensity. Additionally, the fuel-adhesion mass increased as the injection pressure increased.
(4)
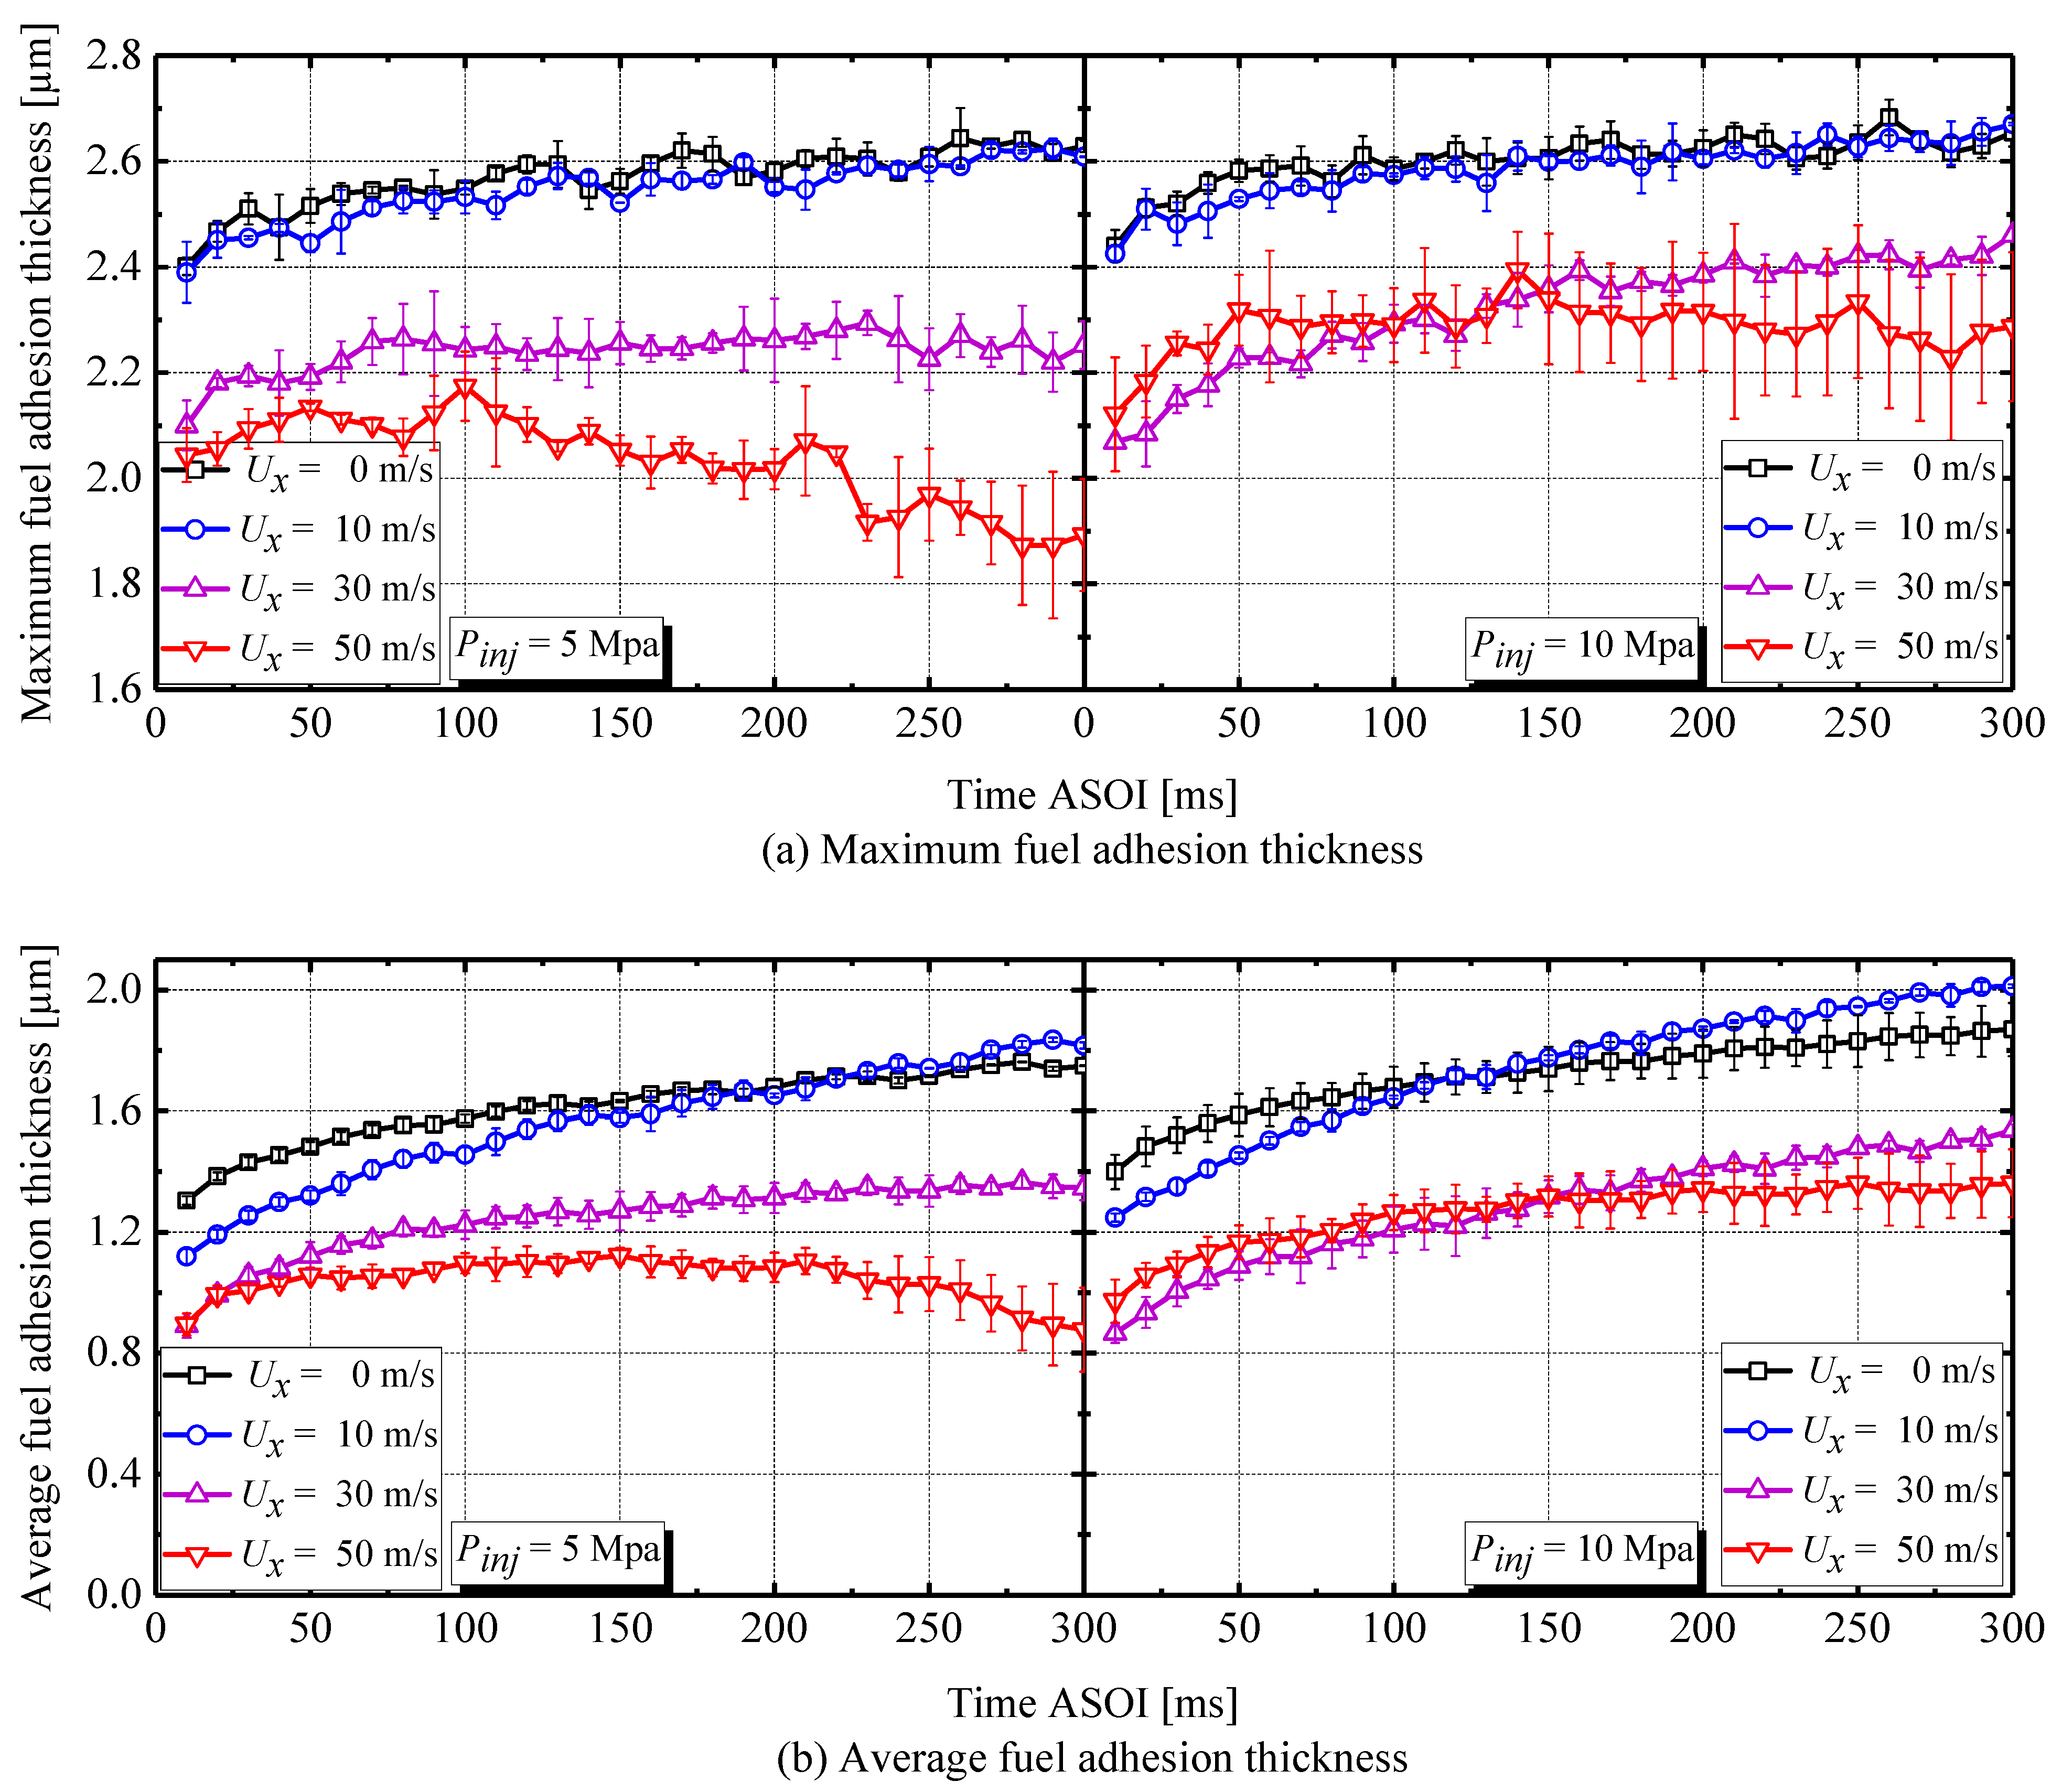
Both average and maximal fuel adhesion thickness increased with time. The average fuel-adhesion thickness initially tended to decrease as the flow-field intensity increased. However, small changes in injection pressure had little effect on fuel-adhesion thickness.
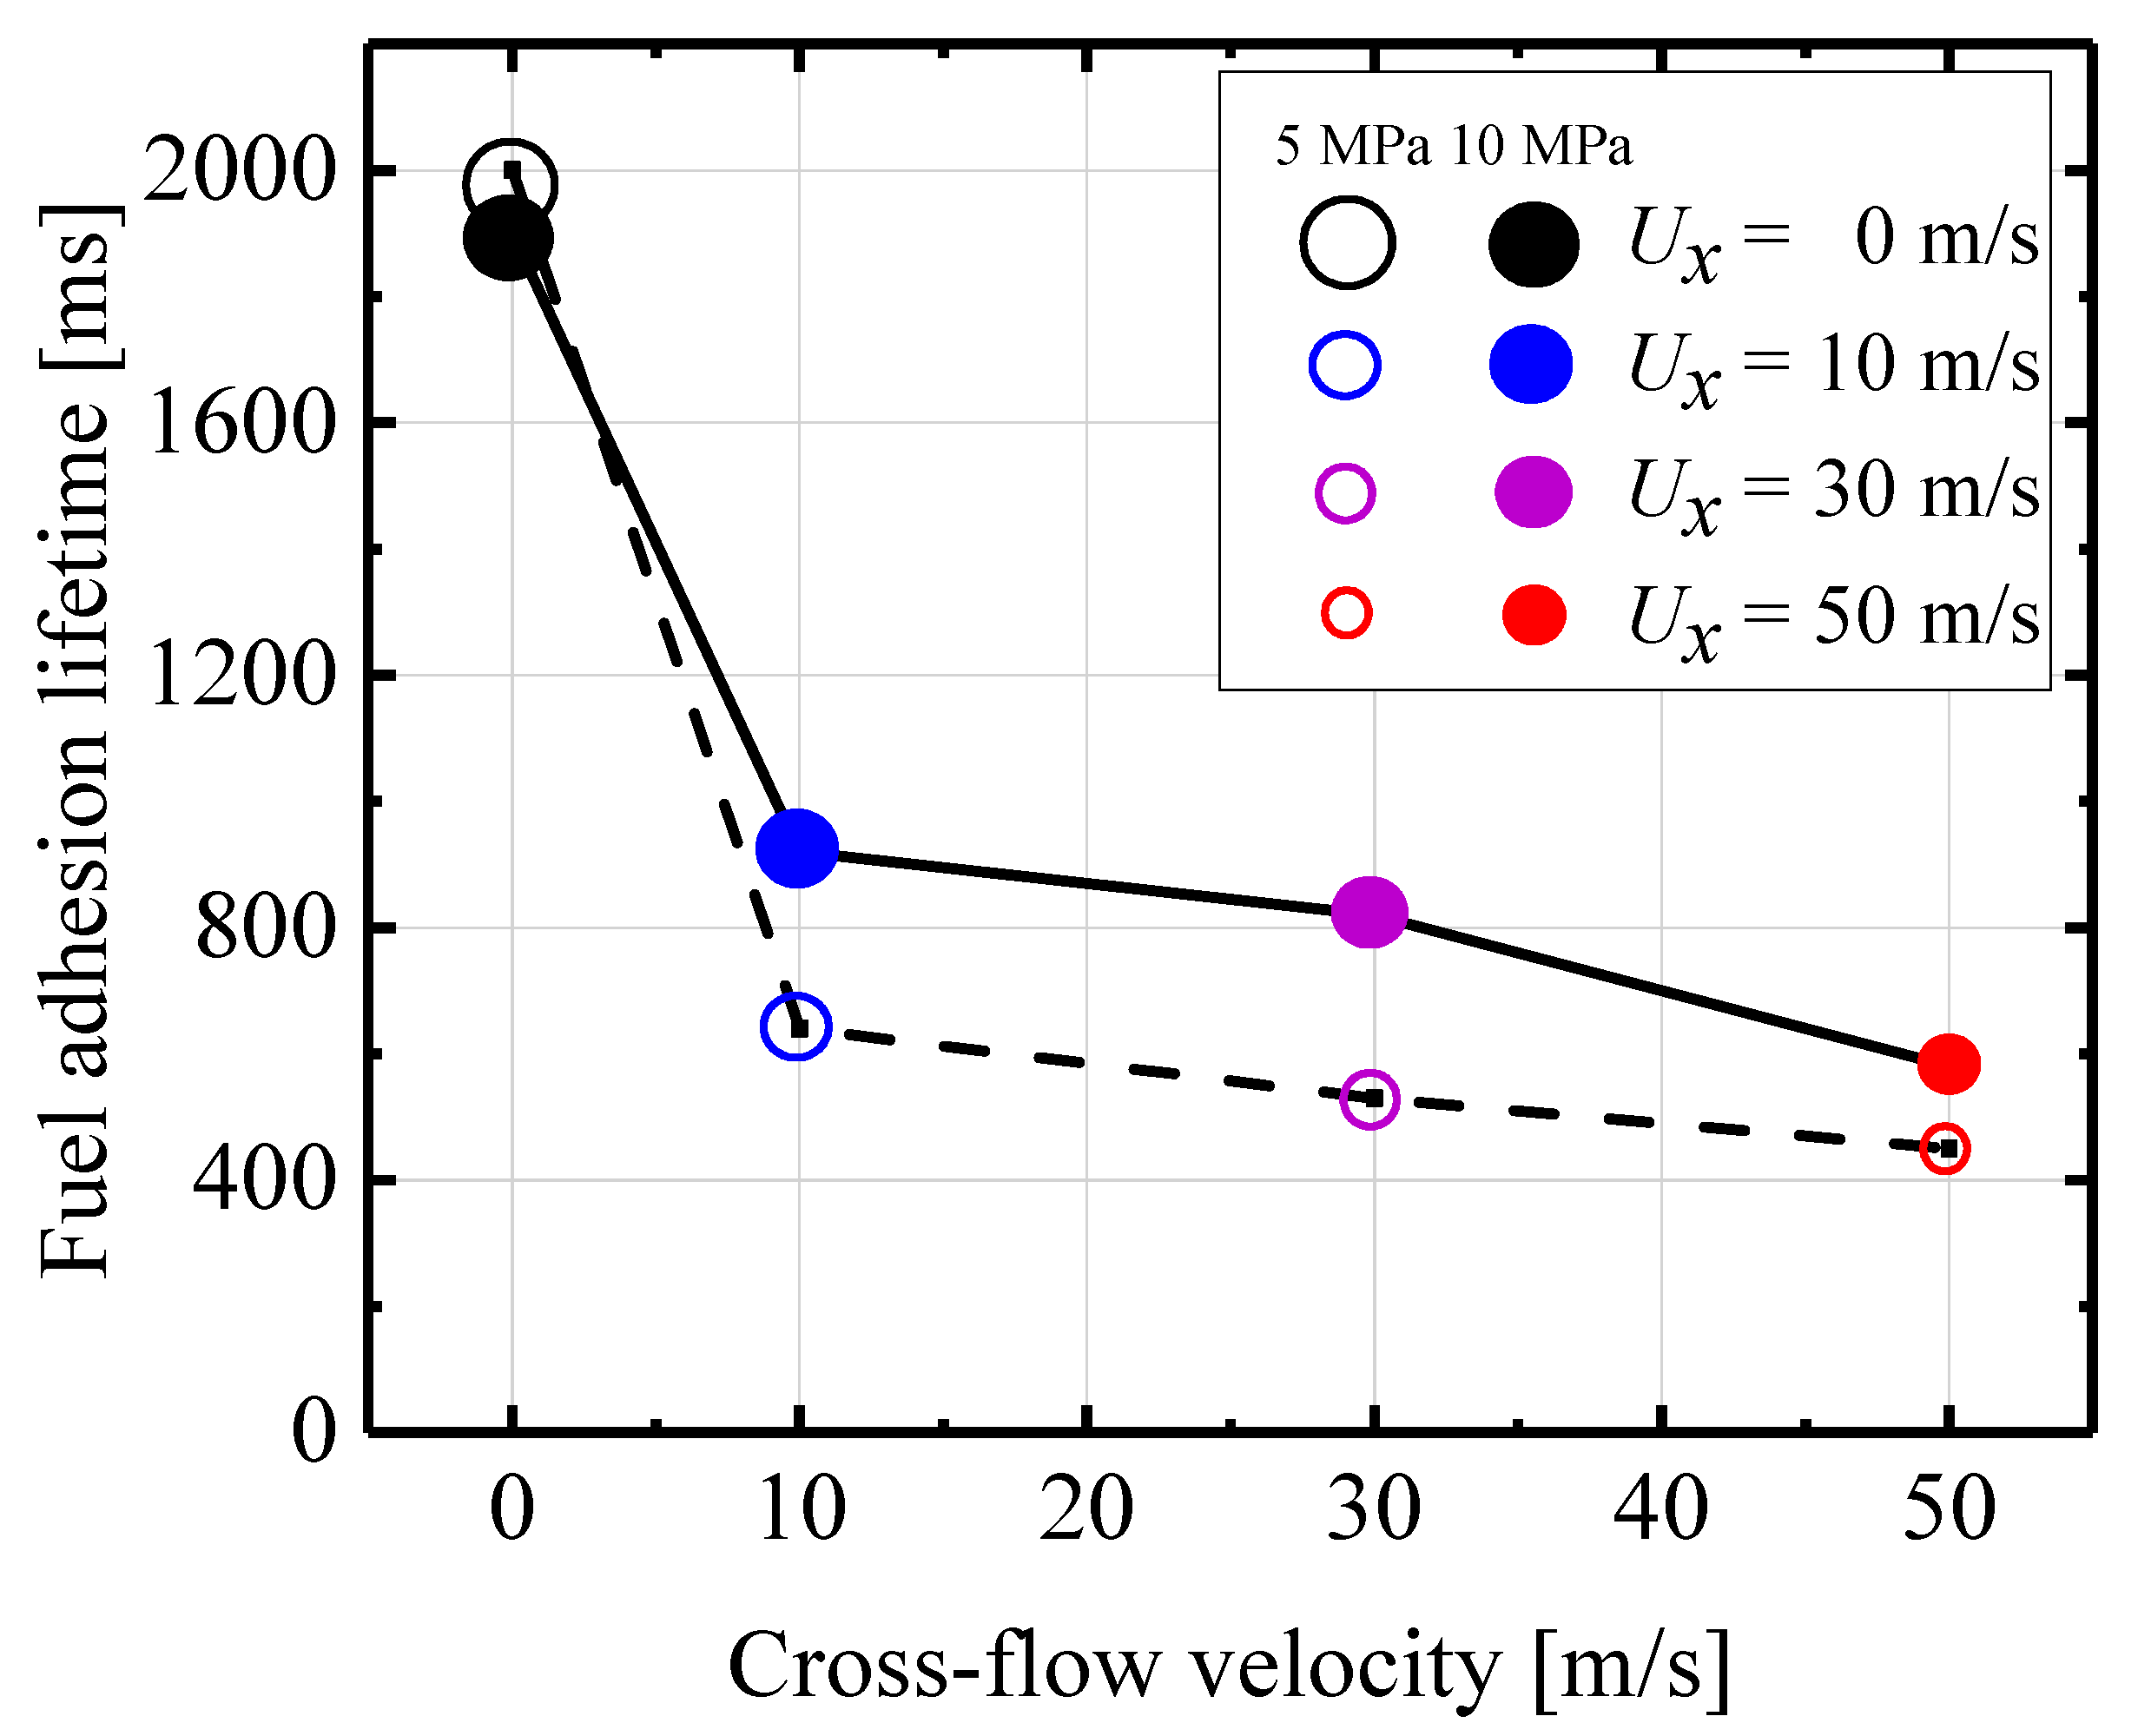
(5)
Predictably, under 10 MPa of injection pressure, the adhesion lifetime in a cross-flow field of 50 m/s was reduced by 77.5% compared with that with a static flow field (0 m/s). Additionally, the adhesion lifetime decreased with a slight decrease in injection pressure.

6. Future Work

In the future, we plan to numerically simulate the wall-impingement spray using the experimental data obtained in this study to verify and improve the wall-film model. We also expect to record the behavior of microscopic droplets near the wall to verify the fuel-adhesion mechanism in the cross-flow field.

Author Contributions

Conceptualization, G.Z. and H.L.; methodology, G.Z., P.S., P.D., F.Z., Y.Z. and H.L.; validation, G.Z. and P.S.; formal analysis, G.Z. and P.S.; investigation, G.Z., P.S., P.D., F.Z., Y.Z. and H.L.; resources, G.Z. and P.S.; data curation, G.Z., P.S., P.D., F.Z., Y.Z. and H.L.; writing—original draft preparation, G.Z.; writing—review and editing, G.Z. and H.L.; visualization, G.Z. and H.L.; supervision, H.L. All authors have read and agreed to the published version of the manuscript.

Funding

This research received no external funding.

Institutional Review Board Statement

Not applicable.

Informed Consent Statement

Not applicable.

Data Availability Statement

Not applicable.

Acknowledgments

The authors would like to acknowledge the Mazda Motor Corporation for providing the injection system. We also thank the Foundation of the State Key Laboratory of Engines (no. K2022-12) and the China Scholarship Council (no. 202108130049) for the support.

Conflicts of Interest

The authors declare no conflict of interest.

Nomenclature

ASOIAfter start of injection
DISIDirect-injection spark-ignition
EOIEnd of injection
HSVHigh-speed video
ICEsInternal-combustion engines
LIFLaser-induced fluorescence
PDFProbability density function
PLCProgrammable logic controller
RIMRefractive index matching
PaAmbient pressure
PinjInjection pressure
tinjInjection pulse
UxCross-flow velocity

Appendix A

Table A1. Average value of fuel adhesion area at 50 ms ASOI (mm2).
Cross-Flow
Velocity
Ux = 0 m/sUx = 10 m/sUx = 30 m/sUx = 50 m/s
Injection
Pressure
Pinj = 5 MPa404.75136446.70054506.22294412.98772
Pinj = 10 MPa395.07997423.90932691.88663508.65309
Table A2. Average values of fuel adhesion area at 300 ms ASOI (mm2).
Cross-Flow
Velocity
Ux = 0 m/sUx = 10 m/sUx = 30 m/sUx = 50 m/s
Injection
Pressure
Pinj = 5 MPa337.62861204.04052149.4729348.62329
Pinj = 10 MPa331.6439235.39067234.95882109.53435
Table A3. Average value of fuel adhesion mass at 50 ms ASOI (mg).
Cross-Flow
Velocity
Ux = 0 m/sUx = 10 m/sUx = 30 m/sUx = 50 m/s
Injection
Pressure
Pinj = 5 MPa0.520270.511460.491860.37797
Pinj = 10 MPa0.542980.534220.651740.51707
Table A4. Average values of fuel adhesion mass at 300 ms ASOI (mg).
Cross-Flow
Velocity
Ux = 0 m/sUx = 10 m/sUx = 30 m/sUx = 50 m/s
Injection
Pressure
Pinj = 5 MPa0.511880.321160.17520.03922
Pinj = 10 MPa0.536560.41050.312920.13217
Table A5. Average values of fuel adhesion thickness at 50 ms ASOI (μm).
Cross-Flow
Velocity
Ux = 0 m/sUx = 10 m/sUx = 30 m/sUx = 50 m/s
Injection
Pressure
Pinj = 5 MPa1.482721.321021.121471.05724
Pinj = 10 MPa1.586621.453641.0891.16631
Table A6. Average values of fuel adhesion thickness at 300 ms ASOI (μm).
Cross-Flow
Velocity
Ux = 0 m/sUx = 10 m/sUx = 30 m/sUx = 50 m/s
Injection
Pressure
Pinj = 5 MPa1.748731.815541.34620.8771
Pinj = 10 MPa1.86852.011511.537161.36153
Table A7. Fuel adhesion lifetime (ms).
Cross-Flow
Velocity
Ux = 0 m/sUx = 10 m/sUx = 30 m/sUx = 50 m/s
Injection
Pressure
Pinj = 5 MPa2000640530450
Pinj = 10 MPa1900920820580

References

  1. Nour, M.; Sun, Z.; Cui, M.; Yang, S.; Hung, D.; Li, X.; Xu, M. Effect of flash boiling injection on combustion and PN emissions of DISI optical engine fueled with butanol isomers/TPRF blends. Proc. Combust. Inst. 2020, 38, 5923–5931. [Google Scholar] [CrossRef]
  2. Dahham, R.Y.; Wei, H.; Pan, J. Improving Thermal Efficiency of Internal Combustion Engines: Recent Progress and Remaining Challenges. Energies 2022, 15, 6222. [Google Scholar] [CrossRef]
  3. Luo, H.; Nishida, K.; Uchitomi, S.; Ogata, Y.; Zhang, W.; Fujikawa, T. Microscopic behavior of spray droplets under flat-wall impinging condition. Fuel 2018, 219, 467–476. [Google Scholar] [CrossRef]
  4. Drake, M.; Fansler, T.; Solomon, A.; Szekely, G. Piston Fuel Films as a Source of Smoke and Hydrocarbon Emissions from a Wall-Controlled Spark-Ignited Direct-Injection Engine. In SAE Technical Paper; No. 2003-01-0547; SAE International: Warrendale, PA, USA, 2018. [Google Scholar] [CrossRef]
  5. Sementa, P.; Vaglieco, B.M.; Catapano, F. Thermodynamic and optical characterizations of a high performance GDI engine operating in homogeneous and stratified charge mixture conditions fueled with gasoline and bio-ethanol. Fuel 2012, 96, 204–219. [Google Scholar] [CrossRef]
  6. Wang, C.; Pei, Y.; Qin, J.; Peng, Z.; Liu, Y.; Xu, K.; Ye, Z. Laser induced fluorescence investigation on deposited fuel film from spray impingement on viscous film over a solid wall. Energy 2021, 231, 120893. [Google Scholar] [CrossRef]
  7. Cheng, Y.-S.; Deng, K.; Li, T. Measurement and simulation of wall-wetted fuel film thickness. Int. J. Therm. Sci. 2010, 49, 733–739. [Google Scholar] [CrossRef]
  8. Luo, H.; Uchitomi, S.; Nishida, K.; Ogata, Y.; Zhang, W.; Fujikawa, T. Experimental investigation on fuel film formation by spray impingement on flat walls with different surface roughness. At. Sprays 2017, 7, 611–628. [Google Scholar] [CrossRef]
  9. Kobayashi, Y.; Kasuya, Y.; Hori, H.; Arai, M. Relationship between wall surface roughness and fuel film evaporation for spray impingement. In Proceedings of the 10th International Conference on Modeling and Diagnostics for Advanced Engine Systems (COMODIA 2022), Sapporo, Japan, 5–8 July 2022. [Google Scholar] [CrossRef]
  10. Saito, A.; Kawamura, K. Behavior of Fuel Film on a Wall at Fuel Spray Impinging. Int. J. Fluid Mech. Res. 1997, 24, 707–715. [Google Scholar] [CrossRef]
  11. Jüngst, N.; Frapolli, N.; Wright, Y.; Boulouchos, K.; Kaiser, S. Experimental and numerical investigation of evaporating fuel films in combustion. Appl. Energy Combust. Sci. 2021, 7, 100033. [Google Scholar] [CrossRef]
  12. Xiao, D.; Li, X.; Hung, D.L.; Xu, M. Characteristics of Impinging Spray and Corresponding Fuel Film under Different Injection and Ambient Pressure. SAE Technical Paper. 2019. 2019-01-0277. Available online: https://saemobilus.sae.org/content/2019-01-0277/ (accessed on 7 February 2023). [CrossRef]
  13. Luo, H.; Nishida, K.; Ogata, Y.; Zhang, W.; Fujikawa, T. Fuel adhesion characteristics under non-evaporation and evaporation conditions: Part 1-effect of injection pressure. Fuel 2018, 240, 317–325. [Google Scholar] [CrossRef]
  14. Luo, H.; Nishida, K.; Ogata, Y. Fuel adhesion characteristics under non-evaporation and evaporation conditions: Part 2—Effect of ambient pressure. Fuel 2019, 251, 98–105. [Google Scholar] [CrossRef]
  15. Akop, M.Z.; Zama, Y.; Furuhata, T.; Arai, M. Characteristics of adhesion diesel fuel on an impingement disk wall. part 3: Ambient pressure effect. At. Sprays 2014, 24, 625–650. [Google Scholar] [CrossRef]
  16. Maligne, D.; Bruneaux, G. Time-Resolved Fuel Film Thickness Measurement for Direct Injection SI Engines Using Refractive Index Matching. In SAE Technical Paper; No. 2011-01-1215; SAE International: Warrendale, PA, USA, 2011. [Google Scholar] [CrossRef]
  17. Gong, C.; Luo, H.L.; Wu, X.C.; Nishida, K. Experimental analysis in dynamics characteristics of impinging spray by a pfi injector: From spray atomization to fuel adhesion formation. At. Sprays 2021, 31, 77–96. [Google Scholar] [CrossRef]
  18. Wang, Z.; Li, Y.; Guo, H.; Wang, C.; Xu, H. Microscopic and macroscopic characterization of spray impingement under flash boiling conditions with the application of split injection strategy. Fuel 2018, 212, 315–325. [Google Scholar] [CrossRef]
  19. Wu, H.; Dong, X.; Shi, Z.; Li, H.; Cao, W.; Zhang, L.; Bo, Y.; Li, X. Effect of injection timing on knock combustion and pollutant emission of heavy-duty diesel engines at low temperatures. Chemosphere 2022, 305, 135519. [Google Scholar] [CrossRef]
  20. Shim, Y.-S.; Choi, G.-M.; Kim, D.-J. Numerical and experimental study on effect of wall geometry on wall impingement process of hollow-cone fuel spray under various ambient conditions. Int. J. Multiph. Flow 2009, 35, 885–895. [Google Scholar] [CrossRef]
  21. Li, Y.; Li, X.; Cao, W.; Shi, Z.; Bo, Y.; Wu, H. Acting mechanism of low ambient temperature on wall-impinging diesel spray ignition at an extensive range. Fuel 2021, 304, 121344. [Google Scholar] [CrossRef]
  22. Ma, T.; Feng, L.; Wang, H.; Liu, H.; Yao, M. Analysis of near wall combustion and pollutant migration after spray impingement. Int. J. Heat Mass Transf. 2019, 141, 569–579. [Google Scholar] [CrossRef]
  23. Liu, H.; Zhang, B.; Jia, M.; Yan, Y.; Cai, C. Experimental study and theoretical analysis on the criterion of boiling of wall film for different fuels. Int. Commun. Heat Mass Transf. 2023, 142, 106655. [Google Scholar] [CrossRef]
  24. Schulz, F.; Beyrau, F. The influence of flash-boiling on spray-targeting and fuel film formation. Fuel 2017, 208, 587–594. [Google Scholar] [CrossRef]
  25. Schulz, F.; Beyrau, F. The effect of operating parameters on the formation of fuel wall films as a basis for the reduction of engine particulate emissions. Fuel 2018, 238, 375–384. [Google Scholar] [CrossRef]
  26. Lee, Z.; Kim, D.; Park, S. Effects of spray behavior and wall impingement on particulate matter emissions in a direct injection spark ignition engine equipped with a high pressure injection system. Energy Convers. Manag. 2020, 213, 112865. [Google Scholar] [CrossRef]
  27. Cheng, Y.-S.; Deng, K.; Li, T. The coupling influence of airflow and temperature on the wall-wetted fuel film distribution. Exp. Therm. Fluid Sci. 2010, 34, 227–233. [Google Scholar] [CrossRef]
  28. Isshiki, S.; Matsuda, D.; Matsumura, E.; Senda, J.; Kurata, K.; Inoue, Y. Wall Adhesion Characteristics of Fuel Spray under Flow Conditions in Intake Port Fuel Injection Spark Ignition Engines. Trans. Soc. Automot. Eng. Jpn. 2023, 54, 14–20. [Google Scholar] [CrossRef]
  29. Zhang, G.; Luo, H.; Kita, K.; Ogata, Y.; Nishida, K. Statistical variation analysis of fuel spray characteristics under cross-flow conditions. Fuel 2021, 307, 121887. [Google Scholar] [CrossRef]
  30. Panão, M.R.O.; Moreira, A.L.N. Visualization and analysis of spray impingement under cross-flow conditions. SAE Technical Paper. 2002. 2002-01-2664. Available online: https://saemobilus.sae.org/content/2002-01-2664/ (accessed on 7 February 2023). [CrossRef]
  31. Whitelaw, J.H.; Nouri, J.M. Gasoline sprays in uniform crossflow. At. Sprays 2007, 17, 621–640. [Google Scholar] [CrossRef]
  32. Guo, M.; Kishi, R.; Shi, B.; Ogata, Y.; Nishida, K. Effects of Cross-Flow on Fuel Spray Injected by Hole-Type Injector for Direct Injection Gasoline Engine 2nd Report: Spray Pattern, Droplets Size and Vortex Structure. At. Sprays 2016, 26, 53–72. [Google Scholar] [CrossRef]
  33. Guo, M.; Shimasaki, N.; Nishida, K.; Ogata, Y.; Wada, Y. Experimental study on fuel spray characteristics under atmospheric and pressurized cross-flow conditions. Fuel 2016, 184, 846–855. [Google Scholar] [CrossRef]
  34. Si, Z.; Ashida, Y.; Shimasaki, N.; Nishida, K.; Ogata, Y. Effect of cross-flow on spray structure, droplet diameter and velocity of impinging spray. Fuel 2018, 234, 592–603. [Google Scholar] [CrossRef]
  35. Li, Y.; Huang, Y.; Yang, S.; Luo, K.; Chen, R.; Tang, C. A comprehensive experimental investigation on the PFI spray impingement: Effect of impingement geometry, cross-flow and wall temperature. Appl. Therm. Eng. 2019, 159, 113848. [Google Scholar] [CrossRef]
  36. Zhang, G.; Si, Z.; Zhai, C.; Luo, H.; Ogata, Y.; Nishida, K. Characteristics of wall-jet vortex development during fuel spray impinging on flat-wall under cross-flow conditions. Fuel 2022, 317, 123507. [Google Scholar] [CrossRef]
  37. Zhang, G.; Shi, P.; Luo, H.; Ogata, Y.; Nishida, K. Investigation on fuel adhesion characteristics of wall-impingement spray under cross-flow conditions. Fuel 2022, 320, 123925. [Google Scholar] [CrossRef]
  38. Safiullah; Nishida, K.; Ogata, Y.; Oda, T.; Ohsawa, K. Effects of nozzle hole size and rail pressure on diesel spray and mixture characteristics under similar injection rate profile–experimental, computational and analytical studies under non-evaporating spray condition. Proc. Inst. Mech. Eng. Part D 2021, 236, 310–321. [Google Scholar] [CrossRef]
  39. Safiullah; Nishida, K.; Ogata, Y. Evaporation and mixture formation characteristics of diesel spray under various nozzle hole size and injection pressure condition employing similar injection rate profile. Int. Commun. Heat Mass Transf. 2021, 123, 105184. [Google Scholar] [CrossRef]
  40. Safiullah; Ray, S.C.; Nishida, K.; McDonell, V.; Ogata, Y. Effects of full transient Injection Rate and Initial Spray Trajectory Angle profiles on the CFD simulation of evaporating diesel sprays- comparison between singlehole and multi hole injectors. Energy 2023, 263, 125796. [Google Scholar] [CrossRef]
  41. Drake, M.C.; Fansler, T.D.; Rosalik, M.E. Quantitative high-speed imaging of piston fuel films in direct-injection engines using a refractive-index-matching technique. In Proceedings of the 15th Annual Conference on Liquid Atomization and Spray Systems (ILASS-Americas), Madison, WI, USA, 14–17 May 2002. [Google Scholar]
  42. He, X.; Li, Y.; Sjöberg, M.; Vuilleumier, D.; Ding, C.-P.; Liu, F.; Li, X. Impact of coolant temperature on piston wall-wetting and smoke generation in a stratified-charge DISI engine operated on E30 fuel. Proc. Combust. Inst. 2018, 37, 4955–4963. [Google Scholar] [CrossRef]
  43. He, X.; Li, Y.; Liu, C.; Sjöberg, M.; Vuilleumier, D.; Liu, F.; Yang, Q. Characteristics of spray and wall wetting under flash-boiling and non-flashing conditions at varying ambient pressures. Fuel 2019, 264, 116683. [Google Scholar] [CrossRef]
  44. Pan, H.; Xiao, D.; Hung, D.; Xu, M.; Li, X. Experimental investigations of wall jet droplet impact on spray impingement fuel film formation. Fuel 2018, 241, 33–41. [Google Scholar] [CrossRef]
Figure 1. High-pressure wind tunnel and observation chamber.
Sustainability 15 06312 g001
Figure 2. Optical arrangement for the RIM experiment.
Sustainability 15 06312 g002
Figure 3. RIM principle.
Sustainability 15 06312 g003
Figure 4. Calibration fitting curve.
Sustainability 15 06312 g004
Figure 5. Image-processing procedure.
Sustainability 15 06312 g005
Figure 6. Expansion of fuel adhesion after EOI (5 MPa).
Sustainability 15 06312 g006
Figure 7. Expansion of fuel adhesion after EOI (10 MPa).
Sustainability 15 06312 g007
Figure 8. Fuel adhesion area after EOI.
Sustainability 15 06312 g008
Figure 9. Fuel-adhesion mass after EOI.
Sustainability 15 06312 g009
Figure 10. Fuel-adhesion thickness after EOI.
Sustainability 15 06312 g010
Figure 11. Probability of fuel adhesion along thickness after EOI.
Sustainability 15 06312 g011aSustainability 15 06312 g011b
Figure 12. Fuel-adhesion lifetime predictions.
Sustainability 15 06312 g012
Table 1. Experimental conditions.
Injection Conditions
Nozzle diameter, D (mm)0.15
L/D2.2
Pressure, Pinj (MPa)5.10
Pulse, tinj (ms)2.8
Impingement condition
Shape and sizeRectangle (125 mm × 70 mm)
Distance (mm)50
Angle (°)10
Roughness (μm)Ra 7.7
Photography condition
Optical methodsRIM
Frame rate10,000 fps
Frame size1024 × 640
Image resolution7.7 pixels/mm
Disclaimer/Publisher’s Note: The statements, opinions and data contained in all publications are solely those of the individual author(s) and contributor(s) and not of MDPI and/or the editor(s). MDPI and/or the editor(s) disclaim responsibility for any injury to people or property resulting from any ideas, methods, instructions or products referred to in the content.

