
Characteristics of Droplet Behaviors during Spray Breakup Process

 ,
,
Abstract
:1. Introduction
2. Experimental System and Conditions
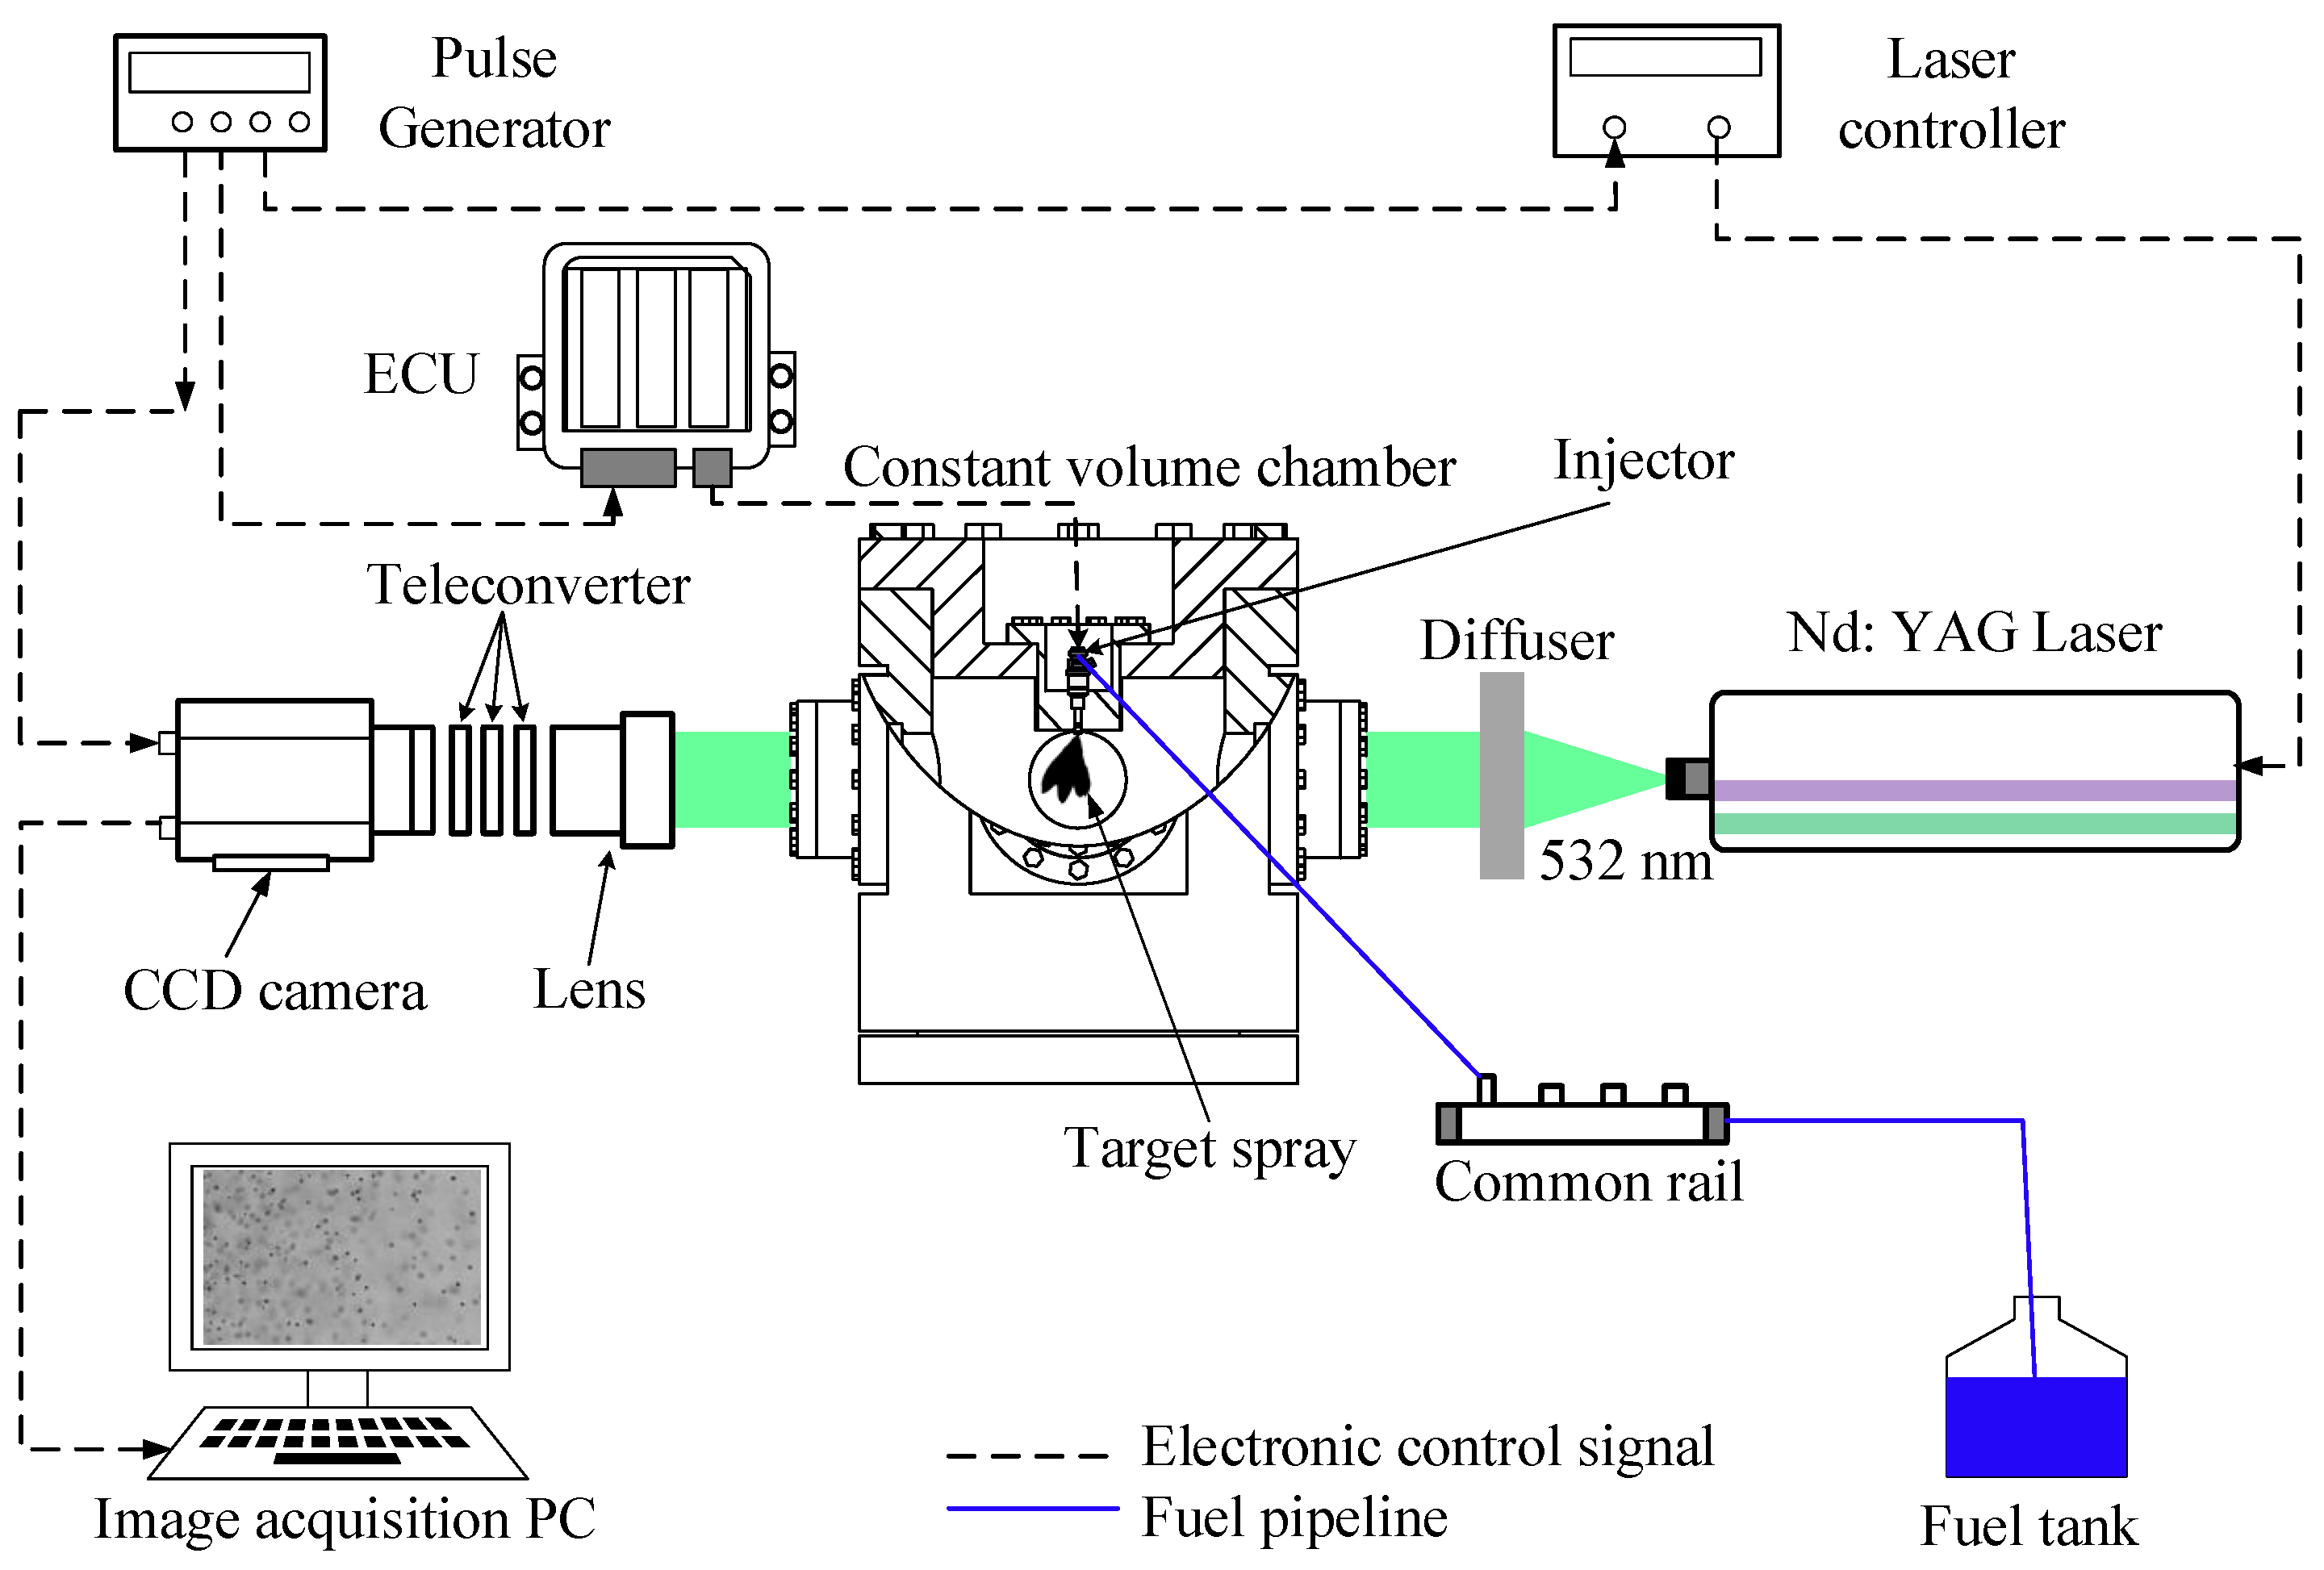
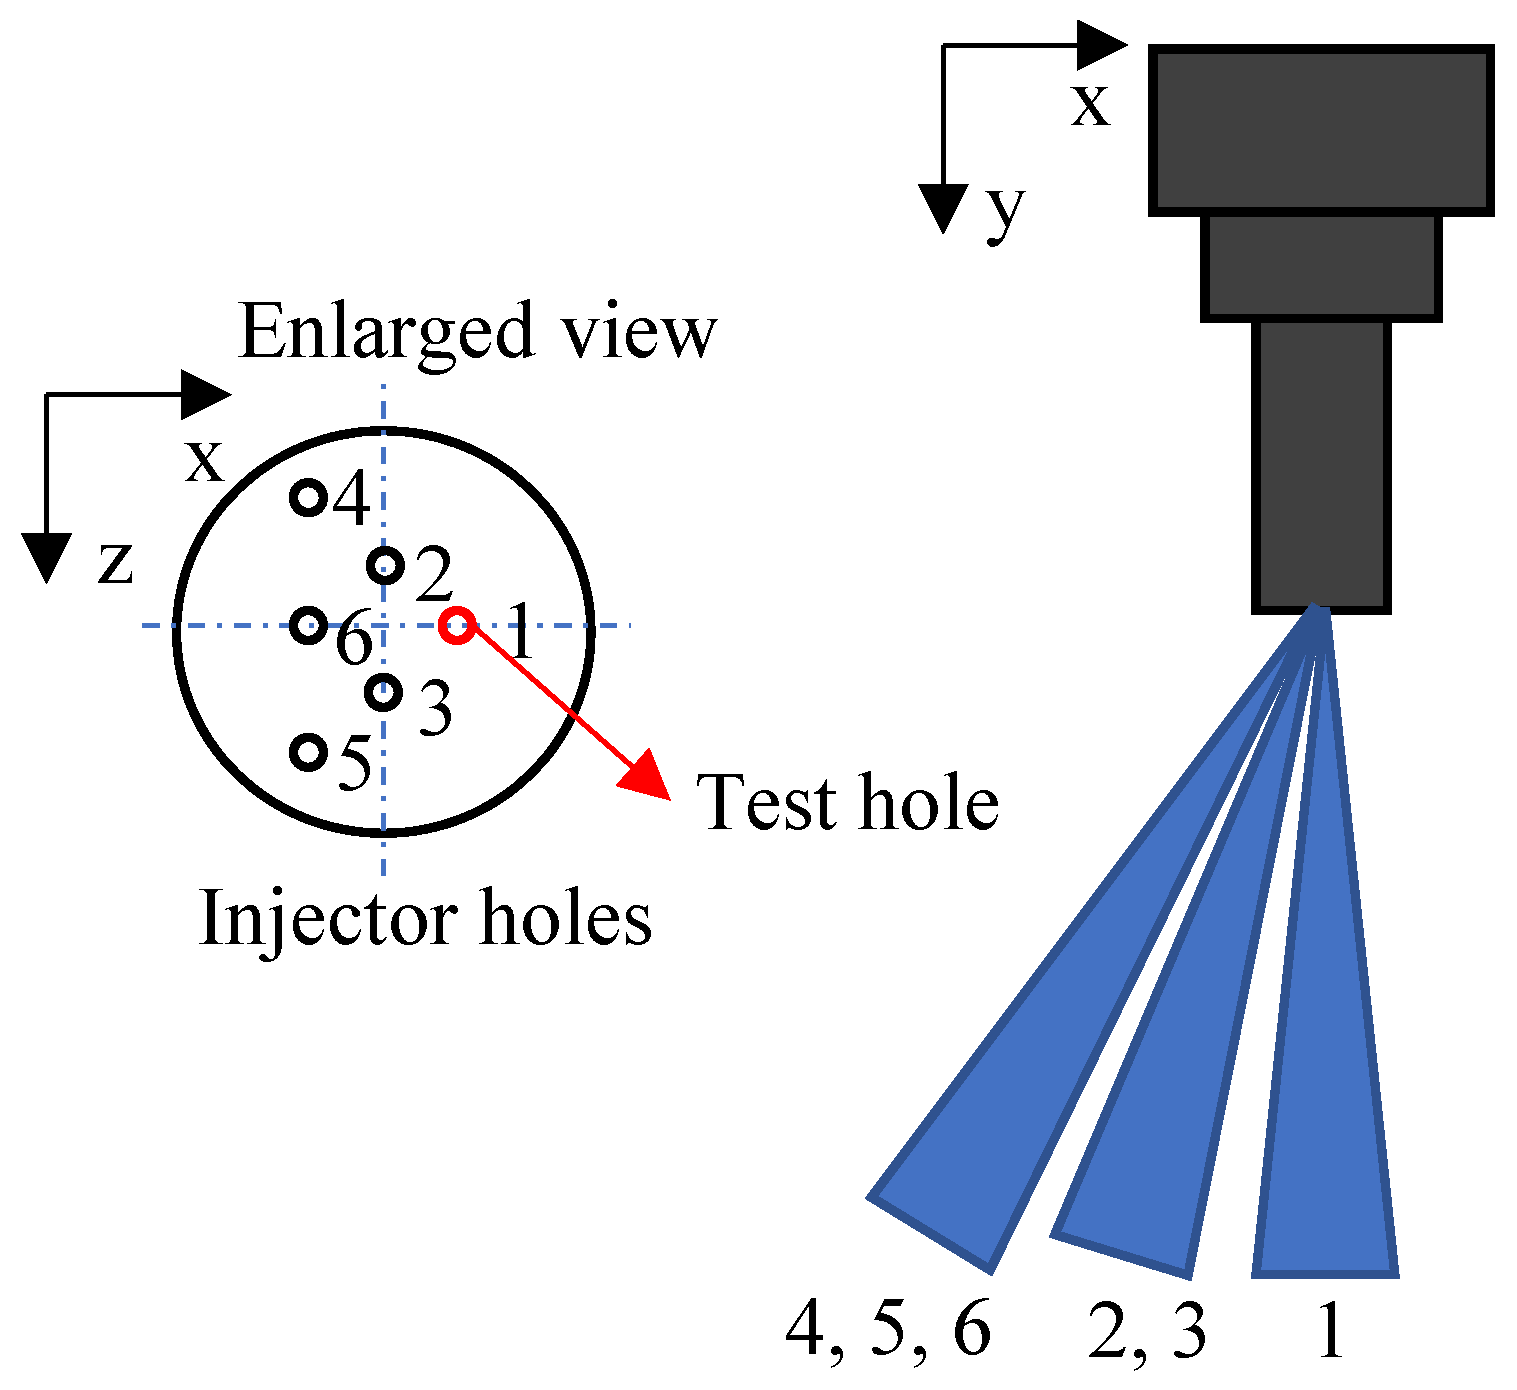
2.1. Experimental Setup
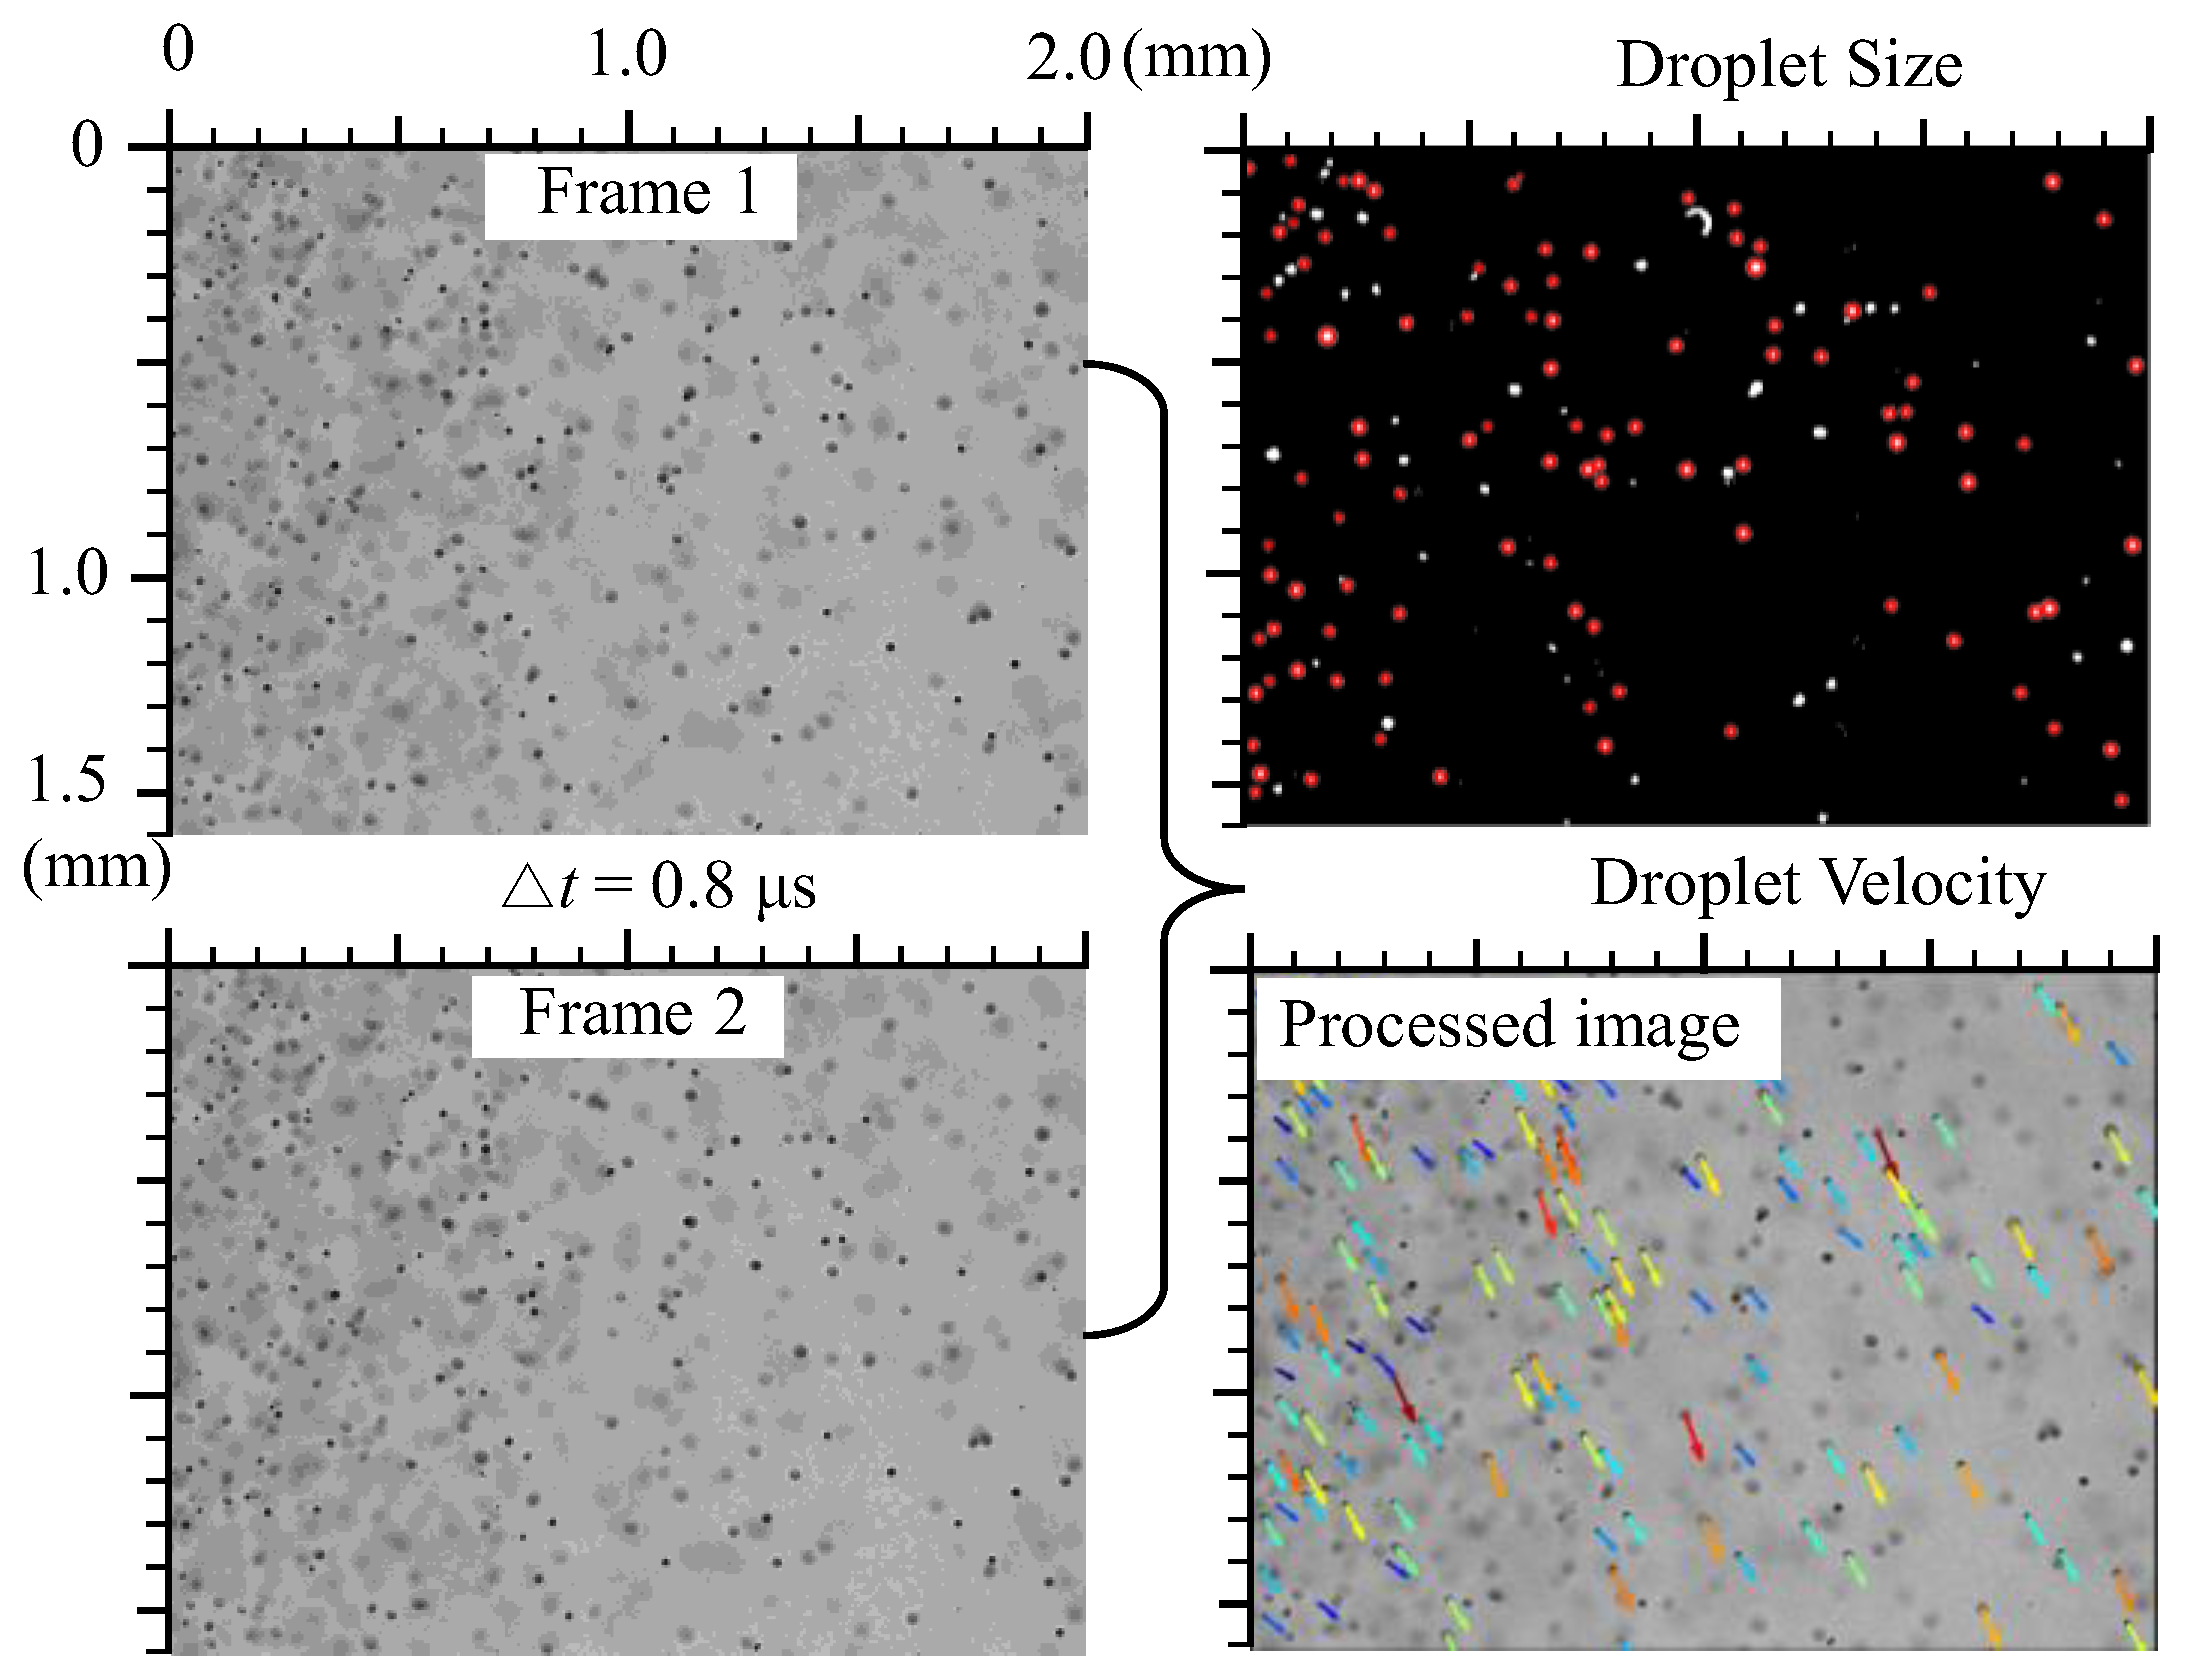
2.2. Image Processing Method
3. Results and Discussion
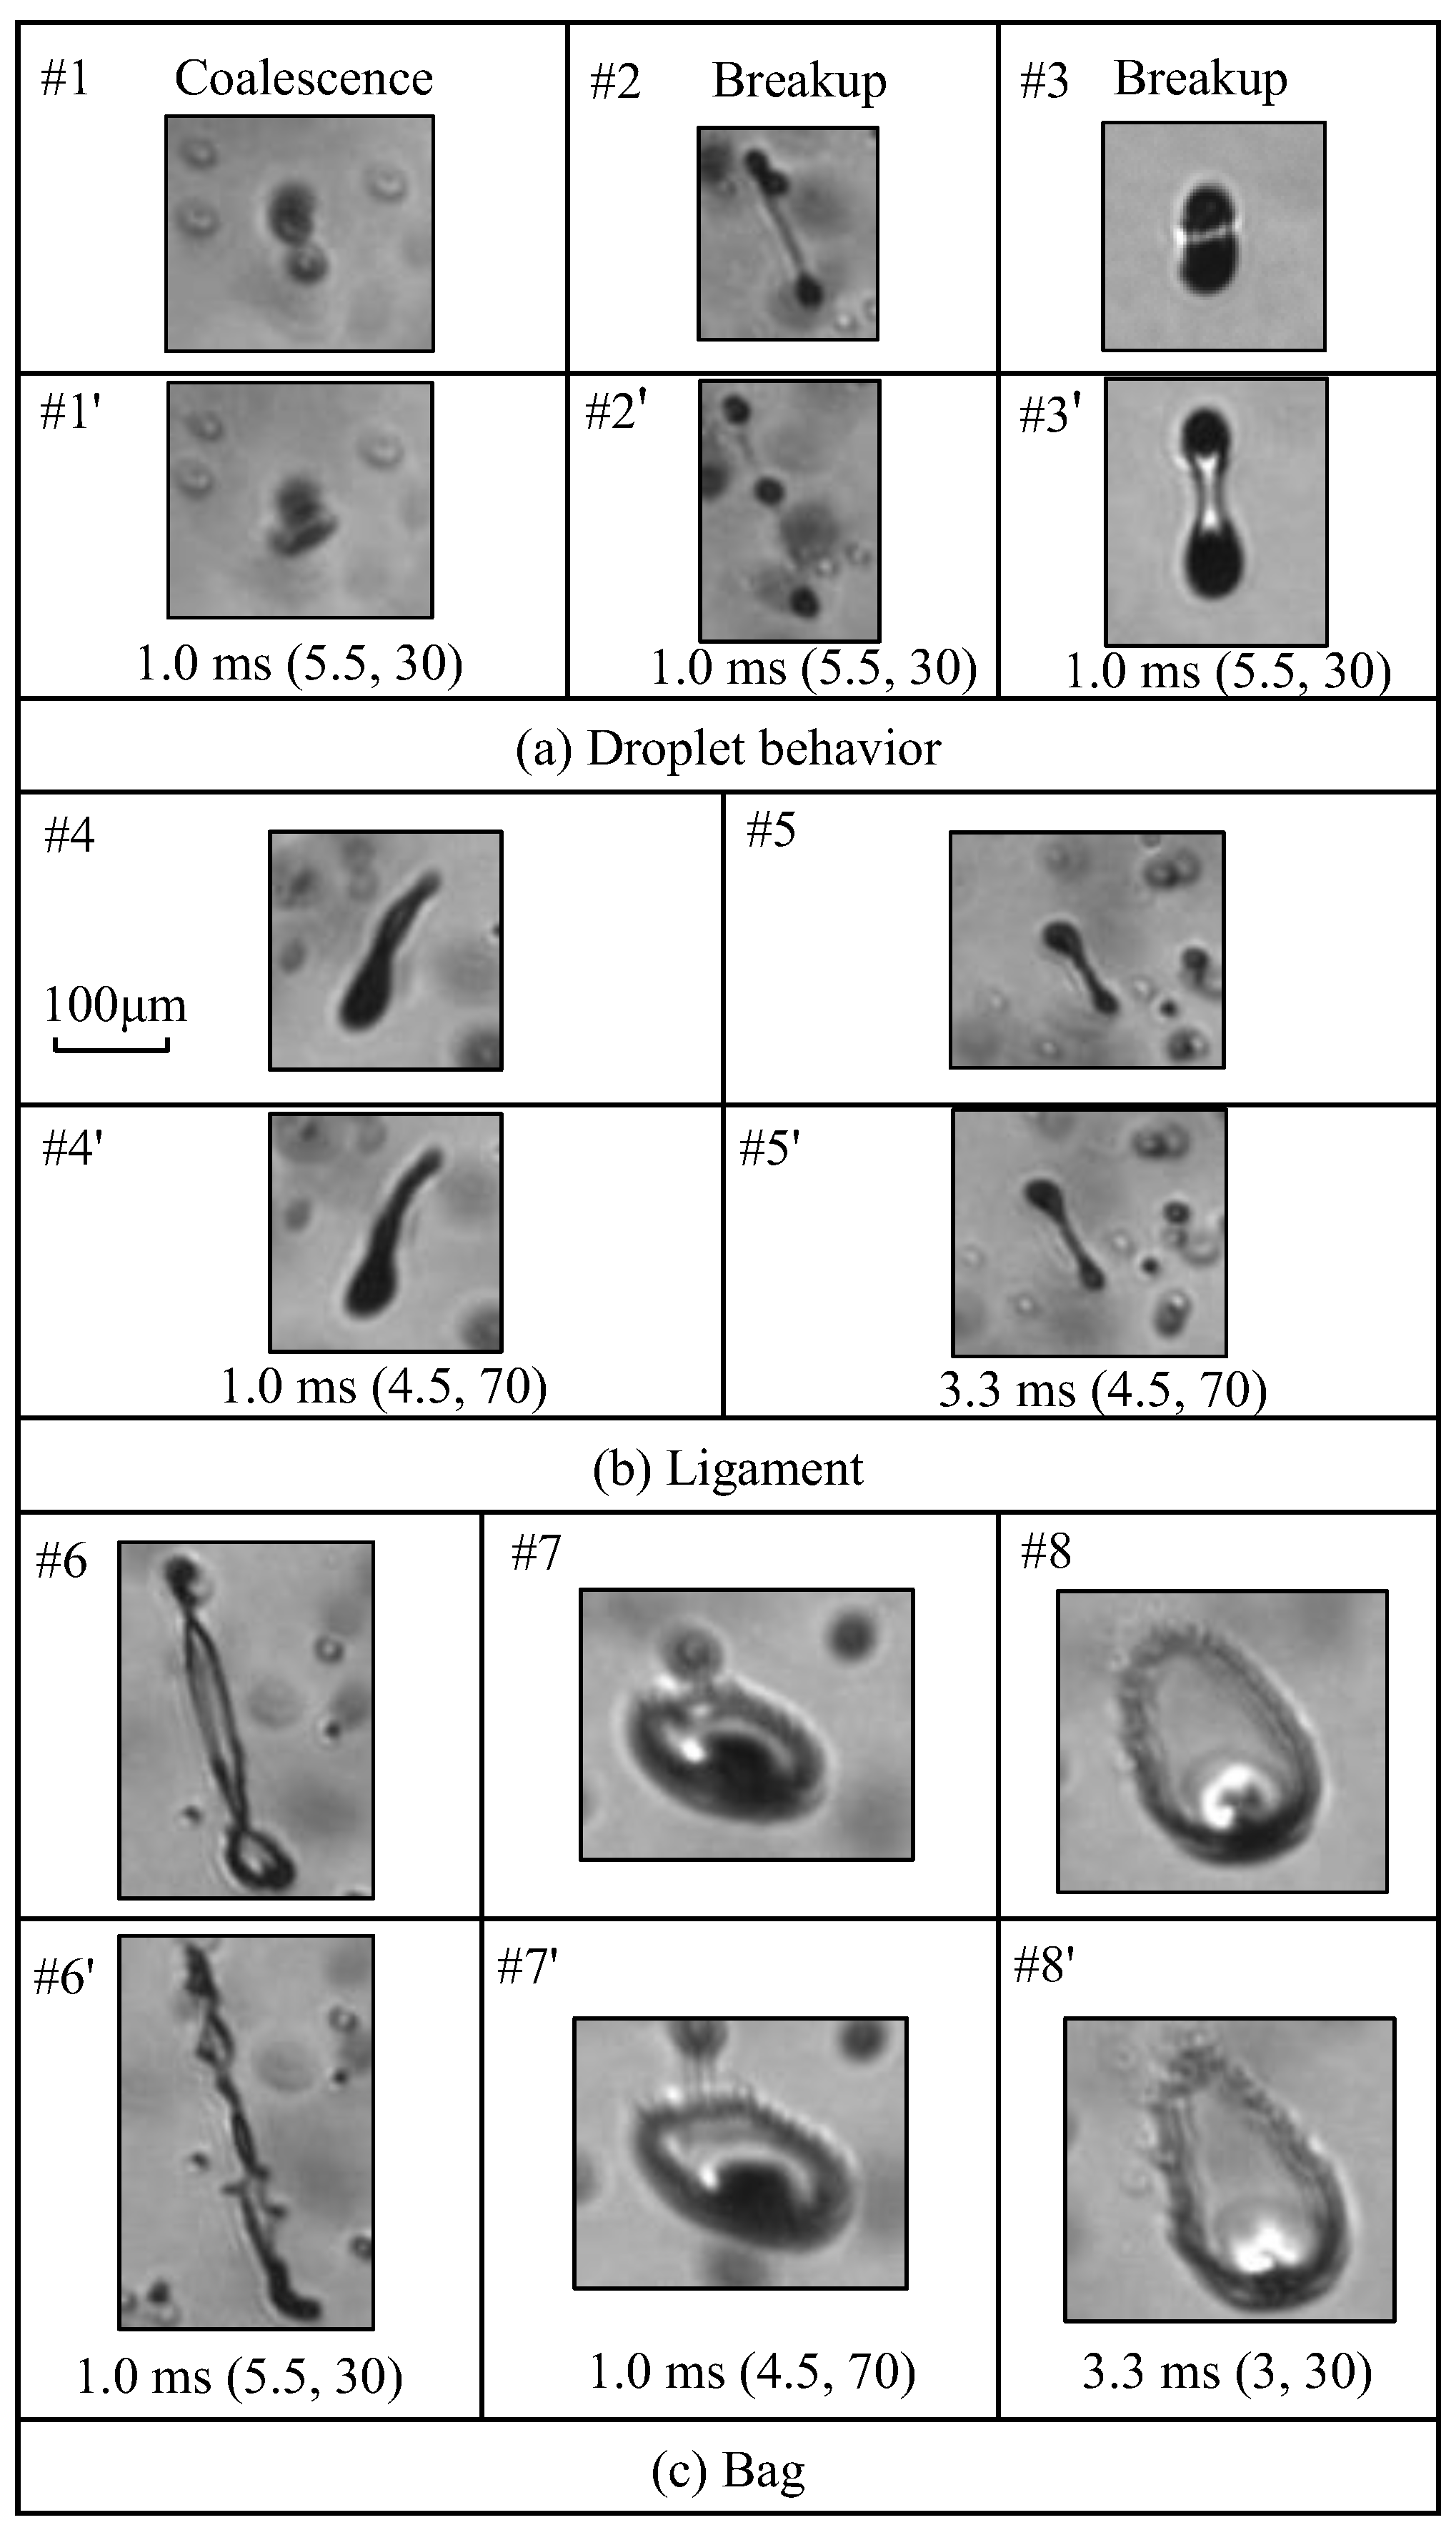
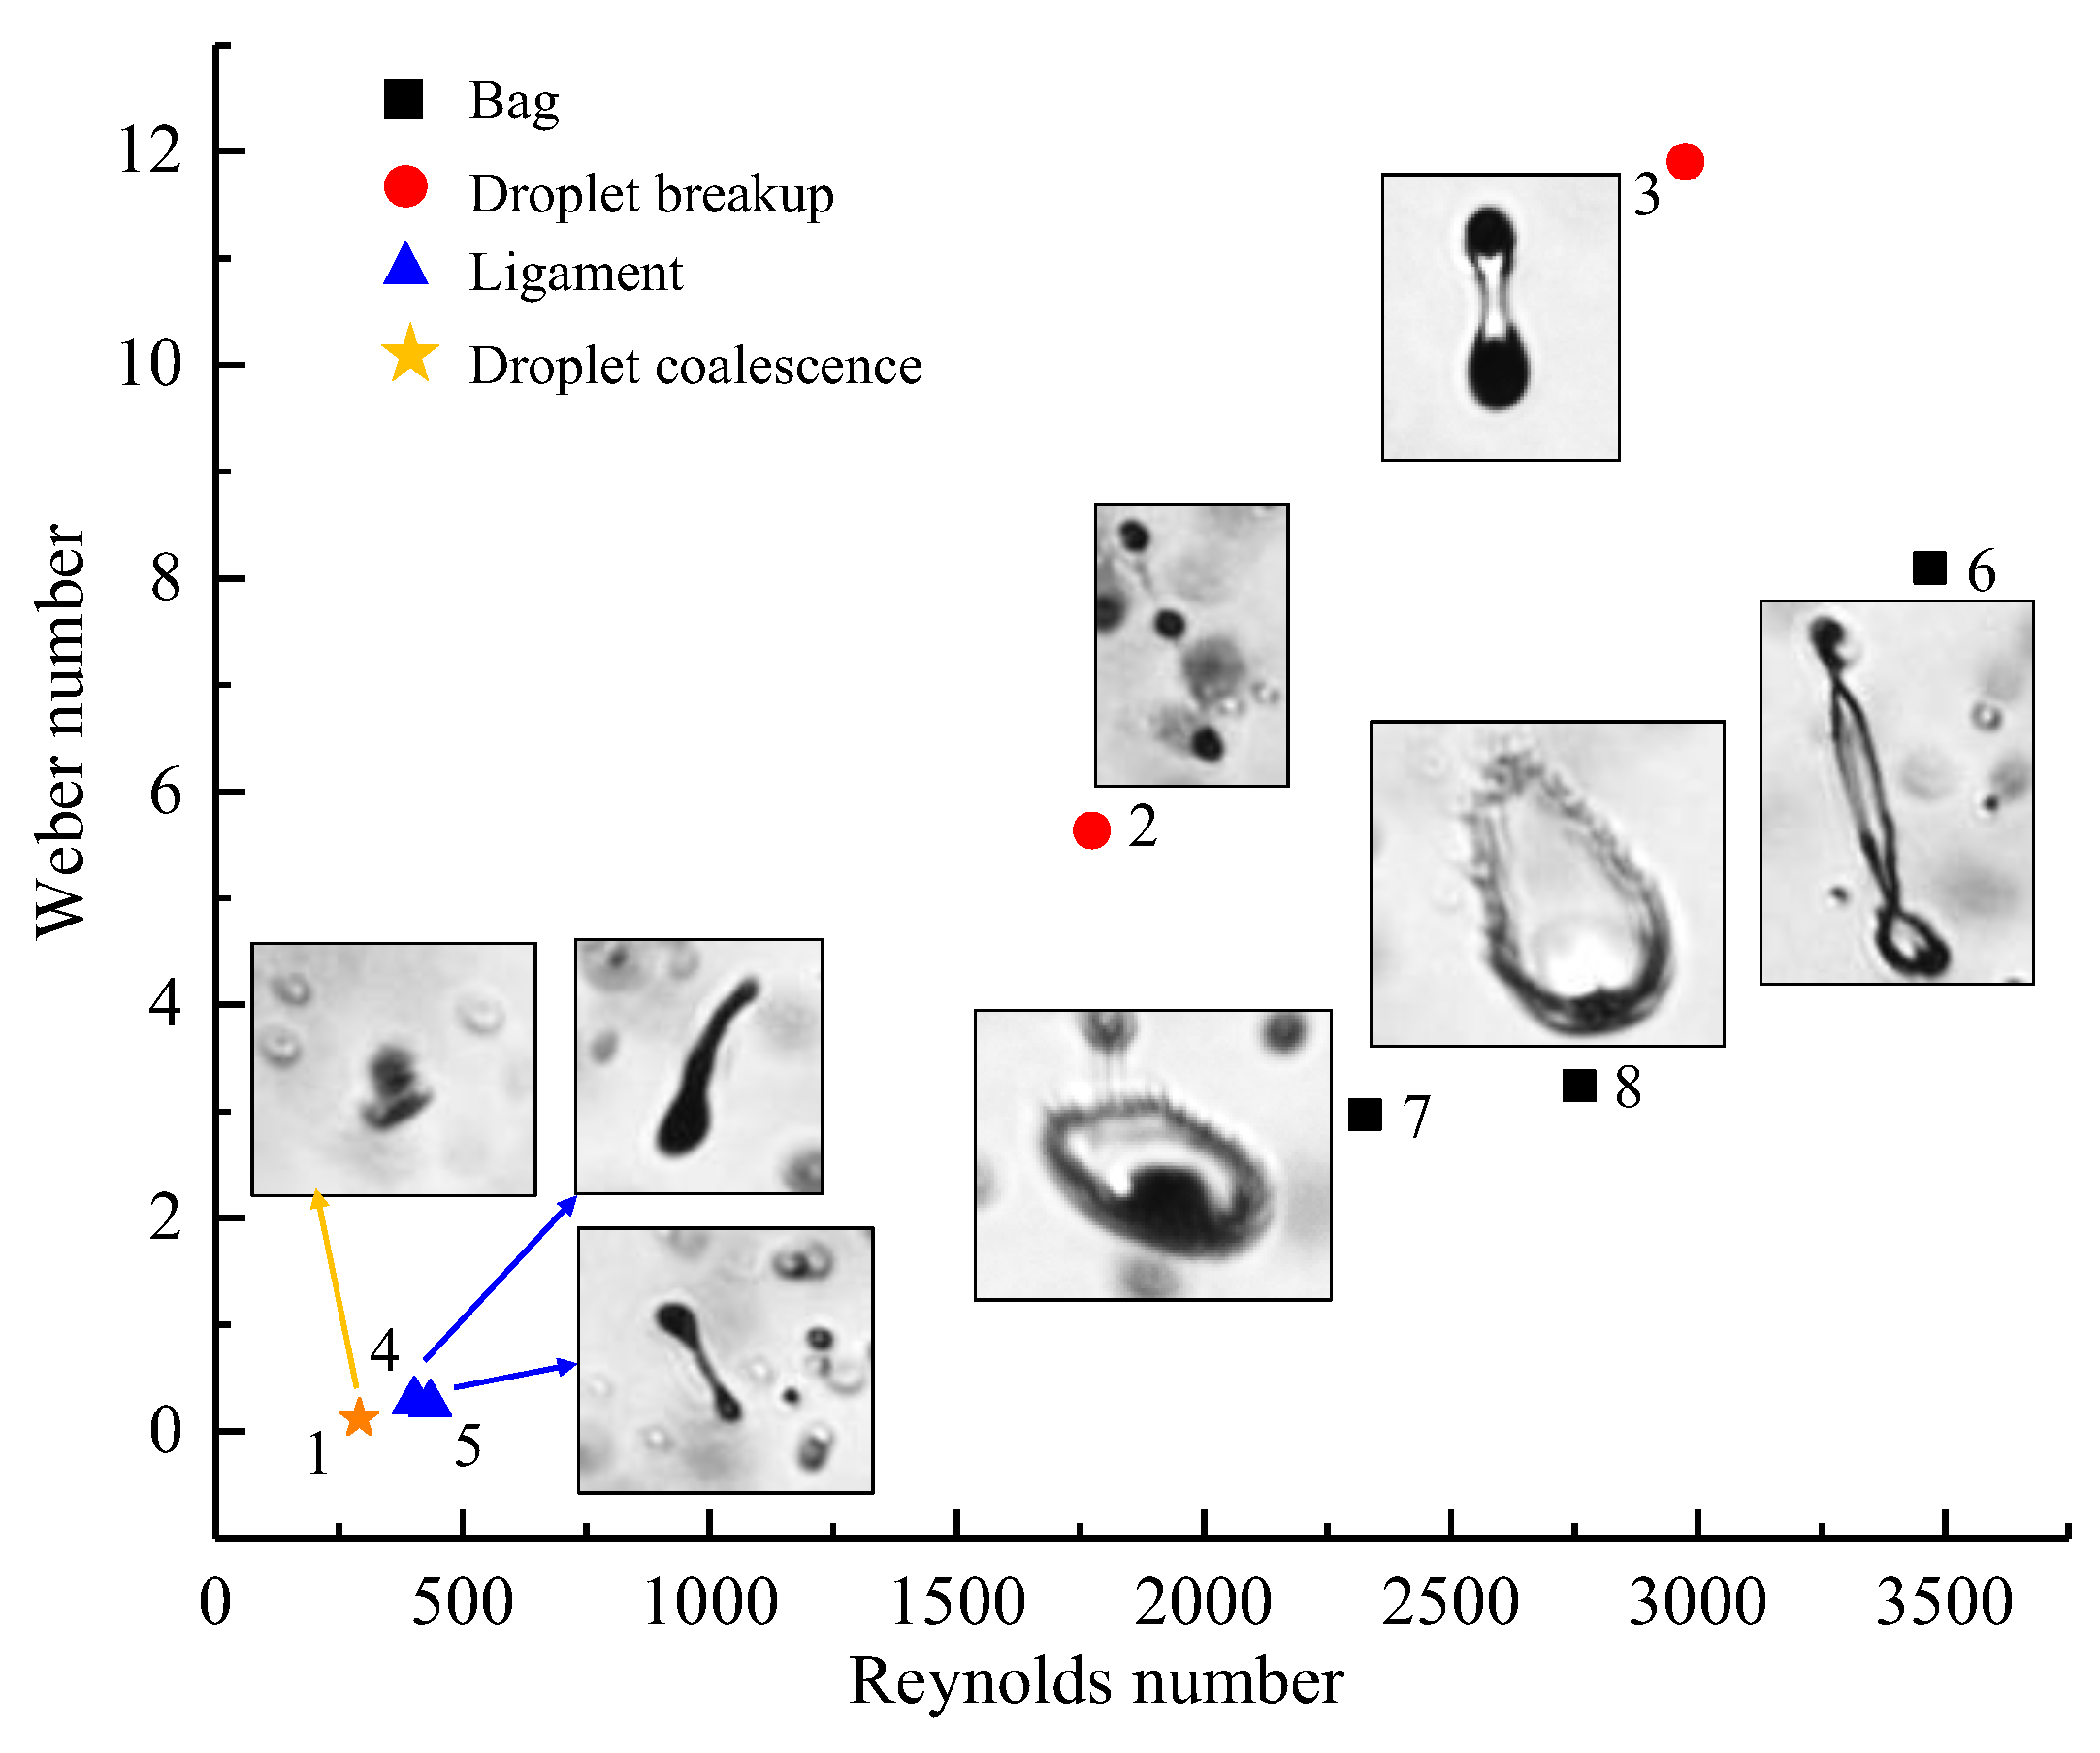
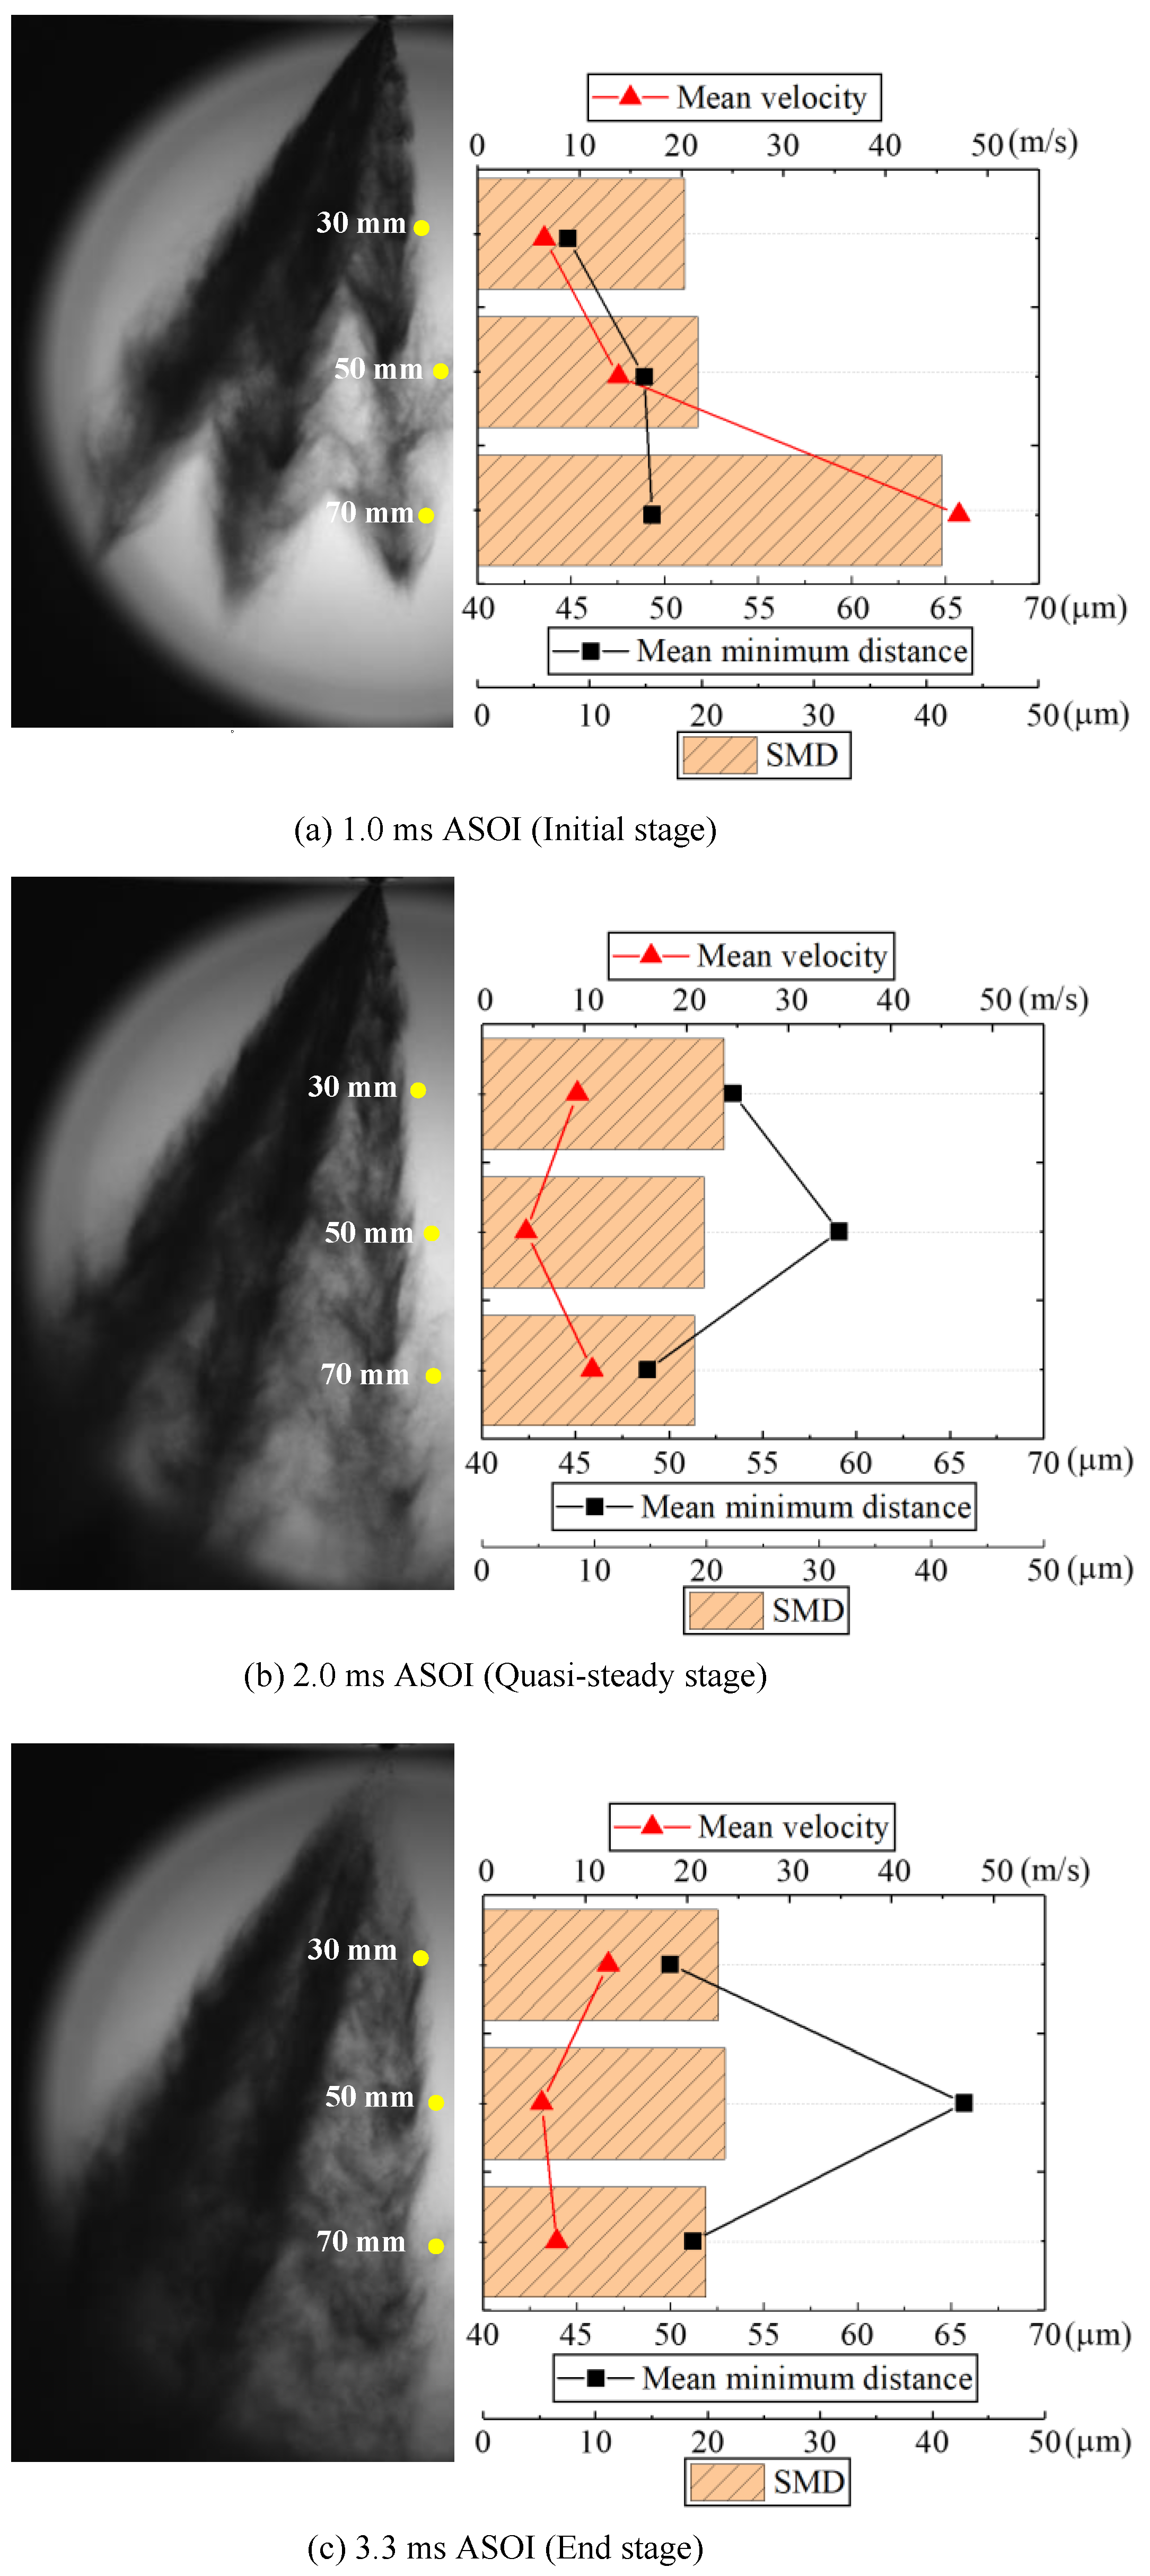
3.1. Morphological Changes at Spray Periphery
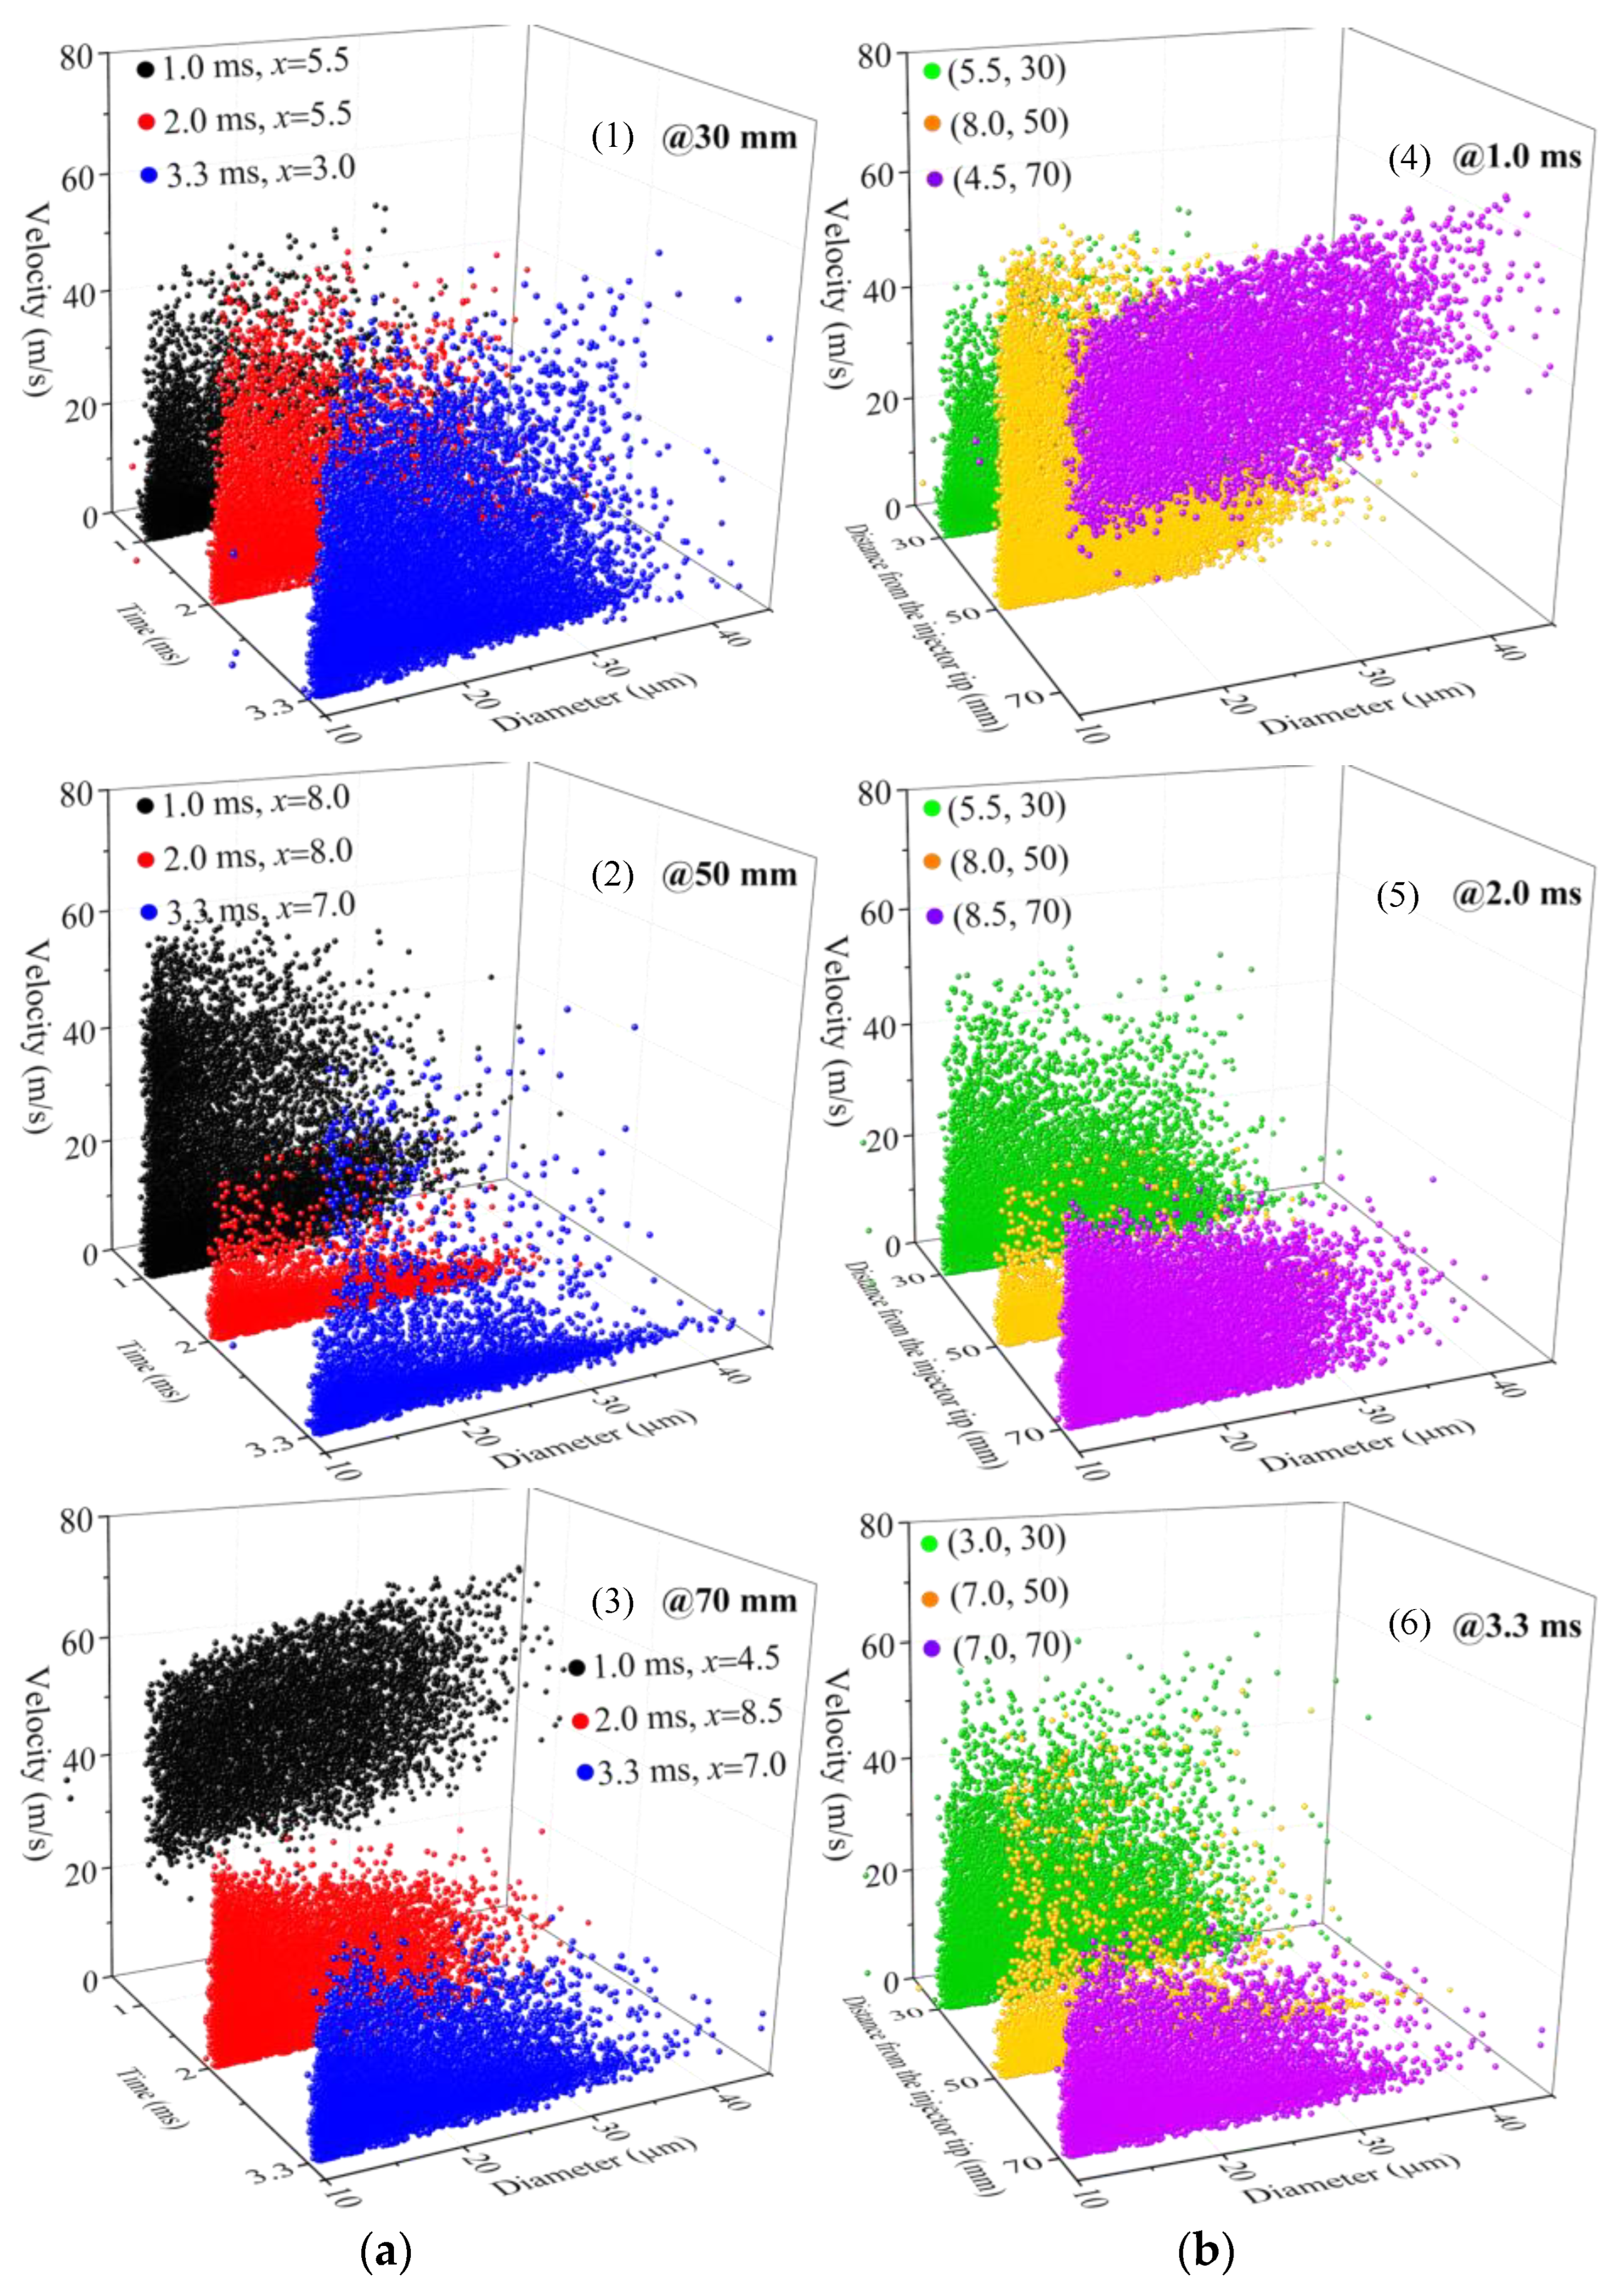
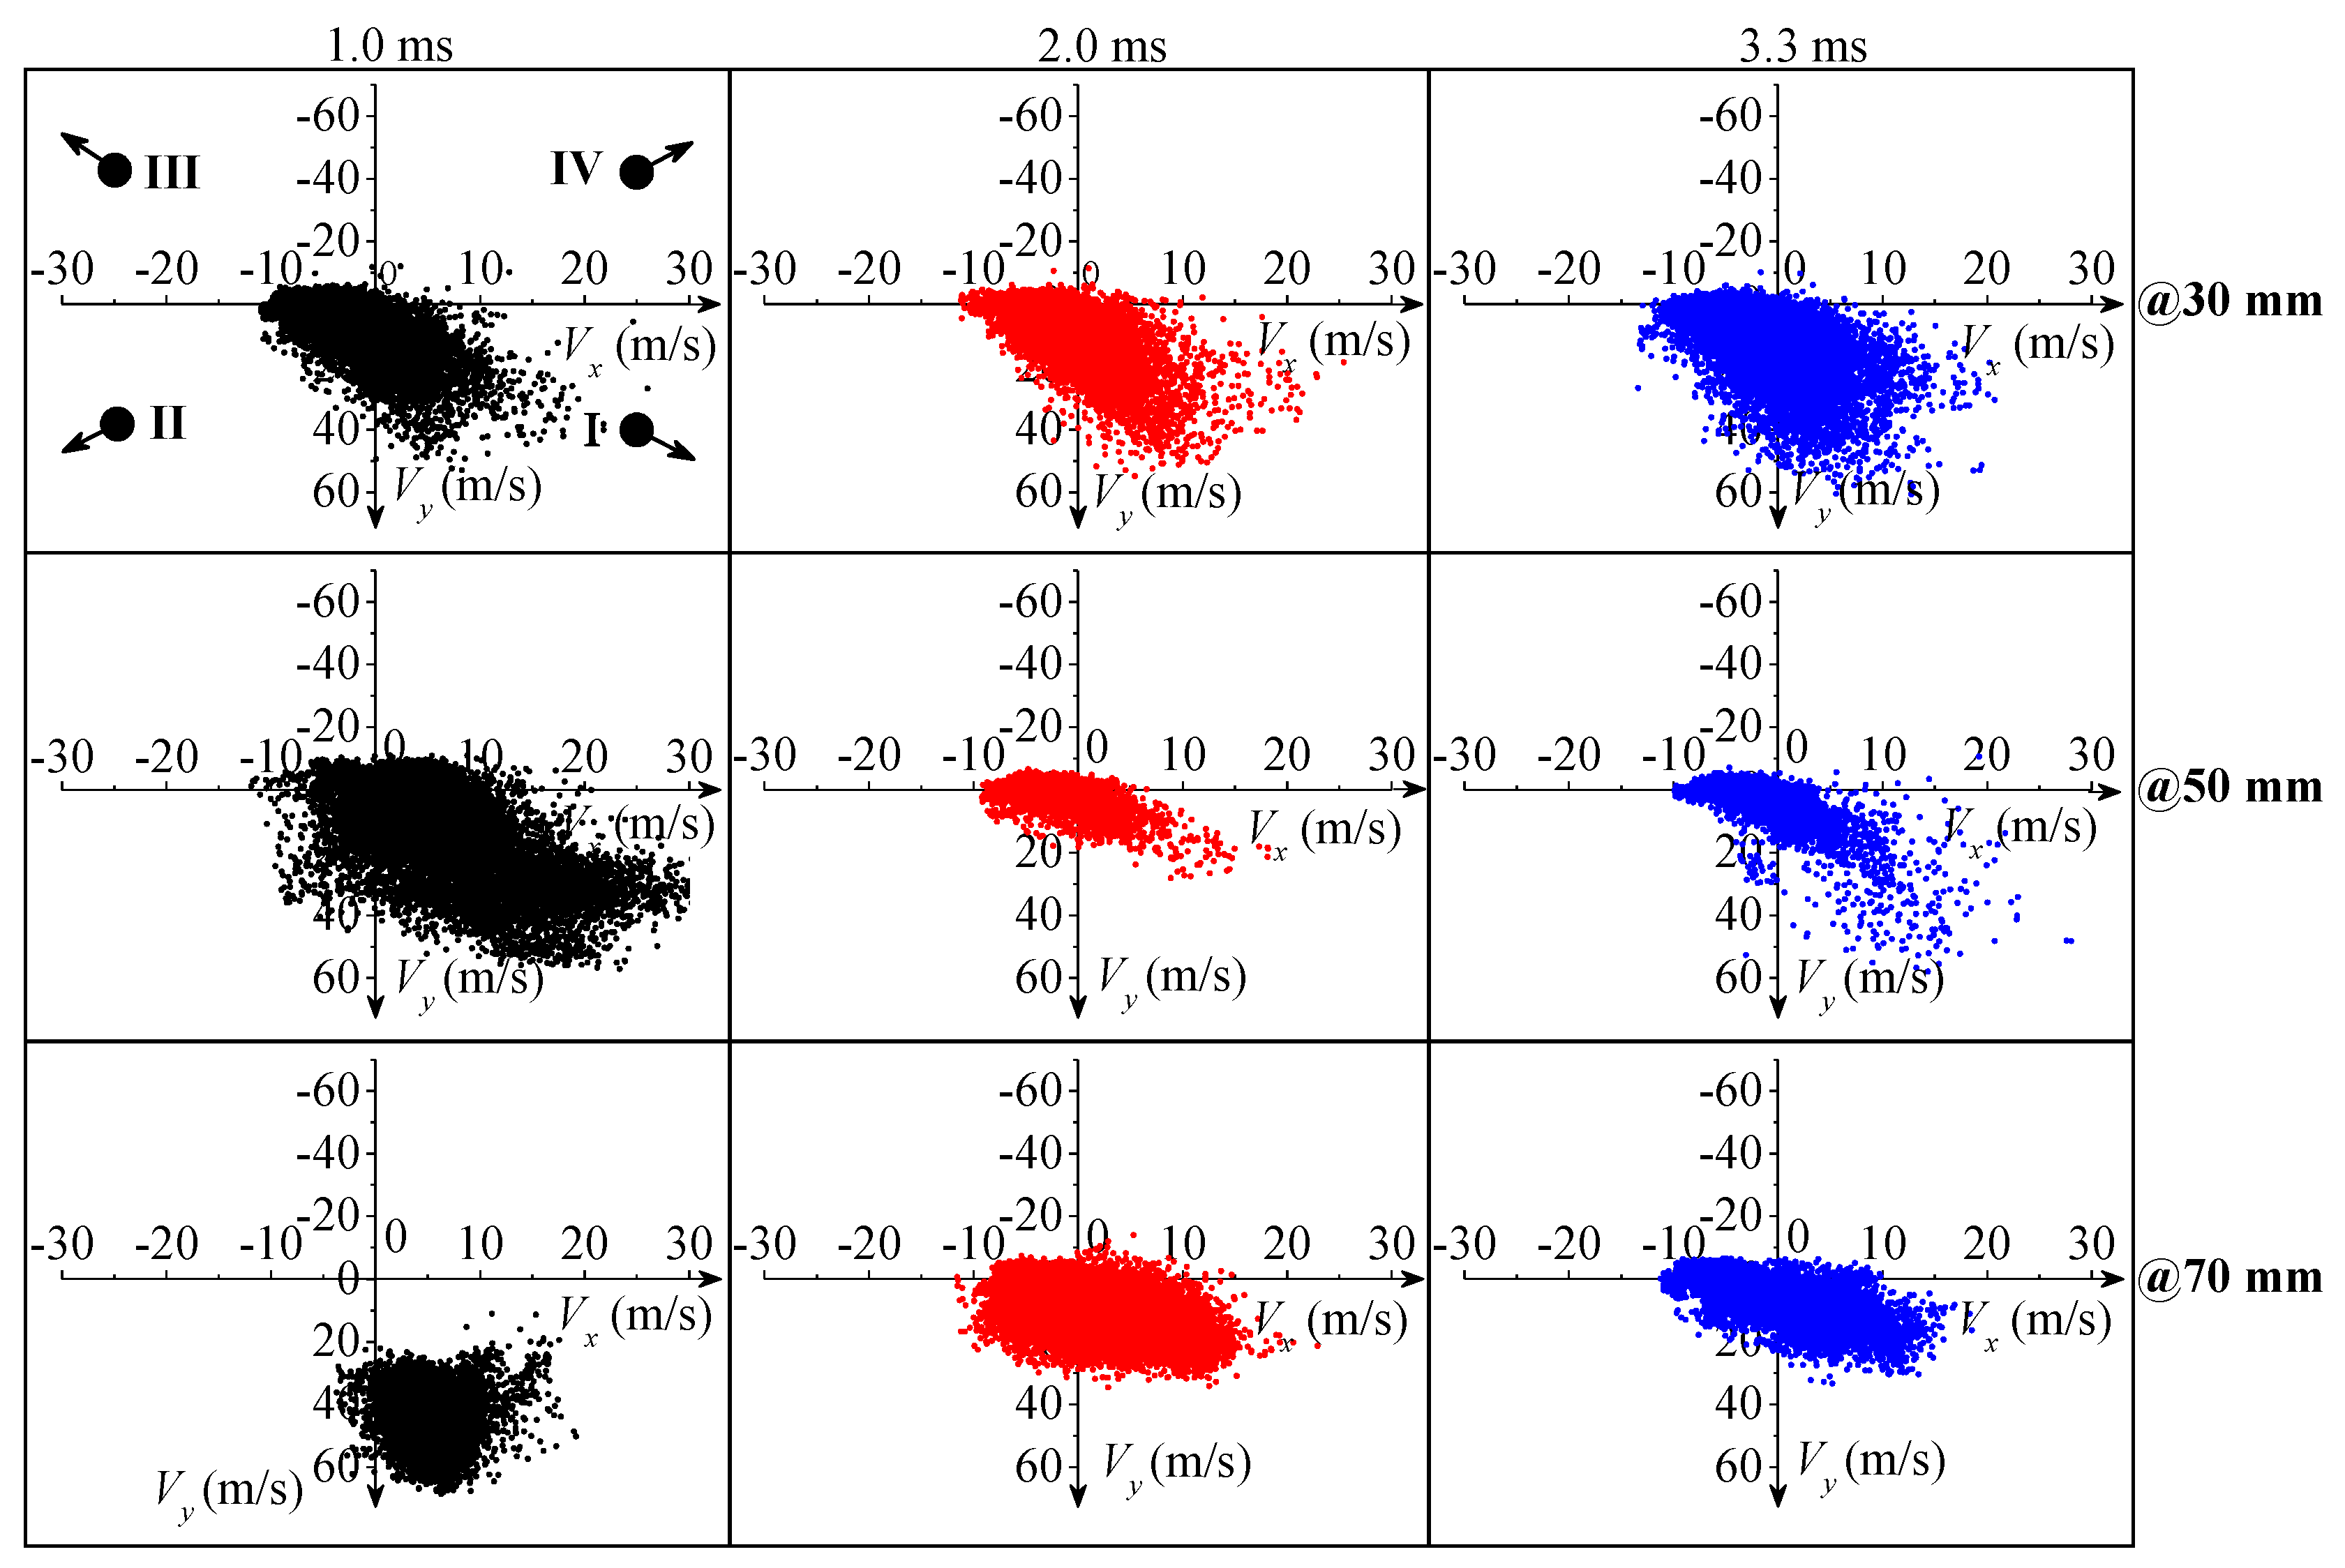
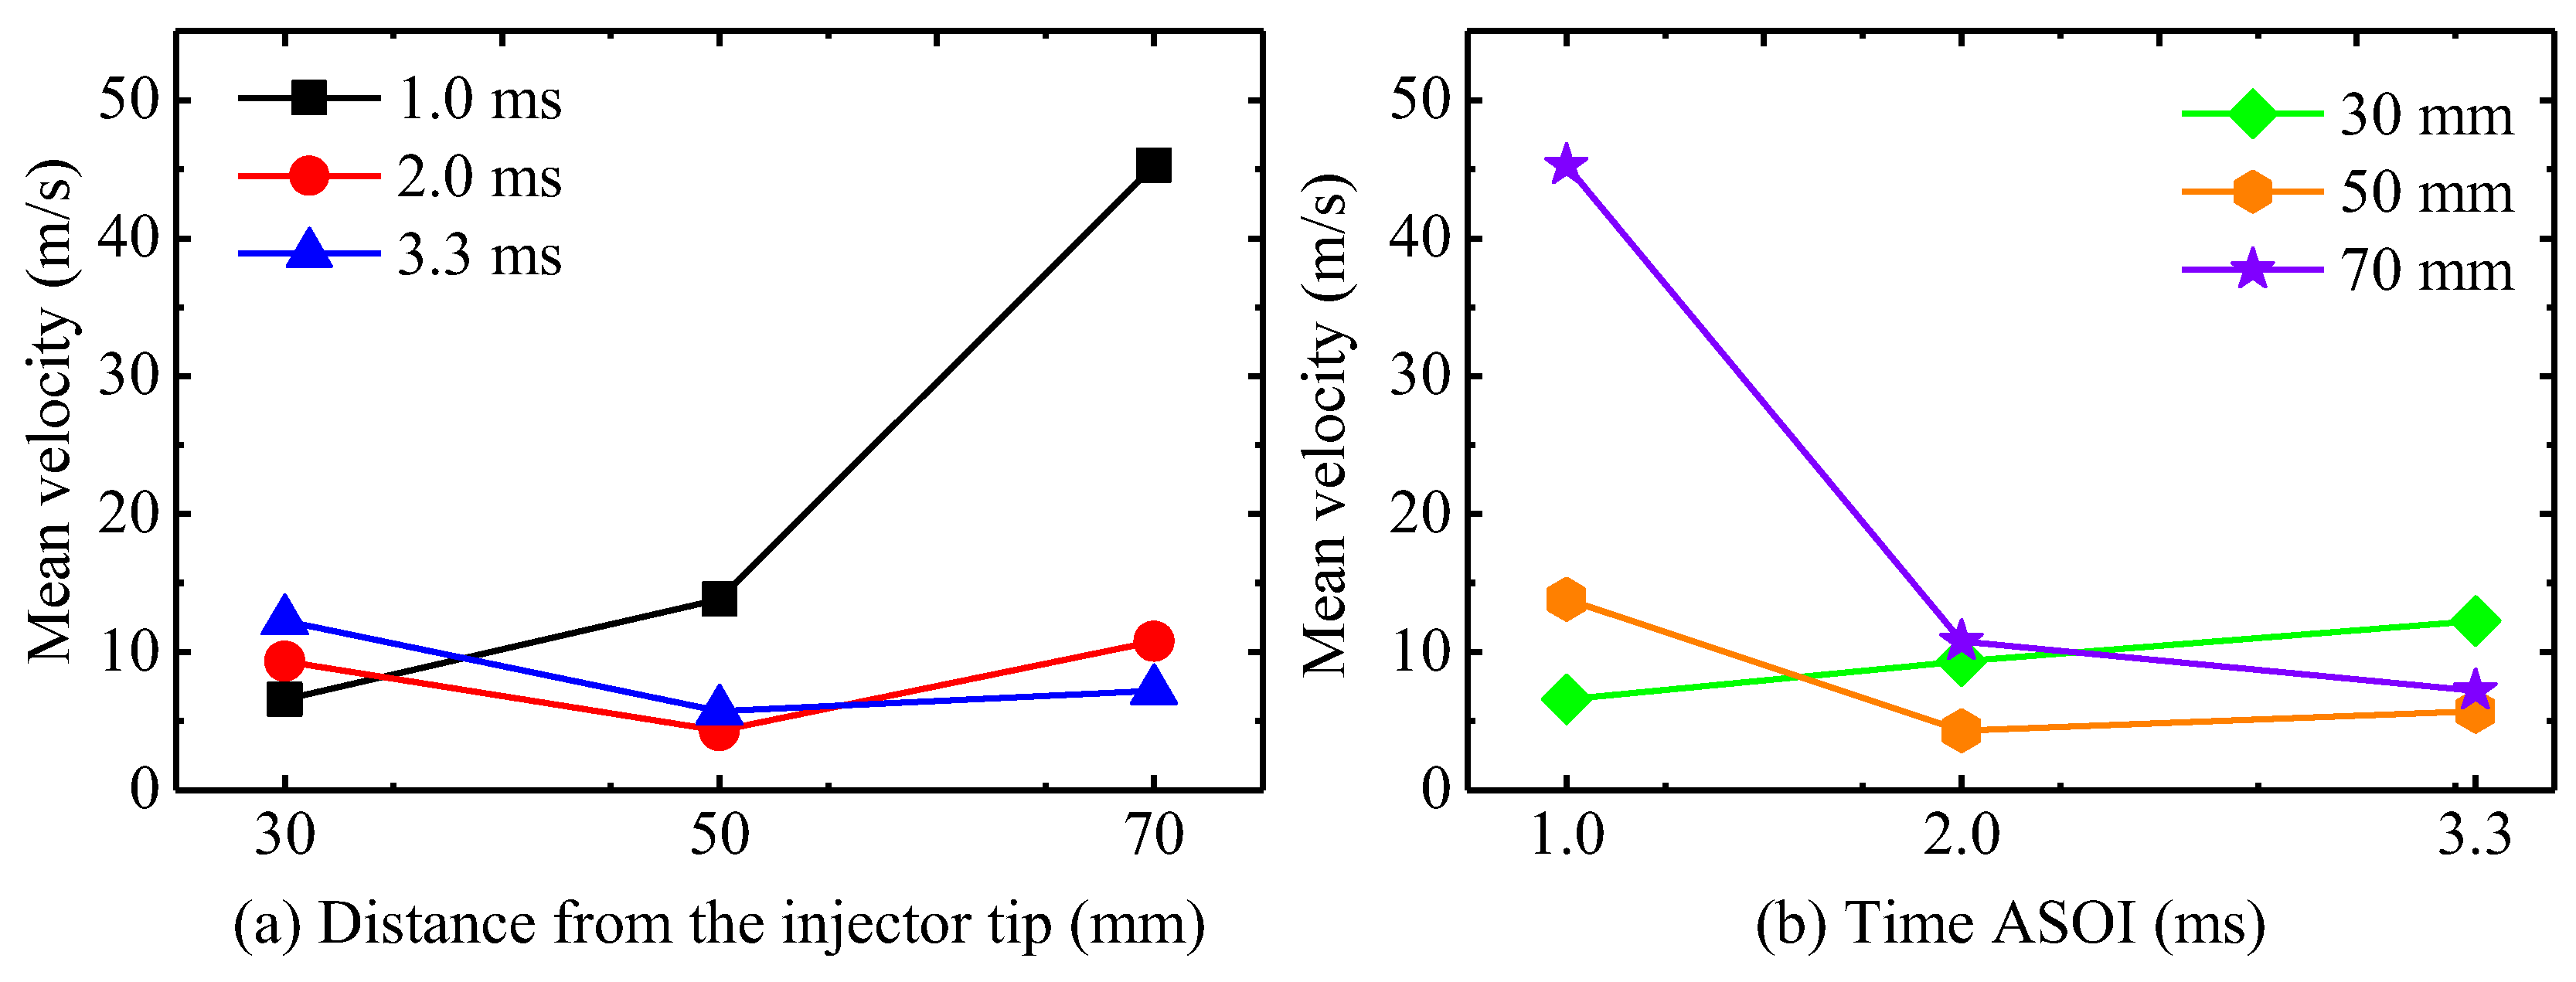
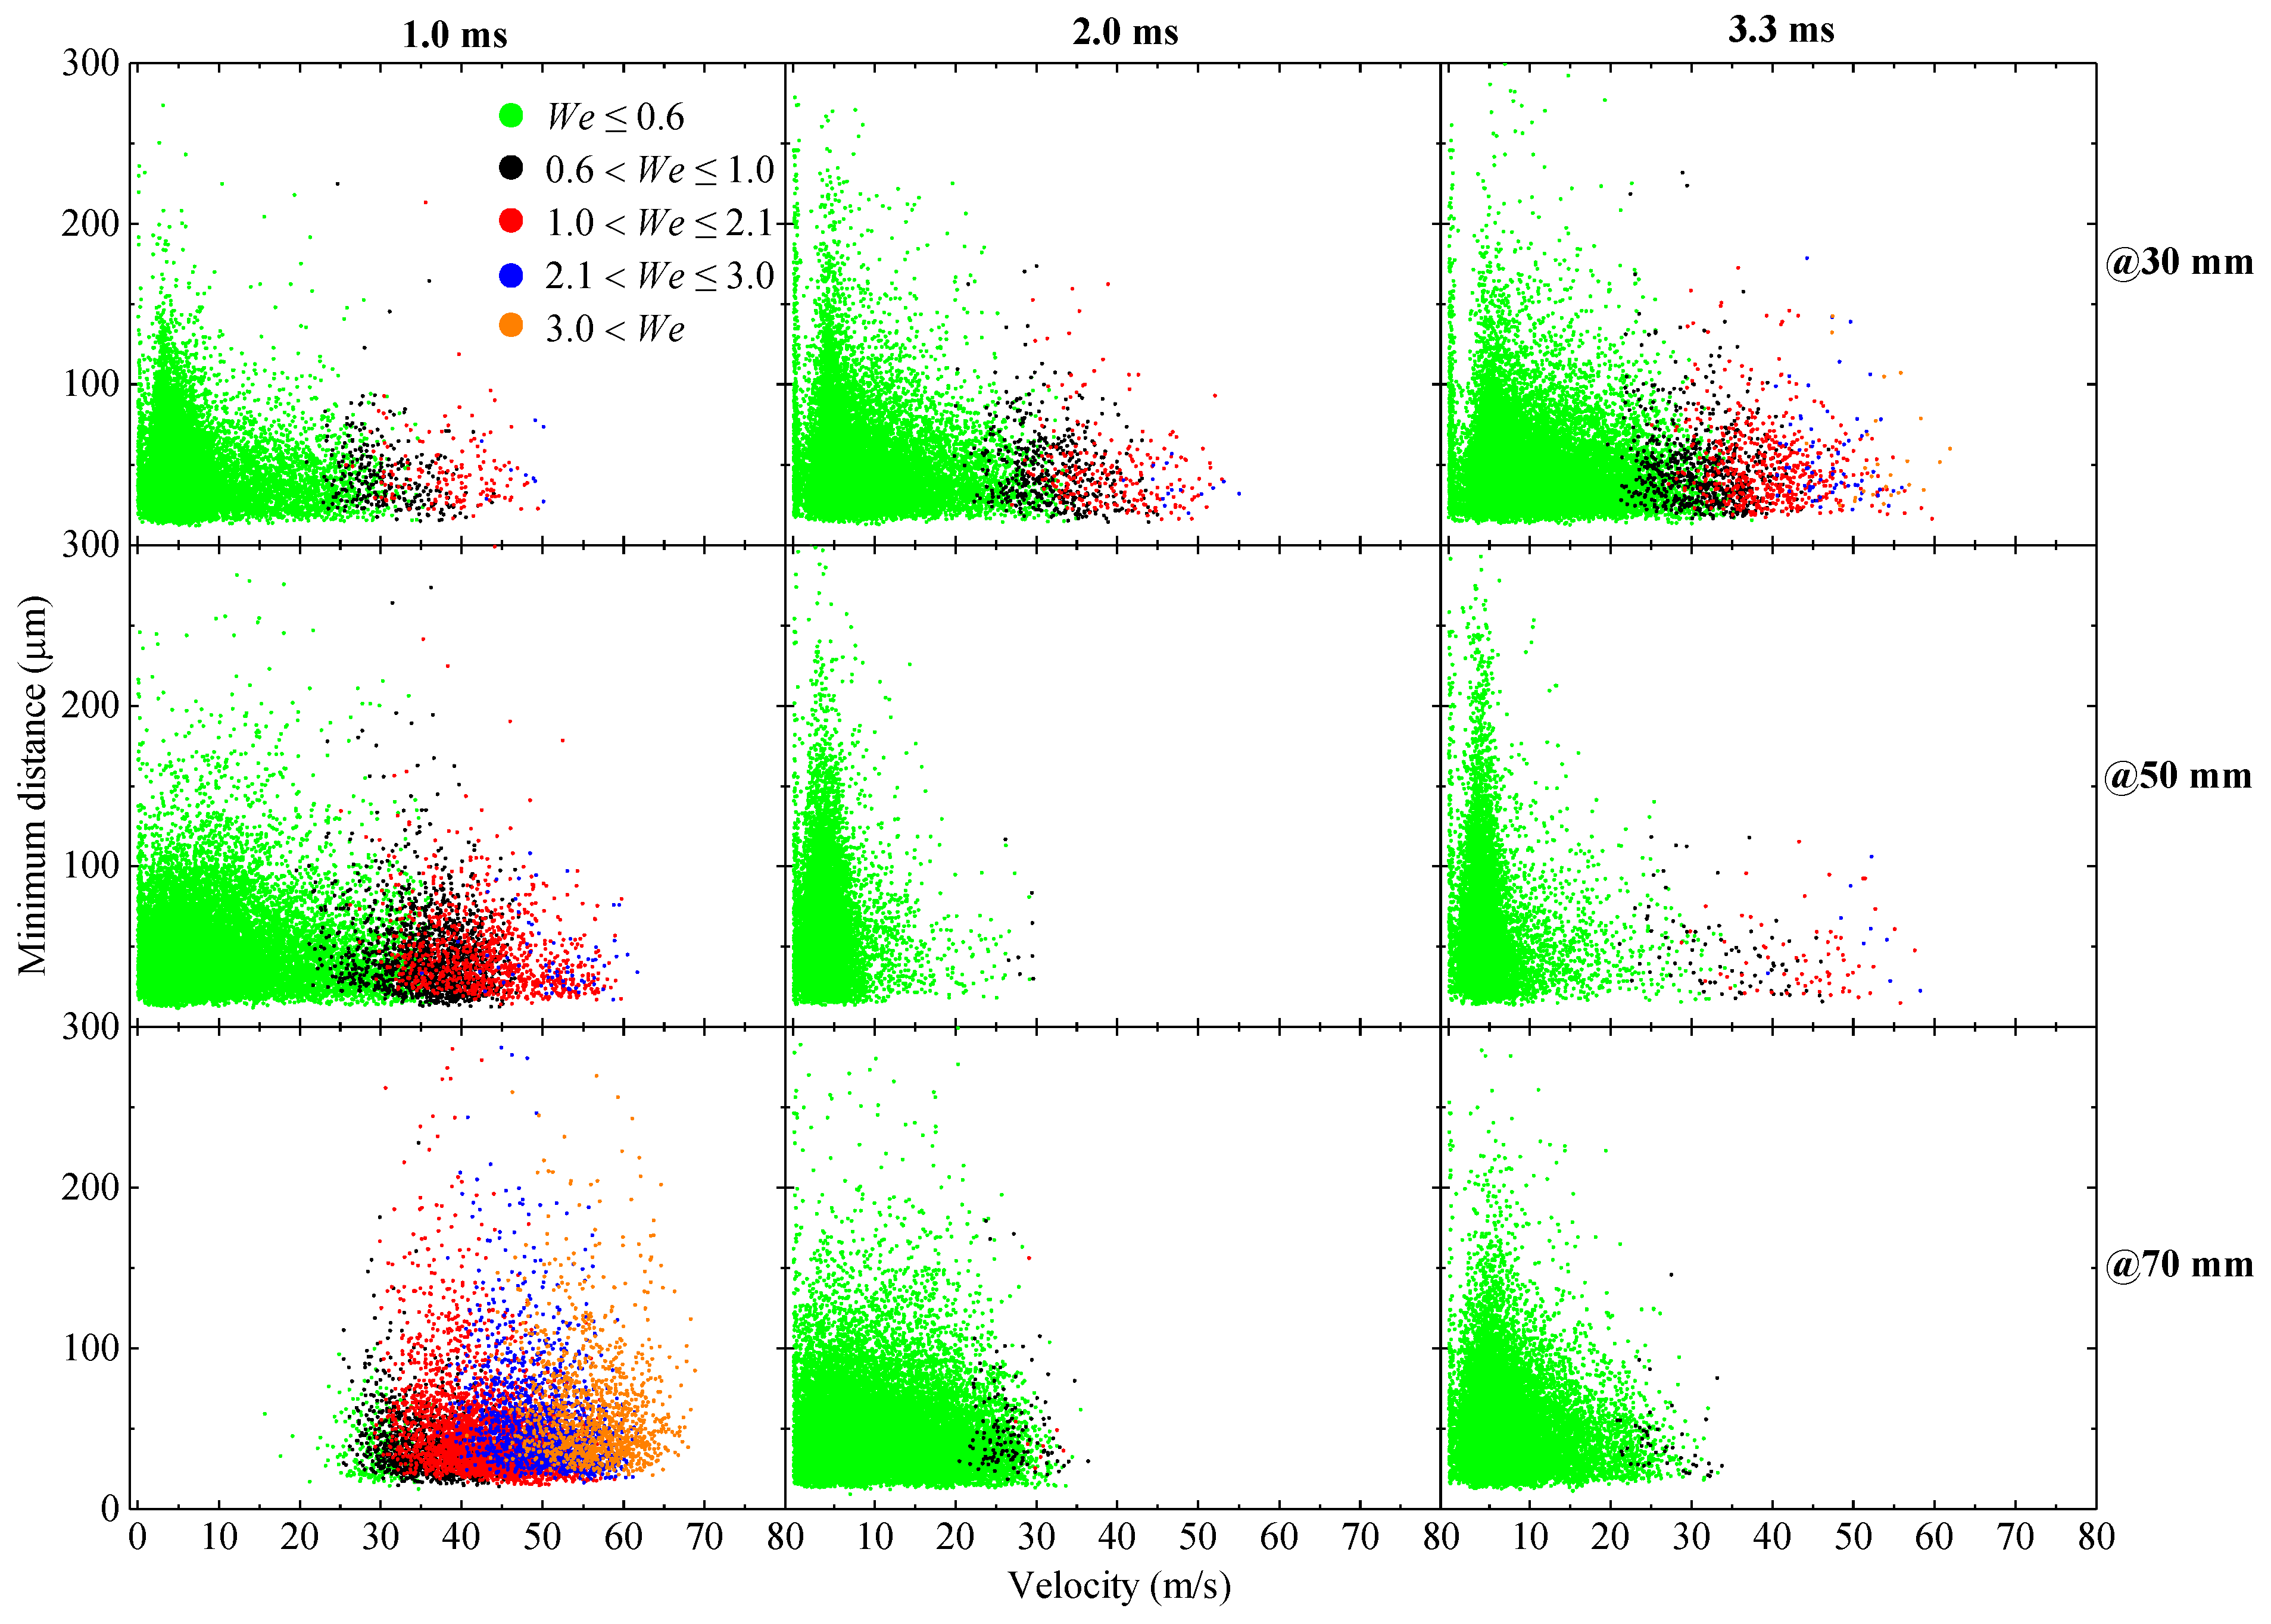
3.2. Droplet Diameter–Velocity Distribution
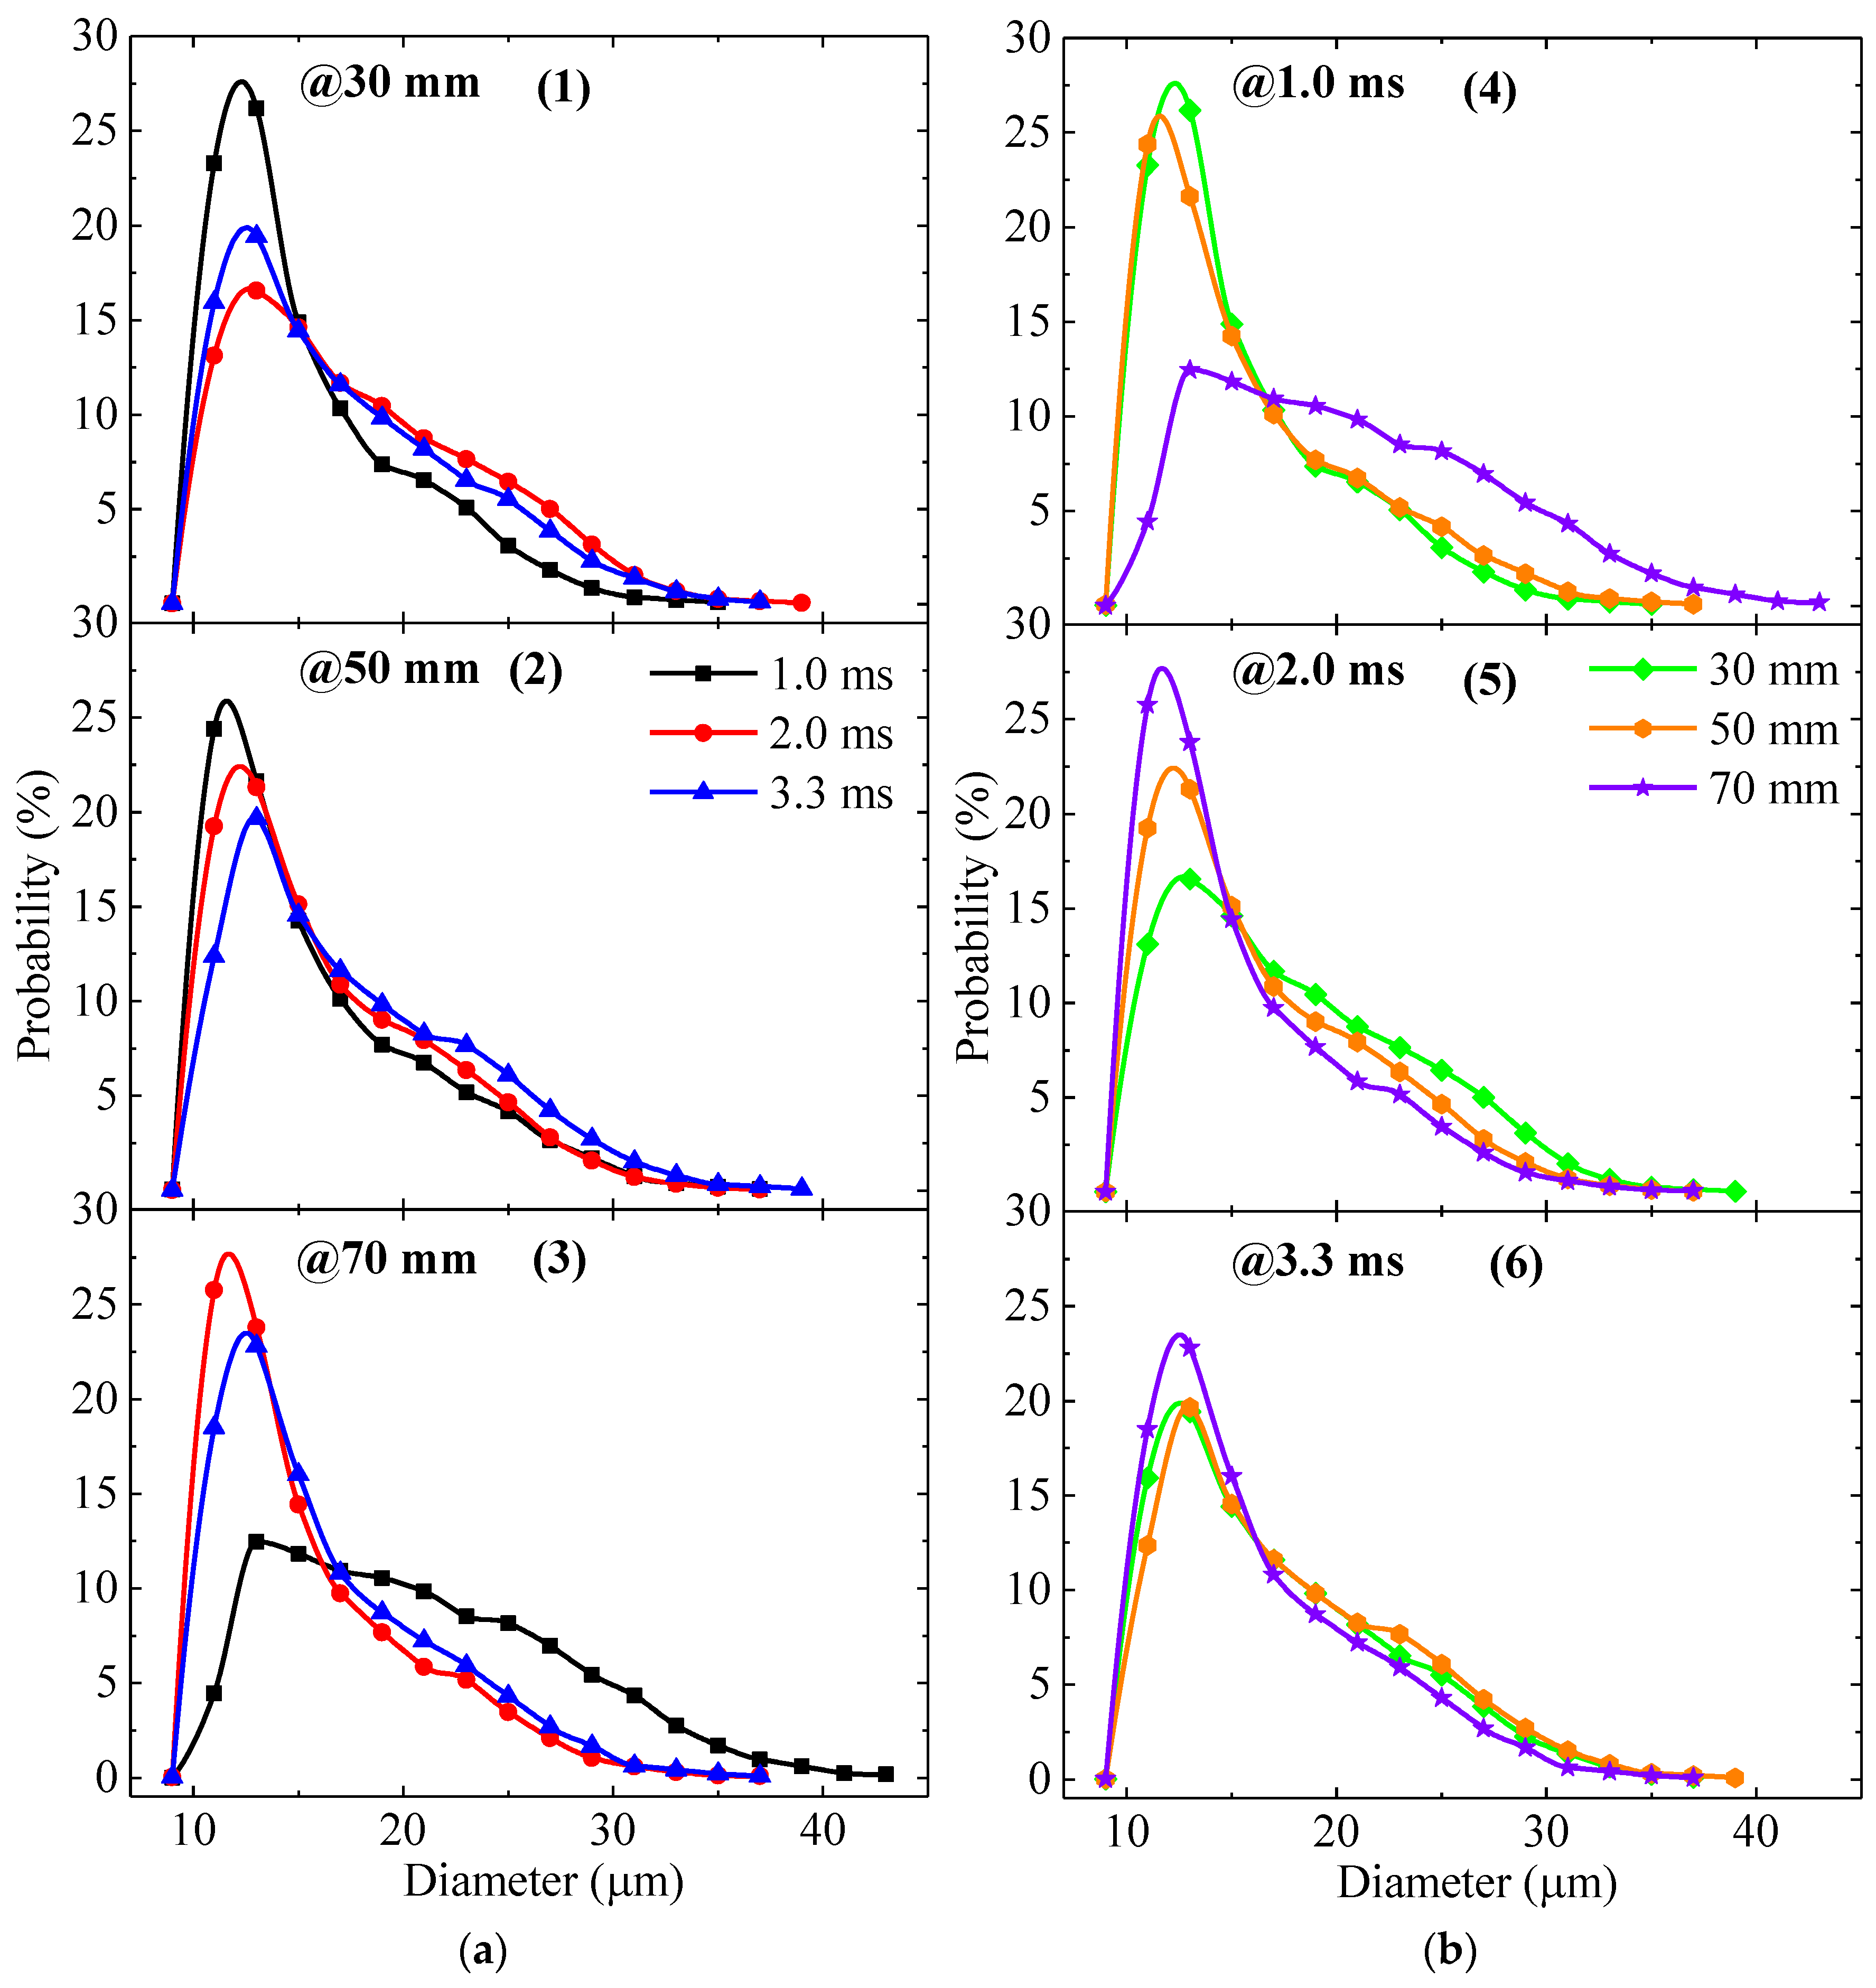
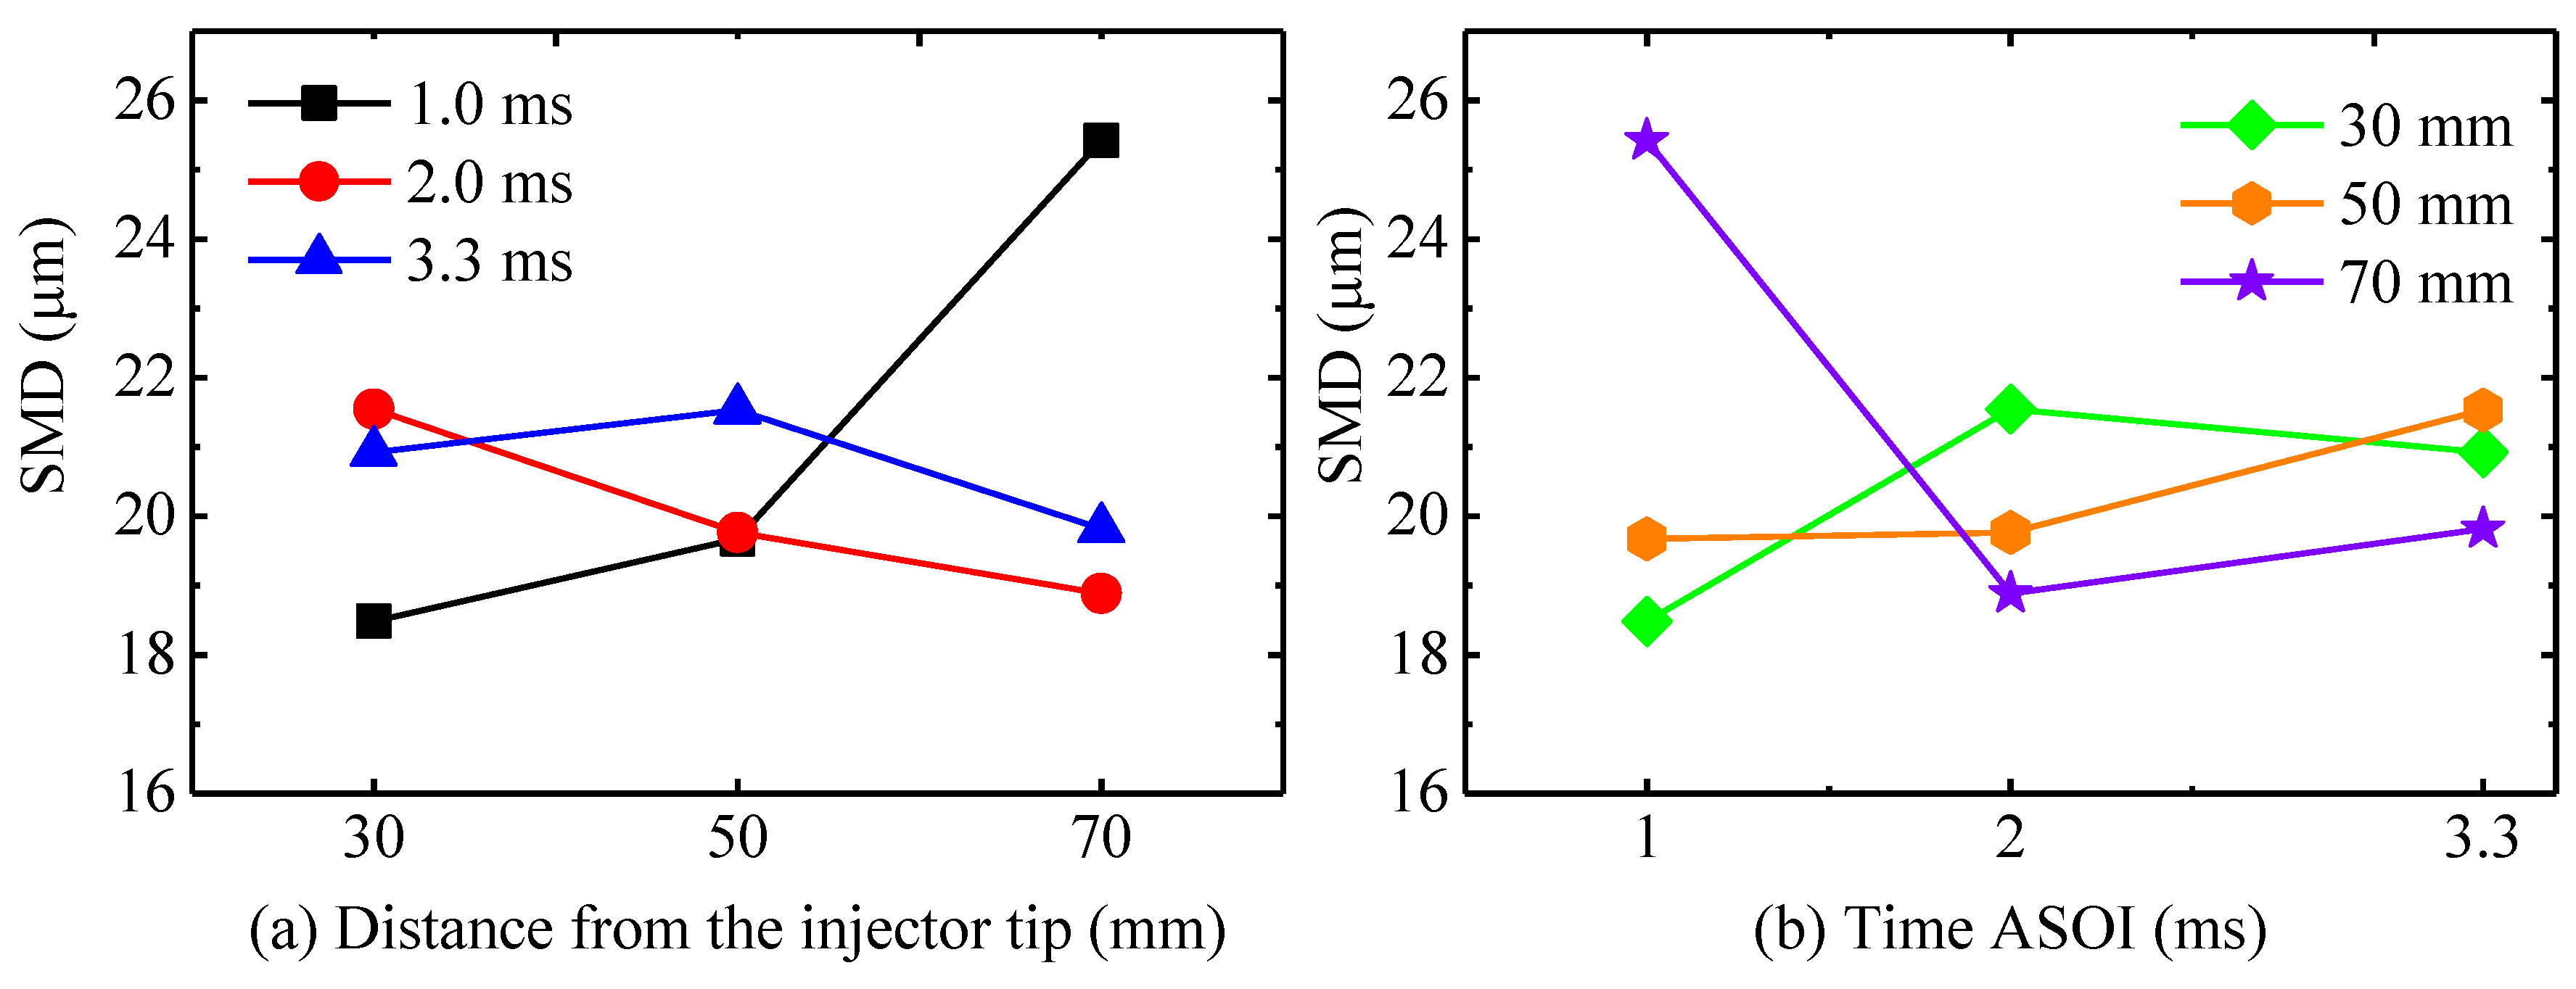
3.3. Droplet Size Distribution
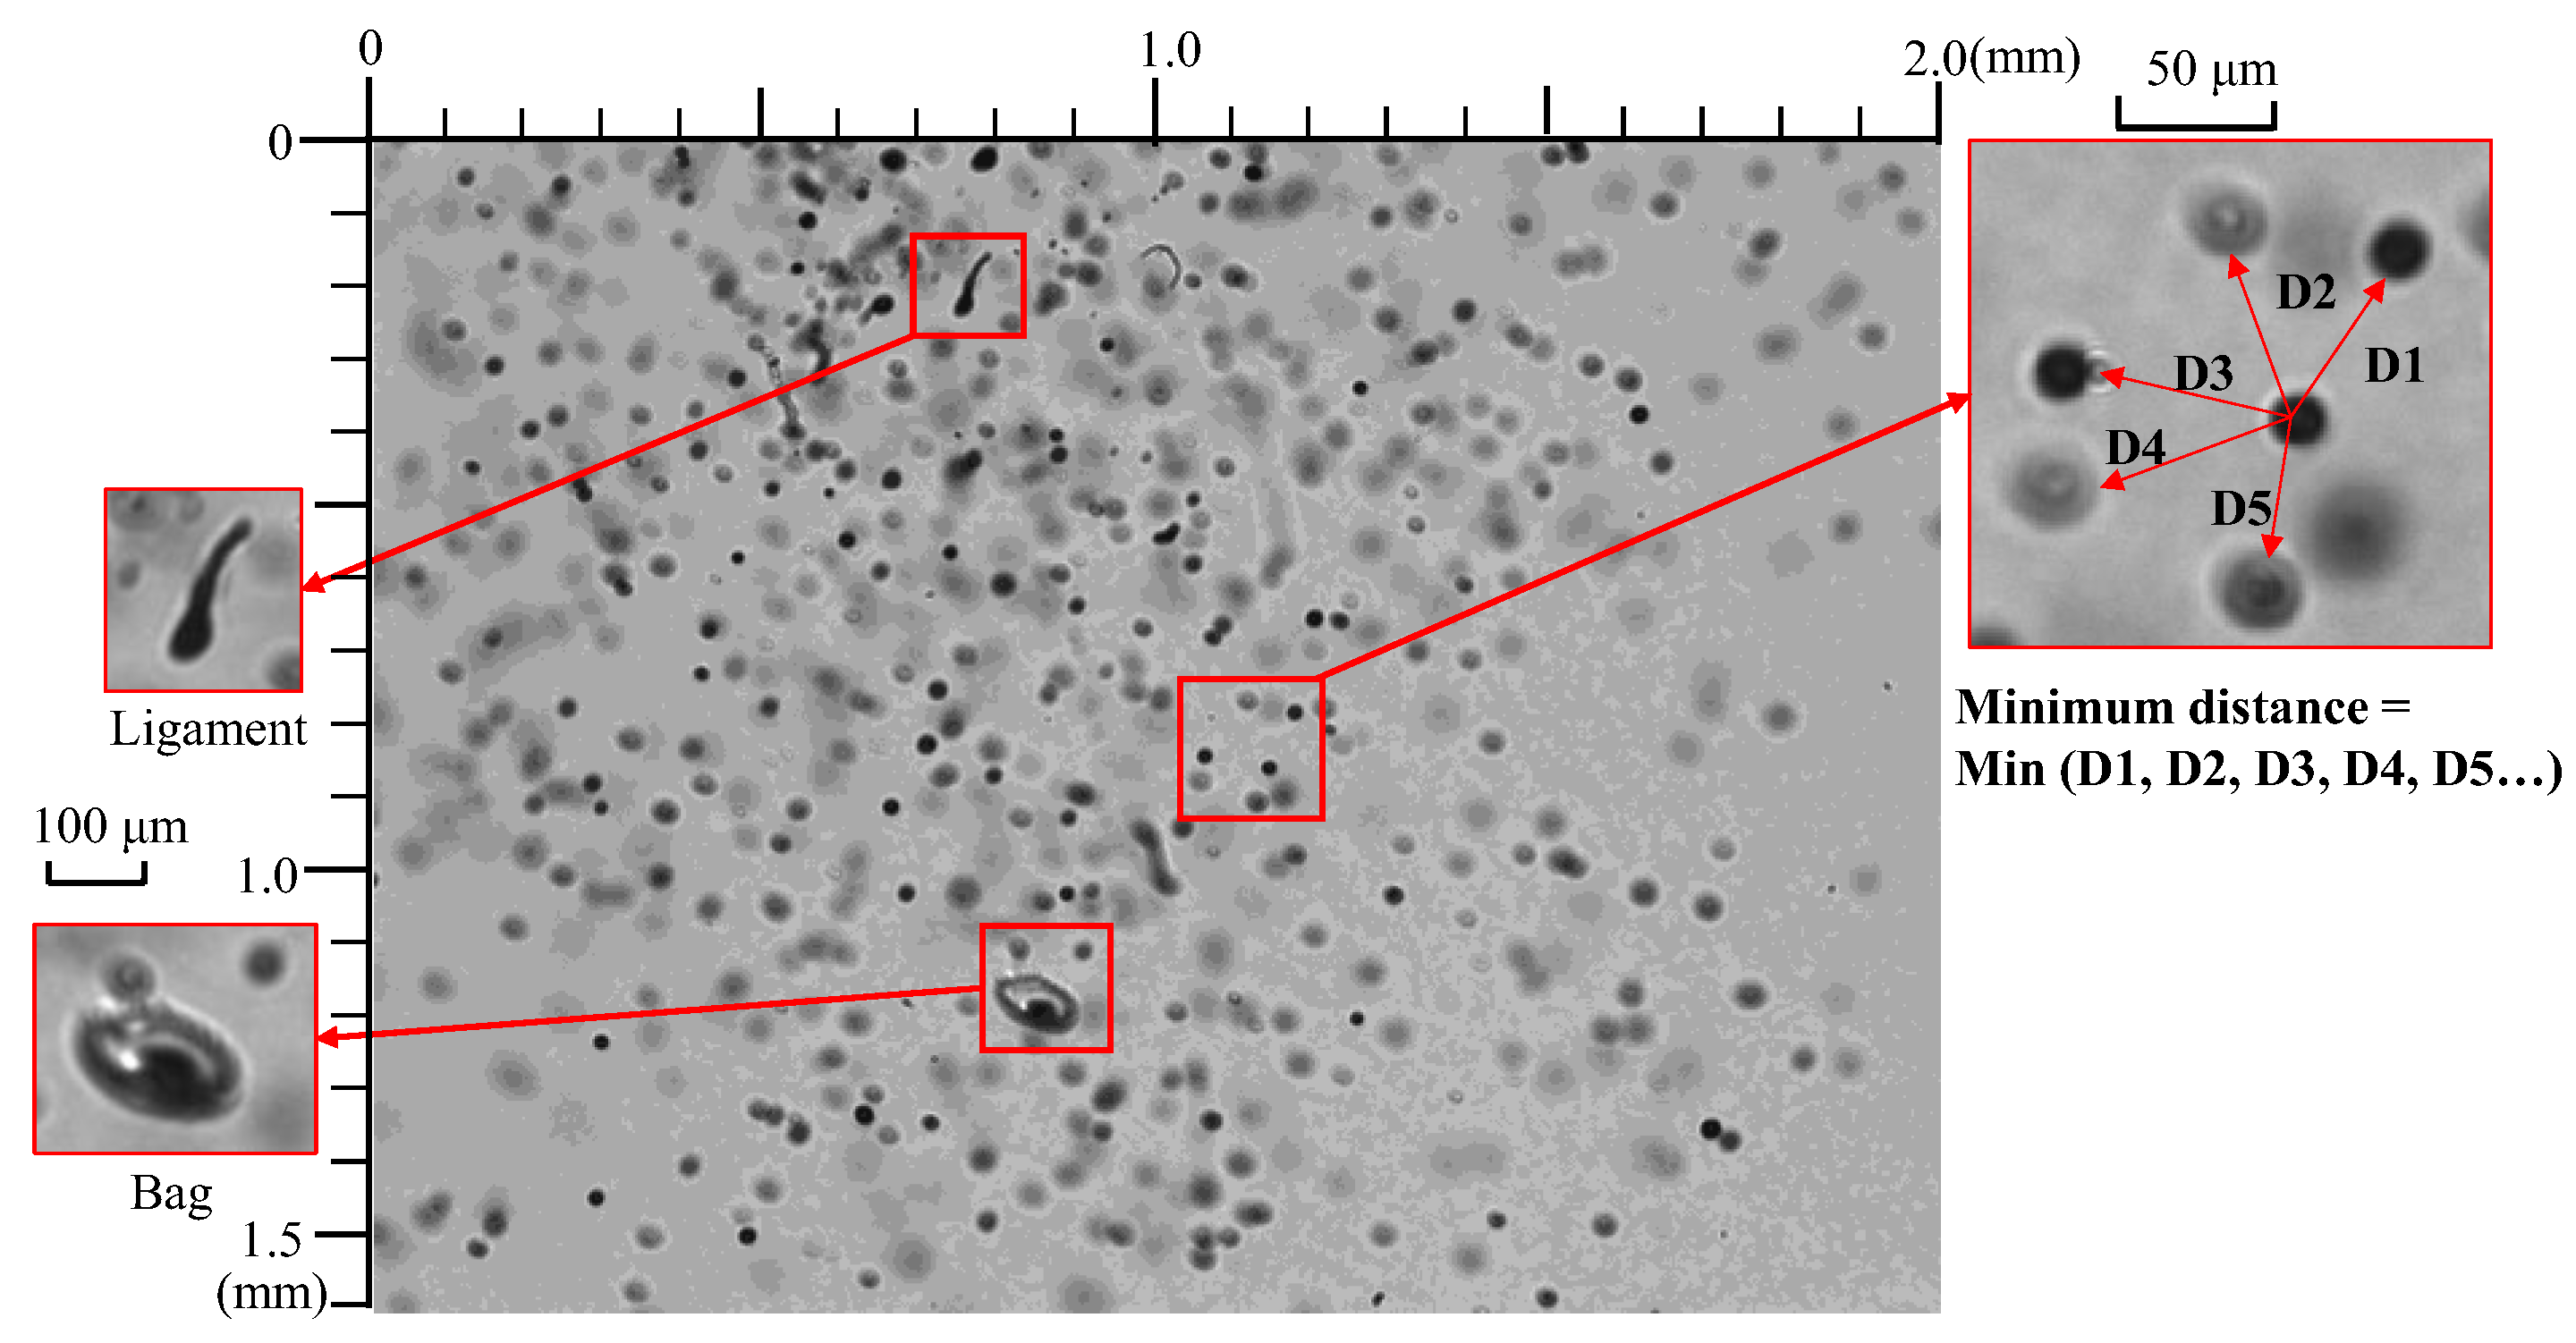
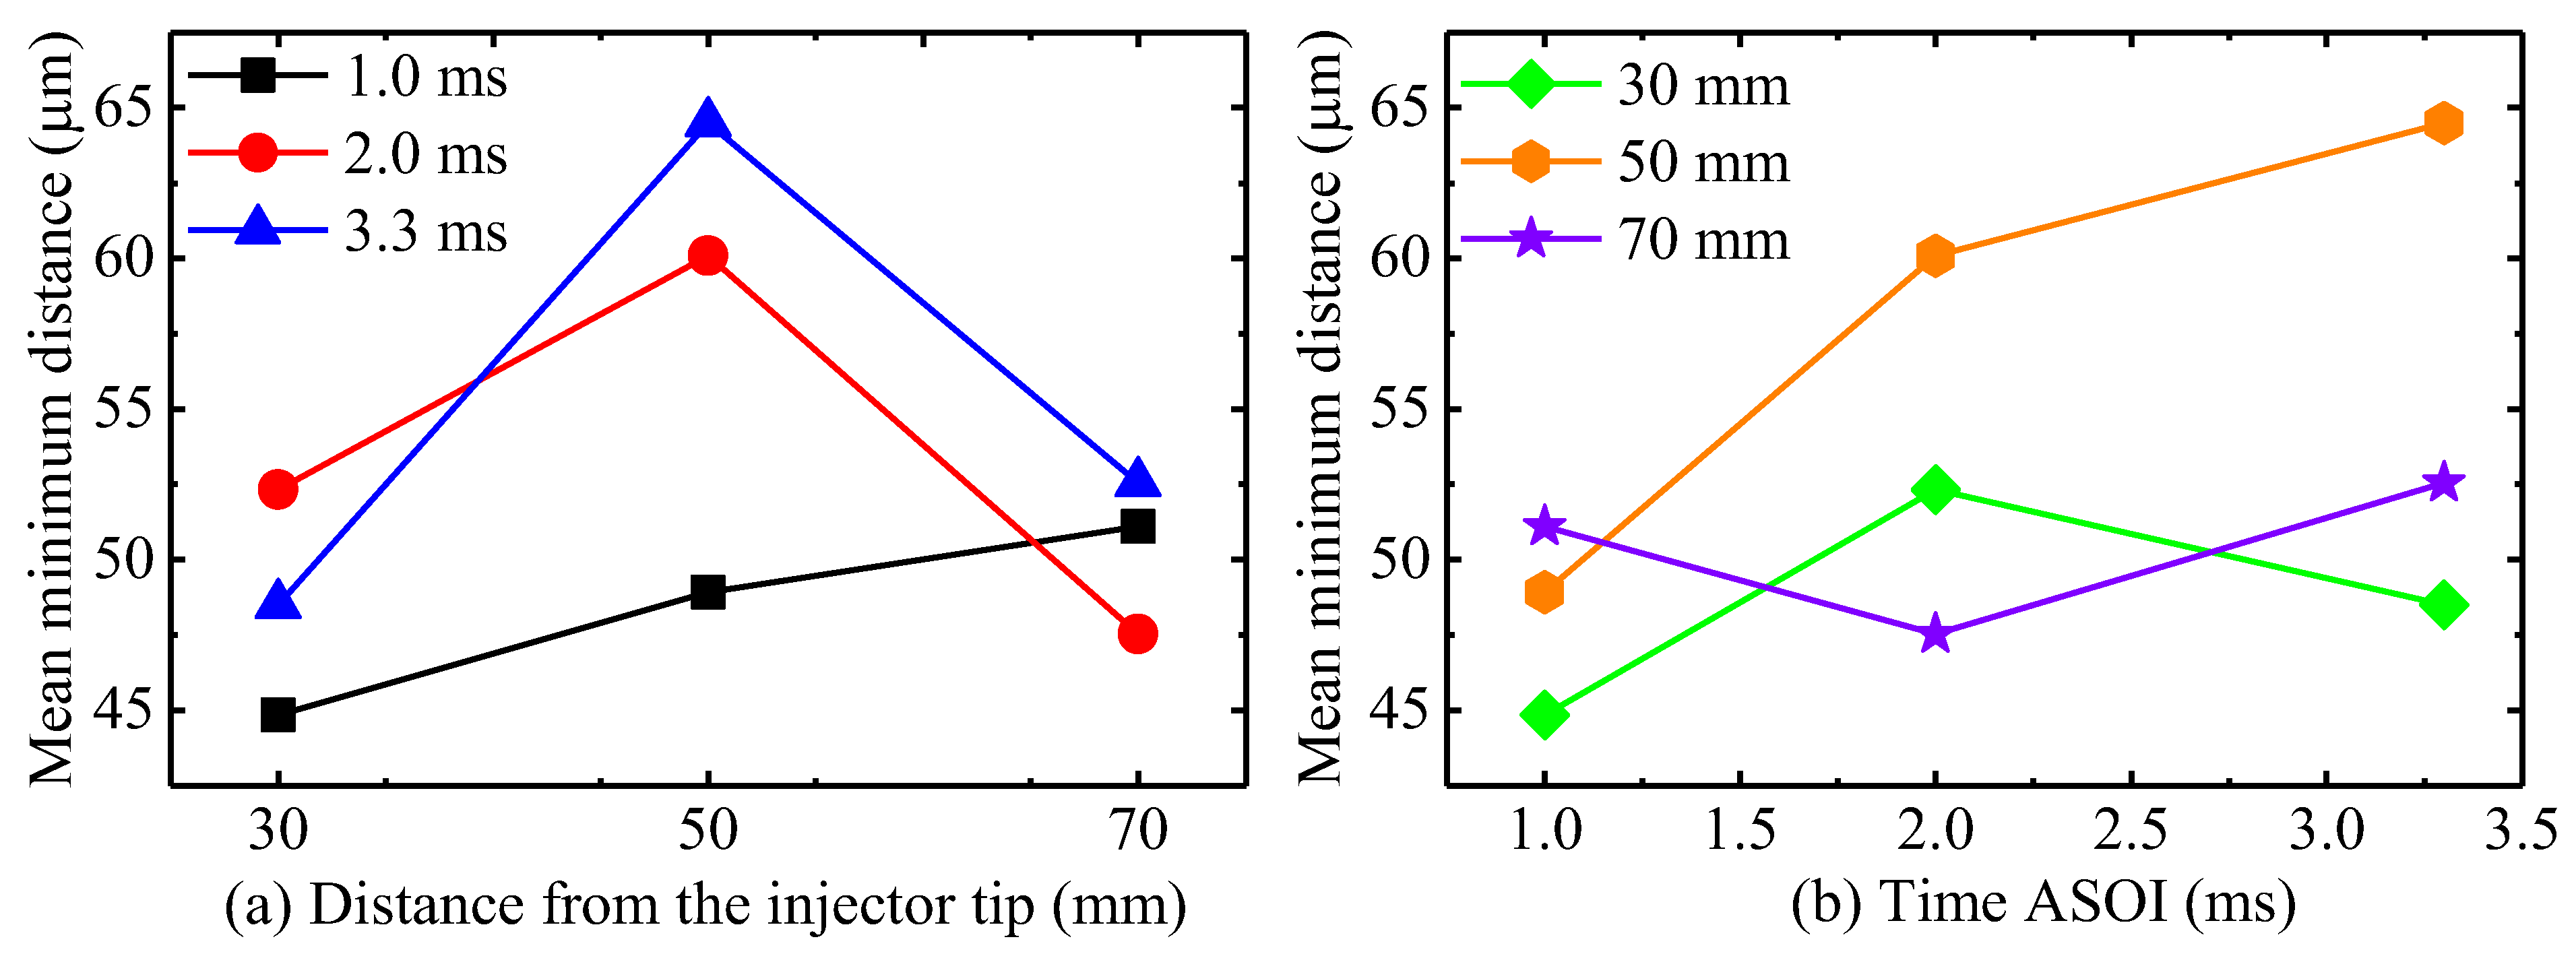
3.4. Mean Minimum Distance of Droplets
4. Conclusions
- (1)
- At the initial stage, the velocity of downstream droplets is much higher than those of the other cases. This is because the capture location was near the spray tip where droplets are larger and have high velocity. The foregoing plays an important role in the axial and radial expansions of the spray at the initial stage. Moreover, the droplet size increases from upstream to downstream. The ligaments easily break up into larger droplets due to aerodynamic resistance. However, at the quasi-steady and end stages, the droplet size and velocity distribution are similar from upstream to downstream.
- (2)
- The mean MDs at the quasi-steady and end stages considerably exceed that at the initial stage, indicating that the droplet dispersion improves with time. However, the mean MD at midstream is much larger than the mean MDs at upstream and downstream. This indicates that the droplets at midstream disperse better than those at upstream and downstream.
Author Contributions
Funding
Institutional Review Board Statement
Informed Consent Statement
Data Availability Statement
Acknowledgments
Conflicts of Interest
Abbreviations
| ASOI | After the start of injection |
| CCD | Charge-coupled device |
| CVC | Constant volume chamber |
| d | Nozzle hole diameter |
| DISI | Direct-injection spark-ignition |
| L/D | Length to diameter |
| L2F | Laser-2-focus |
| MD | Minimum distance |
| PIA | Particle image analysis |
| PIV | Particle image velocimetry |
| PDPA | Phase-Doppler particle analyzer |
| PDA | Phase-Doppler anemometry |
| PDIA | Particle/droplet image analysis |
| Pinj | Injection Pressure |
| Pamb | Ambient pressure |
| SMD | Sauter mean diameter |
| Tamb | Ambient temperature |
| We | Weber number |
References
- Lee, Z.; Kim, T.; Park, S. Review on spray, combustion, and emission characteristics of recent developed direct-injection spark ignition (DISI) engine system with multi-hole type injector. Fuel 2020, 259, 116209. [Google Scholar] [CrossRef]
- Fansler, T.D.; Parrish, S.E. Spray measurement technology: A review. Measur. Sci. Technol. 2015, 26, 012002. [Google Scholar] [CrossRef]
- Urbán, A.; Zaremba, M.; Malý, M.; Józsa, V.; Jedelský, J. Droplet dynamics and size characterization of high-velocity airblast atomization. Int. J. Multiph. Flow. 2017, 95, 1–11. [Google Scholar] [CrossRef] [Green Version]
- Deshmukh, D.; Ravikrishna, R.V. Studies on microscopic structure of diesel sprays under atmospheric and high gas pressures. Int. J. Spray Combust. Dyn. 2014, 6, 199–220. [Google Scholar] [CrossRef]
- Kashdan, J.T.; Shrimpton, J.S.; Whybrew, A. A digital image analysis technique for quantitative characterisation of high-speed sprays. Opt. Lasers Eng. 2007, 45, 106–115. [Google Scholar] [CrossRef]
- Blaisot, J.; Yon, J. Droplet size and morphology characterization for dense sprays by image processing: Application to the diesel spray. Exp. Fluids 2005, 39, 977–994. [Google Scholar] [CrossRef]
- Komada, K.; Sakaguchi, D.; Tajima, H.; Ueki, H.; Ishida, M. Relation between tip penetration and droplet size of diesel spray. SAE 2013, 2, 01487191. [Google Scholar]
- Goldsworthy, L.; Bong, C.; Brandner, P.A. Measurements of diesel spray dynamics and the influence of fuel viscosity using PIV and shadowgraphy. Atom. Sprays 2011, 21, 167–178. [Google Scholar] [CrossRef]
- Pathania, R.S.; Chakravarthy, S.R.; Mehta, P.S. Time-resolved characterization of low-pressure pulsed injector. Atom. Sprays 2016, 26, 755–773. [Google Scholar] [CrossRef]
- Jing, D.; Zhang, F.; Li, Y.; Xu, H.; Shuai, S. Experimental investigation on the macroscopic and microscopic spray characteristics of dieseline fuel. Fuel 2017, 199, 478–487. [Google Scholar] [CrossRef]
- Wang, Z.; Xu, H.; Jiang, C.; Wyszynski, M.L. Experimental study on microscopic and macroscopic characteristics of diesel spray with split injection. Fuel 2016, 174, 140–152. [Google Scholar] [CrossRef]
- Krzeczkowski, S.A. Measurement of liquid droplet disintegration mechanism. Int. J. Multiphase Flow 1980, 6, 227–239. [Google Scholar] [CrossRef]
- Dai, Z.; Faeth, G.M. Temporal properties of secondary drop breakup in the multimode breakup regime. Int. J. Multiphase Flow 2001, 27, 217–236. [Google Scholar] [CrossRef]
- Feng, Z.; Tang, C.; Yin, Y.; Zhang, P.; Huang, Z. Time-resolved droplet size and velocity distributions in a dilute region of a high-pressure pulsed diesel spray. Int. J. Heat. Mass Transfer. 2019, 133, 745–755. [Google Scholar] [CrossRef]
- Lebedevas, S.; Klyus, O.; Raslavičius, L.; Krause, P.; Rapalis, P. Findings on droplet breakup behavior of the preheated microalgae oil jet for efficiency improvement in diesel engines. Biomass Conv. Bioref. 2022, 21, 2162. [Google Scholar] [CrossRef]
- Luo, H.; Nishida, K.; Ogata, Y.; Zhang, W. Microscopic characteristics of near-nozzle spray at the initial and end stages. Fuel 2021, 283, 118953. [Google Scholar] [CrossRef]
- Bae, C.; Kang, J. The structure of a break-up zone in the transient diesel spray of a valve-covered orifice nozzle. Int. J. Engine Res. 2006, 7, 319–334. [Google Scholar] [CrossRef]
- Payri, R.; Tormos, B.; Salvador, F.J.; Araneo, L. Spray droplet velocity characterization for convergent nozzles with three different diameters. Fuel 2008, 87, 3176–3182. [Google Scholar] [CrossRef]
- Liu, M.; Duan, Y.F.; Zhang, T.N. Evaluation of effervescent atomizer internal design on the spray unsteadiness using a phase/doppler particle analyzer. Exp. Therm. Fluid Sci. 2010, 34, 657–665. [Google Scholar] [CrossRef]
- Crua, C.; Shoba, T.; Heikal, M.; Gold, M.; Higham, C. High-speed microscopic imaging of the initial stage of diesel spray formation and primary breakup. SAE Paper 2010, 1, 2247. [Google Scholar]
- Pei, Y.; Qin, J.; Li, X.; Zhang, D.; Wang, K.; Liu, Y. Experimental investigation on free and impingement spray fueled with methanol, ethanol, isooctane, TRF and gasoline. Fuel 2017, 208, 174–183. [Google Scholar] [CrossRef]
- Wang, Z.; Hopfes, T.; Giglmaier, M.; Adams, N.A. Experimental investigation of shock-induced tandem droplet breakup. Phys. Fluids 2021, 33, 012113. [Google Scholar] [CrossRef]
- Zhao, H.; Wu, Z.; Li, W.; Xu, J.; Liu, H. Interaction of two drops in the bag breakup regime by a continuous air jet. Fuel 2019, 236, 843–850. [Google Scholar] [CrossRef]
- Chen, Y.; Liu, S.; Guo, X.; Jia, C.; Huang, X.; Wang, Y.; Huang, H. Experimental research on the macroscopic and microscopic spray characteristics of diesel-PODE3–4 blends. Energies 2021, 14, 5559. [Google Scholar] [CrossRef]
- Khaleghi, H.; Farani Sani, H.; Ahmadi, M.; Mohammadzadeh, F. Effects of turbulence on the secondary breakup of droplets in diesel fuel sprays. Proc. Inst. Mechan. Eng. Part D J. Automob. Eng. 2021, 235, 387–399. [Google Scholar] [CrossRef]
- Amedorme, S. Experimental study of mean droplet size from pressure swirl atomizer. Int. J. Eng. Sci. Technol. 2020, 4, 49–59. [Google Scholar] [CrossRef]
- Chang, F.; Luo, H.; Zhan, C.; Nishida, K.; Ogata, Y. Droplets velocity and diameter variations of wall impinging spray created by slicer. Fuel 2021, 299, 120894. [Google Scholar] [CrossRef]
- Luo, H.; Ogata, Y.; Nishida, K. Effects of droplet behaviors on fuel adhesion of flat wall impinging spray injected by a DISI injector. SAE Tech. Pap. 2019, 24, 34. [Google Scholar]
- Zhan, C.; Luo, H.; Chang, F.; Nishida, K.; Ogata, Y.; Tang, C.; Feng, Z.; Huang, Z. Experimental study on the droplet characteristics in the spray tip region: Comparison between the free and impinging spray. Exp. Therm. Fluid Sci. 2021, 121, 894–1777. [Google Scholar] [CrossRef]
- Postrioti, L.; Buitoni, G.; Pesce, F.; Ciaravino, C. Zeuch method-based injection rate analysis of a common rail system operated with advanced injection strategies. Fuel 2014, 128, 188–198. [Google Scholar] [CrossRef]
- Wang, C.; Wang, Y.; Zhu, J.; Long, W.; Nishida, K. Design and application of an algorithm for measuring particle velocity based on multiple characteristics of a particle. Fuel 2020, 271, 117605. [Google Scholar] [CrossRef]
- Luo, H.; Wang, C.; Nishida, K.; Ogata, Y.; Chen, R. Characteristics of droplet behaviors after the end of injection in a high-pressure constant volume chamber. Fuel 2020, 267, 117291. [Google Scholar] [CrossRef]
- Qian, J.; Law, C.K. Regimes of coalescence and separation in droplet collision. J. Fluid Mech. 1997, 331, 59–80. [Google Scholar] [CrossRef]
- Zhou, Z.F.; Yin, J.; Yang, X.Y.; Chen, B.; Liu, B. Experimental investigation on the macroscopic spray and microscopic droplet diameter, velocity and temperature of R404A flashing spray. Int. J. Heat Mass Transf. 2021, 177, 121546. [Google Scholar] [CrossRef]
- Lee, S.; Oh, Y.; Park, S. Characterization of the spray atomization process of a multi-hole gasoline direct injector based on measurements using a phase Doppler particle analyser. Proc. Inst. Mech. Eng. Part D J Automob. Eng. 2013, 227, 951–965. [Google Scholar] [CrossRef]
- Faeth, G.M.; Hsiang, L.P.; Wu, P.K. Structure and breakup properties of sprays. Int. J. Multiphase Flow 1995, 21, 99–127. [Google Scholar] [CrossRef]
- Wang, X.L.; Qu, Z.G.; Lai, T.; Ren, G.F.; Wang, W.K. Enhancing water transport performance of gas diffusion layers through coupling manipulation of pore structure and hydrophobicity. J. Power Sources 2022, 525, 231121. [Google Scholar] [CrossRef]


| Camera Type | CCD Camera |
| Teleconverter Model | Kenko Tokina, N-AF TELEPLUS MC4 |
| Teleconverter Magnification | 1.4 × 2, 2.0 × 1 |
| Laser Type | Nd: YAG |
| Wavelength | 532 nm |
| Interval Time | 0.8 μs |
| Frame Size | 1600 × 1200 pixels |
| Injector | |
| Hole Geometry | Straight hole |
| Hole Number | 6 |
| Nozzle Hole Diameter (d) | 0.16 mm |
| Length to Diameter (L/D) | 2 |
| Injection Condition | |
| Fuel | Toluene |
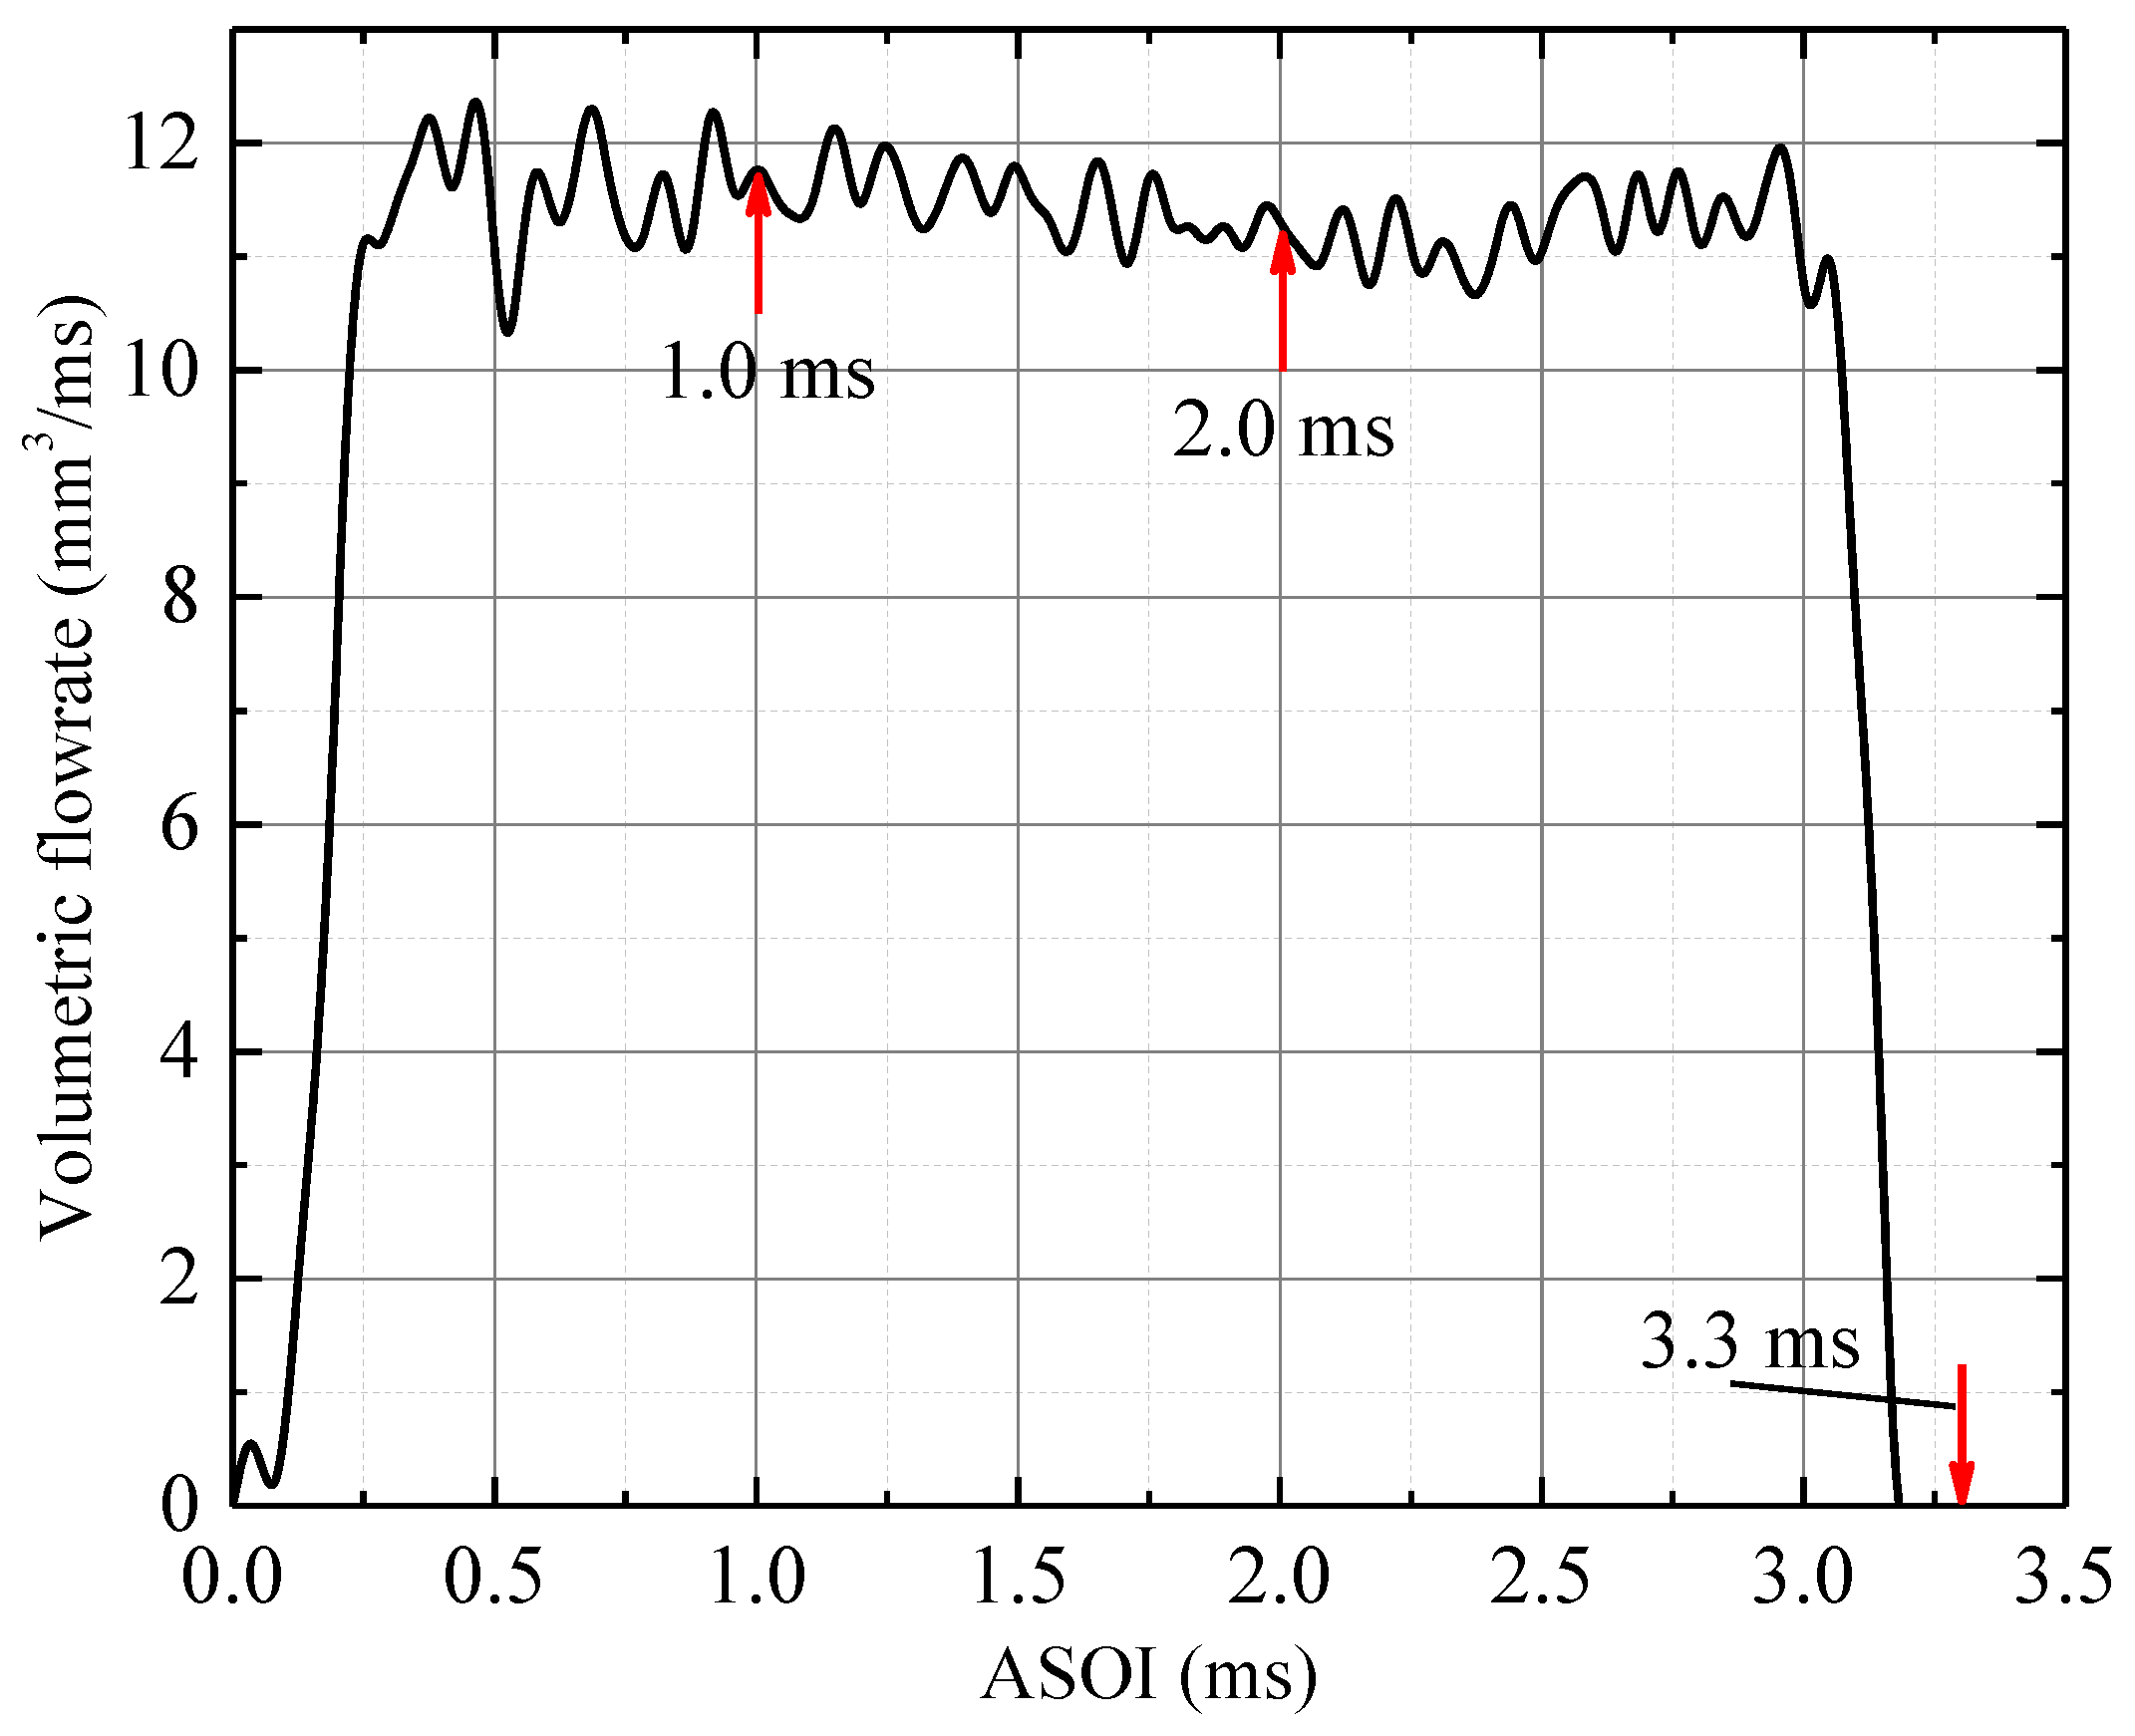
| Injection Pressure (Pinj) | 20 MPa |
| Injection Duration | 3.2 ms |
| Ambient Condition | |
| Ambient Gas | Nitrogen |
| Ambient Pressure (Pamb) | 0.1 MPa |
| Ambient Temperature (Tamb) | 298 K |
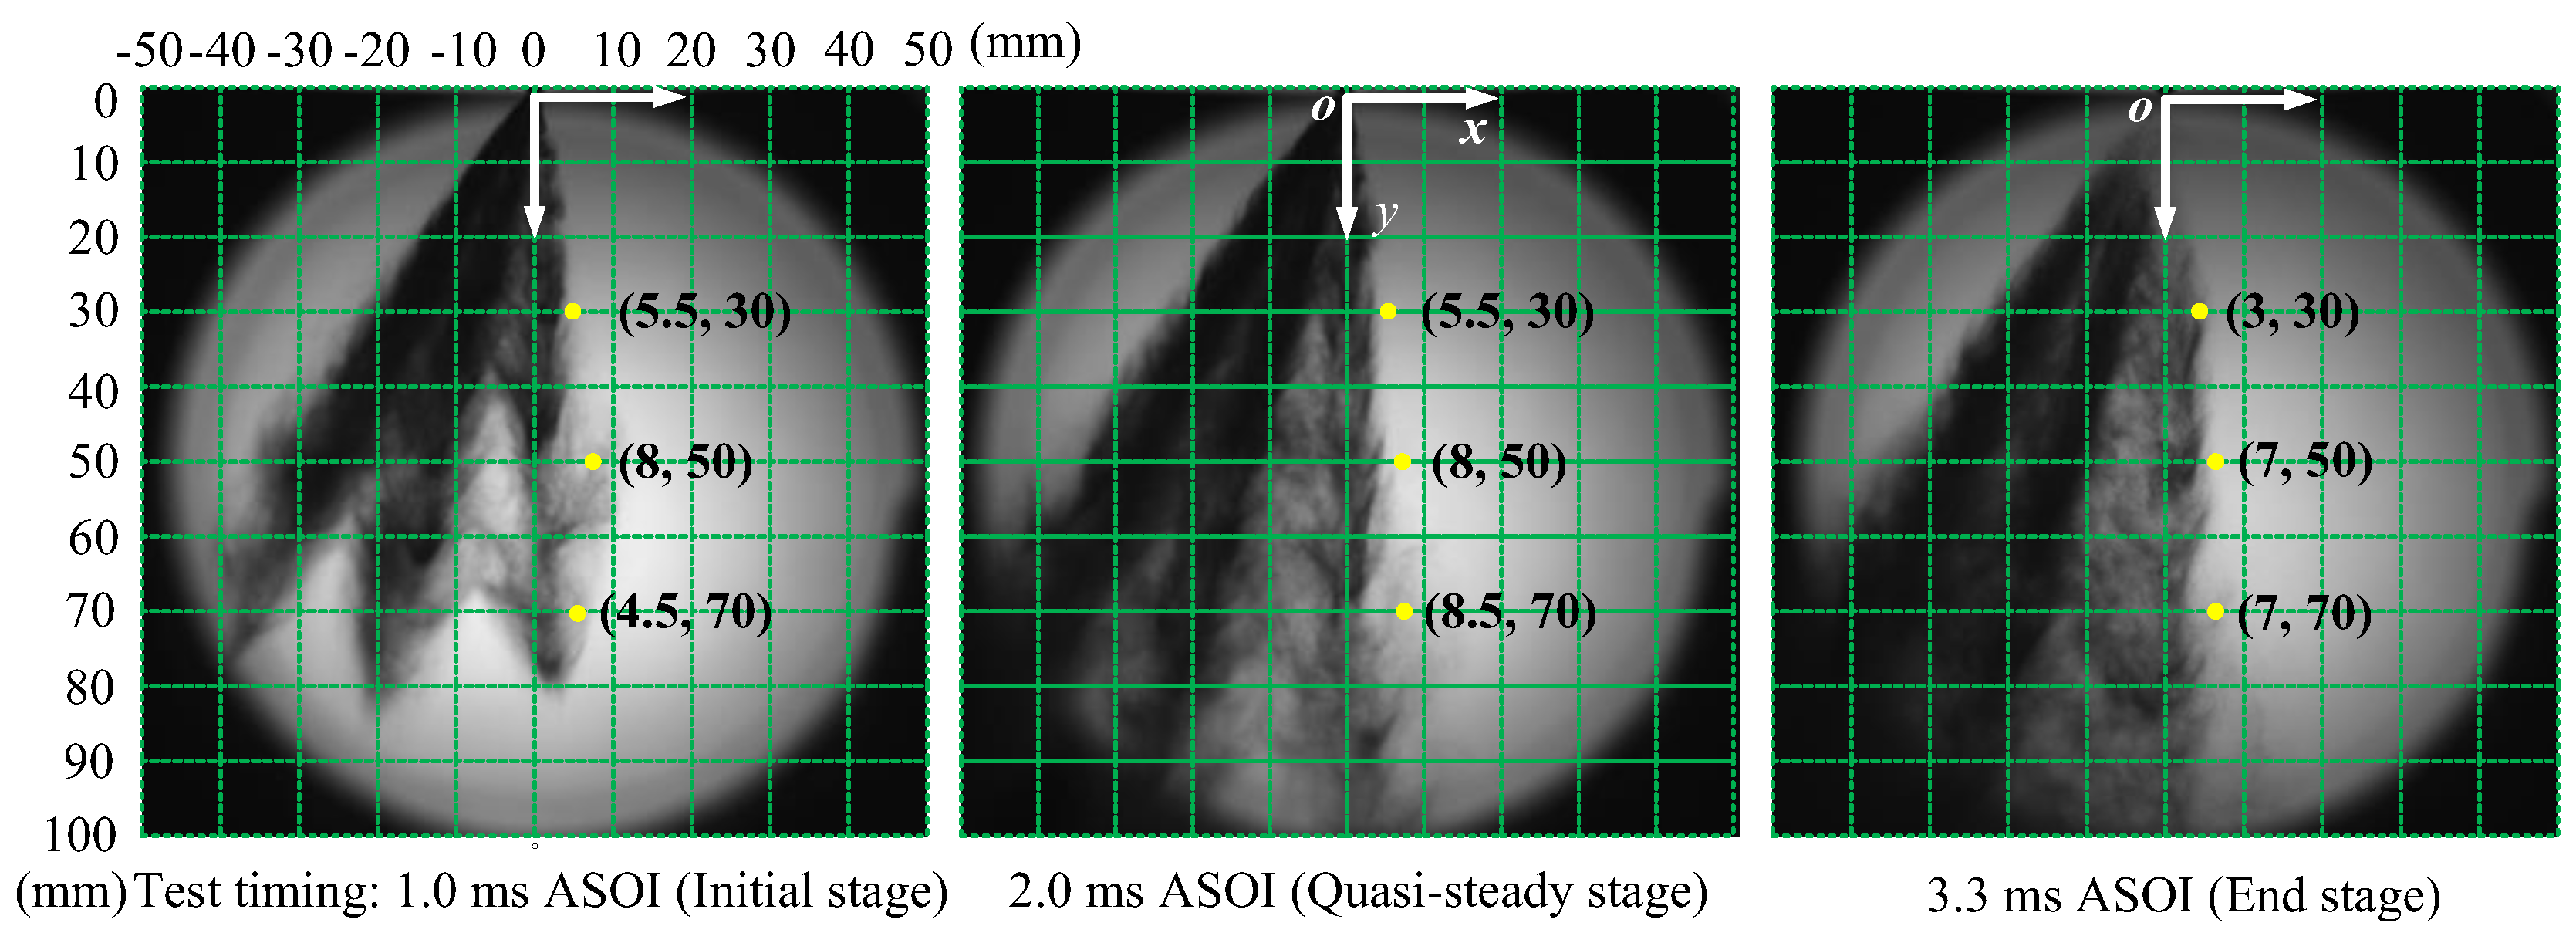
| Case #1 | Timing | 1.0 ms ASOI (Initial stage) | ||
| Locations | (5.5, 30) | (8.0, 50) | (4.5, 70) | |
| Case #2 | Timing | 2.0 ms ASOI (Quasi-steady stage) | ||
| Locations | (5.5, 30) | (8.0, 50) | (8.5, 70) | |
| Case #3 | Timing | 3.3 ms ASOI (End stage) | ||
| Locations | (3.0, 30) | (7.0, 50) | (7.0, 70) | |
Disclaimer/Publisher’s Note: The statements, opinions and data contained in all publications are solely those of the individual author(s) and contributor(s) and not of MDPI and/or the editor(s). MDPI and/or the editor(s) disclaim responsibility for any injury to people or property resulting from any ideas, methods, instructions or products referred to in the content. |
© 2023 by the authors. Licensee MDPI, Basel, Switzerland. This article is an open access article distributed under the terms and conditions of the Creative Commons Attribution (CC BY) license (https://creativecommons.org/licenses/by/4.0/).
Share and Cite
Chang, F.; Luo, H.; Dong, P.; Nishida, K.; Ogata, Y.; Hara, R.; Uchida, K.; Zhang, W. Characteristics of Droplet Behaviors during Spray Breakup Process. Sustainability 2023, 15, 9356. https://doi.org/10.3390/su15129356
Chang F, Luo H, Dong P, Nishida K, Ogata Y, Hara R, Uchida K, Zhang W. Characteristics of Droplet Behaviors during Spray Breakup Process. Sustainability. 2023; 15(12):9356. https://doi.org/10.3390/su15129356
Chicago/Turabian StyleChang, Feixiang, Hongliang Luo, Panpan Dong, Keiya Nishida, Yoichi Ogata, Ryosuke Hara, Kenji Uchida, and Wu Zhang. 2023. "Characteristics of Droplet Behaviors during Spray Breakup Process" Sustainability 15, no. 12: 9356. https://doi.org/10.3390/su15129356