Article

Clustering Travelers’ Lifestyle Destination Image from Five Asian Traveler-Generated Content

1
Department of Finance, Chihlee University of Technology, New Taipei City 220, Taiwan
2
Department of Information Management, Yuan-Ze University, Taoyuan City 320, Taiwan
3
Department of Digital and Humanities, Aletheia University, New Taipei City 251, Taiwan
4
Department of Information Management, National Taipei University of Business, Taipei 100, Taiwan
*
Author to whom correspondence should be addressed.
Sustainability 2023, 15(7), 5887; https://doi.org/10.3390/su15075887
Submission received: 12 February 2023 / Revised: 5 March 2023 / Accepted: 27 March 2023 / Published: 28 March 2023
(This article belongs to the Collection Advances in Marketing and Managing Tourism Destinations)

Abstract

:
This study examines the destination image and lifestyle experience via traveler-generated comments. To understand the travelers’ behavior, we first established a crawler, which helps us to gather the travelers’ comments from tourism social media. After conducting a content analysis, text mining, and factor analysis of a sampling of 23,019 travelers’ comments, this study found that travelers based on their activities and experiences constructed their image. Additionally, we also found that the travelers’ emotions and impressions showed up with their images. From the result of factor analysis, we extract the 13 clustering results and perform the one-way ANOVA with Scheffe’s method to compare the difference among each group. Finally, we used the related sentences to draw a relation map to explain the inner difference between travelers. This study’s results suggest that traveler-generated comments can be especially useful for destination image analysis and market segments in tourism marketing and management. This study also highlights the importance of understanding destination image and marketing segment from the travelers’ comments and challenges for those in tourism marketing to narrow the gap.

1. Introduction

Several studies confirmed that recognizing the traveler’s lifestyle in destination images becoming a critical issue [1,2,3,4]. This paper defines the rapidly emerging traveler’s lifestyle of social nomads, who review while traveling and travel while messaging. To understand the phenomenon, this study starts from the lifestyle profiles of travelers by using activities, interests, and opinions (AIO) statements to investigate the traveler’s generated content (TGC).
TGC plays a critical role in representing travelers’ behavior during the traveling process. Researchers also confirmed that the TGC affects their destination formation [5,6]. Word-of-mouth is considered an influential vital resource [5,7]. With the popularity of social media, our research via social media to catch the TGCs [8,9]. Thus, it is crucial to cluster destination image formation [10,11,12]. It helps travelers share their cognitive and affect opinions and benefits researchers to deeply realize the formation of the destination image process [13,14,15].
The traveler gathers information, such as pictures and text, to make decisions. Li et al. [16] indicated that TGC is an information source for choosing a destination and searching for other travel-related information. Although many studies have focused on the importance of cognitive and affective images that affect destination image (DI) formation, researchers utilized travel social media to analyze post-travel behavior. However, only a few studies based on travelers’ emotions segment travelers’ formation with their traveling lifestyle. Finally, TGC from fellow travelers represent honesty and trustworthiness, so travelers rely on TGC as a dependable source for their travel decisions.
However, limited studies have focused on the travelers’ lifestyle, so we based on TGC as a source for analyzing the DI of travelers. It benefits from analyzing different cities’ traveler marketing. Moreover, our research data from TripAdvisor, a famous travel social media, focused on five different Asian cities such as Hong Kong, Singapore, Tokyo, Seoul, and Taipei. Our research via travel comments of different travelers and our search tools are clustering methods and text mining to cluster travelers’ formation of destination images about the lifestyle. Finally, our research expects to utilize mixed analysis to investigate the similarities and differences in travelers’ lifestyles. Therefore, the objectives of this study are three-fold: (1) analyze the DI of five Asian cities based on TGC from different travelers, (2) examine the traveler’s lifestyle of AIO in five Asian cities, and (3) cluster travelers’ lifestyle based on destination images.

2. Literature Review

2.1. The Traveler’s Lifestyle in Destination

Lifestyle segmentation provides the essential concept of the tourism market. Several studies define lifestyle as patterns in which people live and spend their time and money reflecting on people’s AIO [9]. Lifestyle is an indicator for measuring the travelers’ experience [17,18].
In marketing research, tourism scholars often develop various scales and integrate them into segmentation studies. Previous studies indicated that the AIO helps researchers realize the consumer’s psychographic profile. Moreover, AIO stands for understanding travelers’ behavior [9,19,20].
Several studies utilized the traveler’s questionnaire along with the AIO and utilized the K-Means clustering procedure [9,21]. The result shows that knowledge about various segments of foreign visitors and the demographic profile of each segment will enable effective destination marketing strategies to develop.
Serval studies often utilized factor analysis and cluster analysis to cluster the groups with AIO. For example, Xiang and Gretzel [22] used it to analyze the top lifestyle dimensions for staycation travelers. Yamada and Hayashida [23] used it to analyze cultural influences on travel lifestyles (Korea and Australia). Yan et al. [24] utilized it to cluster different travelers’ lifestyles.
The above result shows that motivations and lifestyle could influence their decision-making style in different destinations. AIO-related products and services, combining motivation and lifestyle dimensions in the form of segmentation analysis to identify specific traveler groups for targeted marketing campaigns. Additionally, Huang [25] also indicated that social media rapidly developed, and many travelers use social media to obtain others’ experiences or opinions. This information could become essential and benefit tourism agents to grasp the lifestyle profile of their customers and develop strategies to entice the travel market.

2.2. Understanding the Traveler’s Lifestyle and Destination Image Formation

The destination image is one of the most famous research issues. Several critical analysis studies have been conducted to identify how this construct has been conceptualized and measured [5,26,27,28]. Baloglu and McCleary [5] understand the formation process of destination images in travelers’ psychology. They found in the process of sorting out past literature that many studies believe that the establishment of impressions comes from external incentives (e.g., word-of-mouth of the destination) and personal factors (e.g., characteristics of travelers).
On the other hand, the research considers travelers’ lifestyle, defined as a belief or understanding of a travel destination, and related to travelers’ experience or feeling during the travel process to produce affective changes to the destination and directly affect the change of imagination [5,7,29,30,31]. Beerli and Martín [7] analyzed travelers’ questionnaires and utilized factor analysis and regression analysis to understand travelers’ cognition, affective factors, and destination image in Spain. Li et al. [16] pointed out that travelers’ word-of-mouth affects destination image formation because travelers’ positive or negative lifestyle affects destination image formation and travel decision behavior [32,33].
A literature review indicates that the formation of the destination image is composed of cognitive, and affective. The cognitive factor stands for collecting information and strengthening travelers’ expectations and affective for forming a destination image [5]. Generally, Kladou and Mavragani [34] have examined the attributes of comments for TripAdvisor (such as cultures, attractions, and activities). O’Connor [35] indicated that influential factor stands for travelers’ effectiveness (e.g., motive and attributes) and reflect travelers’ conative, such as excitement, happiness, and busyness. In addition, Gartner [36] indicated that destination image formation through the interaction of cognition and affective, which more directly reflects the lifestyle.

2.3. Destination Image and TGC from Social Media

The TGC considers an organic information source. One is word of mouth formed by family, friends, and another source of social media [37]. Recently, the study of TGC also affects the travel destination lifestyle of travelers through social media, making the online review of a destination a highly credible travel medium [38,39,40]. For example, O’Leary and Deegan [39] point out that the Internet is convenient that many travelers such as sharing their travel experiences or comments on social media.
Lim and Bendle [30] indicated that TGC is not only affecting the establishment of travelers’ destination brands but also influences stimulus (such as inference procedure) and personal activities (such as emotional transformation procedure). Therefore, TGC and personal travel emotiveness generate the overall destination image and experiences. It makes the destination image of travelers constructed on cognitive (such as attractions, cultures), and affective (feelings, emotion) [5,7,41,42]. Echtner and Ritchie [41] utilize content and factor analysis to analyze the destination image of travelers’ cognition and distinguish it from comfort, habits, natural attractions, facilities, and weather. It has indicated that destination image composes travelers’ lifestyle and overall destination image.
Marine-Roig [33] utilizes the photographic data scene and contact analysis to understand the TGC and World Tourism Organization (WTO) applied comments of East Taiwan in social media. The TGC was such as cognitive images of natural attractions, basic facilities, unique activities, and attractions. However, the WTO differs from TGC because it has rich emotion in articles, and TGC can more genuinely reflect the impression of travelers on the destination image. Um and Crompton [12] pointed out that utilizing the structured analysis has several limitations because they need to gain travelers’ travel experience in a questionnaire. Therefore, they utilize mixed qualitative research to gain travelers’ characteristics and complete destination image descriptions, and traveler-generated content, which can allow researchers to describe the content of reviews closer to the impression of travelers’ behavior, cognition, and emotion [39,41,43].
From a practical point of view, the complete destination image mainly targets and promotes strategies to provide travelers with helpful information channels. For example, if a destination is difficult to classify or distinguish from similar destinations, the likelihood of being selected or considered in the travel decision process is reduced. The destination image’s uniqueness considers a clustering indicator of its market and an essential differentiation feature.

2.4. Analysing Traveler-Generated Content

An increasing number of studies utilize qualitative analysis (such as content analysis) to analyze travelers’ comments [16,26,30]. Lim and Bendle [30] utilize content analysis and text mining to analyze Ctrip, including 1299 travelers’ comments about Taiwan. The travelers constructed on the cognitive and affective destination image and found out Chinese travelers want a different experience when they travel to Taiwan. Hence, they rent public bicycles in Taiwan to experience the city and pay special attention to experiencing Taiwan’s old street culture. with the traditional lifestyle of the Taiwanese.
Li et al. [16] utilized cognitive impressions constructed shopping, accommodations, food, attractions, and transportation of cities concepts, and using 2247 Chinese travelers traveling Hong Kong left travel experience comments to construct effective impressions. They indicate that travelers have a profound travel experience for Hong Kong’s four-star accommodations, street food, and urban greening. In addition, in the description of affective impressions, Hong Kong people’s unfriendly and crowded degree makes Chinese travelers uncomfortable. Therefore, traveler-generated content can present travelers’ experiences [16,22].
O’Leary and Deegan [39] utilized travelers’ comments on accommodations as an analysis purpose and used content analysis to summarize and organize impressive views of five European cities, such as (1) comments on accommodations, (2) average score of accommodation, (3) recommendation percentage of accommodations, (4) popularity index of accommodations on TripAdvisor. Although travelers left comments about factifies or the environment, only a few accommodations operators pay attention to travelers’ comments on social media.
Yamada and Hayashida [23] indicated that approximately 40% of travelers gained travel information from the virtual community; the other 27% browsed other travelers’ comments and user reviews as a basis for travel shopping or food reference. Hence, no matter whether the researchers or cooperation can use text mining to define frequent words or topics to realize travelers give higher recommendations or lower recommendations for restaurants, such as flavor, environment, and service [44].
In essence, cognitive, affective, and conative are composed of multiple dimensions. From the perspective of travelers’ reviews, our research will see the pros and cons of travelers’ destination image and find travelers’ opinions on travel destinations. The degree of satisfaction of travelers will ultimately affect the decision-making behavior of travelers on travel destinations [9,15,29,45,46]. Travelers can find out how travelers formed the destination image from their perceptions and help the future marketing of travel destinations.

3. Methodology

This study adopts qualitative methods and content analysis to cluster the TGC’s aspect from five Asian Cities travelers. As stated earlier, DI is an abstract concept involving travelers’ complex and dynamic beliefs and emotions. Since quantitative surveys are more effective for analyzing a set of static variables [47], this study conducts a content analysis to cluster the travelers’ lifestyles [25].
We used the text-mining approach to understand data distribution and enhance the validation of written data [26]. Regarding this study, the content analysis and text-mining approaches are practical for making subjective interpretations of travelers’ experiences. Previous DI studies have performed content analysis regarding locations such as Zanzibar Island, Macau, and Hong Kong to investigate perceptions of the destination’s attributes and holistic impressions [16,26].
In this work, we utilize integrated qualitative and quantitative to analyze because there have been several studies that have utilized constructed qualitative to understand the reliability and validity of the model between related destination image and satisfaction [21,43,48]. However, the constructed questionnaire is easy to lack research on the properties of total imagery, and it needs to use quantitative to analyze cases and communicates with others or uses content analysis to bridge the limits of quantitative research for a long time [49,50]. Furthermore, our research used contact analysis to analyze travelers’ comments to infer the formation of destination images for quantitative concepts. Qualitative concepts use text mining to calculate and classify it and capture travelers’ comments to calculate and visualize.

3.1. Gathering Travelers Generated Content

TGC data were collected from TripAdvisor, a famous traveling social media around the world, from 2010 to 2014. The primary reason for choosing this website as the research database is its reputation in the world. We focused on five Asian cities, including Taipei, Hong Kong, Singapore, Tokyo, and Seoul, gathering TGC. Finally, we consider the relationship between cities’ popularity and geographical location selecting these cities as the primary data collection targets.
On the other hand, to construct the process of tourists’ travel lifestyles, this study adopts the AIO framework as the analytical basis for lifestyle and analyzes the comments left by tourists according to the concept of AIO. In operational definition, this study follows previous research. It defines activities as specific behaviors tourists engage in or participate in at the tourist destination, such as city tours, shopping malls, and buses. Interests are defined as the feelings tourists have when encountering things or topics in the tourist destination that excite them, such as experiencing culture or enjoying food. Finally, in terms of opinions, this study defines them as verbal expressions of tourists’ views and opinions on the stimuli they receive from the tourist destination, such as recommending taking a bus or suggesting local food.
The data for this study was obtained by developing a crawler program specifically designed to extract travel reviews from TripAdvisor. The scope of data extraction included attraction reviews from five Asian cities, and 23,019 reviews were collected.

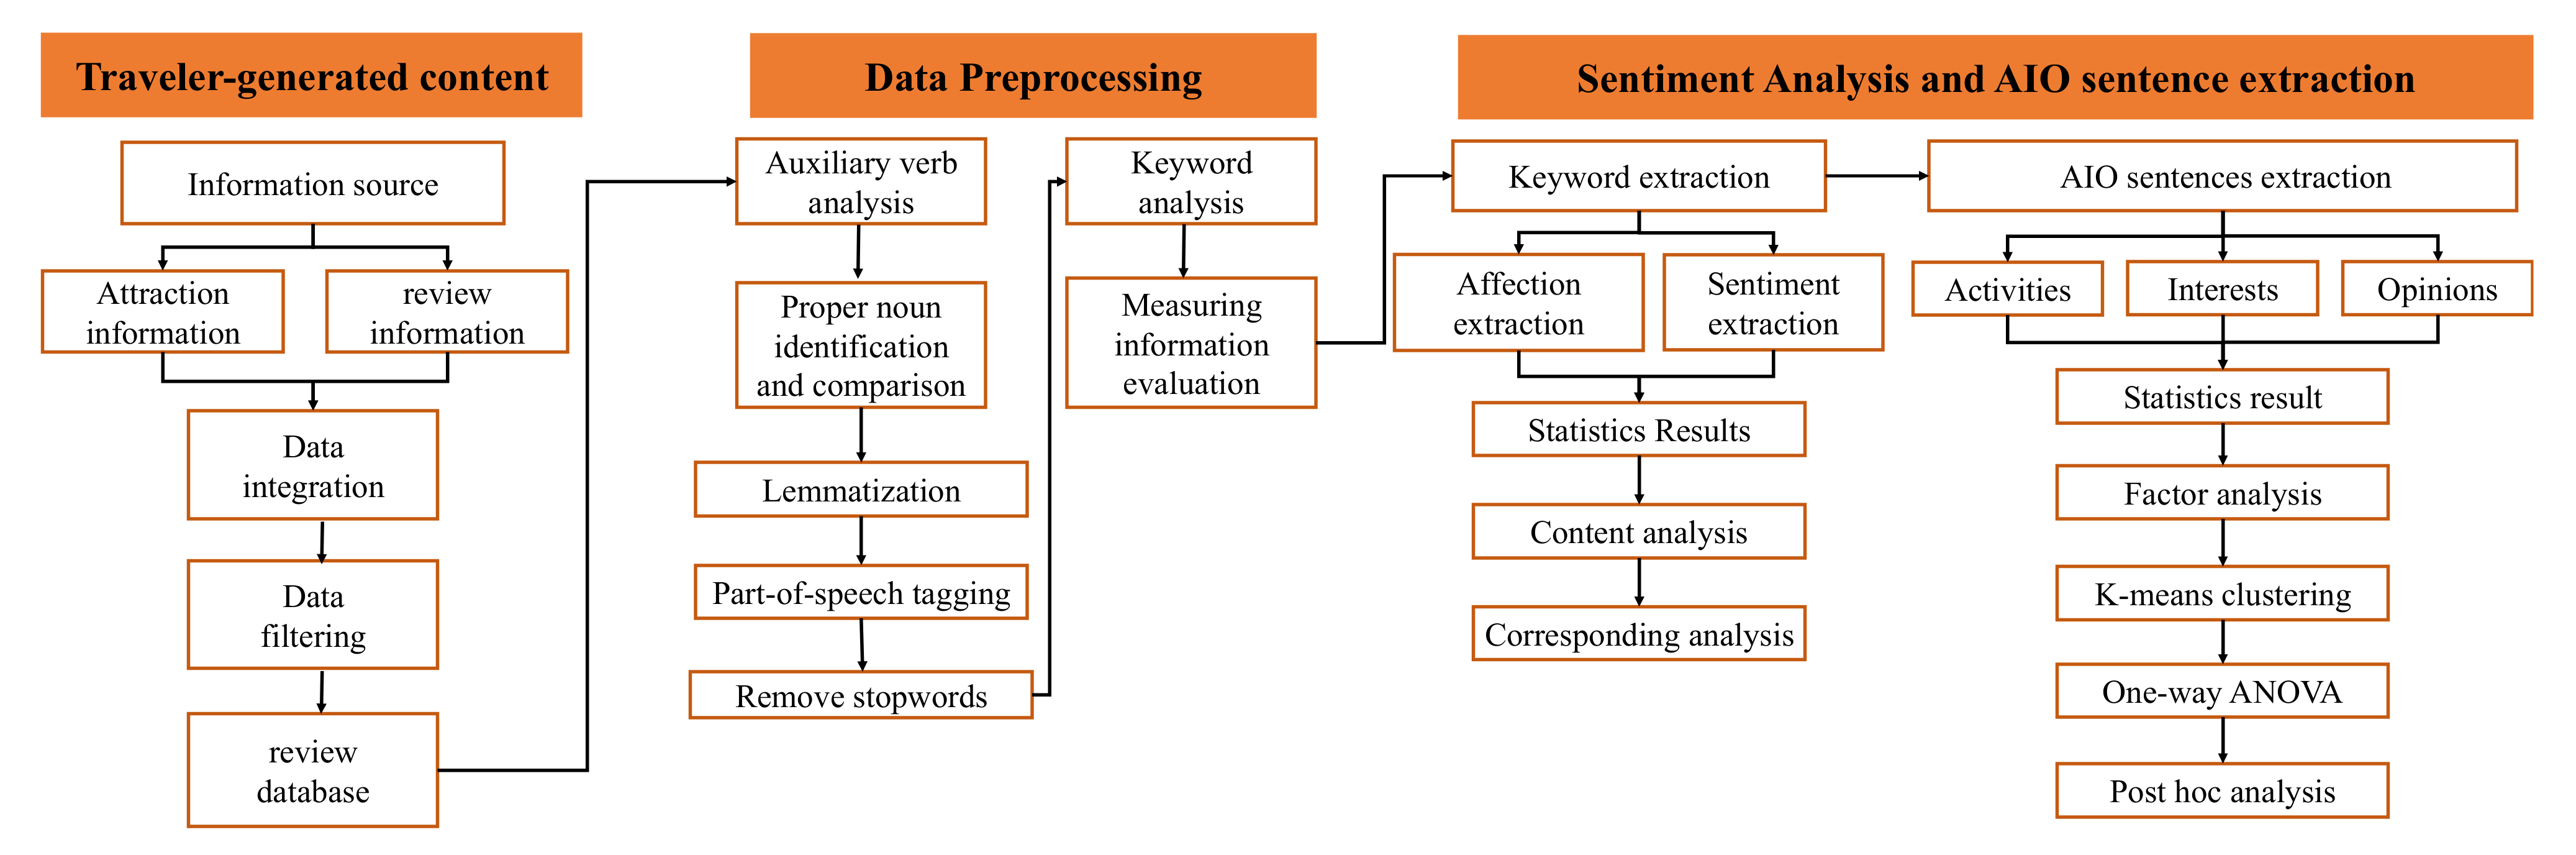
3.2. Analyzing Traveler-Generated Content Process

Our research process shown in Figure 1 to integrate the resource and text mining into sentiment and AIO sentence extraction.

3.2.1. Data Filtering

Our research utilized extracting-transforming-loading (ETL) [51]. First, regarding the time selection of the research samples, this study selected the tourism data from 2010 to 2014 to collect, mainly considering that the tourism consumption and trend survey provided by the Tourism Bureau is the most fundamental research basis.
Second, according to past studies, it is pointed out that needed to filter languages from multiple nationalities because it will influence the results of data analysis [28,52]. Third, we focused on English comments, and our research gained less than 100 pieces of TGC. To understand travelers leaving destination image comments, we divided it into attractions and activities for destination images.
The attractions image included five different categories such as attractions shopping (such as shopping malls), accommodations (such as hotels), food (such as food court), and transportation (such as mass rapid transit (MRT)) [30]. Hence, our research would collect relative terms or phrases to define the cognitive impression of travelers’ comments. Finally, we based on the six emotions, such as like, love, joy, surprise, anger, and sadness to classify the words or phrases under the insight of TGC. We define a compelling image from the destination process and point out that an effective image related to travelers’ behavior [53].

3.2.2. Text Mining

We tried integrating words in five cities, and our research utilized third-party resources such as Wikipedia and DBpedia. Next, because differences in writing habits lead to a difference in analysis, Taipei 101 is akin to TPE 101, taipei101, 101 building.
Therefore, our research utilizes N-gram to solve a sequence of N consecutive words and the phenomenon of the article’s synonyms because writing habits cause multiple meanings. Additionally, using the frequency method finds words with similar characteristics of sentences in the word.
In addition, our research utilizes lemmatization, such as visiting, visits, visit) and the process of stop words, such as a, the, in. Next, to efficiently realize relative characteristics of travelers’ comments, such as food, transportation, and accommodations. Therefore, our research utilizes integrated cognition of destination image and constructing cognition image label and affective label to classify characteristics.
We based our research on cognition image labeling; our research classifies transportation, such as MRT, Subway, and Metro. For the influential label, according to extracting stage, the mention of six inspirational words, such as happiness, is classified as Joy to analyze emotion to understand the affective characteristics of travelers’ travel destination. After identifying and classifying labels, our research put the labels into text weight, such as TF-IDF. TF-IDF is used for valuing keywords for travelers’ comments [54], including term frequency (TF) and inverse document frequency (IDF), and it can understand between commonalities of travelers’ comments. Our research utilizes Jaccard similarity for the similarity index because it calculates the similarity level of two sets [35].

3.2.3. Content Analysis

Our research used the data visualization method to present the above keyword analysis results through available tools (Provalis). First, our research utilized network graph relationships to calculate the position of the group center of the connection within each group. Next, calculate the number of connections and connections between groups. According to each node, giving a suitable cluster and display.
Third, our research utilized correspondence analysis to analyze an interactive summary table of qualitative variables to reveal the relationship between variables [55]. Since our research utilized correspondence analysis to analyze affective (emotional words), and conative (activity words) cognitive travelers’ comments from attractions classifications.
Our research defined it as a formation of an image. Furthermore, correspondence analysis is used to the text information of multiple dimensions and converted into a two-dimensional way employing R-Q factor analysis. The destination image in the traveler-generated content is presented on the corresponding analysis map.

4. Research Findings

The result shows the correlation between travelers’ destination image and cognitive impression. For example, when travelers plan their timetable, they seek advice from other travelers. Numerous studies indicate that these concepts will influence travelers’ psychological motivation [46,56]. Thus, traveler-generated content considers a DI of marketing strategies in the future. Since the formation of the destination image consists of cognitive and affective, our research indicates that traveler-generated content can help travel agents with marketing strategies.
This study collected 23,019 TGC from Hong Kong, Singapore, Tokyo, Seoul, and Taipei. Moreover, we analyze museum, culture, outdoor, etc. destination categories, including 342 destinations from five cities. It can help us to comprehend cross-national travelers’ impressions of different cities. Finally, the data description is shown in Table 1.

4.1. Keyword Analysis of Traveler-Generated Content

On the other hand, we perform the text mining approach to analyze TGC to recognize the different destination images and lifestyles among cities. Therefore, we identified the keyword frequency from TGC and listed the top 40 in Table 2.
The keyword analysis shows that the keyword, TF-IDF, percentage of cases, such as “view”, counted TF-IDF weight is 4556 and shown in 22.6% of the traveler’s content. On the other hand, Table 1 also shows the relationships between keywords and the city’s ranking, such as “view” ranks in Hong Kong standing No. 1, which means the travelers visit the destination using words to describe affective during the trip.
In previous studies, the traveler focused on their actual activities when they arrived at a travel destination and presented their lifestyle of the destination through participation in travel activities and actual experiences [57]. We selected the top 10 keywords for travelers’ impressions of each city. For example, the keywords “bus” and “tram” ranked 29th and 31st but seventh and eighth in Hong Kong, reflecting the traveler’s feeling that the bus and tram are essential in the traffic experience.
Additionally, animals ranked 16th, and gardens ranked 18th; nevertheless, it stands fourth and seventh in Singapore, representing a wild and green experience for the traveler. In Tokyo, the shop ranked second, which means the traveler enjoys engaging in the shopping experience. In Seoul, the museum ranked sixth, representing that the cultural experience is worth trying. Finally, the keyword “building” represents Taipei ranked fourth, e.g., Taipei 101.
Next, we analyze the differences in travelers’ travel experiences through different cities. This study utilizes correspondence analysis of traveler-generated content based on the city’s perspective to understand the differences in travelers’ cognitive, affective, and conative in different cities. Correspondence analysis maps travelers to city impressions and keywords in a two-dimensional space, and the cumulative explained variance in the two dimensions reaches 92.985%. Among them, the eigenvalues representing the two dimensions are 0.104 and 0.037.
Following Figure 2 below, our research focuses on different cities; five cities are classified as clusters, which are observed from the location on the graph. In Hong Kong, it is closer to keywords, such as spectacular, ride, view, and queue, which means travelers mention Hong Kong, they are more likely to mention the experience of cable cars or buses; in Singapore, the keywords are tree, variety, hot and wonderful, which means travelers could attend many activities. In Tokyo, the keywords such as check, local, main, and street means when travelers arrive in Tokyo, the experience will be closer to tradition and more related to landmarks.
In Seoul, it is closer to keywords such as tower, history, and street, which means travelers’ comments on Seoul are more related to the experience of the museum or the experience of the tour. Taipei’s experience is closer to keywords such as main, crowd, local, fun, and street, which means that travelers’ comments on Taipei are closer to local or architectural attractions.
The results show the perspective of the overall formation of destination image to understand how travelers of different nationalities form impressions of different traveler cities. The distance between Tokyo, Seoul, and Taipei is relatively close on the map, which means that travelers have commented that the three cities have relatively similar travel experiences. Tokyo and Taipei are primarily related in the main, crowd, locals, and streets. It also means that there are local buildings in the three cities, and there are also several typical shops. However, they may be “crowded”, which is also in line with the description of the city image. For Seoul, it focuses on city descriptions related to history and towers. On behalf of travelers’ comments to deepen the description of historical impressions in the destination city and convey a dominant folk style [58]. In addition, Hong Kong and Singapore have their main characteristic attractions in the city; for example, the garden and zoo in Singapore, as the bus and tram mentioned in related comments in Hong Kong are relatively unique cities in the local area experience. It can also understand that the overall traveler-generated content consists of characteristic and unique topics.

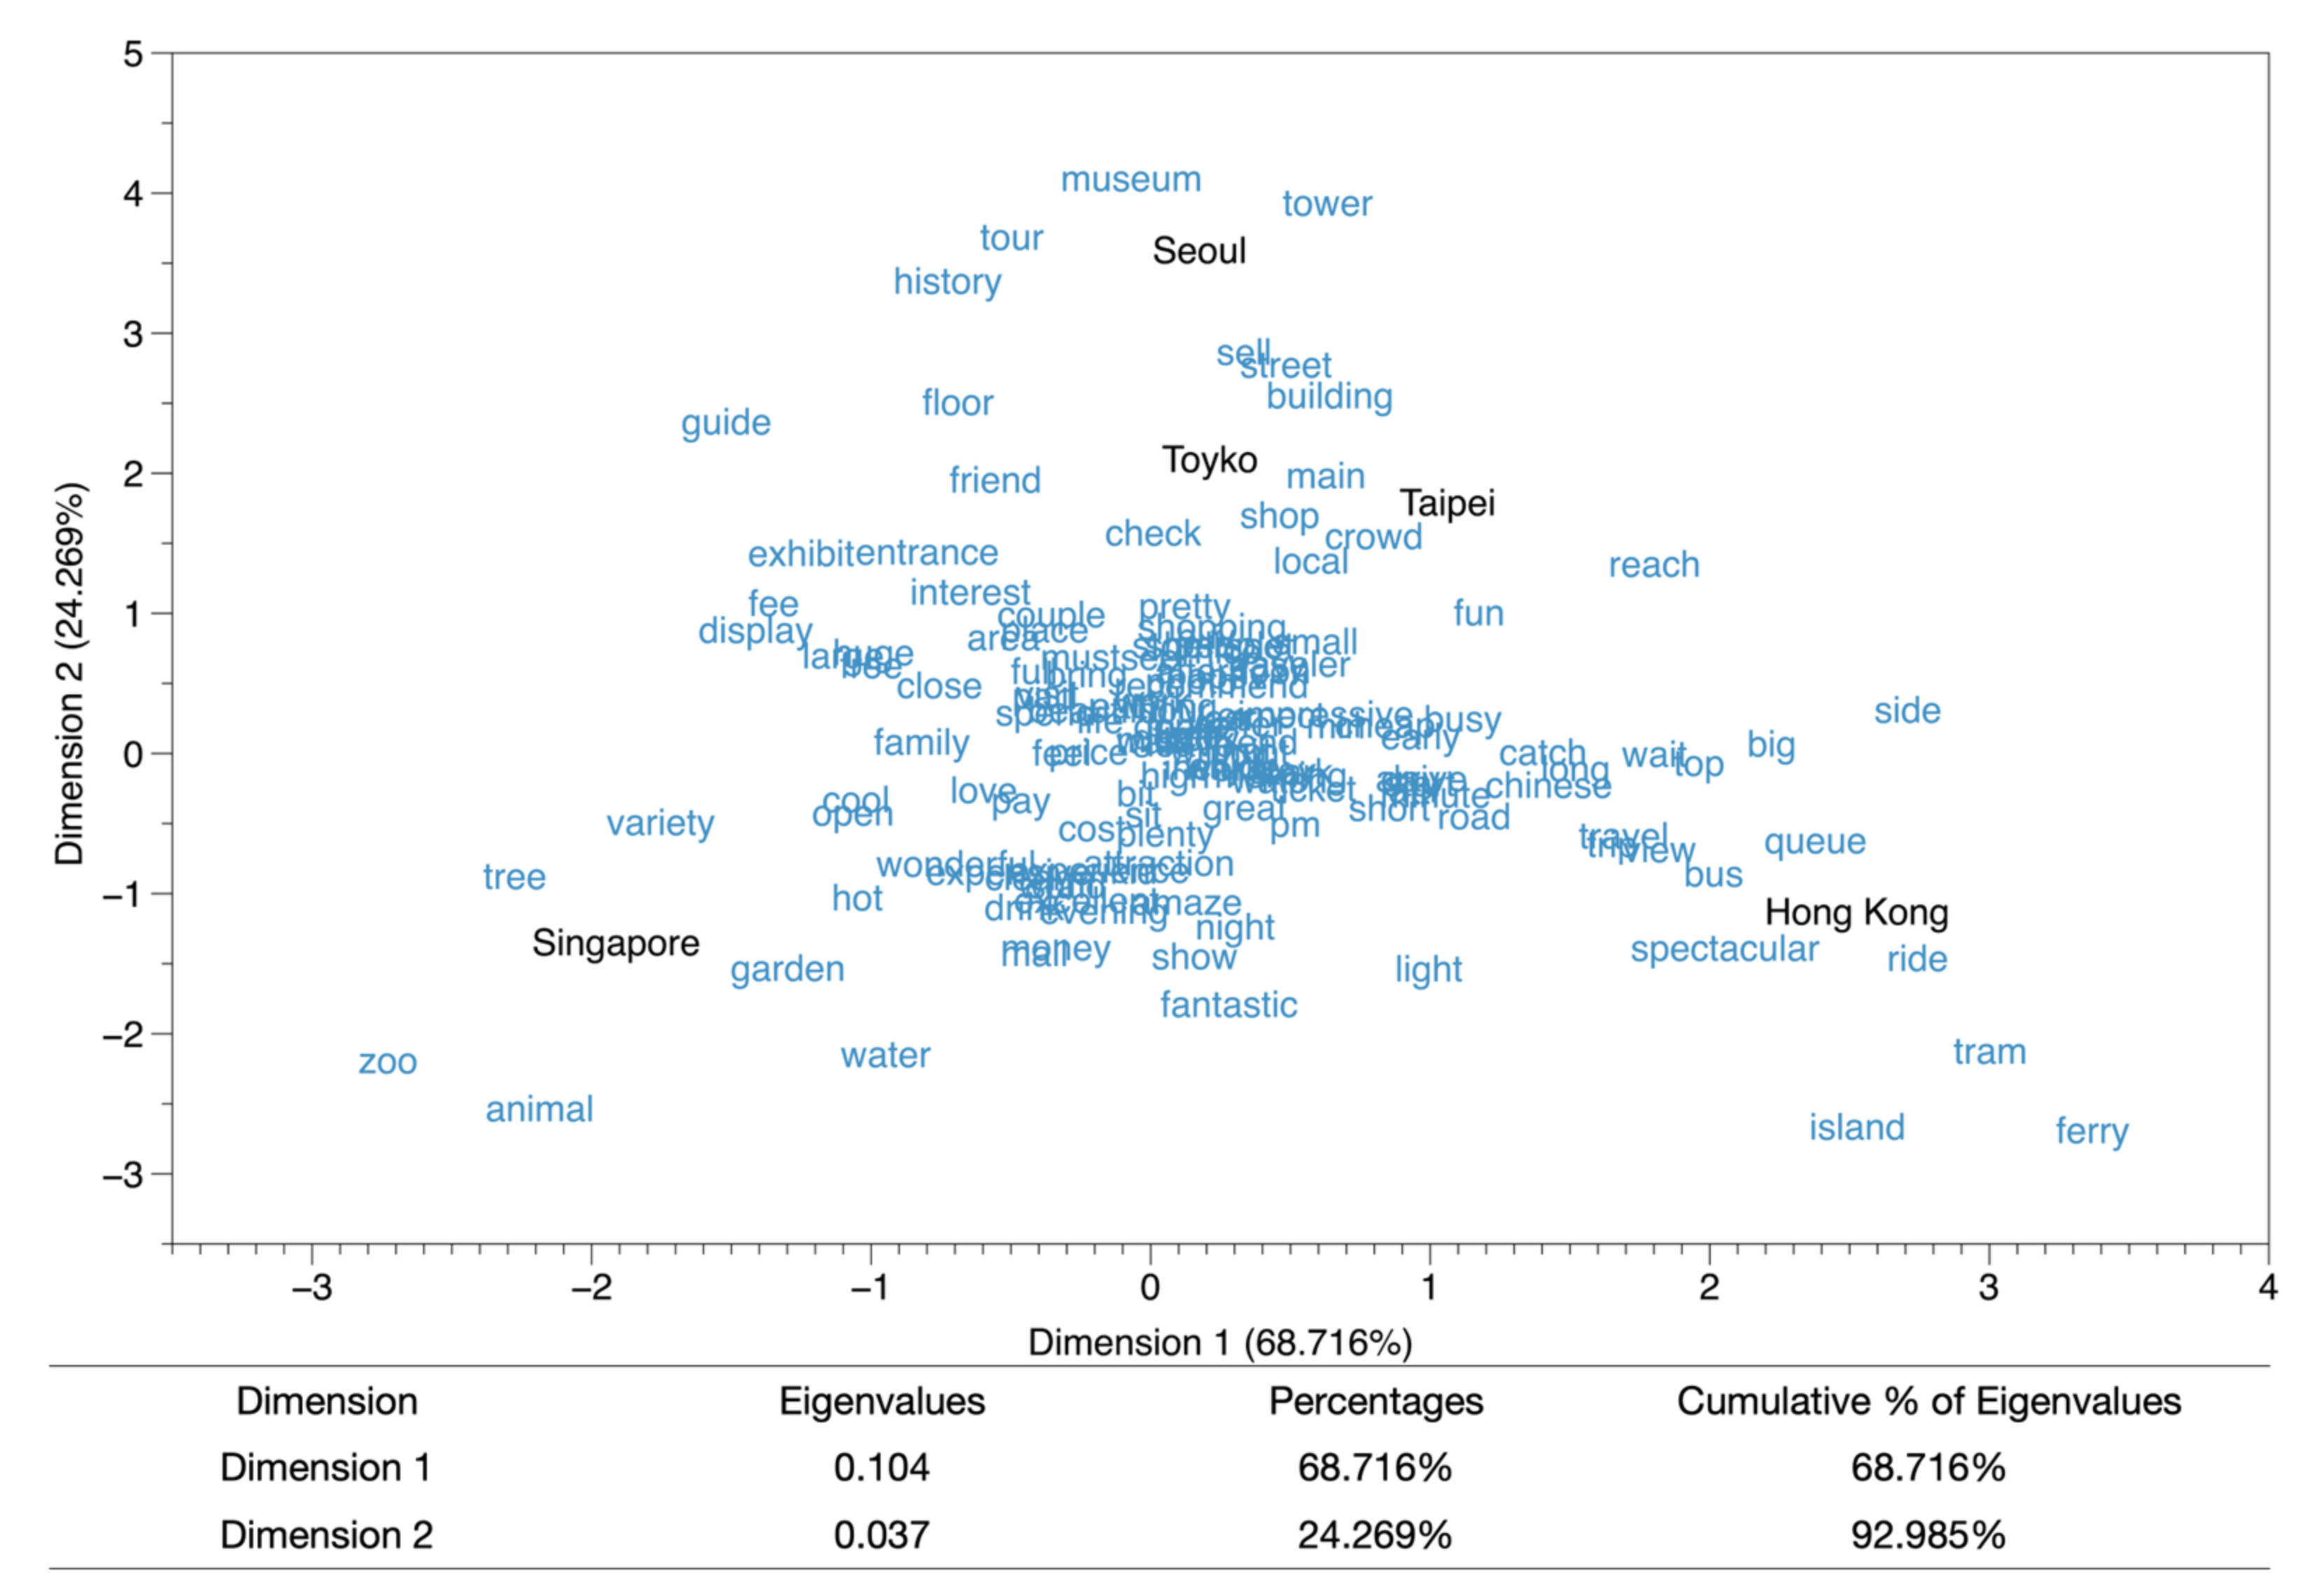
4.2. Analyzing Cognitive and Affective Images from Cross-National Travelers

To deeply understand the formation of destination images from different travelers’ comments. Previous studies [26,30] indicate that five categories such as attractions, shopping, accommodation, food, and transportation, are used as the basis for cognitive impression. In addition, several studies provide a lexicon to analyze effectiveness [59]. Thus, our research utilizes it to analyze the affective impression of travelers’ comments.
First, our research introduces relevant words in travelers’ comments and classifies them, for example, the zoo is mentioned 2834 in travelers’ comments, which means 65% of travelers left a comment about the zoo (Table 3). From the results of the summary, travelers’ cognitive impressions of five cities mainly mention attractions, transportation, and food, especially in the discussion of attractions, which not only appeared 34,472 times but also exceeded 62%. Travelers will share their impressions of the scenic spots when they experience the destination, and the three scenic spots that share money are mainly zoos (2834), parks (2786), and museums (2316).
In the discussion of transportation categories, travelers mainly focus on the bus (2238), tram (cable car, 2152), metro (subway, 1860), food (3035), and restaurant (2368). It is also a relatively extensive discussion of the food experience that can be had after the travel destination city. In the discussion of shopping, it is also more extensive such as shop (3117), market (1036), and shop (store, 932). In terms of accommodation, the main ones are the hotel (restaurant, 1292) and the marina bay sand hotel (119).
In the category of travelers’ affective impressions, our research summarizes six categories of affective, from which our research can find that most travelers with high scores leave comments on the impression of a destination image, and most of them use positive emotions to describe their experience when traveling in a destination image. This finding is also close to the previous research, such as Leung et al. [8], which indicates that positive traveler sentiment contributes to travelers’ autonomy when visiting a travel destination because positive traveler impressions will benefit travelers’ possibility of revisiting later [31]. Especially from travelers’ comments on the emotional impressions of the five cities, love (like, 5580) and joy (joy, 5498) are the primary traveler emotions. In the favorite category, the main word is still love (like); 8.5% of the traveler reviews appear 3215 times, accounting for 57.6% of the love category, which is also an emotion that travelers like to experience in the travel destinations index.
In the joy category, travelers most like to use enjoyment (4029) in 13.3% of traveler reviews, representing travelers describing the immersive feeling of being in a travel destination. Next is surprised (surprised, 2863), with the keyword amaze (surprise) representing the most surprising drug, appearing in 6.8% of traveler reviews and being mentioned about 2322. In addition, in the category representing negative emotions, travelers will mainly use sadness to describe the terrible experience encountered in the travel destination, especially disappointment (disappointment). However, only 1.2% of travelers will mention the experience that they encountered about 750. On anger (277) and fear (scared, 270), although some travelers will mention relevant descriptions, they only account for a small number of comments.

4.3. Analyzing Key Sentences from Travelers’ Generated Content

To explore the way travelers, experience life from the travel process. Our research utilizes the analysis method of capturing key sentences in text mining based on AIO. Different from the method of keyword analysis, the key sentence analysis application of splitting the articles reviewed by travelers into multiple sentences further understands the experience and experience of travelers in destinations and overall satisfaction.
Furthermore, this approach stands to realize the classification of lifestyles that travelers expect from travel destinations from the perspective of travelers. First, our research collects AIO questionnaires and analyzes each questionnaire’s items. The purpose of the analysis helps this study clarify the measurement methods of AIO in the past [3,17]. From the analysis results of the questionnaire, we summarized the words that were consistent with the description of AIO for the items of AIO (Table 4). Next, our research utilizes these words as AIO viewpoints to carry out data exploration, leave AIO-related descriptions in travelers’ comments, filter out the most irrelevant comment descriptions, search for words, and find out from the article. From there, the corresponding sentences are made, and the sentence is used as the unit of analysis for further analysis.
The keyword analysis not only understands how impressions of travel destinations are but also discovers more clearly the relationship between destination impressions and traveler satisfaction through correspondence analysis. The limitation of keyword analysis is that it examines all traveler reviews from a relatively macro data point of view. Hence, our research grasps the general content of travelers’ reviews through frequency sorting and statistical verification, but this method needs some discussion. The next step of this research will be to use the sentence-based analysis method to understand the tourism activities and behaviors of travelers in the destination according to the lifestyle mentioned by travelers in the reviews. In part, on lifestyle, we followed the practice of traditional literature. We first found the sentence description related to AIO through the corresponding keywords and mentioned the travelers’ comments related to AIO in the review according to the sentence.
In the part of sentence extraction, our research first analyzed the keywords related to AIO mentioned in the data analysis chapter. The research results show in Table 5. Our research collected a total of 68,386 comments from 23,019 travelers, distributed among 15,658 travelers in the comments, an average of 4.37 comments related to AIO. From the results of crucial sentence extraction, we found that when most travelers leave comments, they mainly take the guided tours or sightseeing activities in the destination as the central axis of comments and then mention the description of personal interests or opinions.
Next, our research analyzes these sentences. Firstly, in the choice of analysis method, our research adopts the analysis method of factor analysis because factor analysis is an analysis method especially dealing with complex data. It is essential to use to determine the structure of potentially complex data. It utilizes a few representative factors to explain a group of interrelated variables while retaining the most original information. Afterward, our research named the factors from the found factors and, at the same time achieving the purpose of data simplification and summary. From the extracted sentence data, our research first analyzes the extracted sentences. In the analysis process, we use the category in the destination impression as the basis, find out the correlation between the category and AIO, and then treat it as an analysis variable, the frequency of keywords within the category is put into the data analysis column. In the end, we collected more than 200 variables related to scenic spots. To reduce the data’s complexity, we use categorical variables for analysis.
The results of the KMO and Bartlett test show that the relevance of the data is equal to 0.754, and the p-value of the Bartlett test statistic is significant. The KMO value representing the suitability of the data is more significant than 0.7, which means that the variable samples we selected have many common factors and are suitable for performing factor analysis. Finally, we found that 13 clusters are significantly separate from the 38 variables, and the cumulative ability to explain the variation when reaching the third variable is 45.893%. According to Yong and Pearce [60], when explaining a variation of More than 40% means that the explanatory power of the data is considerable. Then we select factor loadings greater than 0.3 from the component matrix as the primary observation variable. The result shows the factor analysis in Table 6.
We performed factor analysis, a statistical technique widely used in psychology and the social sciences [61], and created factor cutoffs by analyzing eigenvalues. It is essential to represent the variances in measured variables [62]). Therefore, we summarized eigenvalues calculating its squared factor loadings. Finally, the result shows that factors with small eigenvalues represent little common variances without analyses.
There are 13 groups in our analyzed result. The first group included transportation (0.73), take (0.663), top (0.613), walk (0.445), attraction (0.333), view (0.393), and easy (0.335) seven keywords, and the eigenvalue is 3.053, the explainable variation is 8.251. The group represented the travelers enjoying their comprehensive activity experience because of the impression of destinations with its easy transportation.
The second group included food and beverage (0.694), shopping (0.643), fresh (0.54), and try (0.304). In composition, its eigenvalue is 1.556, and the explainable variation is 4.205. The travelers felt their experience in food and shopping.
In the third group, we have included go (0.575), amaze (0.551), and see (0.524), its eigenvalue is 1.325, and the explainable variation is 3.581. It shows travelers feeling fantastic activity in their tourism experience and share with other travelers.
The fourth group shows free (0.636), enter (0.487), accommodation (0.434), and use (0.342), and its eigenvalue is 1.277, explaining that the amount of variation is 3.452. The group represented the accommodations to share their experiences in destinations.
The fifth group included visit (0.741), worth (0.661), and attraction (0.359); its eigenvalue is 1.219, and the explained variation is 3.296. The group contains representative destinations, and the traveler will leave comments after their activities.
The sixth group included crowd (0.636), queue (0.579), and go (0.306); its eigenvalue is 1.175, and the explained variation is 3.174. travelers used to describe the situation of destinations. The seventh group included fun (0.576), show (0.507), and view (−0.394), its feature value is 1.124, and the explained variance is 3.038. The keyword belongs to the travelers’ interests that correlated with the activity impression, such as show and scenery.
The eighth group included recommend (0.536), feel (0.534), and atmosphere (0.416), with an eigenvalue of 1.087 and an explained variance of 2.938, which represents opinions from travelers’ atmospheres.
The ninth group included great (0.696) and experience (0.432). The keyword is related to the experience, such as a special feeling for the experience obtained from the destination, and it is easier to leave a positive impression.
The tenth group included relaxing (0.637), nice (0.555), and walk (0.38). The combination of the key to relaxation and good experience means that the travelers in this cluster care a lot about whether they can get relaxation from the activities.
The eleventh group included enjoying (0.423), beautiful (0.638), wonderful (0.556), and easy (0.383). The explained variation is 2.781. This cluster is composed of enjoyment, meaning that travelers in this cluster are more willing to enjoy the feeling given by the destination.
The twelfth group included like (0.698) and interest (0.36), their eigenvalue value is 1.015, and the explained variation is 2.744. This cluster is composed of interests and likes and represents travelers’ interests and opinions on the activities of travel destinations. The thirteenth group included interest (−0.315) and awesome (0.731), its eigenvalue value is 1.005, and the explained variation is 2.717. It means that travelers in this cluster will enjoy the freshness of the destination or be different from their engaging experiences.
This study further analyzes the impact of differences among various lifestyle groups on destination image and satisfaction from travelers’ ratings. Therefore, one-way ANOVA tests were conducted to verify these clusters further, and the results (Table 7) show significant differences across all 13 motivation clusters. The study results found that the images of all the destination clusters in each cluster reached a significant level. Through multiple comparisons after the fact, we found out that travelers who travel to the destination will primarily obtain the local experience and living atmosphere from the destination.

5. Discussion and Conclusions

5.1. Findings

The purpose of this study is to analyze traveler-generated content. When travelers travel to a destination city, the factors of the destination image are discussed through content analysis and text mining mixed with quantitative and qualitative analysis. According to past research, it points out that traveler-generated content is equivalent to word-of-mouth and dissemination. The quality of word-of-mouth affects travelers’ destination image and is regarded as a mechanical stimulus that affects travelers’ willingness to visit [7,16,30]. From the results of the correspondence and association analysis used in this study, we can summarize the conclusions of the study as follows:
The image formation of the destination image corresponds to the conative impression, and the travelers’ comments will reflect the activities of the travelers in the travel destination. Therefore, through the corresponding analysis, the perceptual map can first reflect the travelers’ intentions to visit the destination. A preliminary impression about the formation of the destination image and most of the keyword map to the affective and conative of the attraction, which is similar to the results proposed by past research [5,7,16,30]. This study utilizes the results of the correlation analysis of city impressions and keywords and the cognitive and affective impressions of different cities to present the differences between travelers’ comments when they travel to destination cities. In the corresponding analysis of city impressions and keywords, our research first takes different cities as the basis of the analysis dimension and integrates the keywords frequently appearing in traveler reviews as the basis for the analysis. Taipei presents a relatively similar travel experience to travelers, especially between Tokyo and Taipei. They also share the cognitive impression of buildings or shops and present a more dynamic experience such as being on the ground, crowded; in addition, for the city impressions of Singapore and Hong Kong, due to the featured cognitive impressions (for example, gardens, zoos in Singapore, buses, and cable cars in Hong Kong). There is a relatively different cognitive impression.
The relationship between housing prices and affective impressions in five cities, in order to deeply explore the textual discussions of many differences in the comments, utilizing the correlation analysis in the research and exploration of the city, and by calculating the similarity of the articles, our research can gain a deeper understanding of cognitive impressions and affective impressions, categories and analyzed places calculated through a scene, a cutscene, convenient comments, joy, surprise, sadness, difficulty, exciting places, common problems calculated and analyzed through an activity. The descriptions of impression characteristics are indeed found in different cities. The analysis finds that there are unique traveler attractions such as Singapore. From the correlation analysis, from the correlation of keywords, we can know the reason is that Special families who “like” to be in close contact with animals and visitors to the park may be brought by children.
By integrating high-frequency keywords of cities and traveler-generated content into elements of corresponding analysis, content analysis can use to preliminarily understand traveler-generated content to generate descriptions and visual information for scenic spots. At the same time, the results can show that traveler-generated content map inter-city tourism. Differences arise from travelers’ experience gaps in destination cities [26]. In the correlation analysis of different cities, our research tries to determine the similarities and differences in travelers’ destination experiences from the cognitive and affective impressions. For example, travelers in Taipei and Tokyo have a common cognitive impression of buildings and landmarks, and they will get affective impressions of love and joy. Taipei’s unique city image is hot springs and tea houses, but when arriving in Japan, the extraordinary city image is Shinjuku, which can explain the difference between cognitive and affective impressions in traveler-generated content.
As suggested by Tasci and Gartner [63], our research can determine that there are indeed many different “gazes” from traveler-generated content. These benefits must depend on the accumulation of cognitive and affective impressions of travelers during their visit to the destination city or dynamic type. At the same time, our research utilizes the textual feature analysis of traveler-generated content to understand the way travelers’ perceptions, affective, and conative of the formation of destination image, which will help enrich our research on tourism research in the future.

5.2. Managerial Implications

This study has managerial implications as it outlined how the TGC perceived the traveler’s lifestyle in five Asian cities. While researching life experiences, we not only delved into the correlations between destination factors from the perspective of tourist reviews but also broke through the limitations of cross-national research by analyzing the comments of 23,019 tourists from Asian countries who shared their life experiences. Finally, we found 13 different life experiences distributed in the cities visited by Asian tourists.
A significant finding is that TGC gradually reminds the attention of practitioners and researchers. Significantly TGC can fully demonstrate the formation of a destination image because the traveler’s psychological feeling reflects on the experiences. However, several vital attractions that drive the current marketing material by the DMO identified the travel destination activities as core constructs of the five Asian cities’ image. Therefore, practitioners can fully understand destination image formation, and convenient for organizing the relevant itineraries and marketing recommendation strategies.
On the other hand, our research also reflects on past findings such as experience in buses and cable cars as local’s daily lifestyle [64]. Choe and Kim [65] indicate the importance of treating food and beverage to experience the local food style. Therefore, practitioners can recognize the travel destination lifestyle benefit for reducing the image basis.
From the perspective of TGC, cognition, and affective, travelers turn their destination experience into reality comments, which ultimately become elements of various activities such as work, sports, shopping, and entertainment. Commitment to things they consider interesting and important, their opinions about themselves, social issues, education, future, culture, and so on [9,25,66]. It also thoroughly explains that traveler comments can reflect on travelers’ lifestyle about the travel destination after experiencing it and can fully reflect the travelers’ cognition and affective toward the destination thread association.
The analysis results in this study also echo Echtner and Ritchie [41] that destination image comes from the consistency of functional and psychological characteristics. The results of correlation analysis can more fully reflect the similarities and differences of multinational travelers’ impressions of cities. It also allows the results of this study to serve as a reference for future researchers interested in transnational traveler research.

5.3. Conclusions

Our research also finds some potential methods for future analysis of cross-national travelers and future feasibility. For example, the differences in the behavior of travelers for a particular destination can explore based on the traveler-generated content of different nationalities. For example, in the past, Pike [11] produces an analysis of consumer behavior correlations for discussions on the rise of omnivorous cultural consumption necessity. Correspondence analysis is also of potential value for data of a single dimension, such as differences in travelers’ conative, such as whether the movement over time can be determined by travelers’ shared experiences in travel social media. On the other hand, most studies use AIO to analyze the types of travelers. For example, as mentioned above, they use questionnaires to determine which type of passengers they are, and which aspect they pay the most attention to during the travel. Lee and Sparks [66] indicated utilized it to analyze the top lifestyle dimensions for staycation travelers and so on. For different types of travelers, we can use them as the basis for the most important aspects when traveling, and then differentiate different customer groups according to their lifestyles. It is not only helpful in research but also beneficial to the tourism industry, because, through AIO, the tourism industry can clearly know what services or products travelers need during the travel process or make some itineraries.
On different types of destination impressions. As the subject of discussion. It also brings exciting research development avenues for the development of exploratory tourism time as more and more data on traveler reviews become available.
Regarding research limitations, our research tried our best to seek open third-party resources to build a thesaurus dedicated to the tourism industry. In building the word database, travelers’ writing habits (such as abbreviations, phonetic pronunciations, text, or symbols) will still cause errors in the analysis results. Secondly, in analyzing traveler-generated content, a large part of the factor is limited by the official language. Our research chose to use “English” to analyze traveler reviews to reduce the differences in data processing procedures between English and non-English-speaking countries. In the process of data processing and analysis, our research did not fully consider the time of travelers’ visits to travel destinations. Therefore, it suggests that follow-up research can conduct in-depth discussions on the time differences between travelers to different travel destinations.

Author Contributions

Conceptualization, P.-H.T. and Y.-R.L.; Methodology, P.-H.T. and Y.-R.L.; Software, C.-C.H. and C.-C.L.; Validation, Y.-R.L. and C.-C.L.; Formal analysis, P.-H.T.; Investigation, Y.-R.L.; Resources, C.-C.H.; Data curation, C.-C.H.; Writing – original draft, P.-H.T. and C.-C.H.; Visualization, C.-C.L.; Supervision, P.-H.T.; Funding acquisition, P.-H.T. and Y.-R.L. All authors have read and agreed to the published version of the manuscript.

Funding

This research was funded by National Science and Technology Council of Taiwan grant number 111-2221-E-263-001-.

Institutional Review Board Statement

Not applicable.

Informed Consent Statement

Not applicable.

Data Availability Statement

Not applicable.

Conflicts of Interest

The authors declare no conflict of interest.

References

  1. Srihadi, T.F.; Sukandar, D.; Soehadi, A.W. Segmentation of the tourism market for Jakarta: Classification of foreign visitors’ lifestyle typologies. Tour. Manag. Perspect. 2016, 19, 32–39. [Google Scholar] [CrossRef] [Green Version]
  2. Nematpour, M.; Ghaffari, M. Typology of inbound tourists Who visited Tehran grand bazaar using cluster analysis: Introducing New combining dimensional base to realize actual behavior. Almatour.-J. Tour. Cult. Territ. Dev. 2018, 9, 45–72. [Google Scholar]
  3. Vyncke, P. Lifestyle segmentation from attitudes, interests and opinions, to values, aesthetic styles, life visions and media preferences. Eur. J. Commun. 2002, 17, 445–463. [Google Scholar] [CrossRef]
  4. Gahwiler, P.; Havitz, M.E. Toward a relational understanding of leisure social worlds, involvement, psychological commitment, and behavioral loyalty. Leis. Sci. 1998, 20, 1–23. [Google Scholar] [CrossRef]
  5. Baloglu, S.; McCleary, K.W. A model of destination image formation. Ann. Tour. Res. 1999, 26, 868–897. [Google Scholar] [CrossRef]
  6. Crick, A.P. Internal marketing of attitudes in Caribbean tourism. Int. J. Contemp. Hosp. Manag. 2003, 15, 161–166. [Google Scholar] [CrossRef]
  7. Beerli, A.; Martín, J.D. Tourists’ characteristics and the perceived image of tourist destinations: A quantitative analysis—A case study of Lanzarote, Spain. Tour. Manag. 2004, 25, 623–636. [Google Scholar] [CrossRef]
  8. Lee, S.; Bai, B. Influence of popular culture on special interest tourists’ destination image. Tour. Manag. 2016, 52, 161–169. [Google Scholar] [CrossRef]
  9. Veasna, S.; Wu, W.Y.; Huang, C.H. The impact of destination source credibility on destination satisfaction: The mediating effects of destination attachment and destination image. Tour. Manag. 2013, 36, 511–526. [Google Scholar] [CrossRef]
  10. Marine-Roig, E. Destination image analytics through traveller-generated content. Sustainability 2019, 11, 3392. [Google Scholar] [CrossRef] [Green Version]
  11. Peterson, R.A.; Kern, R.M. Changing highbrow taste: From snob to omnivore. Am. Sociol. Rev. 1996, 61, 900–907. [Google Scholar] [CrossRef] [Green Version]
  12. Tasci, A.D.; Gartner, W.C. Destination image and its functional relationships. J. Travel Res. 2007, 45, 413–425. [Google Scholar] [CrossRef]
  13. Lim, C.C.; Bendle, L.J. Arts tourism in Seoul: Tourist -orientated performing arts as a sustainable niche market. J. Sustain. Tour. 2012, 20, 667–682. [Google Scholar] [CrossRef]
  14. Pan, S.; Tao, J.; Li, Y. The CASIA audio emotion recognition method for audio/visual emotion challenge 2011. In International Conference on Affective Computing and Intelligent Interaction; Springer: Berlin/Heidelberg, Germany, 2011; pp. 388–395. [Google Scholar]
  15. Qu, H.; Kim, L.H.; Im, H.H. A model of destination branding: Integrating the concepts of the branding and destination image. Tour. Manag. 2011, 32, 465–476. [Google Scholar] [CrossRef]
  16. Leung, D.; Law, R.; Lee, H.A. The perceived destination image of Hong Kong on Ctrip. com. Int. J. Tour. Res. 2011, 13, 124–140. [Google Scholar]
  17. Gonzalez, A.M.; Bello, L. The construct “lifestyle” in market segmentation: The behaviour of tourist consumers. Eur. J. Mark. 2002, 36, 51–85. [Google Scholar] [CrossRef]
  18. Konu, H. Identifying potential wellbeing tourism segments in Finland. Tour. Rev. 2010, 65, 41–51. [Google Scholar] [CrossRef]
  19. Um, S.; Crompton, J.L. Attitude determinants in tourism destination choice. Ann. Tour. Res. 1990, 17, 432–448. [Google Scholar] [CrossRef]
  20. Gelman, A. Analysis of variance—Why it is more important than ever. Ann. Stat. 2005, 33, 1–53. [Google Scholar] [CrossRef] [Green Version]
  21. Veal, A.J. Research Methods for Leisure and Tourism; Pearson: London, UK, 2017. [Google Scholar]
  22. Wang, Y.; Davidson, M.C. A review of micro-analyses of tourist expenditure. Curr. Issues Tour. 2010, 13, 507–524. [Google Scholar] [CrossRef] [Green Version]
  23. Xiang, Z.; Gretzel, U. Role of social media in online travel information search. Tour. Manag. 2010, 31, 179–188. [Google Scholar] [CrossRef]
  24. Yamada, T.; Hayashida, T. Analysis of shopping behavior characteristics in the Keihanshin metropolitan area in Japan based on a person trip survey. Geo-Spat. Inf. Sci. 2020, 23, 305–315. [Google Scholar] [CrossRef]
  25. Budak, C.; Goel, S.; Rao, J.M. Fair and balanced? Quantifying media bias through crowdsourced content analysis. Public Opin. Q. 2016, 80, 250–271. [Google Scholar] [CrossRef] [Green Version]
  26. Choi, S.; Lehto, X.Y.; Morrison, A.M. Destination image representation on the web: Content analysis of Macau travel related websites. Tour. Manag. 2007, 28, 118–129. [Google Scholar] [CrossRef]
  27. Crotts, J. Consumer decision making and prepurchase information search. Consum. Behav. Travel Tour. 1999, 11, 149–168. [Google Scholar]
  28. Kayar, Ç.H.; Kozak, N. Measuring destination competitiveness: An application of the travel and tourism competitiveness index (2007). J. Hosp. Mark. Manag. 2010, 19, 203–216. [Google Scholar] [CrossRef]
  29. Fakeye, P.C.; Crompton, J.L. Image differences between prospective, first-time, and repeat visitors to the Lower Rio Grande Valley. J. Travel Res. 1991, 30, 10–16. [Google Scholar] [CrossRef]
  30. Li, Y.R.; Lin, Y.C.; Tsai, P.H.; Wang, Y.Y. Traveller-generated contents for destination image formation: Mainland China travellers to Taiwan as a case study. J. Travel Tour. Mark. 2015, 32, 518–533. [Google Scholar] [CrossRef]
  31. Ross, G.F. Destination evaluation and vacation preferences. Ann. Tour. Res. 1993, 20, 477–489. [Google Scholar] [CrossRef]
  32. Coshall, J.T. Measurement of tourist s’ images: The repertory grid approach. J. Travel Res. 2000, 39, 85–89. [Google Scholar] [CrossRef]
  33. Mak, A.H. Online destination image: Comparing national tourism organisation’s and tourists’ perspectives. Tour. Manag. 2017, 60, 280–297. [Google Scholar] [CrossRef]
  34. Kim, H.; Richardson, S.L. Motion picture impacts on destination images. Ann. Tour. Res. 2003, 30, 216–237. [Google Scholar] [CrossRef]
  35. Niwattanakul, S.; Singthongchai, J.; Naenudorn, E.; Wanapu, S. Using of Jaccard coefficient for keywords similarity. In Proceedings of the International Multiconference of Engineers and Computer Scientists, Hong Kong, China, 13–15 March 2013; Volume 1, pp. 380–384. [Google Scholar]
  36. Gartner, W.C. Image formation process. J. Travel Tour. Mark. 1994, 2, 191–216. [Google Scholar] [CrossRef]
  37. Yan, Q.; Zhou, S.; Wu, S. The influences of tourist s’ emotions on the selection of electronic word of mouth platforms. Tour. Manag. 2018, 66, 348–363. [Google Scholar] [CrossRef]
  38. Banyai, M.; Glover, T.D. Evaluating research methods on travel blogs. J. Travel Res. 2012, 51, 267–277. [Google Scholar] [CrossRef]
  39. O’connor, P. User-generated content and travel: A case study on Tripadvisor.com. In Information and Communication Technologies in Tourism 2008; Springer: Vienna, Austria, 2008; Volume 2008, pp. 47–58. [Google Scholar]
  40. Pan, B.; MacLaurin, T.; Crotts, J.C. Travel blogs and the implications for destination marketing. J. Travel Res. 2007, 46, 35–45. [Google Scholar] [CrossRef] [Green Version]
  41. Echtner, C.M.; Ritchie, J.B. The measurement of destination image: An empirical assessment. J. Travel Res. 1993, 31, 3–13. [Google Scholar] [CrossRef] [Green Version]
  42. Chew, E.Y.T.; Jahari, S.A. Destination image as a mediator between perceived risks and revisit intention: A case of post-disaster Japan. Tour. Manag. 2014, 40, 382–393. [Google Scholar] [CrossRef]
  43. O’leary, S.; Deegan, J. People, pace, place: Qualitative and quantitative images of Ireland as a tourism destination in France. J. Vacat. Mark. 2003, 9, 213–226. [Google Scholar] [CrossRef]
  44. Jia, S. Behind the ratings: Text mining of restaurant customers’ online reviews. Int. J. Mark. Res. 2018, 60, 561–572. [Google Scholar] [CrossRef]
  45. Do Valle, P.O.; Mendes, J.; Guerreiro, M. Residents’ participation in events, events image, and destination image: A correspondence analysis. J. Travel Tour. Mark. 2012, 29, 647–664. [Google Scholar] [CrossRef]
  46. San Martín, H.; Del Bosque, I.A.R. Exploring the cognitive–affective nature of destination image and the role of psychological factors in its formation. Tour. Manag. 2008, 29, 263–277. [Google Scholar] [CrossRef]
  47. Song, H.; Veen, R.; Li, G.; Chen, J. The Hong Kong Tourist Satisfaction Index. Ann. Tour. Res. 2012, 39, 459–479. [Google Scholar] [CrossRef] [Green Version]
  48. Chase, D.R.; Harada, M. Response error in self-reported recreation participation. J. Leis. Res. 1984, 16, 322–329. [Google Scholar] [CrossRef]
  49. Chen, P.J.; Kerstetter, D.L. International students’ image of rural Pennsylvania as a travel destination. J. Travel Res. 1999, 37, 256–266. [Google Scholar] [CrossRef]
  50. Echtner, C.M.; Ritchie, J.B. The meaning and measurement of destination image. J. Tour. Stud. 1991, 2, 2–12. [Google Scholar]
  51. Gupta, V.; Lehal, G.S. A survey of text mining techniques and applications. J. Emerg. Technol. Web Intell. 2009, 1, 60–76. [Google Scholar] [CrossRef] [Green Version]
  52. Meng, F.; Tepanon, Y.; Uysal, M. Measuring tourist satisfaction by attribute and motivation: The case of a nature-based resort. J. Vacat. Mark. 2008, 14, 41–56. [Google Scholar] [CrossRef]
  53. Pike, S.; Ryan, C. Destination positioning analysis through a comparison of cognitive, affective, and conative perceptions. J. Travel Res. 2004, 42, 333–342. [Google Scholar] [CrossRef] [Green Version]
  54. Aizawa, A. An information-theoretic perspective of tf–idf measures. Inf. Process. Manag. 2003, 39, 45–65. [Google Scholar] [CrossRef]
  55. Panagiotakos, D.B.; Pitsavos, C. Interpretation of epidemiological data using multiple correspondence analysis and log-linear models. J. Data Sci. 2004, 2, 75–86. [Google Scholar] [CrossRef] [PubMed]
  56. Baloglu, S. An Empirical Investigation of Determinants of tourist Destination Image; Virginia Polytechnic Institute and State University: Blacksburg, VA, USA, 1996. [Google Scholar]
  57. Hao, X.; Xu, S.; Zhang, X. Barrage participation and feedback in travel reality shows: The effects of media on destination image among Generation Y. J. Destin. Mark. Manag. 2019, 12, 27–36. [Google Scholar] [CrossRef]
  58. Hunter, W.C. Projected destination image: A visual analysis of Seoul. Tour. Geogr. 2012, 14, 419–443. [Google Scholar] [CrossRef]
  59. Parrott, W.G. (Ed.) Emotions in Social Psychology: Essential Readings; Psychology Press: London, UK, 2001. [Google Scholar]
  60. Schultz, R.L.; Zaltman, G.; Burger, P.C. (Eds.) Cases in Marketing Research; Dryden Press: Hinsdale, IL, USA, 1975. [Google Scholar]
  61. Yong, A.G.; Pearce, S. A beginner’s guide to factor analysis: Focusing on exploratory factor analysis. Tutor. Quant. Methods Psychol. 2013, 9, 79–94. [Google Scholar] [CrossRef] [Green Version]
  62. Fabrigar, L.R.; Wegener, D.T. Structural equation modeling. In Applied Multivariate Statistics for the Social Sciences; Routledge: Oxford, UK, 2012; pp. 549–594. [Google Scholar]
  63. Stylianou-Lambert, T. Gazing from home: Cultural tourism and art museums. Ann. Tour. Res. 2011, 38, 403–421. [Google Scholar] [CrossRef]
  64. Hsu, C.H.; Song, H. Projected images of major Chinese outbound destinations. Asia Pac. J. Tour. Res. 2012, 17, 577–593. [Google Scholar] [CrossRef] [Green Version]
  65. Choe, J.Y.J.; Kim, S.S. Effects of tourist s’ local food consumption value on attitude, food destination image, and behavioral intention. Int. J. Hosp. Manag. 2018, 71, 1–10. [Google Scholar] [CrossRef]
  66. James, A.; Ravichandran, S.; Chuang, N.K.; Bolden III, E. Using lifestyle analysis to develop lodging packages for staycation travelers: An exploratory study. J. Qual. Assur. Hosp. Tour. 2017, 18, 387–415. [Google Scholar] [CrossRef]
Figure 1. Research process.
Sustainability 15 05887 g001
Figure 2. Destination city impression and keyword correspondence analysis.
Sustainability 15 05887 g002
Table 1. Distribution of statistical variables of sample data (n = 23,019).
ItemsDescriptionsSample SizePercentage
Traveler fromJapan12555.5%
Malaysia331714.4%
Singapore11,23048.8%
Korea10564.6%
Mainland China12845.6%
Hong Kong422118.3%
Taiwan6562.8%
DestinationsTokyo20288.8%
Seoul18998.2%
Singapore10,93647.5%
Hong Kong653728.4%
Taipei16197.0%
Opinion rolesContributor529523.0%
Senior contributor857837.3%
Top contributor914639.7%
The destination categoriesMuseum15636.8%
Culture525622.8%
Zoo17477.6%
Outdoor520922.6%
Landmark440219.1%
Performance13515.9%
Shopping15416.7%
Activities19508.5%
Rating1 star2511.1%
2 stars5492.4%
3 stars299413.0%
4 stars840036.5%
5 stars10,82547.0%
Total count23,019100%
Table 2. Keyword frequency of different cities.
RankWordTF% CasesTF-IDFHong KongSingaporeTokyoSeoulTaiwan
1view704322.6%4556164151
2walk624720.2%433441122
3great623122.0%410232543
4good572820.1%399353335
5ride419911.7%3908218 1820
6garden402110.1%4004 51121
7people368113.0%32651113699
8enjoy360213.3%31536814716
9nice356613.1%31491215787
10show342710.4%336899 13
11make333512.3%30351514131715
12night326711.3%30881411263331
13experience315711.6%29551810213125
14traveler313611.2%2988161910198
15shop311710.2%3096212121112
16animal30387.6%3408 4
17kid28658.8%30291616322334
18zoo28346.5%3364 7 17
19park27867.6%31181328930
20photo27629.6%2807222422621
21city275510.0%27521920252714
22tour27106.9%31402325 526
23buy25138.4%26992429181628
24top23988.3%25891034313513
25beautiful23899.3%24653026202627
26easy23479.1%24422531242922
27spend23399.2%24273127272229
28museum23166.3%2789 1216
29bus22386.3%26887 24
30love22228.5%23822012161430
31tram21526.0%2632830
32amaze20718.1%2255262230 32
33building20467.1%235733 19204
34interest19977.8%22133423171218
35worth19928.2%21681717232819
36recommend19858.0%21803232282533
37metro18577.0%214329 333411
38crowd18156.8%21172833153210
39fun17346.5%205527 2910
40temple17214.4%2332 8 23
Table 3. Cognitive and affective impression of international travelers.
CategoriesLabelKeywords, Frequency, and Related Articles %
CognitiveAttraction
(34,472, 62%)
zoo (2834, 6.5%), park (2786, 7.6%), museum (2316, 6.3%), building (2046, 7.1%), temple (3062, 4.4%), victoria peak (1340, 3.5%), disney (1253, 2.5%), island (1166, 3.9%), ferry wheel (1038, 2.9%)
Transportation
(15,328, 30.5%)
bus (2238, 6.3%), tram (2152, 7.0%), metro (1860, 6.0%), cable car (1587, 4.2%), line (1491, 4.8%), taxi (876, 3.0%), train (833, 2.8%), boat (771, 2.6%), trail (703, 2.1%), station (425, 1.5%)
Food and Beverage
(10,096, 24.8%)
food (3035, 10.6%), restaurant (2368, 9%), coffee (825, 3%), food court (395, 1.6%), sea food cuisine (332, 1.2%), soft drink (324, 1.1%), food stall (262, 1.0%), ice cream (177, 0.5%), satay (169, 0.7%), coffee shop (164, 0.7%)
Shopping
(8757, 21.5%)
shop (3117, 10.2%), market (1036, 3.2%), store (932, 3.0%), shopping mall (637, 2.4%), orchard road (274, 1.0%), taipei101 (240, 0.8%), souvenir shop (227, 1.0%), night market (226, 0.9%), gift shop (206, 0.7%), Mustafa (124, 0.4%)
Accommodation
(1588, 5.6%)
hotel (1292, 4.6%), marina bay sand hotel (119, 0.5%), cloud dome (110, 0.4%), hostel (28, 0.1%), accommodation (23, 0.1%), hotel concierge (15, 0.1%)
AffectiveLove (5580, 19.3%)love (3215, 8.5%), attract (162, 0.3%)
Joy
(5498, 19.2%)
enjoy (4029, 13.3%), exciting (385, 1.4%), happy (331, 1.0%), hope (216, 0.9%), amusement (105, 0.4%), delight (156, 0.4%)
Surprise
(2863, 11%)
amaze (2322, 6.8%), surprise (498, 1.3%)
Sadness
(1144, 4.6%)
disappoint (750, 1.2%), sad (169, 0.4%), shame (81, 0.3%), suffer (34, 0.1%), hurt (23, 0.1%), isolate (16, 0.1%)
Anger
(277, 1.1%)
complain (103, 0.3%), hate (71, 0.2%), dislike (48, 0.2%)
Fear
(270, 1.1%)
worry (140, 0.6%), fear (63, 0.2%), shock (40, 0.2%)
Table 4. AIO concept words.
Concept of AIORelated Keywords
Activitieswalk, intend, go, visit, join, participate, take, partake, enter, access
InterestsInterest, enjoy, fun, experience, focus, use, try, fascinate
Opinionsrecommend, prefer, feel, see, worth, like, compare, choose, think
Table 5. The number of related AIO sentences from TGC.
AIONumber of Sentences
Activities34,222
Interests16,789
Opinions17,375
Total68,386
Table 6. Lifestyle experience factors.
GroupsLifestyle Related Keywords
(Factor Loadings)
Variation%EigenvaluesNaming
1transportation (0.73), take (0.663), top (0.613), walk (0.445), attraction (0.333), view (0.393), easy (0.335)8.2513.053Comprehensive activities
2food_beverage (0.694), shopping (0.643), fresh (0.53), try (0.304)4.2051.556Food and shopping activities
3go (0.575), amaze (0.551), see (0.524)3.5811.325Exciting experiences
4free (0.636), enter (0.487), accommodation (0.434), use (0.342)3.4521.277Accommodation recommendations
5visit (0.741), worth (0.661), attraction (0.359)3.2961.219Attraction recommendations
6crowd (0.636), queue (0.579), go (0.306)3.1741.175Activities recommendations
7fun (0.576), show (0.507), view (−0.394)3.0381.124Performance recommendations
8recommend (0.536), feel (0.534), atmosphere (0.416)2.9381.087Life recommendations
9great (0.696), experience (0.432)2.9161.079Interesting experiences
10relax (0.637), nice (0.555), walk (0.38)2.81.036Relaxing activities
11beautiful (0.638), wonderful (0.556), enjoy (0.423), easy (0.383)2.7811.029Comfortable experiences
12like (0.698), interest (0.36)2.7441.015Enjoyable experiences
13awesome (0.731), interest (−0.315)2.7171.005Special experiences
Blue represents Activities; Red represents Interests; Purple represents Opinions
Table 7. Destination image and groups eating satisfaction comparison.
(1)(2)(3)(4)(5)(6)(7)(8)(9)(10)(11)(12)(13)F-ValueScheffe Pos Hoc Analysis
Attraction (n = 8171)4.174.244.564.354.164.814.024.514.174.184.23.714.3125.502 (***)1 > 12, 2 > 12, 3 > 1, 3 > 5, 3 > 7, 3 > 9, 3 > 10, 3 > 11, 3 > 12, 4 > 7, 4 > 10, 4 > 12, 5 > 12, 6 > 7, 6 > 12, 8 > 1, 8 > 2, 8 > 5, 8 > 7, 8 > 9, 8 > 10, 8 > 11, 8 > 12, 9 > 12, 10 > 12, 11 > 12, 13 > 12
Transportations (n = 5427)4.184.354.54.364.154.734.084.564.214.214.193.694.3619.78 (***)1 > 12, 2 > 12, 3 > 7, 3 > 12, 4 > 12, 5 > 12, 6 > 12, 7 > 12, 8 > 5, 8 > 10, 8 > 11, 8 > 12, 9 > 12, 10 > 12, 11 > 12, 13 > 12
Shopping
(n = 3001)
4.094.084.464.274.204.894.024.494.004.074.043.864.298.181 (***)8 > 1, 8 > 2, 8 > 7, 8 > 9, 8 > 10, 8 > 11, 8 > 12
Food and beverage
(n = 3954)
4.204.204.54.354.294.784.084.474.094.184.133.744.3411.845 (***)1 > 12, 2 > 12, 3 > 7, 3 > 12, 4 > 7, 4 > 12, 5 > 12, 6 > 12, 8 > 7, 8 > 9, 8 > 10, 8 > 11, 8 > 12, 10 > 12, 11 > 12, 13 > 12
Accommodation
(n = 1250)
3.804.184.634.314.144.833.894.564.074.234.273.884.385.784 (***)3 > 1, 8 > 1, 8 > 7
p < 0.005 ***.
Disclaimer/Publisher’s Note: The statements, opinions and data contained in all publications are solely those of the individual author(s) and contributor(s) and not of MDPI and/or the editor(s). MDPI and/or the editor(s) disclaim responsibility for any injury to people or property resulting from any ideas, methods, instructions or products referred to in the content.

