Article

How VR Technological Features Prompt Tourists’ Visiting Intention: An Integrated Approach

by
Thi Bich Thuy Nguyen
1,
Thi Bich Ngoc Le
1 and
Ngoc Tuan Chau
2,*
1
Faculty of Business Administration, University of Economics, The University of Danang, Danang City 550000, Vietnam
2
Faculty of Statistics and Informatics, University of Economics, The University of Danang, Danang City 550000, Vietnam
*
Author to whom correspondence should be addressed.
Sustainability 2023, 15(6), 4765; https://doi.org/10.3390/su15064765
Submission received: 2 January 2023 / Revised: 28 February 2023 / Accepted: 3 March 2023 / Published: 8 March 2023
(This article belongs to the Collection Advances in Marketing and Managing Tourism Destinations)

Abstract

:
To achieve sustainable tourism, the tourism development authorities have used advanced technologies to promote destinations, attract visitors, and protect the environment. Accordingly, while the available research on tourism technologies indicates that virtual reality (VR) matters in the visit intention of potential tourists, the mechanism of their inner senses when experiencing VR technologies is overlooked. To fill in this void, this study develops a comprehensive conceptual model for investigating the influence of VR technological features on tourists’ minds, and consequently, their destination visit intention. This study integrates the technology acceptance model, stimuli-organism-response model, and flow theory into a unified conceptual model for a comprehensive understanding of tourists’ behavior. By focusing on tourists’ decision-making and behavior processes, this study sheds new light on how VR stimuli (i.e., vividness and interactivity) could translate into tourists’ attitudes and visiting intentions. This conceptual model is then tested and validated using structural equation modeling on survey data collected from 311 VR users after experiencing virtual tours designed for destinations in Vietnam. The findings indicate that virtual tours affect tourists’ psychological well-being, which translates into visiting intention. Based on the results, this study emphasizes the role of VR as a powerful marketing tool to promote a destination. Furthermore, approaches to enhance the effectiveness of VR tours, particularly, for tourism developers, are proposed. This study thus contributes to the literature in the area of VR tourism, contributing both theoretical and practical knowledge.

1. Introduction

As with any destination, the main goals of tourism are economic growth and sustainable development [1]. The sustainable development goals of the United Nations have three main pillars, including economic, social, and environmental [2]. In the digital era, the rapid progress of technologies has supported destinations in increasing the number of visitors and net growth, consequently, achieving the sustainable development route of destinations in terms of economics [3]. In this vein, tourism developers have used the most advanced technology to attract visitors, drive sustainable behavior of visitors, and sustain the destination environment [2].
As a marketing tool to promote destinations, virtual reality (VR) has been creating a revolution in the way users experience destinations [4]. VR can create memorable experiences because of its sensory richness and the power to attract users [5,6]. VR refers to an immersive 3D simulated environment that bestows a flow experience and simulates real situations, allowing users to immerse themselves in various sensory experiences similar to the spatial presence [4,7,8]. Three key elements characterizing VR are visualization, immersion, and interactivity [6]. Accordingly, VR outperforms content delivered via traditional media, such as static images and 2D video [9]. A virtual tour with built-in virtual reality technologies may be a powerful marketing tool for tourism operators because of its low-cost and feasibility.
A virtual tour is a computer-mediated experience of visiting a specific place in a virtual environment without physical travel [4,9,10]. In the tourism context, virtual tours afford users to visit a “seemingly real” destination that may evoke the sense of “telepresence”. Telepresence can positively influence users’ attitudes and increase their intention to visit the real destination [9,11,12]. As a result, VR technology could induce users to immerse themselves in a virtual destination. They may be excited about experiencing VR tours pre-, post-, and during their trips to seek information, experience dangerous or restricted places (i.e., heritage sites, alpine areas), or they may try adventure activities such as bungee jumping or free flying without the actual physical risk. Overcoming the physical barriers, VR could create a virtual world for not only normal people but also the disabled. VR, thus, has immense potential in the various sub-sections of tourism to enrich tourists’ experiences.
Moreover, the tourism industry recognizes traveling as incompatible with the environment [13]. Together with the growth in the tourism industry, the negative environmental impacts lead to the need for sustainable solutions for tourism. Prior studies suggest that innovation in tourism using cutting-edge technologies could help to achieve more sustainable tourism [14,15]. In this regard, adopting VR technology could help tourism developers offer VR tours for tourists with a minimal environmental impact. The replacement of physical visits with VR tours at specific places in a destination could alleviate the burden of crowds while still maintaining a comprehensive experience for tourists during their trip. In addition, to leverage the environmental consciousness of tourists, tourism developers could rely on educational messages regarding environmental protection to justify showing these VR tours. As a result, VR technology could afford sustainable tourism growth from both economic and environmental perspectives.
Furthermore, the tourism industry has been severely impacted by the COVID-19 pandemic. From a medical point of view, the tourism industry would not be sustainable in the event of another pandemic because there is the possibility of spreading the infection via tourism activities. Adopting virtual reality technology could be a suitable solution as there is no risk of infection if tourists can enjoy simulated tours in a virtual space. In such a case, VR technology could enable the tourism industry to remain viable even during an epidemic.
Driven by the rapid trend of VR technology development, recent studies have investigated how virtual tours can change tourists’ attitudes and accelerate their visit intention [16]. Huang et al. (2016) [17], for example, found that web-based destination marketing tools could persuade tourists to visit a destination. Kim et al. (2020) [16], in their VR tourism study, employ an extended SOR framework to explain the users’ behaviors and their visit intentions after experiencing VR tourism. Generally, empirical evidence from various fields of study, such as retailing, entertainment, and education, demonstrates that VR experience leads to positive user behaviors and attitudes [18].
Despite the increasing studies regarding VR in tourism, the current academic literature overlooks the tourists’ decision-making and behavior processes that may clarify how virtual technology stimuli translate into their attitudes and visiting intentions [19]. Yet a theoretically integrated model of behavior has not been comprehensively developed [16]. A recent study on VR in tourism research by Vishwakarma et al. (2020a) [20] demonstrated that only 11 (24%) out of 41 studies had been supported by theory. Moreover, prior studies also demonstrate that separate theories are insufficient to capture the tourist’s behavior in using VR technologies. Lee and Kim (2021) [21], for example, suggested that the original technology acceptance model (TAM) may be limited in explaining recent VR user experiences. As a result, this study aims to develop an integrated model based on the technological features of VR and users’ cognition and emotion flow when using virtual technology. At the same time, TAM, flow theory, and the stimuli-organism-response (SOR) model are employed as underlying theoretical explanations.
Prior research demonstrates that in the virtual reality research realm, TAM, flow theory, and SOR models matter [4,22,23]. However, there is no research in the literature on VR adopting the integrated model of TAM, flow theory, and SOR models [4,22,23]. As a result, this study is one of the pioneers in delving into tourists’ inner-sense mechanism response when experiencing VR technological features based on the above-stated integrated theoretical model. Accordingly, it examines two factors of VR features: vividness and interactivity as stimuli in the SOR framework. Following the prior studies, the two most salient factors, including perceived usefulness and perceived ease of use of TAM [24], as well as perceived enjoyment and perceived immersion of flow theory [20], are the consequence of VR technological experience and the antecedents of satisfaction, behavioral involvement, and visit intention. Consequently, this study analyses the association of VR technological features, satisfaction, behavioral involvement, and visit intention through a comprehensive theoretical framework. The established body of research has demonstrated that the theoretically integrated model of TAM, flow theory, and SOR model has the potential to better understand tourists’ behavioral mechanisms toward VR technological experiences [4,22].
This study thus contributes to VR tourism research by discussing the role of VR technology in promoting destinations and affording sustainable tourism. In this regard, the benefits of VR technology are considered in both economic and environmental aspects. Along these lines, because of the customer-centered growth of the tourism sector, this study investigates their attitudes and behaviors when experiencing VR tours. An integrated theoretical framework has been adopted to examine their decision-making behaviors and response to VR stimuli. Some implications for tourism developers are also suggested based on the findings of this study.

2. Theoretical Background

2.1. Virtual Reality in Tourism

The first study that delved into the conceptualization of VR defined it as the use of a “computer-generated 3D environment—called a ‘virtual environment’ (VE)—that one can navigate and possibly interact with, resulting in real-time simulation of one or more of the user’s five senses” [14]. VR has been used in six principal tourism-related areas, including marketing, planning and management, heritage preservation, entertainment, accessibility, and education [14]. VR and its commercial applications have burgeoned in tourism which has spurred scholars to scrutinize the drivers of success in using VR in this economically significant industry [14].
VR tours are a specific application of VR technology used as a marketing tool for tourism destinations [20]. A VR tour induces higher elaboration of mental imagery about the tourist’s sense of presence, thus influencing their subjective well-being, such as being happy and being satisfied, which consequently translates into visiting intention. Compatible with this argument, prior empirical studies in Hongkong and the UK have specified that most potential tourists have experienced the virtual destination through VR tours before their actual visits [18,22]. In the same vein, Pantano and Corvello (2014) [25] and Li and Chen (2019) [26] also suggested that VR could prompt the decision to travel by enriching the impression of the destination. Although the empirical findings suggest that VR technology can allow tourists to become involved in destinations, the mechanism of this process is still vague. To bridge this research gap, this study, based on the SOR framework, TAM, and flow theory, will investigate tourists’ responses when experiencing VR tours. Specifically, VR tour technological features, including vividness and interactivity, are used as stimuli in the conceptual framework following prior studies [23,27,28].

2.2. Flow Theory

Flow theory posits that flow experience emerges when people immerse themselves in specific activities [29]. Flow is defined as “the state in which people are so involved in an activity that nothing else seems to matter” [29]. Research has employed flow theory in different contexts, namely website atmosphere [30] or using the virtual world [31]. In studies of virtual environments, users report that the flow experience multiplies rapidly, which is extremely significant for VR tourism [22]. Although prior research uses different dimensions when analyzing flow experience [32], research on VR tourism has identified perceived enjoyment and perceived immersion as critical elements of VR users’ senses [20]. Perceived enjoyment is defined as “the extent to which the activity of using a specific system is perceived to be enjoyed in its own right aside from any performance consequence resulting from system use” and perceived immersion refers to “the degree to which a user is isolated from reality” [33].
Flow theory has been one of the salient theoretical frameworks for investigating user behavior in using VR technology [22]. In addition, flow theory is a helpful tool to recognize people’s experiences when navigating a virtual environment [22]. It is recognized that flow offers a compelling reason for explaining users’ attitudes, beliefs, and behavior in the virtual environment [22,34]. For example, in a Second Life virtual context, Huang et al. (2012) [35] reported a significant association between the flow antecedents, VR tourists’ involvement, and visit intention. Huang et al. (2013) [36] also found a significant relationship between the flow experience and VR users’ visit intentions. Because of the recognized importance of the users’ flow state in virtual tourism, this study thus integrates the sense of flow (i.e., perceived enjoyment and perceived immersion) into the VR research framework.

2.3. Technology Acceptance Model

TAM is widely recognized as a model for technology acceptance [20]. The original TAM first introduced by Davis et al. (1989) [37] postulated that perceived usefulness and perceived ease of use matter in explaining people’s acceptance of information technology. Perceived usefulness is defined as “the degree to which a person believes that using a particular system would enhance his or her job performance”, and perceived ease of use is defined as “the degree to which a person believes that using a particular system would be free of effort” [37]. Because the original TAM only focused on the users’ perceptions of technology and intention to use it, subsequent studies have included the extended TAM as their theoretical bedrock when examining the impacts of users’ senses in terms of technological features on users’ behaviors and attitudes [23].
TAM is the most widely adopted model in VR research to help identify the antecedents to VR users’ experiences. Accordingly, when users use VR technology, they seemingly expect to experience subjective well-being, such as being satisfied and happy [22], which then in turn, shapes their behavioral intention. In tourism, TAM is used in different contexts, such as cultural heritage, historic visitor attractions, and wine tourism [4]. For example, the study of Huang et al. (2013) [36] regarding consumers’ travel intentions in the context of 3D virtual worlds demonstrated that perceived usefulness and perceived ease of use matter in destination choice-making. In addition, Yung and Khoo-Lattimore (2019) [6] and Ashfaq et al. (2019) [24] also confirmed that perceived usefulness and perceived ease of use are the two most decisive factors contributing to understanding the intention to use technology. As a result, perceived usefulness and perceived ease of use are two fundamental elements of TAM considered in this study.

2.4. Stimuli Organism Response Framework

The stimuli-organism-response (SOR) framework intends to “describe the individual behavior through the stimuli creating cognitive and emotional states, which, in turn, lead to responses” [38]. The SOR framework has three main parts including stimulus (S), organism (O), and response (R). Grounded in environmental psychology, the SOR framework is dominantly used to understand consumer behavior regarding technology applications in different contexts [4,39]. The SOR framework as a mechanism links inputs (stimulus), processes (organism), and outputs (response) into a sequence [13]. The SOR framework has been used in different contexts such as social media communities, online shopping, and social commerce [40].
There is a growing interest in applying SOR in VR tourism research [26,41]. Accordingly, SOR has been used to explain users’ sense responses to VR stimuli and how users translate them into their attitudes and intentions [18,39,42]. Kim et al. (2021) [39], for example, employed the SOR model as the underlying theoretical framework to investigate how VR experiences could influence users’ attitude changes and their visit intentions. Kim et al. (2020) [16] employed the extended SOR model to clarify the significant impacts of authentic experience of VR on cognitive and affective responses and how these are then transferred to the visit intention of a destination. The SOR framework can be used to investigate the connections among inputs, processes, and outputs in VR tourism [16,41,43]. As a result, it could be a relevant framework in research on VR user behavior regarding VR technological experiences. Accordingly, this study employs SOR as a frame to combine the users’ senses (organism) when experiencing the technological features of VR (stimuli), ultimately, leading to attitude change and visit intention (responses).

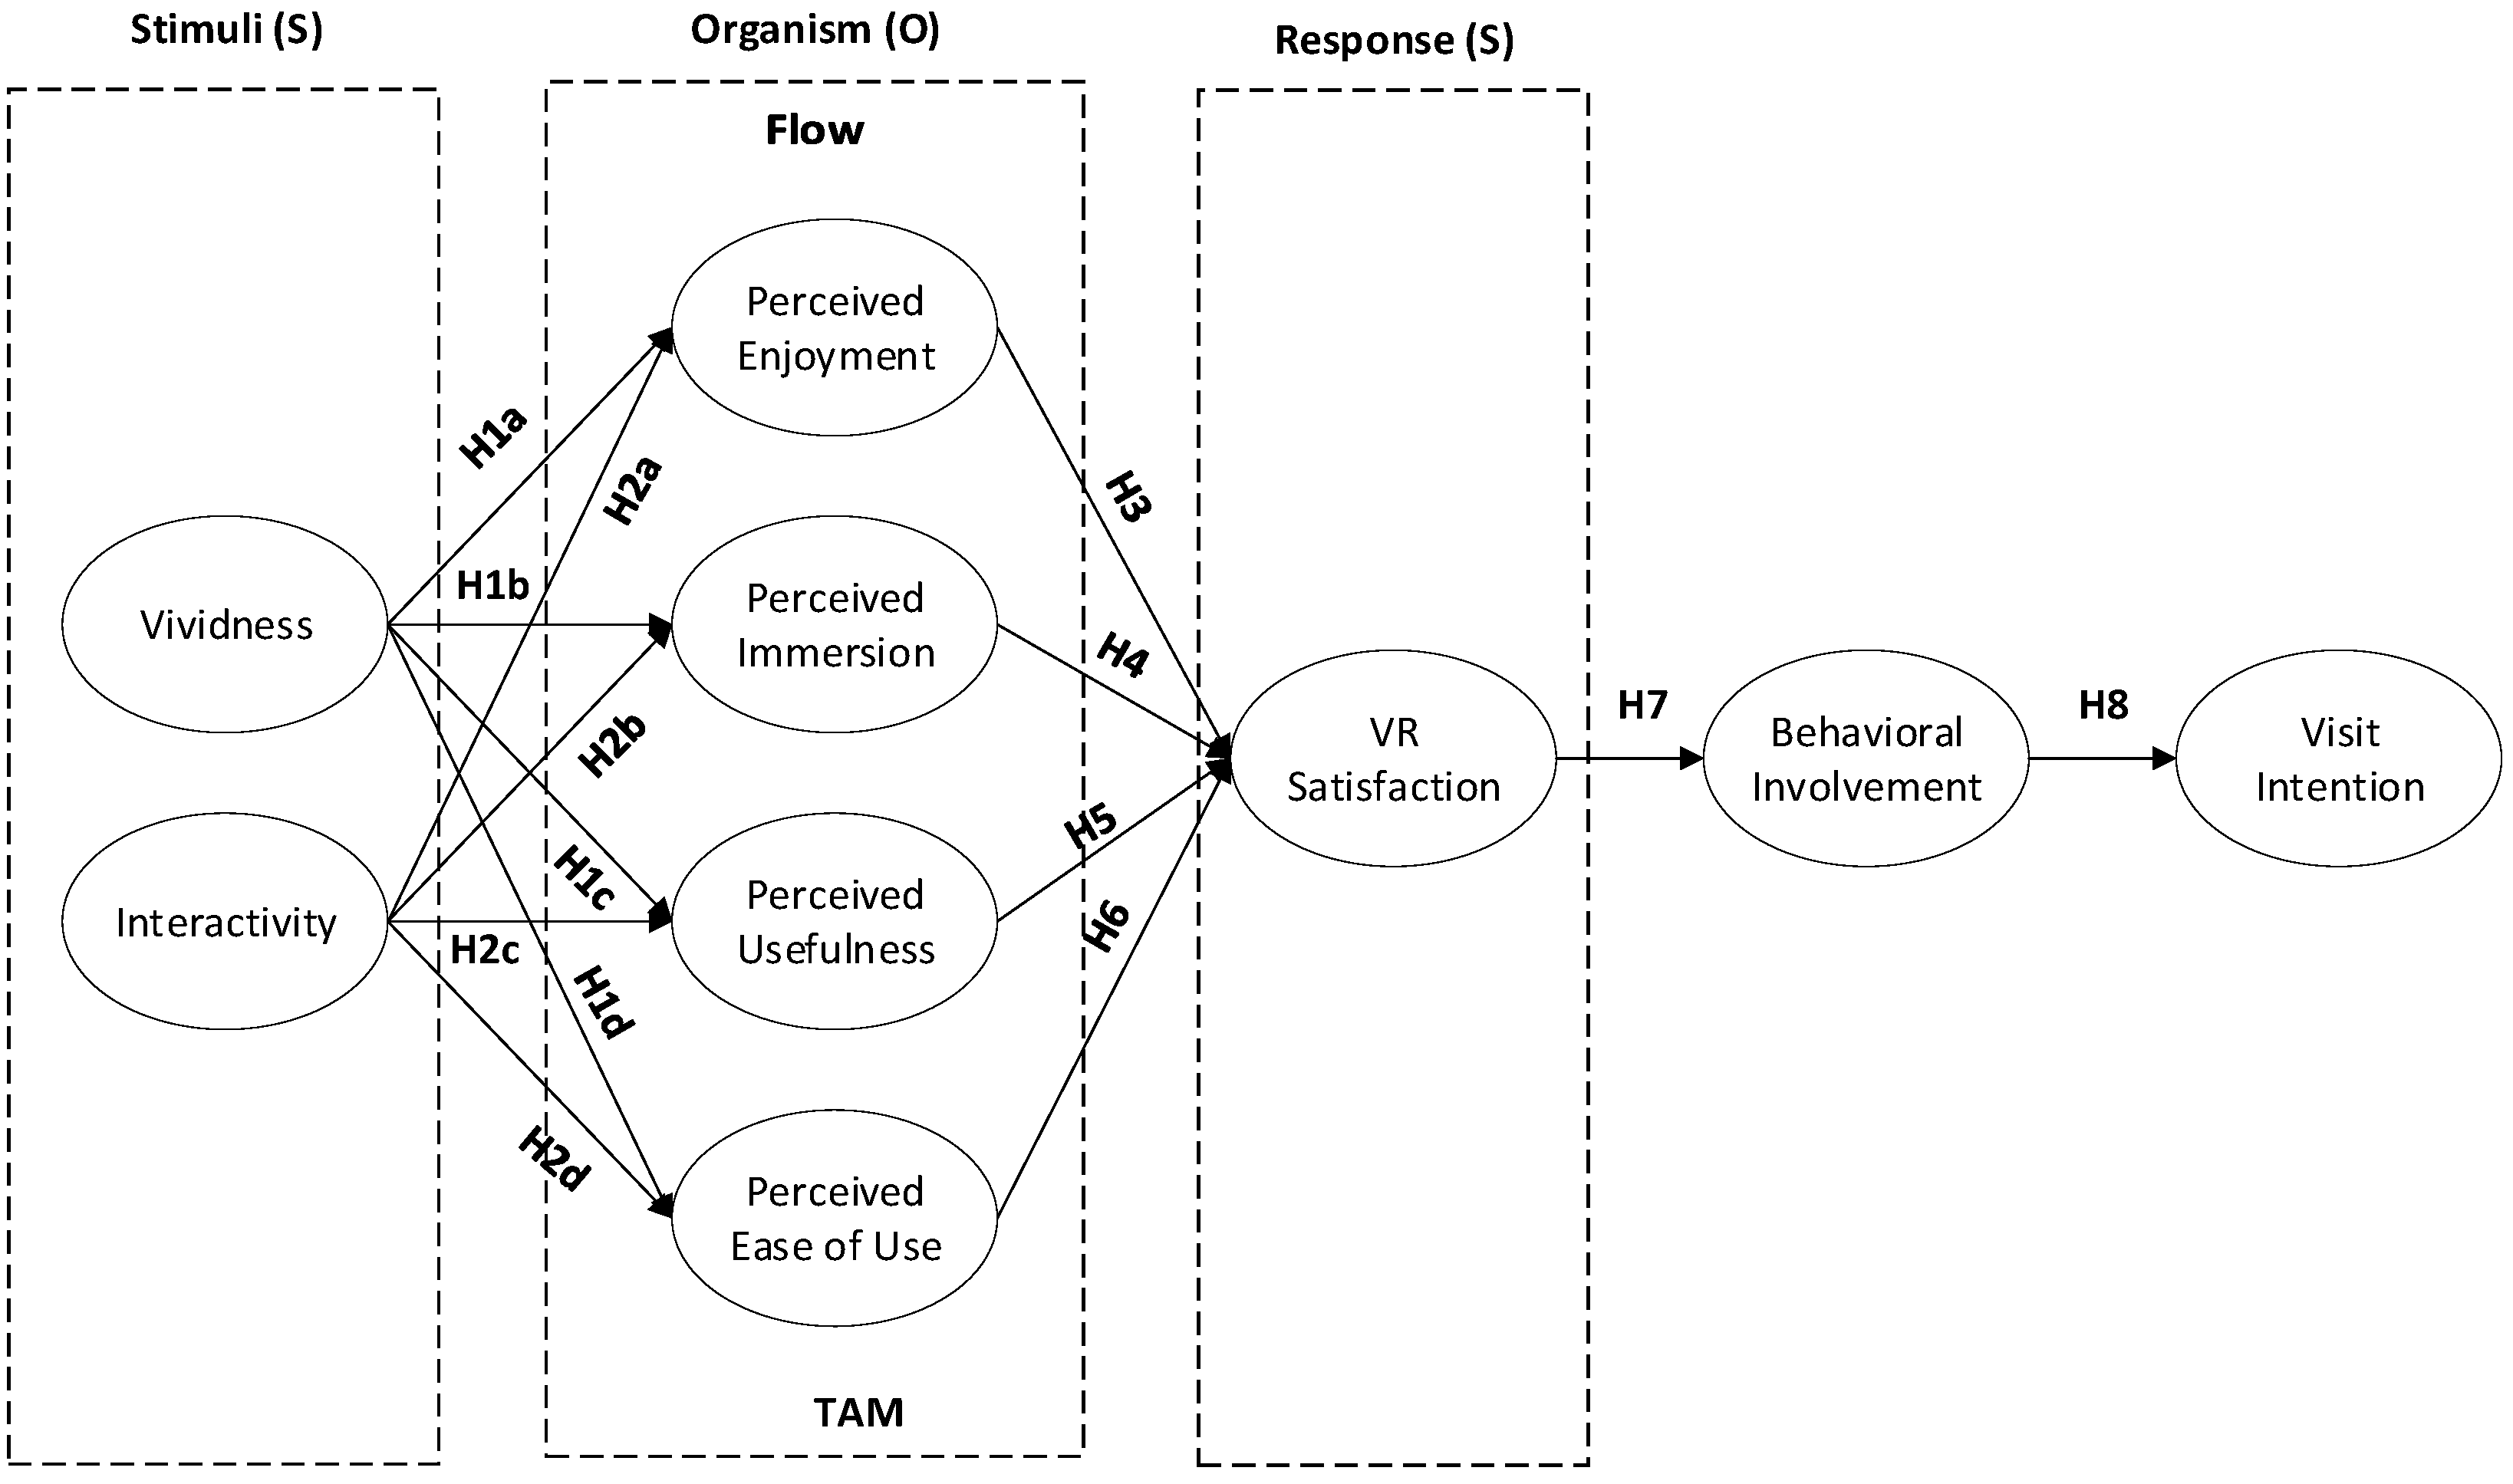
3. Hypotheses Development

3.1. Stimuli of VR Technological Features on Users’ Organism

3.1.1. VR Vividness

VR Vividness and Perceived Enjoyment

Vividness is defined as “the ability of a technology to produce a sensory-rich mediated environment” [27]. In VR contexts, vividness refers to modality richness, which enables users to mentally envision virtual environments. Vividness is recognized as a critical element of VR technology. Accordingly, VR vividness has been used to amplify the depth and breadth of sensory information, consequently, enhancing the users’ satisfaction when experiencing a VR environment [44]. Prior studies have used vividness in different contexts such as sports games [44], and e-commerce [45]. However, few empirical studies have investigated its influence on users’ senses [46].
Due to VR’s vivid nature, VR technology provides an impressive experience to users [47]. For instance, Marriott’s virtual honeymoon to London and Hawaii has incorporated VR to enhance customers’ immersive experiences. The vividness feature as a stimulus of VR technology tends to evoke users’ senses when experiencing the VR tour [20,44,46]. When users participate in VR tours with high vividness, the feeling of enjoyment may arise because they have experienced the virtual destination with the feeling of presence beyond time and space [48,49]. As a result, high vividness may be associated with the greater perceived enjoyment of users during VR tours [3,18]. The findings of prior studies also support the positive relationship between VR vividness and perceived enjoyment [3]. These arguments lead to the following hypothesis:
H1a: 
The vividness of VR positively impacts perceived enjoyment.

VR Vividness and Perceived Immersion

Prior studies suggest that VR vividness could strengthen the feeling of immersion as a result of participating in a panoramic virtual environment [48]. Additionally, perceived immersion could be enhanced with additional stimuli such as a 3D vivid environment [20]. As a result, VR’s vividness with its sensory richness may provoke users’ perceived immersion during their virtual trips. Prior studies also pointed out the significant positive relationship between VR vividness and perceived immersion [3]. These arguments lead to the following hypothesis:
H1b: 
The vividness of VR positively impacts perceived immersion.

VR Vividness and Perceived Usefulness

VR is a useful tool for experiencing adventure destinations in advance to assist potential tourists in making a decision [20]. As to the stimulus of VR vividness to perceived usefulness, prior studies demonstrated the positive relationship between vividness and information access [47], which is related to the individual acceptance of information technology. VR, as an advanced technology in tourism marketing, can provide richer information for potential tourists about destinations. In the high VR vividness condition, potential tourists can have a visualized experience of the destination before a visit. They do not have to only rely on descriptive information such as tourism magazines, social media posts, or travel agents. As a result, potential tourists may feel VR is more useful for planning a trip, resulting in higher perceived usefulness when using VR. These arguments lead to the following hypothesis:
H1c: 
The vividness of VR positively impacts perceived usefulness.

VR Vividness and Perceived Ease of Use

Although VR tourism employs advanced technology to construct virtual environments, the device components of VR that afford users a multi-sensory virtual environment are quite user-friendly. Accordingly, users can become immersed in a virtual environment through a head mount display (HMD). They place their smartphone in a VR box and have the feeling of “being there” at the destination [20] or experience on-site travel through the VR 360 application “one touch to virtual destination” [47]. As a result, they may feel “ease of use” when experiencing VR.
In addition, the retail price of HDM, one of the main barriers to VR technology, has drastically reduced [47]. Due to the convenience of using VR, the perceived ease of use may increase with the high vividness of VR. Compared with media with low vividness, VR technology with high vividness exerts stronger influences on user experience [31]. Existing research also examined the effects of VR vividness on user behavior across various contexts and suggested that vividness matters in shaping user behavior in terms of technological acceptance [50]. These arguments lead to the following hypothesis:
H1d: 
The vividness of VR positively impacts the perceived ease of use.

3.1.2. Interactivity

VR Interactivity and Perceived Enjoyment

Interactivity refers to the extent to which users can participate in modifying the form and content of a mediated environment in real-time [27]. In the VR context, interactivity refers to modality interactivity, which allows users to easily interact and become involved with the content [51,52,53]. The features of interactivity include (1) the speed of interaction between users and the system, (2) the similarity in solving the contents in the physical and mediated environment, and (3) the range of different ways to modify the content [44].
In tourism, VR developers have employed VR interactivity to strengthen the users’ senses when experiencing VR tours. Accordingly, VR tours with superior sensory features may offer dynamic displays and functions that may tie users to immersion senses in the virtual environment [44,54]. Additionally, VR is an autotelic experience oriented toward attaining subjective well-being. Therefore, VR interactivity can lead to users’ enjoyment by triggering a sense of engagement in the virtual environment [3,55]. Prior studies insist that the high interactivity induces a greater significant perceived enjoyment of users [3,56,57]. Accordingly, it is expected that the higher the VR interactivity, the greater the perceived enjoyment of users. These arguments lead to the following hypothesis:
H2a: 
The interactivity of VR positively impacts perceived enjoyment.

VR Interactivity and Perceived Immersion

Prior research indicates that interactive components are one of the key elements of design features that enable users to immerse themselves in the virtual experience [3,52]. Participating in VR can make users feel absorbed in and engrossed by VR features such as interactivity [52]. VR interactivity allows users to become involved and may tie them into the destination content [46]. Prior findings also showed a positive relationship between VR interactivity and perceived immersion [3]. Based on these arguments, the following hypothesis is suggested:
H2b: 
The interactivity of VR positively impacts perceived immersion.

VR Interactivity and Perceived Usefulness

VR interactivity helps users gain a greater ability to navigate and modify the virtual environment [49]. By enhancing the response time to the changes in visual information, VR technical interactivity offers more dynamic sensory information to users than static videos [31]. Accordingly, interactivity may offer users an environment similar to the real destination, consequently, enabling them to visit online without the physical effort of actually visiting [58]. Yung and Khoo-Lattimore (2019) [59] in their study about destination image, found that VR is a useful tool to help potential tourists reduce their perception of destination choice risk. Prior studies have also pointed out the positive relationship between interactivity and perceived usefulness [58]. This study, therefore, suggests that VR interactivity has positive effects on users’ perceived usefulness. These arguments lead to the following hypothesis:
H2c: 
The interactivity of VR positively impacts perceived usefulness.

VR Interactivity and Perceived Ease of Use

VR interactivity enables users to collect sensory information with minimum effort [31]. With technological advancement, VR provides easy access to potential tourists [36,45]. VR interactivity features such as transparent navigational structures, and user-friendly and update-to-date information may influence users’ perceptions of the ease of experiencing a virtual environment [59]. Users may feel “ease of use” with VR if they can easily navigate and control the VR interfaces. As a result, the high interactivity may positively impact users’ perceived ease of use. Consistent with these arguments, prior studies also found evidence of the significant effect of interactivity on perceived ease of use in various contexts such as online shopping [58,60] and online learning [61]. Therefore, this study assumes that the interactivity feature of VR positively influences the perceived ease of use of the VR experience. These arguments lead to the following hypothesis:
H2d: 
The interactivity of VR positively impacts perceived ease of use.

3.2. VR Satisfaction as the Consequential Response to Users’ Organism

In VR settings, satisfaction refers to users’ satisfaction with the VR technology experience. People desire satisfaction when they adopt VR technology [16]. Satisfaction is one of the main decisive elements that prompt use of VR [22]. In VR tourism, users’ satisfaction and enjoyment are derived from consumption, as well as a positive evaluation given of the experience [62]. In this study, satisfaction is considered as the users’ response to the stimuli of VR technology via their sense organism. Therefore, this section examines the users’ satisfaction as a consequence of the stimulus-organism-response (SOR) relationships.

3.2.1. Relationship between Representative Factors of Flow and Satisfaction

In VR research, flow experience is considered the central concept in computer-mediated environments [44]. Flow experience has been used to explain VR users’ responses in terms of their attitude and behavioral intention [31,44,63,64]. Prior studies also have demonstrated that flow experience significantly predicts users’ satisfaction in online environments [44]. Chang and Zhu (2012) [65], for instance, have shown the significant effect of flow experience on user satisfaction in social networking sites. Gao and Bai (2014) [30] also found a significant influence of flow on user satisfaction regarding travel agency website experience. In short, the existing research supposes a significant relationship between flow experience and user satisfaction. As a result, building on the SOR framework, this study suggests that the VR features have a significant impact on the flow experience, thereby affecting user satisfaction. In this study, flow experience is defined as perceived enjoyment and perceived immersion.

Perceived Enjoyment

Perceived enjoyment is defined as “the extent to which the activity of using a specific system is perceived to be enjoyed in its own right aside from any performance consequence resulting from system use” [33]. In VR tourism, perceived enjoyment could be considered as a state of users when present in a VR destination [48,66]. Prior research suggested that VR users may evaluate their satisfaction by comparing VR performance with their expectations [50,67]. Accordingly, VR technology with its outstanding performance tends to provoke the user’s enjoyment, which may lead to their satisfaction. Research findings have also indicated that perceived enjoyment has a critical role in VR tourism, resulting in the intention to visit attractions [18,48]. As a result, a positive influence of perceived enjoyment on user satisfaction is expected. These arguments lead to the following hypothesis:
H3: 
Perceived enjoyment has a positive effect on the users’ VR satisfaction.

Perceived Immersion

Perceived immersion refers to “the degree to which a user is isolated from reality” [33]. In the VR context, perceived immersion refers to “an individual’s ability to engage in a virtual environment fully” [68]. Immersion is a specific feature of VR technology that leads to in-depth knowledge about the destination [48,69]. Prior studies suggested that the feeling of immersion significantly influences users’ behavior and their visit intention [14,20,70]. When users are immersed in the virtual environment, they are surrounded by multi-sensory dimensions and many details in their experience [48], and as a result, pleasure sensations may occur. Hudson et al. (2019) [71], for instance, identify a significant relationship between immersion and VR user satisfaction. Grounded in the argument above, this research considers perceived immersion as the decisive factor in predicting users’ satisfaction in the VR tourism context. Those arguments lead to the following hypothesis:
H4: 
Perceived immersion has a positive effect on the users’ VR satisfaction.

3.2.2. Relationship between TAM Factors and Satisfaction

Perceived usefulness and perceived ease of use are fundamental elements in TAM in predicting technological acceptance, and consequently, user behavior [17,20,72]. In the VR context, perceived usefulness and perceived ease of use are considered extrinsic motivations that determine users’ satisfaction in terms of using the information system [73]. Prior studies identify the positive influence of perceived usefulness and perceived ease of use on customers’ satisfaction and intention to use in diverse contexts such as mobile websites [74], 3G value-added services [75], or mobile shopping [66]. In tourism settings, perceived usefulness and perceived ease of use are also considered to be the dominant factors in predicting users’ behavioral intention in the context of VR adoption [17,26]. As a result, this study considers these factors as antecedents of users’ satisfaction in the conceptual framework.

Perceived Usefulness

Perceived usefulness is defined as “the degree to which a person believes that a particular system that he or she is using would enhance his or her job performance” [37]. Perceived usefulness attributes in VR tourism support users in collecting sensory information about the destination and assist them in the destination choice-making process. Research has employed perceived usefulness to evaluate the users’ behavior when experiencing technologies in different contexts. Vishwakarma et al. (2020a) [20], for example, used perceived usefulness to examine tourists’ intention to adopt VR. Huang et al. (2016) [17] also employed perceived usefulness in the research of 3D virtual tourism sites. The findings of prior studies confirm the significant relationship between the usefulness of VR and users’ behavior regarding technological acceptance [47,72,76,77]. Lee (2020) [47], for example, identified that VR enables users to evaluate the stimulating experience more accurately, which leads to a positive impact on satisfaction with VR. These arguments lead to the following hypothesis:
H5: 
Perceived usefulness has a positive effect on the users’ VR satisfaction.

Perceived Ease of Use

Perceived ease of use is defined as “the degree to which a person believes that using a particular system would be free of effort” [37]. In the TAM, perceived ease of use refers to both usability and usage behavior [33]. Prior research used perceived ease of use to evaluate peoples’ perception and acceptance of technology [26]. Huang et al. (2013) [36], for example, used perceived ease of use to investigate the applicability of 3D virtual worlds. Li and Chen (2019) [26] employed perceived ease of use to test the users’ travel intention when experiencing VR.
In the tourism sector, VR is an advanced technology that can offer clear content about a destination to users. Furthermore, VR technology has become more complete and friendly so that users can easily utilize it [20]. As a result, users’ satisfaction may be elevated together with the increase in the perceived ease of use of VR. Accordingly, the impact of perceived ease of use on users’ satisfaction is expected to be positively significant. Existing research findings also point out the positive effect of perceived ease of use on users’ attitudes toward experiencing virtual technology [78,79]. Those arguments lead to the following hypothesis:
H6: 
Perceived ease of use has a positive effect on the users’ VR satisfaction.

3.3. Relationship between VR Satisfaction and Behavioral Involvement

Behavioral involvement refers to the level of people’s thoughts and interests stimulated by a particular motion or experience [73,80]. The involvement concept plays a predominant role in the tourism context. In this study, behavioral involvement is considered from the VR-based marketing perspective. Accordingly, the determinant of behavioral involvement originates from the users’ satisfaction with VR technology features. When experiencing the VR environment, the high level of VR satisfaction can arouse the users’ intention to seek more information about the destination [73]. As a result, satisfaction with the VR may prompt users to become involved in the actual destination that VR technology recreates [47].
Prior studies propose that satisfaction may have a direct impact on the formation of behavioral involvement [47,50,73]. Rahimizhian et al. (2020) [73], for instance, indicated a significant positive relationship between VR satisfaction and behavioral involvement. Marasco et al. (2018) [12] also found evidence of the relationship between satisfactory VR experience and visit intention. Since VR is a technological intervention with outstanding performance in terms of vividness and interactivity characteristics [48], it is expected that the high levels of VR users’ satisfaction result in their behavioral involvement. These arguments lead to the following hypothesis:
H7: 
VR satisfaction has a positive effect on behavioral involvement.

3.4. Relationship between Behavioral Involvement and Visit Intention

Behavioral intention refers to “the degree to which a person has formulated conscious plans to perform or not perform some specified future behavior” [81]. In the tourism context, visiting behavioral intention corresponds to the plan to visit, intention to visit, and willingness to invest money and time in tourism products or services [16,82,83]. When people engage more with the virtual destination that VR creates, they may consider spending time and effort visiting the actual destination [73,80]. Prior studies demonstrate that users’ strong involvement with the virtual destination may enhance their interest in the destination and eventually leads to visit intention [73,84]. Rahimizhian et al. (2020) [73], for example, found evidence of the positive influence of behavioral involvement on visit intention in the tourism context. As a result, as supported by previous research, the behavioral involvement toward a tourism destination because of the VR experience can be a predictor of visitation intention to the destination. These arguments lead to the following hypothesis:
H8: 
Behavioral involvement has a positive effect on the visiting intention.
The overall theoretical integrated conceptual framework is presented in Figure 1. Accordingly, the flow theory and TAM are integrated into the SOR framework to investigate the formation mechanism of potential tourist visit intention. The proposed conceptual framework may effectively enhance the validity of the underlying theoretical mechanism regarding tourists’ behavior when experiencing VR technology.

4. Research Methodology

This study investigates the influence of VR technological features on tourists’ minds and their consequent destination visit intention. An integrated conceptual framework is developed based on an in-depth review of the literature. The validity of this framework is then assessed through structural equation modelling (SEM) using data obtained from a survey of VR technology users in Vietnam. This study uses multiple items to measure each variable. A five-point Likert type scale is adopted in which the value ‘1’ represents ‘strongly disagree’, and the value ‘5’ represents ‘strongly agree’. Table 1 presents the items used in the questionnaire design.
Before administering the preliminary survey instrument, it underwent a pre-test to ensure its content validity, comprehensiveness, and clarity. The pre-test involved a panel of experts including five VR users and three experienced researchers in technology adoption. The pre-test suggested minor language and terminology improvement to make the survey instrument more user-friendly for VR users. After refinement, the survey instrument was pilot-tested on a sample of twenty-five VR users to confirm the reliability of the measurement scale. Based on the feedback, some minor adjustments were made.
From July to September 2022, an online self-administered survey was carried out in Vietnam. The survey questionnaire was distributed to individuals who had experienced VR through various sources, including https://vr360.danangfantasticity.com/ and other VR tours in Vietnam. A total of 343 responses were obtained. A data cleaning and examination process was performed to address issues such as missing values, outliers, and normality. As a result, thirty-two responses with unanswered questions, missing data, and outliers were excluded. A final dataset comprising 311 valid responses was used for statistical analysis. Table 2 provides an overview of the survey respondents’ characteristics.

5. Data Analysis Results

The data analysis involved a three-step approach, namely, reliability and validity assessment, measurement model analysis, and structural model analysis [85]. Firstly, the measurement items were subjected to factorial validity testing to evaluate their relevance, assessment, and interpretation. The exploratory factor analysis (EFA) utilized the maximum likelihood method and promax rotation method. The minimum eigenvalue of 1 was selected for factor extraction, and a factor loading of 0.5 was utilized for greater precision. The KMO value was 0.84, indicating support for the EFA, with a significant BTOS value of less than 0.05. Single item factors and items with loading values below 0.5, as well as items with cross-loaded values, were discarded. The initial set of 34 items was loaded into nine factors, including behavioral involvement, perceived enjoyment, interactivity, perceived ease of use, satisfaction, perceived immersion, perceived usefulness, and vividness. Table 3 displays the EFA results for these items.
Since each construct in the conceptual model was measured by multiple items, the internal reliability needed to be assessed for internal consistency [86]. Cronbach’s Alpha (α) coefficient was employed to evaluate the internal consistency of the nine retained factors, as displayed in Table 3. The coefficient values ranged from 0.805 for Vividness to 0.933 for Behavioral Involvement and Perceived Enjoyment, indicating satisfactory results for the reliability test of all constructs. The retained constructs were then evaluated for convergent validity, which involved (a) factor loading of all items, (b) construct reliability, and (c) average variance extracted (AVE). Standardized factor loading (SFL) of at least 0.6 for each observed item was deemed significant. A construct reliability (CR) value above 0.65 was considered acceptable, and an AVE of 0.5 or higher was deemed adequate [87]. The EFA results in Table 3 demonstrated that the item reliability of each construct in the final measurement model had acceptable values, and all constructs met the CR criterion. Furthermore, the AVE for each construct exceeded 0.5, indicating adequate convergent validity.
Discriminant validity was also assessed for all constructs. To achieve satisfactory discriminant validity, the square roots of the AVE for each construct needed to exceed the correlation coefficient between that construct and other constructs [87]. Table 4 presents the correlation coefficients between the constructs, with the square root of the AVE on the diagonal. The results indicated that all correlation coefficients were below 0.9, and the square roots of diagonal AVE exceeded the correlation coefficients between a construct and other constructs. This demonstrated that acceptable discriminant validity between the constructs was achieved [85].
A confirmatory factor analysis was conducted as the second step of the data analysis process. The goodness of fit (GOF) of the measurement model was evaluated to determine how well the model fit the data, using various model fit indices. The results of the goodness of fit indices are presented in Table 5. The normalized chi-square value (χ2/df) is 1.082, which is less than 3, indicating an acceptable model fit. The GFI and AGFI values are 0.897 and 0.878 respectively, exceeding the recommended cut-off values of 0.85 and 0.8, respectively. The TLI and CFI values are 0.953 and 0.958, respectively, which are higher than the recommended cut-off value of 0.9. The RMSEA and SRMR values are 0.016 and 0.072, respectively, which are less than the recommended cut-off value of 0.08. Finally, the PClose value is 0.982, exceeding the recommended cut-off value of 0.05. Based on these results, it can be concluded that the measurement model fits the data well.
In the third step, SEM was used to test the research hypotheses. The results of the SEM analysis, which are presented in Table 6, reveal that ten out of the fourteen hypotheses, including H1d, H2a, H2b, H2d, H3, H4, H5, H6, H7, and H8, were statistically significant based on their path coefficients and p-values. There was, however, insufficient evidence to support hypotheses H1a, H1b, H1c, and H2c.

6. Discussion of the Findings

This study develops an integrated conceptual framework to investigate the influence of VR technological features on tourists’ behavior and visit intention. The results partially support our hypotheses regarding the users’ response when experiencing VR technologies. Generally, the results reveal that VR features can function as stimuli to affect users’ behaviors and attitudes, and as a result, the proposed theoretical framework in this study has value. Particularly, among the fourteen theoretical hypotheses, ten were supported (Hypotheses 1d, 2a, 2b, 2d, and Hypotheses 3–8). Consistent with the prior study of Rahimizhian et al. (2020) [73], the findings imply that in the VR tourism context, factors of flow such as perceived immersion and perceived enjoyment, and factors of TAM such as perceived usefulness and perceived ease of use are all the antecedents to VR satisfaction, supporting hypotheses H3, H4, and hypotheses H5, H6, respectively. VR satisfaction in turn prompts users’ engagement in their destination and their visit intention, which supports hypothesis H7 and hypothesis H8. Those findings suggest that VR technology could be a useful marketing tool in tourism to trigger tourists’ visit intention [12]. Accordingly, tourists react to the seemingly authentic experience of VR as a natural human response via the complicated mechanism of their perception. Specifically, this study delves into the sentiment flow of users when experiencing VR. The results reveal that the VR features can lead to users’ perceived immersion and perceived enjoyment when they experience a virtual destination more intuitively. In addition, from the users’ perception of technology acceptance, VR features can also influence perceived usefulness and perceived ease of use. However, in this study, the degree of impact of each VR feature on users’ perceptions was dissimilar. The vividness of VR positively influences users’ perceived ease of use, whereas the interactivity of VR positively influences users’ perceived immersion, perceived enjoyment, and perceived ease of use. Accordingly, interactivity is the most influential determinant of the VR users’ sentiment flow. The results, therefore, confirm the importance of VR features in users’ perception regarding VR adoption.
In contrast with our hypotheses and incompatible with the findings of prior studies of Cui et al. (2019) [88], Lee (2020) [47], and Tussyadiah et al. (2018) [18], our results showed that vividness does not significantly influence perceived immersion, perceived enjoyment, and perceived usefulness. The possible explanation for this is that although VR could arouse users’ sentiments, the non-immersive VR experience does not meet the users’ expectations in terms of the complete immersion experience in the virtual environment [12]. Moreover, the VR content could be a critical facet of VR that influence users’ emotional behavior [3]. The sparse content of VR thus may not meet the users’ expectations about the targeted virtual destination. As a result, a non-significant relationship between VR vividness and PI was observed. Similarly, a non-significant relationship between VR vividness and perceived enjoyment could be explained in the same way. Moreover, both VR vividness and interactivity did not significantly influence perceived usefulness, which demonstrates the limitations of VR technology for tourists and the utility of VR.
Because of the diffusion of digital technologies in the tourism industry, VR could be a powerful marketing tool for promoting destinations. Tourists may consider VR as a suitable channel for shaping their choice of journey destination. To leverage the effectiveness of VR, tourism marketers should pay attention to upgrading the quality of VR functions such as vividness and interactivity. In this study, interactivity has a positive influence on perceived enjoyment, perceived immersion, and perceived ease of use, suggesting that interactivity should be well integrated into VR to enhance users’ experience and their visit intention. Furthermore, these research findings show non-significant relationships between VR vividness and perceived enjoyment, perceived immersion, and perceived usefulness, which has some implications for building VR programs for destinations. This study, therefore, has several important contributions and implications that might be useful for related stakeholders in applying VR technologies in promoting the visit intention for destinations.

7. Contributions, Implications, and Conclusions

7.1. Theoretical Contribution

VR is one of the novel marketing tools in the tourism domain. There are, however, limited studies that investigate the mechanisms of the effect of VR on tourists’ behavior and their visit intention. This study attempts to fill that void by employing an integrated conceptual framework to better explain the users’ behavior toward VR technology in the tourism context. This research contributes to the extant literature in several ways. First, this research is based on theories to support the proposed argument regarding the mechanism of tourists’ response to VR stimuli that is criticized in prior studies of Vishwakarma et al. (2020) [20]. Second, the dominant studies in this area have adopted the single-model TAM as the theoretical background for VR adoption despite its shortcomings in some contexts [20]. For instance, Rahimizhian et al. (2020) [73] have investigated the link between VR technologies and VR satisfaction, behavioral involvement, and visit intention by extending the TAM (perceived enjoyment, perceived usefulness, perceived ease of use, and perceived autonomy). These studies, however, have not considered other aspects of users’ perception in their research framework, which may lead to a deficiency in theoretical explanation. By integrating the SOR, flow theory, and TAM, this study, therefore, fully captures the user behavior and intention formation in VR adoption. The combination of the SOR, flow theory, and TAM models results in a better understanding of VR users’ emotional involvement in VR adoption and application. Third, the research findings identify that perceived immersion, perceived enjoyment, perceived usefulness, and perceived ease of use are all significant in the relationship with VR satisfaction. These results indicate that the VR users’ perception toward emotional attitude and technological function are essential factors in shaping VR users’ behavior. The significant relationship between behavioral involvement and visit intention also confirms the relevance of psychological aspects to tourists’ decision making, which is consistent with the findings of prior studies [17]. This study, therefore, enriches the literature regarding the behavior of VR users.

7.2. Practical Implications

The findings of this study have some practical implications for tourism development authorities and tourism marketers. The findings indicated a significant relationship between VR satisfaction and behavioral involvement, as well as behavioral involvement and visit intention. In this respect, VR tours, rather than advanced technology, should be a vital factor in a marketing strategy to attract visitors. Accordingly, tourism developers should consider VR as an efficient marketing tool to boost the destination visit intention, thereby contributing to the sustainable economic development of the destination. The findings also demonstrated that behavioral involvement influences visit intention significantly; therefore, tourism developers should attempt to create VR tours that could induce visitors to engage more. High-quality VR tours may enable tourists to spend more time and effort in information search and enhance their positive attitude toward the actual visit.
However, the findings of this study have shown non-significant relationships between VR vividness and perceived enjoyment, perceived immersion, and perceived usefulness, as well as a non-significant relationship between VR interactivity and perceived usefulness. These findings imply that there are inefficiencies in VR tours in terms of their immersive effects to arouse the VR users’ senses. In this regard, tourism development authorities should pay attention to upgrading VR features such as vividness and interactivity to make VR more conducive to enticing tourists, and consequently, their satisfaction. To do so, tourism development authorities should seek the involvement of related stakeholders when designing the VR programs. They should integrate the distinguishing features of the destination to make VR more useful for potential tourists. For example, in Danang city, tourism actors could include the local culture, guidelines for hot spots, or travel advisories in VR content to enrich the virtual travel itinerary. As a result, tourists could easily identify places to visit and activities in which to become involved. In addition, the budget for VR tours program should focus on enhancing their effectiveness. For instance, tourism developers in Vietnam should consider investing more in infrastructure such as VR station tours in each targeted market (e.g., China, the US, or Korea) to diffuse information about places and attract tourists. They also could cooperate with famous brands or KOLs (key opinion leaders) in social media to attract more attention from potential tourists.
The sustainable development of destinations is another facet that tourism developers need to consider when creating VR programs. In terms of economics, tourism developers should pay attention to optimizing VR programs that could minimize the time and effort of users when seeking information. Users tend to become involved in VR destinations and choose to visit the real destination when satisfied with VR. This ultimately increases the economic growth of the destination. In addition, VR should be designed to enable tourists to explore places that restrict direct visits to protect the environment, for example, nature reserves or cultural heritage sites [3]. This can increase the visitor’s environmental consciousness when visiting the destination [89]. These arguments highlight the important role of VR in increasing tourism promotion programs and enhancing the sustainable development of destinations.

7.3. Conclusions

VR technology has opened new horizons in sustainable tourism. Accordingly, VR could be a useful tool to promote destinations by prompting tourists’ visiting intention. Adopting VR technology in a tour enriches the tourists’ experience because of its distinct advantages compared with traditional tourism tours. Accordingly, the findings of this study confirm the significant effects of VR stimuli on tourists’ minds and, consequently, their visiting intention. As a result, VR tours should be considered a powerful marketing tool to promote destinations as well as to balance the economic and environmental benefits. Some theoretical and practical contributions based on these findings have been discussed.
Notwithstanding, this research has some limitations that are a potential focus for future studies. First, different users may have distinct interests regarding VR technology. As a result, future research should examine the influence of personal characteristics such as socio-demographics or personal traits to clarify the different perceptions of VR users. Second, the VR vividness feature does not come into play with VR users’ attitudes due to the non-immersive or semi-immersive VR experiences of respondents in this study. As a result, future studies should consider using fully immersive VR technologies to explore VR influences on VR users’ behaviors and their visit intention. Third, measuring flow is a topic of debate in various studies due to its complicated characteristics [90]. Accordingly, as the role of flow differs for research purposes, the sub-factors of flow are inconsistent. Consequently, future studies could consider other aspects of flow to better capture the VR users’ behaviors. Fourth, the statistical analysis relies on a random sample of respondents completing online surveys. As a result, there is a limit to the generalizability of the results of this study. Future studies could consider using other appropriate methods to collect a more diverse respondent sample to fully capture the VR users’ behaviors beyond boundaries, race, or generations. Moreover, regarding the dominance of young participants in our research sample, prior findings have shown that younger people are more likely interested in VR technology [18]. Studies also identify that younger VR users are skillful at using digital technology [91]. Thus, young participants represent a group of people who are highly likely to experience and be influenced by VR. Additionally, our research framework is empirically tested in Vietnam, where younger people usually use new technologies to organize the tourism travel of their families. Thus, although the age of participants could be a limitation of our research, a similar concern has been addressed in prior studies [18] by appropriate selection of participants. Finally, future studies could incorporate qualitative research to obtain a deeper understanding of users’ behaviors in shaping visit intention.

Author Contributions

Conceptualization, T.B.T.N.; Methodology, N.T.C.; Formal analysis, T.B.N.L.; Writing—original draft, N.T.C.; Writing—review & editing, T.B.N.L. All authors have read and agreed to the published version of the manuscript.

Funding

This research is funded by Funds for Science and Technology Development of the University of Danang under project number B2019-DN04-31.

Institutional Review Board Statement

The study was conducted in accordance with the Declaration of Helsinki, and approved by the Ethics Committee of Science and Technology Development Department—The University of Danang, Vietnam (Approval code 75/HD-KHCN-2019, Approval date: 30 March 2020).

Informed Consent Statement

Informed consent was obtained from all subjects involved in the study.

Data Availability Statement

Not applicable.

Conflicts of Interest

The authors declare no conflict of interest. The funders had no role in the design of the study; in the collection, analyses, or interpretation of data; in the writing of the manuscript; or in the decision to publish the results.

References

  1. Carmen, I.M.; Ciochina, I. Tourism brand-the premise of a positive image for a tourist destination. Study case: Romania. Int. J. Inf. Bus. Manag. 2014, 6, 218–235. [Google Scholar]
  2. Scurati, G.; Bertoni, M.; Graziosi, S.; Ferrise, F. Exploring the use of virtual reality to support environmentally sustainable behavior: A framework to design experiences. Sustainability 2021, 13, 943. [Google Scholar] [CrossRef]
  3. Bae, S.; Jung, T.H.; Moorhouse, N.; Suh, M.; Kwon, O. The Influence of Mixed Reality on Satisfaction and Brand Loyalty in Cultural Heritage Attractions: A Brand Equity Perspective. Sustainability 2020, 12, 2956. [Google Scholar] [CrossRef] [Green Version]
  4. Loureiro, S.M.C.; Guerreiro, J.; Ali, F. 20 years of research on virtual reality and augmented reality in tourism context: A text-mining approach. Tour. Manag. 2020, 77, 104028. [Google Scholar] [CrossRef]
  5. Bogicevic, V.; Seo, S.; Kandampully, J.A.; Liu, S.Q.; Rudd, N.A. Virtual reality presence as a preamble of tourism experience: The role of mental imagery. Tour. Manag. 2019, 74, 55–64. [Google Scholar] [CrossRef]
  6. Yung, R.; Khoo-Lattimore, C. New realities: A systematic literature review on virtual reality and augmented reality in tourism research. Curr. Issues Tour. 2019, 22, 2056–2081. [Google Scholar] [CrossRef] [Green Version]
  7. Lu, X.; Hsiao, K.-L. Effects of diffusion of innovations, spatial presence, and flow on virtual reality shopping. Front. Psychol. 2022, 13, 941248. [Google Scholar] [CrossRef]
  8. Su, Y.-S.; Cheng, H.-W.; Lai, C.-F. Study of Virtual Reality Immersive Technology Enhanced Mathematics Geometry Learning. Front. Psychol. 2022, 13, 760418. [Google Scholar] [CrossRef]
  9. Baek, E.; Choo, H.J.; Wei, X.; Yoon, S.Y. Understanding the virtual tours of retail stores: How can store brand experience promote visit intentions? Int. J. Retail. Distrib. Manag. 2020, 48, 649–666. [Google Scholar] [CrossRef]
  10. Cho, Y.H.; Wang, Y.; Fesenmaier, D.R. Searching for experiences: The web-based virtual tour in tourism marketing. J. Travel Tour. Mark. 2002, 12, 1–17. [Google Scholar] [CrossRef]
  11. Chung, N.; Han, H.; Joun, Y. Tourists’ intention to visit a destination: The role of augmented reality (AR) application for a heritage site. Comput. Hum. Behav. 2015, 50, 588–599. [Google Scholar] [CrossRef]
  12. Marasco, A.; Buonincontri, P.; van Niekerk, M.; Orlowski, M.; Okumus, F. Exploring the role of next-generation virtual technologies in destination marketing. J. Destin. Mark. Manag. 2018, 9, 138–148. [Google Scholar] [CrossRef]
  13. Luzecka, P. “Take a gap year!” A social practice perspective on air travel and potential transitions towards sustainable tourism mobility. J. Sustain. Tour. 2016, 24, 446–462. [Google Scholar] [CrossRef]
  14. Guttentag, D.A. Virtual reality: Applications and implications for tourism. Tour. Manag. 2010, 31, 637–651. [Google Scholar] [CrossRef]
  15. Loureiro, A. Innovation and technology—The only answer for sustainable tourism growth. Worldw. Hosp. Tour. Themes 2019, 11, 743–747. [Google Scholar] [CrossRef]
  16. Kim, M.J.; Lee, C.-K.; Jung, T. Exploring Consumer Behavior in Virtual Reality Tourism Using an Extended Stimulus-Organism-Response Model. J. Travel Res. 2020, 59, 69–89. [Google Scholar] [CrossRef] [Green Version]
  17. Huang, Y.C.; Backman, K.F.; Backman, S.J.; Chang, L.L. Exploring the Implications of Virtual Reality Technology in Tourism Marketing: An Integrated Research Framework. Int. J. Tour. Res. 2016, 18, 116–128. [Google Scholar] [CrossRef]
  18. Tussyadiah, I.P.; Wang, D.; Jung, T.H.; Dieck, M.T. Virtual reality, presence, and attitude change: Empirical evidence from tourism. Tour. Manag. 2018, 66, 140–154. [Google Scholar] [CrossRef]
  19. Bogicevic, V.; Liu, S.Q.; Seo, S.; Kandampully, J.; Rudd, N.A. Virtual reality is so cool! How technology innovativeness shapes consumer responses to service preview modes. Int. J. Hosp. Manag. 2021, 93, 102806. [Google Scholar] [CrossRef]
  20. Vishwakarma, P.; Mukherjee, S.; Datta, B. Antecedents of Adoption of Virtual Reality in Experiencing Destination: A Study on the Indian Consumers. Tour. Recreat. Res. 2020, 45, 42–56. [Google Scholar] [CrossRef]
  21. Lee, W.J.; Kim, Y.H. Does VR tourism enhance users’ experience? Sustainability 2021, 13, 806. [Google Scholar] [CrossRef]
  22. Kim, M.J.; Hall, C.M. A hedonic motivation model in virtual reality tourism: Comparing visitors and non-visitors. Int. J. Inf. Manag. 2019, 46, 236–249. [Google Scholar] [CrossRef]
  23. Wei, W. Research progress on virtual reality (VR) and augmented reality (AR) in tourism and hospitality: A critical review of publications from 2000 to 2018. J. Hosp. Tour. Technol. 2019, 10, 539–570. [Google Scholar] [CrossRef]
  24. Pantano, E.; Corvello, V. Tourists’ acceptance of advanced technology-based innovations for promoting arts and culture. Int. J. Technol. Manag. 2014, 64, 3–16. [Google Scholar] [CrossRef]
  25. Li, T.; Chen, Y. Will virtual reality be a double-edged sword? Exploring the moderation effects of the expected enjoyment of a destination on travel intention. J. Destin. Mark. Manag. 2019, 12, 15–26. [Google Scholar] [CrossRef]
  26. Steuer, J. Defining Virtual Reality: Dimensions Determining Telepresence. J. Commun. 1992, 42, 73–93. [Google Scholar] [CrossRef]
  27. Yeh, C.-H.; Wang, Y.-S.; Li, H.-T.; Lin, S.-Y. The effect of information presentation modes on tourists’ responses in Internet marketing: The moderating role of emotions. J. Travel Tour. Mark. 2017, 34, 1018–1032. [Google Scholar] [CrossRef]
  28. Csikszentmihalyi, M. The flow experience and its significance for human psychology. Optim. Exp. Psychol. Stud. Flow Conscious 1988, 2, 15–35. [Google Scholar]
  29. Gao, L.; Bai, X. Online consumer behaviour and its relationship to website atmospheric induced flow: Insights into online travel agencies in China. J. Retail. Consum. Serv. 2014, 21, 653–665. [Google Scholar] [CrossRef]
  30. An, S.; Choi, Y.; Lee, C.-K. Virtual travel experience and destination marketing: Effects of sense and information quality on flow and visit intention. J. Destin. Mark. Manag. 2021, 19, 100492. [Google Scholar] [CrossRef]
  31. Celik, Z.; Aypar, U. Bibliometric Analysis of Flow Theory from Past to Present with Visual Mapping Technique: A Marketing-Sided Approach. Oneri Derg. 2022, 17, 243–267. [Google Scholar]
  32. Venkatesh, V.; Davis, F.D. A Theoretical Extension of the Technology Acceptance Model: Four Longitudinal Field Studies. Manag. Sci. 2000, 46, 186–204. [Google Scholar] [CrossRef] [Green Version]
  33. Gao, L.; Bai, X.; Park, A. Understanding Sustained Participation in Virtual Travel Communities from the Perspectives of is Success Model and Flow Theory. J. Hosp. Tour. Res. 2017, 41, 475–509. [Google Scholar] [CrossRef]
  34. Huang, Y.C.; Backman, S.J.; Backman, K.F. Exploring the impacts of involvement and flow experiences in Second Life on people’s travel intentions. J. Hosp. Tour. Technol. 2012, 3, 4–23. [Google Scholar] [CrossRef]
  35. Huang, Y.-C.; Backman, S.J.; Backman, K.F.; Moore, D. Exploring user acceptance of 3D virtual worlds in travel and tourism marketing. Tour. Manag. 2013, 36, 490–501. [Google Scholar] [CrossRef]
  36. Davis, F.D.; Bagozzi, R.P.; Warshaw, P.R. User acceptance of computer technology: A comparison of two theoretical models. Manag. Sci. 1989, 35, 982–1003. [Google Scholar] [CrossRef] [Green Version]
  37. Ashfaq, M.; Yun, J.; Waheed, A.; Khan, M.S.; Farrukh, M. Customers’ Expectation, Satisfaction, and Repurchase Intention of Used Products Online: Empirical Evidence From China. SAGE Open 2019, 9, 1–14. [Google Scholar] [CrossRef] [Green Version]
  38. Loureiro, S.M.C. Managerial Challenges and Social Impacts of Virtual and Augmented Reality; IGI Global: Hershey, PA, USA, 2020. [Google Scholar]
  39. Kim, H.; So, K.K.F.; Mihalik, B.J.; Lopes, A.P. Millennials’ virtual reality experiences pre- and post-COVID-19. J. Hosp. Tour. Manag. 2021, 48, 200–209. [Google Scholar] [CrossRef]
  40. Kim, M.J.; Lee, C.-K.; Preis, M.W. The impact of innovation and gratification on authentic experience, subjective well-being, and behavioral intention in tourism virtual reality: The moderating role of technology readiness. Telemat. Inform. 2020, 49, 101349. [Google Scholar] [CrossRef]
  41. Wu, X.; Lai, I.K.W. The use of 360-degree virtual tours to promote mountain walking tourism: Stimulus–organism–response model. Inf. Technol. Tour. 2022, 24, 85–107. [Google Scholar] [CrossRef]
  42. Seth, A.K.; Suzuki, K.; Critchley, H.D. An Interoceptive Predictive Coding Model of Conscious Presence. Front. Psychol. 2012, 2, 395. [Google Scholar] [CrossRef] [PubMed] [Green Version]
  43. Wu, S.-H.; Huang, S.C.-T.; Tsai, C.-Y.D.; Sung, C.-L. As loyal as migratory birds: Analyzing event revisit intention with dramaturgy and environmental psychology theories. Asia Pac. J. Tour. Res. 2020, 25, 841–857. [Google Scholar] [CrossRef]
  44. Kim, D.; Ko, Y.J. The impact of virtual reality (VR) technology on sport spectators’ flow experience and satisfaction. Comput. Hum. Behav. 2019, 93, 346–356. [Google Scholar] [CrossRef]
  45. Lee, M.; Lee, S.A.; Jeong, M.; Oh, H. Quality of virtual reality and its impacts on behavioral intention. Int. J. Hosp. Manag. 2020, 90, 102595. [Google Scholar] [CrossRef]
  46. Lee, S.A.; Lee, M.; Jeong, M. The role of virtual reality on information sharing and seeking behaviors. J. Hosp. Tour. Manag. 2021, 46, 215–223. [Google Scholar] [CrossRef]
  47. Lee, W.J. Use of immersive virtual technology in consumer retailing and its effects to consumer. J. Distrib. Sci. 2020, 18, 5–15. [Google Scholar]
  48. Vishwakarma, P.; Mukherjee, S.; Datta, B. Travelers’ intention to adopt virtual reality: A consumer value perspective. J. Destin. Mark. Manag. 2020, 17, 100456. [Google Scholar] [CrossRef]
  49. Griffin, T.; Guttentag, D.; Lee, S.H.; Giberson, J.; Dimanche, F. Is VR always better for destination marketing? Comparing different media and styles. J. Vacat. Mark. 2022, 29, 119–140. [Google Scholar] [CrossRef]
  50. Lee, D.Y.; Lehto, M.R. User acceptance of YouTube for procedural learning: An extension of the Technology Acceptance Model. Comput. Educ. 2013, 61, 193–208. [Google Scholar] [CrossRef]
  51. Sundar, S.S. Social psychology of interactivity in human-website interaction. In Oxford Handbook of Internet Psychology; Oxford University Press: Oxford, UK, 2012. [Google Scholar]
  52. Yim, M.Y.-C.; Chu, S.-C.; Sauer, P.L. Is Augmented Reality Technology an Effective Tool for E-commerce? An Interactivity and Vividness Perspective. J. Interact. Mark. 2017, 39, 89–103. [Google Scholar] [CrossRef]
  53. Yang, F.; Shen, F. Effects of Web Interactivity: A Meta-Analysis. Commun. Res. 2018, 45, 635–658. [Google Scholar] [CrossRef]
  54. Willems, K.; Brengman, M.; Van Kerrebroeck, H. The impact of representation media on customer engagement in tourism marketing among millennials. Eur. J. Mark. 2019, 53, 1988–2017. [Google Scholar] [CrossRef]
  55. Nah, F.F.H.; Eschenbrenner, B.; Wester, D. Enhancing Brand Equity through Flow and Telepresence: A Comparison of 2D and 3D Virtual Worlds. MIS Q. 2011, 35, 731. [Google Scholar] [CrossRef]
  56. Novak, T.P.; Hoffman, D.L.; Yung, Y.-F. Measuring the Customer Experience in Online Environments: A Structural Modeling Approach. Mark. Sci. 2000, 19, 22–42. [Google Scholar] [CrossRef] [Green Version]
  57. Chi, H.-K.; Huang, K.-C.; Nguyen, H.M. Elements of destination brand equity and destination familiarity regarding travel intention. J. Retail. Consum. Serv. 2020, 52, 101728. [Google Scholar] [CrossRef]
  58. Islam, H.; Jebarajakirthy, C.; Shankar, A. An experimental based investigation into the effects of website interactivity on customer behavior in on-line purchase context. J. Strat. Mark. 2021, 29, 117–140. [Google Scholar] [CrossRef]
  59. Yung, R.; Khoo-Lattimore, C.; Prayag, G.; Surovaya, E. Around the world in less than a day: Virtual reality, destination image and perceived destination choice risk in family tourism. Tour. Recreat. Res. 2021, 46, 3–18. [Google Scholar] [CrossRef]
  60. Tucker, S.P. E-commerce standard user interface: An E-menu system. Ind. Manag. Data Syst. 2008, 108, 1009–1028. [Google Scholar] [CrossRef]
  61. Cheng, Y.-M. Roles of interactivity and usage experience in e-learning acceptance: A longitudinal study. Int. J. Web Inf. Syst. 2014, 10, 2–23. [Google Scholar] [CrossRef]
  62. Talukdar, N.; Yu, S. Breaking the psychological distance: The effect of immersive virtual reality on perceived novelty and user satisfaction. J. Strat. Mark. 2021, 29, 1–25. [Google Scholar] [CrossRef]
  63. Skadberg, Y.X.; Skadberg, A.N.; Kimmel, J.R. Flow Experience and Its Impact on the Effectiveness of a Tourism Website. Inf. Technol. Tour. 2004, 7, 147–156. [Google Scholar] [CrossRef]
  64. Chang, C.-C. Examining users′ intention to continue using social network games: A flow experience perspective. Telemat. Inform. 2013, 30, 311–321. [Google Scholar] [CrossRef]
  65. Chang, Y.P.; Zhu, D.H. The role of perceived social capital and flow experience in building users’ continuance intention to social networking sites in China. Comput. Hum. Behav. 2012, 28, 995–1001. [Google Scholar] [CrossRef]
  66. Agrebi, S.; Jallais, J. Explain the intention to use smartphones for mobile shopping. J. Retail. Consum. Serv. 2015, 22, 16–23. [Google Scholar] [CrossRef]
  67. Oliver, R.L. Cognitive, Affective, and Attribute Bases of the Satisfaction Response. J. Consum. Res. 1993, 20, 418–430. [Google Scholar] [CrossRef]
  68. Disztinger, P.; Schlögl, S.; Groth, A. Technology acceptance of virtual reality for travel planning. In Information and Communication Technologies in Tourism; Springer: Berlin/Heidelberg, Germany, 2017; pp. 255–268. [Google Scholar]
  69. Peng, Y.; Ke, D. Consumer trust in 3D virtual worlds and its impact on real world purchase intention. Nankai Bus. Rev. Int. 2015, 6, 381–400. [Google Scholar] [CrossRef]
  70. Jung, T.H.; tom Dieck, M.C. Augmented reality, virtual reality and 3D printing for the co-creation of value for the visitor experience at cultural heritage places. J. Place Manag. Dev. 2017, 10, 140–151. [Google Scholar] [CrossRef]
  71. Hudson, S.; Matson-Barkat, S.; Pallamin, N.; Jegou, G. With or without you? Interaction and immersion in a virtual reality experience. J. Bus. Res. 2019, 100, 459–468. [Google Scholar] [CrossRef]
  72. Luque-Martínez, T.; Castañeda-García, J.A.; Frías-Jamilena, D.M.; Muñoz-Leiva, F.; Rodríguez-Molina, M.A. Determinants of the Use of the Internet as a Tourist Information Source. Serv. Ind. J. 2007, 27, 881–891. [Google Scholar] [CrossRef]
  73. Rahimizhian, S.; Ozturen, A.; Ilkan, M. Emerging realm of 360-degree technology to promote tourism destination. Technol. Soc. 2020, 63, 101411. [Google Scholar] [CrossRef]
  74. Amin, M.; Rezaei, S.; Abolghasemi, M. User satisfaction with mobile websites: The impact of perceived usefulness (PU), perceived ease of use (PEOU) and trust. Nankai Bus. Rev. Int. 2014, 5, 258–274. [Google Scholar] [CrossRef]
  75. Du, H.; Zhu, G.; Zhao, L.; Lv, T. An empirical study of consumer adoption on 3G value-added services in China. Nankai Bus. Rev. Int. 2012, 3, 257–283. [Google Scholar] [CrossRef]
  76. Suh, K.S.; Lee, Y.E. The effects of virtual reality on consumer learning: An empirical investigation. MIS Q. 2005, 29, 673–697. [Google Scholar] [CrossRef]
  77. Sun, P.-C.; Tsai, R.J.; Finger, G.; Chen, Y.-Y.; Yeh, D. What drives a successful e-Learning? An empirical investigation of the critical factors influencing learner satisfaction. Comput. Educ. 2008, 50, 1183–1202. [Google Scholar] [CrossRef]
  78. Vijayasarathy, L.R. Predicting consumer intentions to use on-line shopping: The case for an augmented technology acceptance model. Inf. Manag. 2004, 41, 747–762. [Google Scholar] [CrossRef]
  79. Saleem, M.; Kamarudin, S.; Shoaib, H.M.; Nasar, A. Retail Consumers’ Behavioral Intention to Use Augmented Reality Mobile Apps in Pakistan. J. Internet Commer. 2022, 21, 497–525. [Google Scholar] [CrossRef]
  80. Lu, L.; Chi, C.G.; Liu, Y. Authenticity, involvement, and image: Evaluating tourist experiences at historic districts. Tour. Manag. 2015, 50, 85–96. [Google Scholar] [CrossRef]
  81. Warshaw, P.R.; Davis, F.D. Disentangling behavioral intention and behavioral expectation. J. Exp. Soc. Psychol. 1985, 21, 213–228. [Google Scholar] [CrossRef]
  82. Meng, B.; Choi, K. Extending the theory of planned behaviour: Testing the effects of authentic perception and environmental concerns on the slow-tourist decision-making process. Curr. Issues Tour. 2016, 19, 528–544. [Google Scholar] [CrossRef]
  83. Meng, B.; Choi, K. The role of authenticity in forming slow tourists’ intentions: Developing an extended model of goal-directed behavior. Tour. Manag. 2016, 57, 397–410. [Google Scholar] [CrossRef]
  84. Yen, C.-H.; Teng, H.-Y. Celebrity Involvement, Perceived Value, and Behavioral Intentions in Popular Media-Induced Tourism. J. Hosp. Tour. Res. 2015, 39, 225–244. [Google Scholar] [CrossRef]
  85. Hair, J.F.; Black, W.C.; Babin, B.J.; Anderson, R.E.; Tatham, R.L. Multivariate Data Analysis; Pearson Prentice Hall: Upper Saddle River, NJ, USA, 2010. [Google Scholar]
  86. Creswell, J.W. Educational Research: Planning, Conducting, and Evaluating Quantitative and Qualitative Research; Pearson: Boston, MA, USA, 2012. [Google Scholar]
  87. Murtagh, F.; Heck, A. Multivariate Data Analysis; Springer Science & Business Media: Berlin/Heidelberg, Germany, 2012; Volume 131. [Google Scholar]
  88. Cui, L.; Jiang, H.; Deng, H.; Zhang, T. The influence of the diffusion of food safety information through social media on consumers’ purchase intentions: An empirical study in China. Data Technol. Appl. 2019, 53, 230–248. [Google Scholar] [CrossRef]
  89. Oncioiu, I.; Priescu, I. The Use of Virtual Reality in Tourism Destinations as a Tool to Develop Tourist Behavior Perspective. Sustainability 2022, 14, 4191. [Google Scholar] [CrossRef]
  90. Guo, Y.M.; Poole, M.S. Antecedents of flow in online shopping: A test of alternative models. Inf. Syst. J. 2009, 19, 369–390. [Google Scholar] [CrossRef]
  91. Zeng, Y.; Liu, L.; Xu, R. The Effects of a Virtual Reality Tourism Experience on Tourist’s Cultural Dissemination Behavior. Tour. Hosp. 2022, 3, 314–329. [Google Scholar] [CrossRef]
Figure 1. The proposed conceptual framework.
Sustainability 15 04765 g001
Table 1. Summary of elements in the conceptual model.
ConstructsIndicatorsReference
Vividness
(VVN)
When I am viewing the 360-degree virtual tour, I thought:Kim and Ko (2019) [44]; Wu and Lai (2022) [41]
VVN1The sensory information provided was highly vivid
VVN2The sensory information provided by the HMD was highly rich
VVN3The sensory information provided by the HMD was highly detailed
Interactivity
(INT)
INT1I was in control of my navigation through the augmented reality technology (website)Yim et al. (2017) [52]
INT2I had some control over the content of the augmented reality technology (website) that I wanted to see
INT3I was in control over the pace to watch products
INT4The augmented reality technology (website) had the ability to respond to my specific needs quickly and efficiently
Perceiver Enjoyment
(PEJ)
PEJ1The use of VR technology for experiencing a destination is enjoyableVishwakarma et al. (2020) [20]
PEJ2The use of VR technology for experiencing destination is fun
PEJ3The use of VR technology for experiencing a destination is pleasant
PEJ4The use of VR technology for experiencing destination is exciting
Perceived Immersion
(PIMS)
PIMS1Once into VR, I was unaware of what was happening around meVishwakarma et al. (2020) [20]
PIMS2Once into VR, I felt disconnected from the outside world
PIMS3I felt that I was traveling during my experience of the VR
PIMS4During my VR experience, I feel am in another world
Perceived Usefulness
(PU)
PU1The use of VR would help me plan my travel in a better mannerVishwakarma et al. (2020) [20]
PU2The use of VR for planning travel is highly useful for me
PU3Using VR technology would help me plan my travel more conveniently
Perceived Ease of Use
(PEOU)
PEOU1The interaction with VR technology is clear and understandableRahimizhian et al. (2020) [73]
PEOU2The interaction with the VR technology does not require a lot of effort
PEOU3I find VR apps easy for me
PEOU4I find it easy to access the desired information through the VR app
Satisfaction
(SA)
SA1I am satisfied with the quality of the information provided by the VRRahimizhian et al. (2020) [73]
SA2I am satisfied with the system ability and speed of the VR
SA3I am satisfied with the visual interface design (such as graphics) of the VR
SA4Overall, I am satisfied with the VR
Behavioral Involvement
(BI)
BI1I would like to read articles or news concerning the destination city on the internet after watching the VR videoRahimizhian et al. (2020) [73]
BI2I would like to search for responses to visiting destinations on the internet after watching the VR video
BI3I would like to talk with people who traveled and visited the destination after watching the VR video
BI4I became interested in the attractions of the destination city after watching the VR video
BI5I would like to talk with people about the desire to visit the city of destination after watching the VR video
Visit Intention
(VSI)
VSI1I may visit the destination in the futureRahimizhian et al. (2020) [73]
VSI2I plan to visit the destination in the future
VSI3I hope to visit the destination in the future
Table 2. The sample characteristics.
CategoryDescriptionFrequencyPercentCategoryDescriptionFrequencyPercent
GenderMale16051.4%Income (Million
VND)
<27524.1%
Female15148.6%2–<56420.6%
Age group16–2210533.8%5–1014747.3%
23–308728.0%>10258.0%
31–3810132.5%EducationHigh school4915.8%
>38185.8%Diploma3912.5%
Bachelor and higher20565.9%
Others185.8%
Table 3. Factorial validity, reliability test, and convergent validity results.
ConstructItemLoadingAmount of Variance Explained% Of Variance ExplainedαCRAVE
Behavioral InvolvementBI10.9366.25418.3950.9330.9330.736
BI50.853
BI40.835
BI20.833
BI30.828
Perceived EnjoymentPEJ10.9414.69513.8090.9330.9340.779
PEJ20.877
PEJ30.877
PEJ40.832
InteractivityINT10.9312.8128.2710.9310.9300.768
INT20.858
INT30.857
INT40.856
Perceived Ease of UsePEOU10.9192.8048.2480.9300.9310.771
PEOU20.876
PEOU30.860
PEOU40.856
SatisfactionSA10.8992.0436.0080.9260.9260.757
SA20.895
SA30.868
SA40.816
Perceived ImmersionPIMS10.9342.1736.3910.9080.9090.714
PIMS20.833
PIMS30.826
PIMS40.779
Visit IntentionVSI10.9651.7605.1770.9020.9050.762
VSI20.837
VSI30.809
Perceived UsefulnessPU20.8821.4224.1820.8890.8860.722
PU10.847
PU30.819
VividnessVVN10.8571.4274.1980.8050.8060.583
VVN30.717
VVN20.707
Table 4. Correlation among constructs.
ConstructVVNINTPEJPIMS PUPEOUSABIVSI
VVN0.763
INT0.2700.876
PEJ0.1900.2420.883
PIMS0.1970.3470.2640.845
PU0.0690.0690.1900.4070.850
PEOU0.2760.4430.1120.1870.0490.878
SA−0.016−0.170−0.0660.1640.1750.0460.870
BI0.0580.1020.0880.2740.416−0.0630.1530.858
VSI0.2180.3640.1750.2570.0500.2530.0420.2150.873
Table 5. Summary of the model fit indices for the final measurement model.
Model Fit
Indices
Recommended ValuesValues in the Measurement ModelModel Fit
Indices
Recommended ValuesValues in the Measurement Model
χ2/df≤31.082CFI≥0.90.958
GFI≥0.850.897RMSEA≤0.080.016
AGFI≥0.80.878SRMR≤0.080.072
TLI≥0.90.953PCLOSE≥0.050.982
Table 6. Hypotheses testing results.
HypothesesPath
Coefficients
Results
H1aVividness → Perceived Enjoyment0.128Not supported
H1bVividness → Perceived Immersion0.089Not supported
H1cVividness → Perceived Usefulness0.063Not supported
H1cVividness → Perceived Ease of Use0.150 *Supported
H2aInteractivity → Perceived Enjoyment0.190 **Supported
H2bInteractivity → Perceived Immersion0.301 **Supported
H2cInteractivity → Perceived Usefulness0.137Not supported
H2dInteractivity → Perceived Ease of Use0.345 **Supported
H3Perceived Enjoyment → Satisfaction0.155 *Supported
H4Perceived Immersion → Satisfaction0.194 *Supported
H5Perceived Usefulness → Satisfaction0.192 *Supported
H6Perceived Ease of Use → Satisfaction0.132 *Supported
H7Satisfaction → Behavioral Involvement0.221 **Supported
H8Behavioral Involvement → Visit Intention0.272 *Supported
** p < 0.01 and * p < 0.05 significance.
Disclaimer/Publisher’s Note: The statements, opinions and data contained in all publications are solely those of the individual author(s) and contributor(s) and not of MDPI and/or the editor(s). MDPI and/or the editor(s) disclaim responsibility for any injury to people or property resulting from any ideas, methods, instructions or products referred to in the content.

