1. Introduction
A decision was reached in December 2022 whereby the Convention of Biological Diversity (CBD) adopted the Kunming-Montreal Global Biodiversity Framework (GBF) [
1]. Despite the goals set by the organisation in 2010, biodiversity loss has continued almost unrelentingly, and Target 3 of the GBF aims to “Ensure and enable that by 2030 at least 30 per cent of terrestrial, inland water, and of coastal and marine areas… are
effectively conserved and managed through ecologically representative, well-connected and equitably governed systems of protected areas and other effective area-based conservation measures…” (emphasis added) [
1]. This target encapsulates the growing emphasis on the qualitative elements of protected areas (PAs), as well as the quantitative elements, such as spatial extent [
1]. Management effectiveness of PAs, specifically, has gathered increasing attention over the last two decades as more insight has come to light concerning the threats faced by these important conservation assets, including direct threats, lack of resources, and a lack of capacity or institutional structure [
2,
3].
1.1. Protected Area Management Effectiveness
Adaptive management is a management approach based on scientific understanding, which focusses on managing uncertainty, questioning assumptions and “learning through doing” [
4]. Monitoring and evaluation of management actions in PAs forms an important element of the adaptive management process, allowing managers to review and understand the strengths, weaknesses and outcomes of their decisions and learn from the results [
2,
5,
6,
7]. This, in turn, assists managers in adapting and improving management strategies in order to improve effectiveness and address threats more appropriately, thereby maximising the benefits derived from the PA [
2,
6,
7]. Management may be improved through, inter alia, more effective resource allocation, increased accountability and transparency, and/or improved community involvement [
6]. However, the implementation of adaptive management is challenging and faces many barriers, including a lack of understanding of the definition and application of the concept and a failure to recognise the complexity of social learning [
8,
9].
Protected area management effectiveness (PAME) assessments have been developed in order to support adaptive management within PAs and PA systems [
5]. Management effectiveness evaluation can also foster a culture of learning, help to inform planning and provide positive encouragement when management has been effective [
6]. Effective management, as well as sufficient resources, sound and equitable governance, and proper planning and design, are critical to achieving Target 3 of the GBF [
10]. PAME assessment tools such as the Management Effectiveness Tracking Tool (METT) [
11] have come to the forefront of conservation research as time- and cost-effective measures of the success of PA management [
12]. PAME assessments, including METT, generally divide management actions into several categories: context, planning, inputs, processes, outputs and outcomes [
6]. Doing so assists managers in understanding the root causes of management successes or failures [
5]. PAME assessments can shed light on management efforts in varying levels and types of PAs, as they have been used across multiple types of systems throughout the world, and each tool uses a standard method to collect information, allowing for some level of comparison [
5,
13].
1.2. Biosphere Reserves
Biosphere reserves (BRs) present an opportunity to experiment with interdisciplinary approaches that balance both social and ecological needs [
14] in the face of changing conservation goals. The concept of BRs was developed under the United Nations Educational, Scientific and Cultural Organisation’s (UNESCO’s) Man and the Biosphere (MAB) programme, and there are currently 738 BRs in 134 countries, 22 of which are transboundary sites [
15]. UNESCO describes BRs as areas that seek to reconcile biodiversity conservation and sustainable resource use [
14]. The four strategic objectives of BRs are (1) biodiversity conservation, restoration of ecosystem services and sustainable use of natural resources, (2) contribution to sustainable, healthy and equitable human societies and economies, (3) facilitation of learning and education through biodiversity and sustainability science, and (4) support for climate change mitigation and adaptation [
14]. The main functions of BRs are conservation, logistic support, and sustainable development, implemented through a landscape model which contains three management zones: a core area/s, set aside for protecting biodiversity; buffer zone/s adjoining the core area/s, utilised for ecologically compatible land uses and education; and a transition area, which is flexible and may contain a variety of sustainably managed land uses [
16]. BRs are one of the major tools utilised for landscape-scale management in South Africa, alongside World Heritage Sites and transfrontier parks [
17]. The first South African BR was Kogelberg Biosphere Reserve, designated in the Western Cape in 1998 [
17], and there are now ten BRs in the country [
15]. Five South African BRs occur within or straddling the Northern, Western and Eastern Cape Provinces; two occur within the Limpopo Province, one straddles the Limpopo and Mpumalanga Provinces, one occurs in Gauteng Province, and one in the North-West Province [
15]. South African BRs face challenges in terms of their perception and support, but if these can be overcome, they may present an opportunity to bring international recognition and funding to the region, foster collaborative thinking, and address national goals such as social development and climate change mitigation and adaption [
17].
1.3. Biosphere Reserve Effectiveness
The decadal periodic review process mandated by UNESCO is currently the only obligatory mechanism for the evaluation of BR implementation [
16,
18]. The periodic review process has proven useful for refining the design and planning of BRs for the implementation of the strategic objectives [
18], as well as for the removal of non-conforming BRs from the World Network of Biosphere Reserves (WNBR) [
19]. However, the periodic review lacks indicators to measure outcomes-based effectiveness and is perceived by some as an exercise in compliance only, providing little practical benefit [
18]. In addition, the ten-year gap between evaluations is considered too long to monitor changes in management cycles [
18]. Other criticisms of the periodic review process include bias as a result of self-evaluation and lack of communication from the regional UNESCO MAB offices [
20]. Periodic reviews have proven, in their current form, to be largely a soft evaluation tool, not adequate to truly assess the effectiveness of a BR in fulfilling its objectives [
18]. Evaluation of management can be utilised as a tool for adaptive management if it is approached as a learning and collaborative process wherein organisations work together to improve their understanding of common issues, confront uncertainty and thus, increase their capacity to adapt to change [
21]. However, due to the periodic review’s focus on compliance with designation criteria rather than on the performance of management, it provides limited insight into understanding the root causes of successes or failures in BRs [
18,
22]. A recent paper demonstrated the use of a new tool—the Biosphere Reserve Effectiveness of Management index (BREMi)—in evaluating BR management effectiveness across the ArabMAB network [
23]. This tool has not yet been taken up by the global MAB network but provides promising results for monitoring and evaluation of effectiveness within the complex social–ecological model of a BR [
23].
1.4. Case Study: Kruger to Canyons Biosphere Region
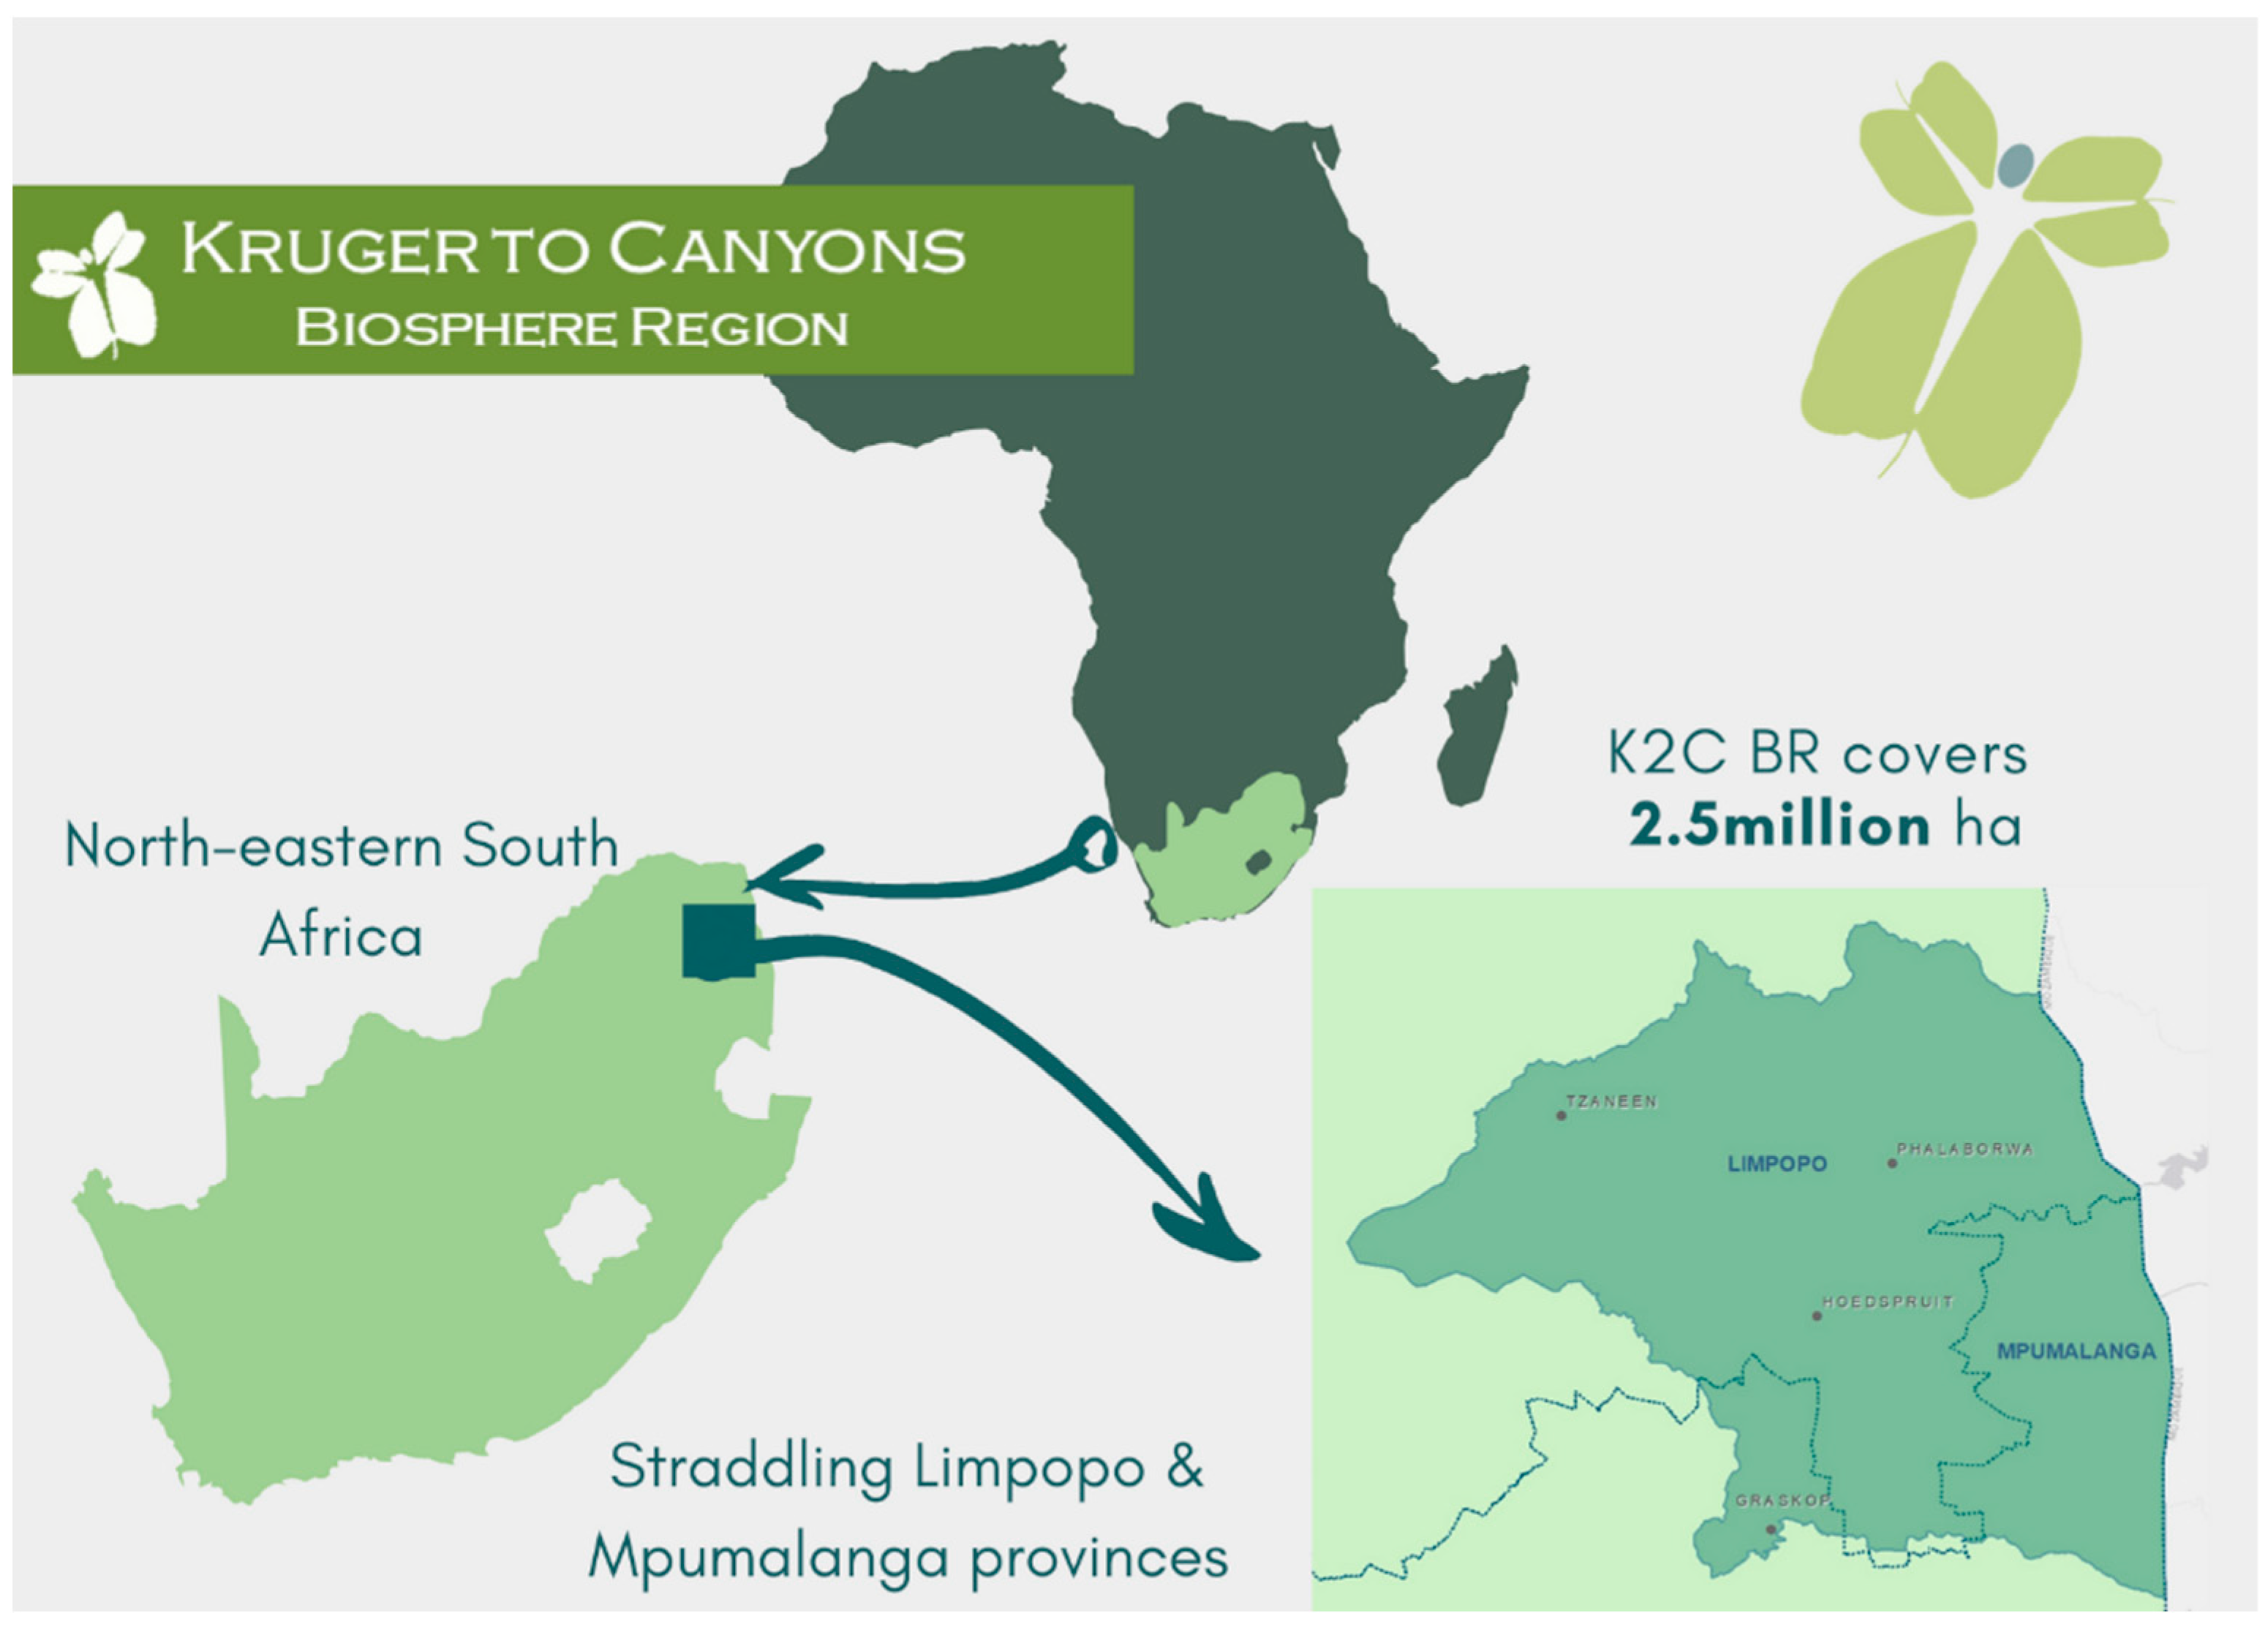
This study examined the monitoring and evaluation of PAME in PAs within a South African biosphere reserve (used interchangeably with “biosphere region”). Kruger to Canyons Biosphere Region (K2C) is located in the northeast of the country and was designated in 2001 through an initiative driven by the Lowveld Community [
17] (
Figure 1).
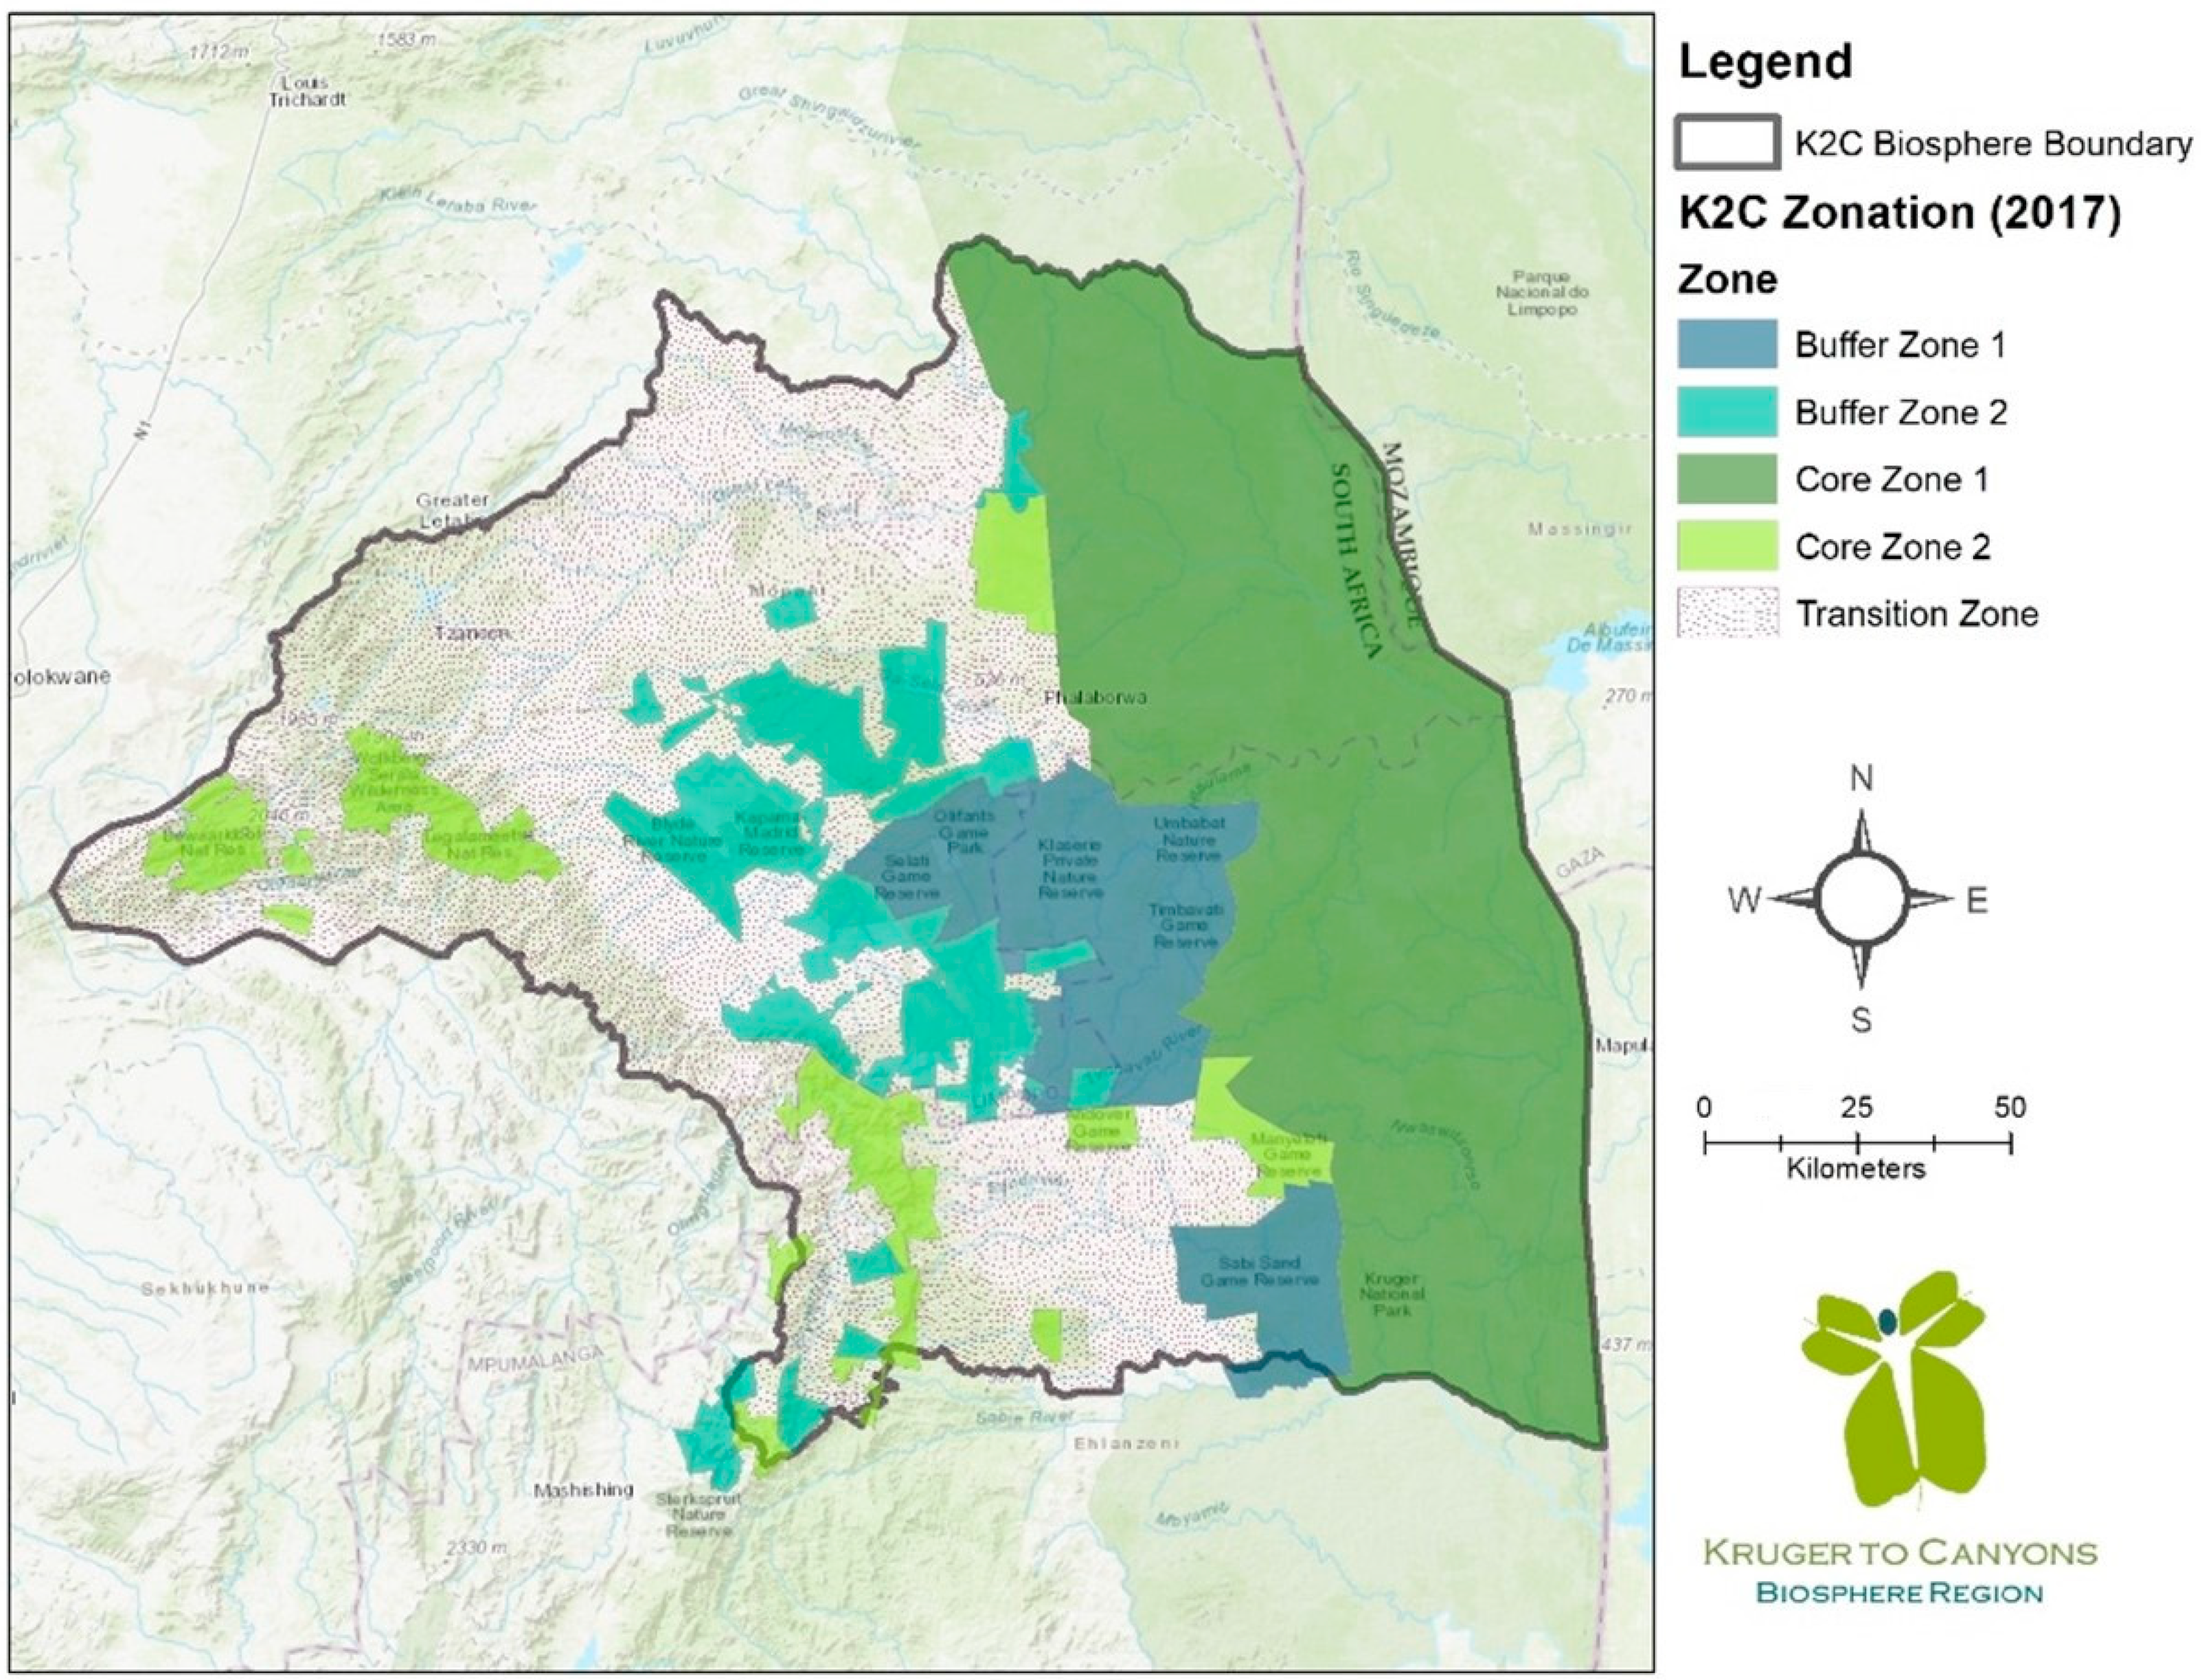
K2C is a region of diverse geography, ecosystems, biodiversity, management types, land uses, and cultures, and encompasses 2,608,000 ha of land across South Africa’s Mpumalanga and Limpopo provinces. Of this, 1.4 million ha are dedicated to conservation, including a variety of PA types such as Kruger National Park (KNP), ten provincial reserves, and many private nature reserves [
24]. The formally protected land (KNP and provincial reserves) constitutes the core of the BR, while the privately protected land makes up the buffer zone (
Figure 2) [
24].
These PAs are managed through a myriad of different governance structures, such as national and provincial level government (KNP and provincial reserves), private landowners, communities, and partnerships between some of these entities. KNP is managed by South African National Parks (SANParks), while provincial PAs are managed by either the Limpopo Department of Economic Development, Environment and Tourism (LEDET) or the Mpumalanga Tourism and Parks Agency (MTPA), depending on which province they fall into. Each of these government agencies has its own policies, goals, and structures. The above-mentioned complexities may further elevate the difficulty of monitoring and evaluating both PA and BR effectiveness. A comprehensive understanding of the PAs within BRs, including K2C, as well as their needs, could assist BRs in better addressing the monitoring and evaluation needs of the system as a whole. K2C faces further complications: several PAs within K2C are connected through the Great Limpopo Transfrontier Conservation Area (GLTFCA), which forms another layer of governance within the region. The fences between PAs in the GLTFCA have been taken down, forming one large and continuous conservation area. In addition, a few large, privately owned PAs take part in some of the GLTFCA processes, such as the METT review, although they are not physically connected through dropped boundaries to the PAs in the GLTFCA (pers. comm., K2C management team). There are, however, other PAs within K2C which are not connected to the GLTFCA or its processes. These PAs are generally relatively small and will hereafter be referred to as the “smaller, isolated PAs” in the system. Several of these PAs may be geographically isolated, being located in the western region of the BR, while others are just small and/or new in the PA network.
The complexity of PA management types and PA governance types described above, as well as the diverse geography, ecosystems, and cultures present in the landscape, offer K2C as an interesting case study in which to examine the tools and methods used for monitoring and evaluation of management effectiveness within PAs in a BR. This case study also highlights the barriers and opportunities that individual PAs face when attempting to monitor and evaluate management effectiveness as part of an adaptive management process.
Thus, our study presents an important insight into the monitoring and evaluation of PAs in the South African context, as well as the monitoring and evaluation of diverse PAs within an African BR. This insight will be useful for other South African and African BRs facing similar challenges and complexities and may contribute toward the development of tools and processes which can assist with monitoring and evaluation of PA and BR effectiveness.
2. Materials and Methods
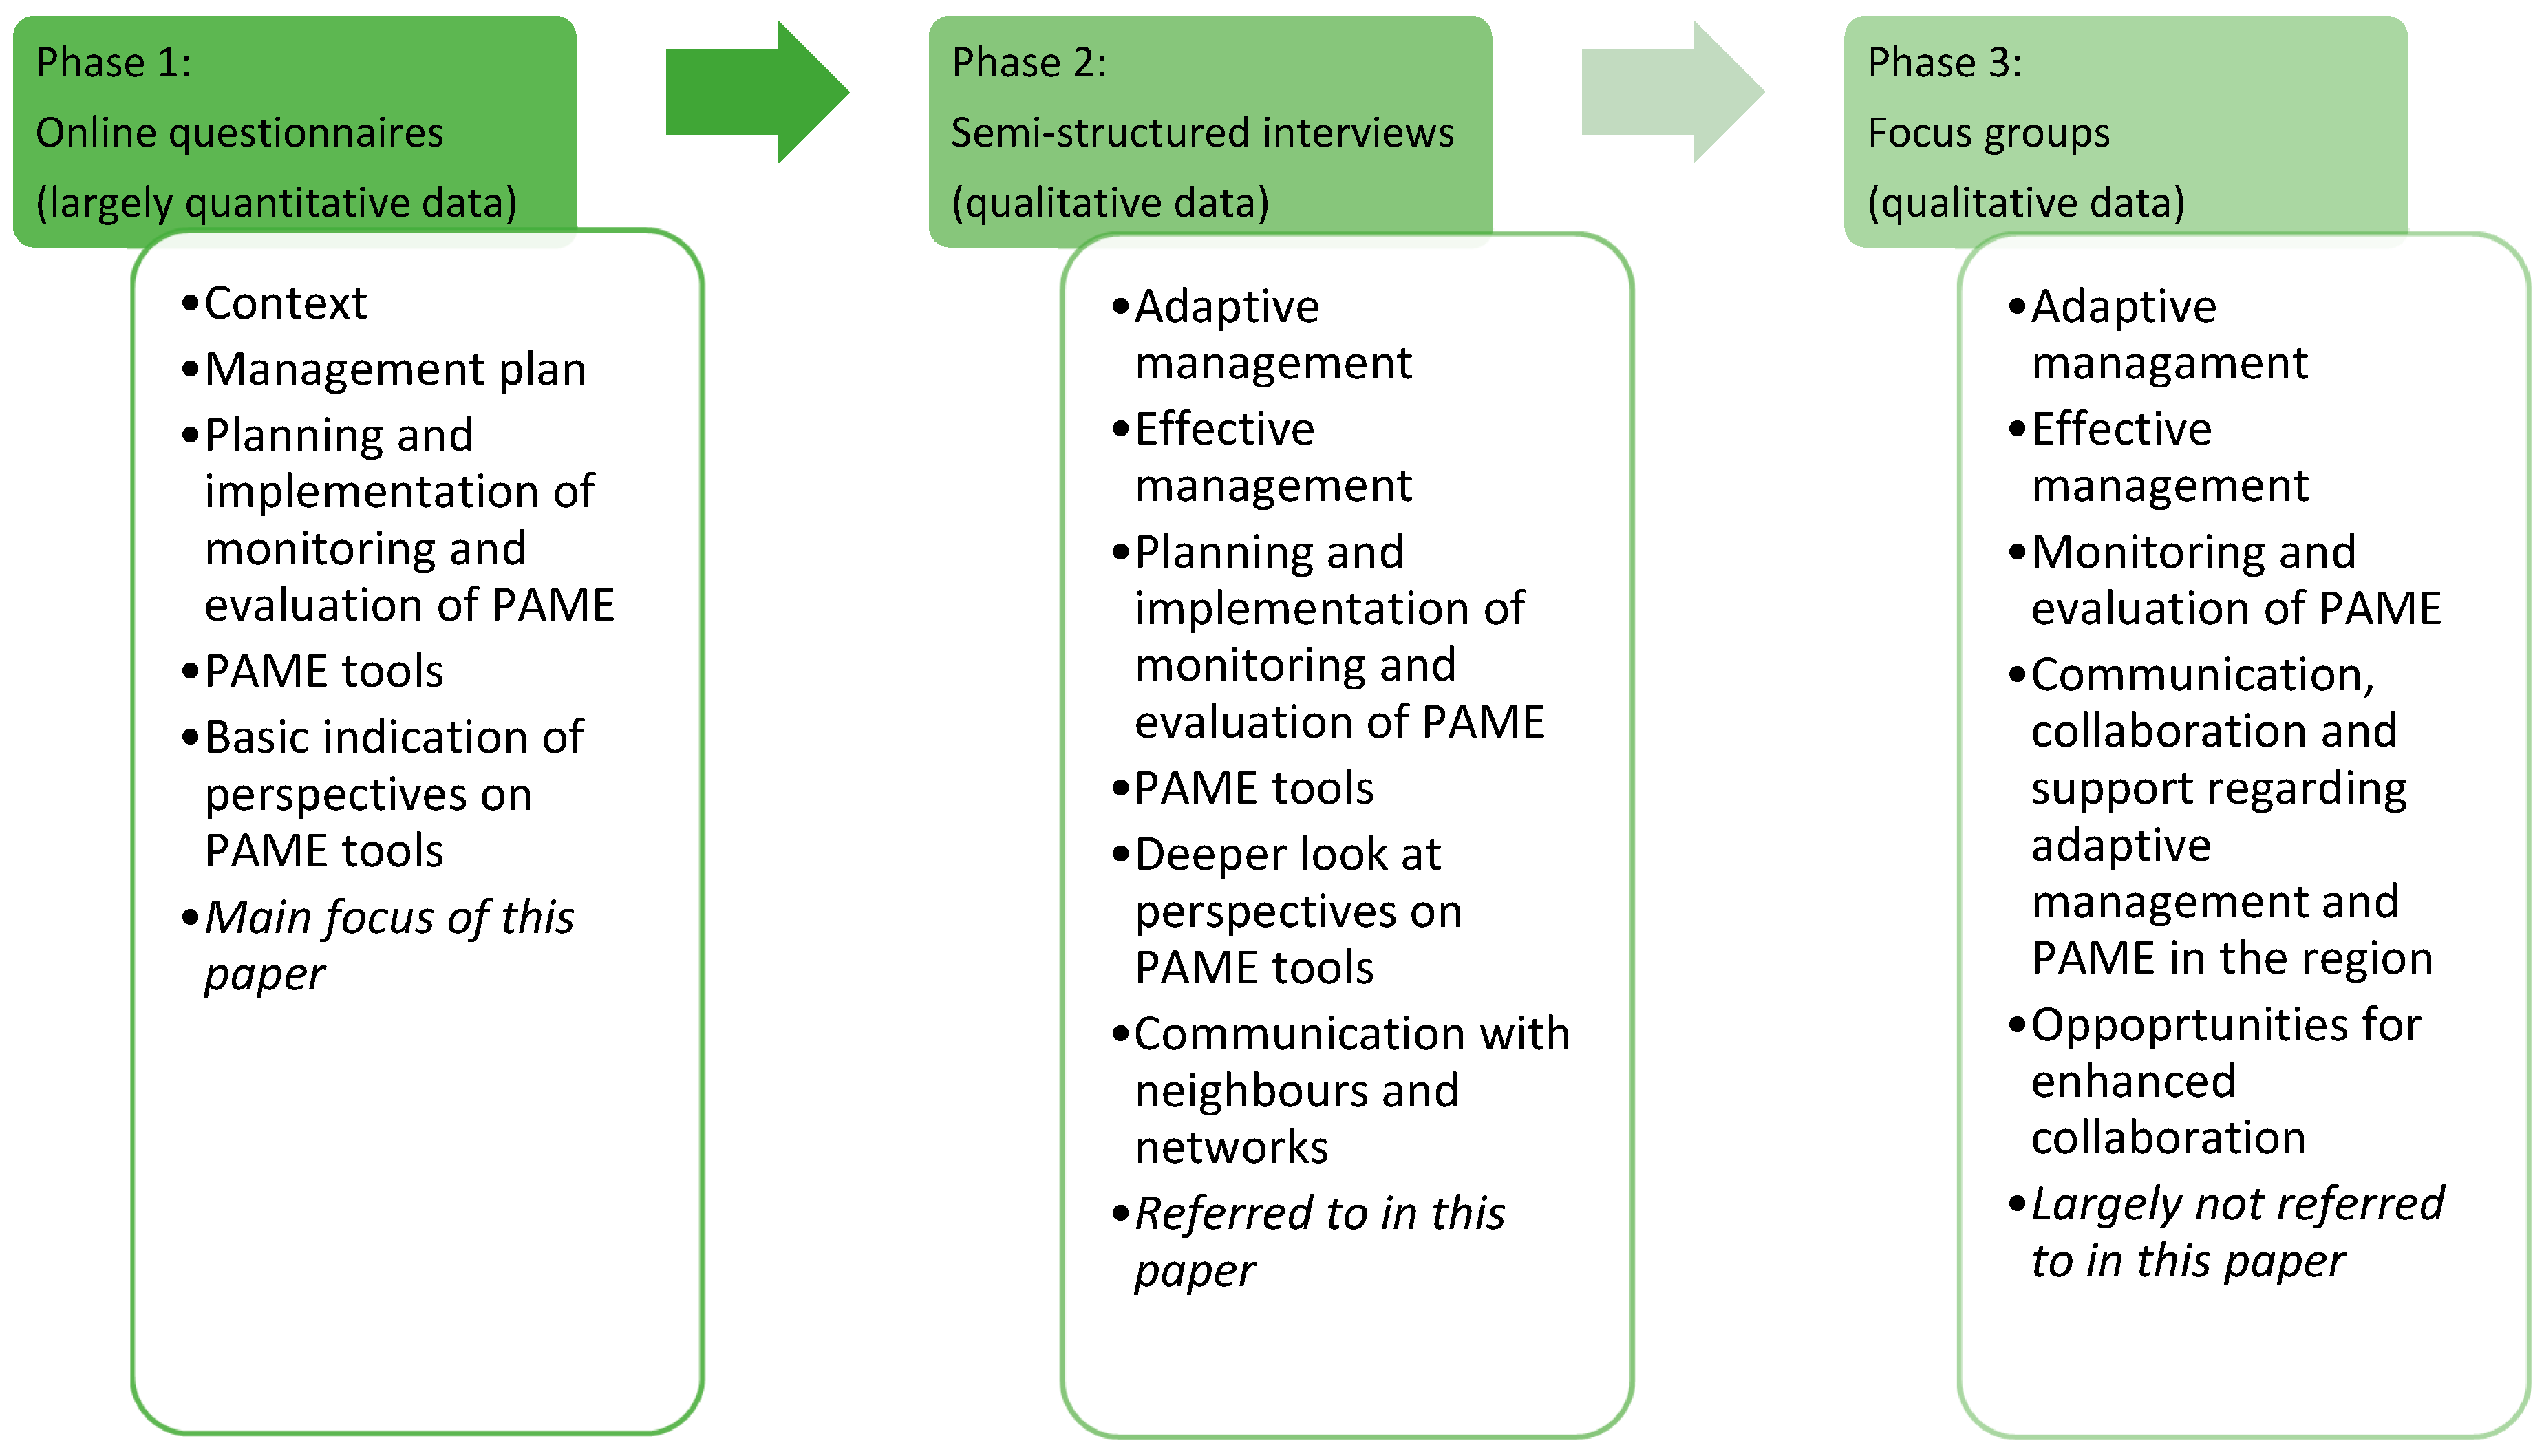
All known PA managers within the K2C landscape were invited to participate in this study via email. This paper forms part of a larger research project which utilised a mixed-methods approach in order to gain progressively deeper insight into the topics of adaptive management, management effectiveness and the monitoring and evaluation thereof (
Figure 3). The findings presented here are drawn mainly from online questionnaires, but data from interviews and focus groups also informed some of the conclusions.
2.1. Online Questionnaire
Online questionnaire data were collected between January and July 2022 using the Qualtrics XM platform (
https://www.qualtrics.com/uk/, Accessed on 1 December 2021) (see
Supplementary Materials). Data collected using the online questionnaire include background data such as province, size, designation status, ownership, management and governance structure, and surrounding land use. Data regarding the management planning of the PA were also collected, including the existence of a management plan, date of original and subsequent revisions of the management plan, objectives of the PA encapsulated within the management plan (if applicable), and the presence of the phrases “adaptive management” and “management effectiveness” within the management plans. Further questions required participants to indicate to what degree they felt that their PA followed an adaptive management process. The main section of the questionnaire dealt with both the use and utility of any standardised and/or non-standardised PAME tools employed by the participating PAs. The questionnaire also included optional open-ended questions to solicit ideas or suggestions for improved monitoring and evaluation techniques or more relevant research. In order to reduce survey fatigue, the questionnaire was structured so that if a respondent selected an option as “not applicable”, all linked fields were hidden. Furthermore, some questions included forced responses to ensure that all relevant data were captured. Finally, many of the questions had an “other” option where respondents could insert their own data if the options provided were irrelevant. This encouraged autonomy, i.e., ensured that respondents did not feel forced to uncritically adopt the underlying assumptions of the questionnaire.
Quantitative data were analysed and presented using descriptive statistics in Microsoft Excel. Besides the basic count of categorical data, Excel was also used to calculate frequencies, central tendency and dispersion of data in order to give an overall picture of PAME in K2C. The interviews and focus groups were used to corroborate the quantitative information, ensuring that no PAME tools had been excluded and allowing deeper insight into the perception of the tools by PA managers.
2.2. Interviews
Interviews are a useful tool in mixed-method studies, which are used to gain more in-depth details to supplement data from quantitative data collection methods such as questionnaires [
25]. Interviews allow researchers to gain insight into the perceptions and experiences of participants, as well as further understanding of social processes and relationships [
25]. Interviews may also assist researchers in acquiring more complete answers and are relatively flexible, but using this method can be time-consuming, limited to small scales and may potentially result in inconsistencies [
26]. This was mitigated through the additional use of questionnaires and focus groups.
Individual, semi-structured interviews were conducted with PA managers or management team representatives. Before the interviews, participants were provided with an infographic that outlined the general themes of the interview. Participants were encouraged to answer the online questionnaire before the interview, as many questions were similar and/or linked. The interview questions revolved around the themes of adaptive management, management effectiveness and its monitoring and evaluation, and the use of PAME tools. Questions were fairly broad, and interviewees were encouraged to share their own experiences. Interviews were facilitated and transcribed by the researcher [G.V.E.W.].
2.3. Focus Groups
Focus groups are defined as a type of interview between a researcher and more than one individual, structured to gather detailed opinions and knowledge about a specific topic from a selected group of participants [
27,
28]. Three focus groups were held at the end of the data collection period, in July 2022. The focus group phase aimed to close gaps that arose in the interview phase, as well as facilitate deeper engagement with the topics of adaptive management, management effectiveness, and monitoring and evaluation of management effectiveness in the K2C region. While the main themes of the focus groups were similar to those of the interviews, more discussion was held around the theory and practice of adaptive management and PAME in general, with less focus on the individual tools utilised by the PAs. The focus groups also allowed for dialogue amongst the different PA managers, as opposed to the one-on-one, question-and-answer style of the interviews, which proved fruitful for both the researcher and the attendees. Focus groups were divided according to PA management types. The first focus group consisted of three participants from smaller, isolated and (although this was unintentional) currently unproclaimed PAs. The second focus group consisted of three attendees from government or parastatal management agencies. The final focus group consisted of two attendees from private PAs. The focus groups were structured this way to ensure that there was some contextual similarity between the participants, enabling a slightly narrower focus. Focus groups took place over the course of two two-hour sessions, with refreshments provided during the break. Focus groups were facilitated and transcribed by the researcher [G.V.E.W.].
2.4. Ethical Considerations
All participants were informed of the details of this study via email, on the first page of the online questionnaire, and during the interviews and focus groups. Participation was voluntary. All data are kept confidential and anonymous in order to protect the identities and job security of participants. The research was undertaken in compliance with the Declaration of Helsinki and with ethical approval from Central European University, Austria.
3. Results and Discussion
In total, 19 responses to the online questionnaires were received (of which three were incomplete), 17 managers were interviewed directly (four of whom were representatives of organisations which are responsible for the management of a group of PAs), and eight managers (two of whom were representatives of organisations which are responsible for the management of a group of PAs) were involved in the focus groups. Due to the demanding schedules of PA managers within this region, most were not able to participate in all three data collection phases–only one PA representative participated in the online questionnaire, an interview and the focus group. The PAs which are part of a larger PA network managed by organisations are those that are state-managed or managed by a parastatal, and while some of the PAs in these networks have individual managers, some are managed centrally by the organisation. Therefore, the inclusion of perceptions of upper-level managers within those organisations gives valuable insight into this topic. In total, 22 individual PAs are represented in the data, as well as four national-level, provincial-level, or parastatal management entities, which are responsible for the management of several PAs within the K2C landscape.
There are approximately 40 PAs in K2C, 10 of which are provincially managed, and eight of which are managed by the national government or a parastatal entity, or a partnership between the two. As representatives from these organisations were either interviewed or present in a focus group, the study covered approximately 90% of the PAs in K2C.
One questionnaire response has been excluded from all analyses as the origin of the response could not be linked back to a PA in the region, and it was incomplete.
3.1. Context of K2C PAs
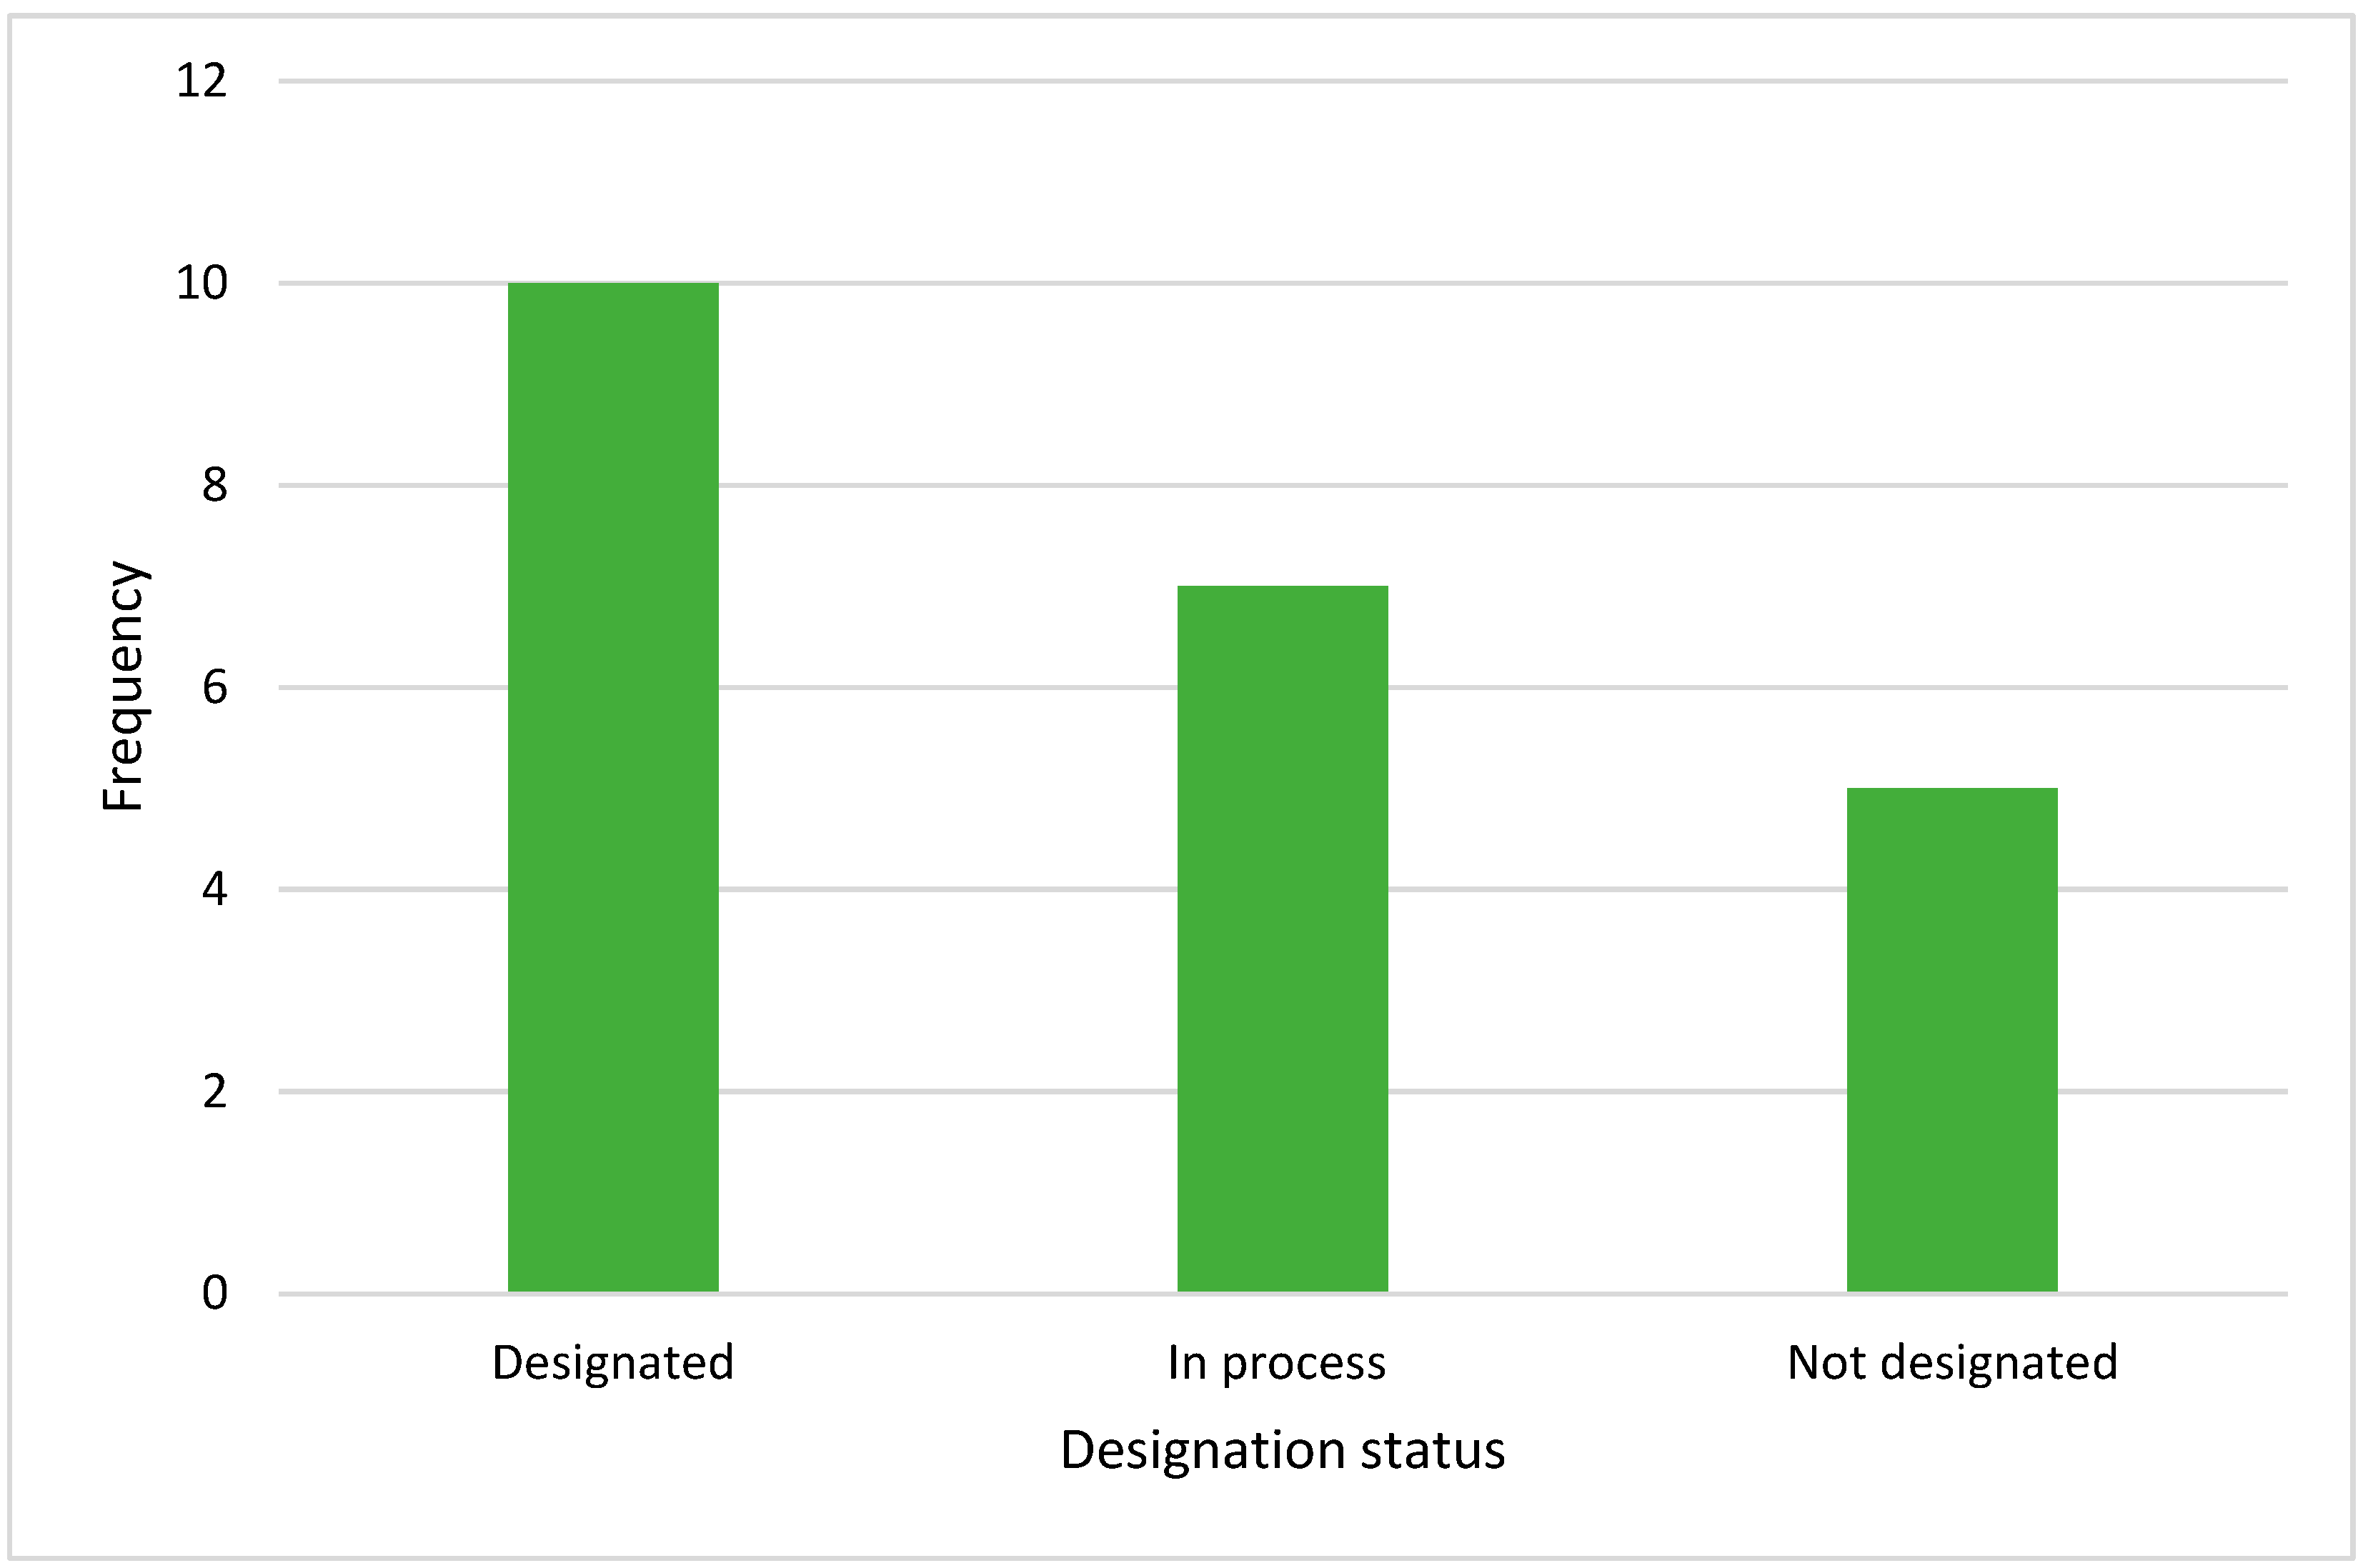
The results in this section focus on the contextual elements of the responding PAs in K2C. These results emphasise that K2C is a highly complex landscape, with PAs that face a variety of challenges as a result of their diverse contextual backgrounds, such as geographical location, the management or governance context, and size. PAs that are designated, in the process of designation, and those who may consider designation in the future (i.e., not currently designated) are included in the data represented (
Figure 4). This allows for the inclusion of a myriad of PA types that face different, context-specific challenges and presents a varied perspective that gives a broader outlook of the state of PAME monitoring and evaluation in the K2C landscape.
While K2C encompasses areas across both Limpopo and Mpumalanga provinces, the majority of the BR lies within Limpopo Province (
Figure 1). Thus, understandably, the majority of questionnaire respondents represent PAs within Limpopo, and two PAs straddle both provinces (
Figure 5). The location of the PAs has consequences, as provincial conservation agencies have jurisdiction over the PAs within their boundaries; PAs in Limpopo are managed by LEDET, while PAs in Mpumalanga are managed by MTPA. This affects management if a certain issue needs provincial authorisation (including, but not limited to, game management and endorsement of the management plan). In one case, the management plan of a well-established PA has not been approved despite years of effort due to issues in the provincial department, which could possibly be attributed to bureaucratic delays. As one interviewee explained, “…
in 2016 they submitted an application to the [provincial department representative]
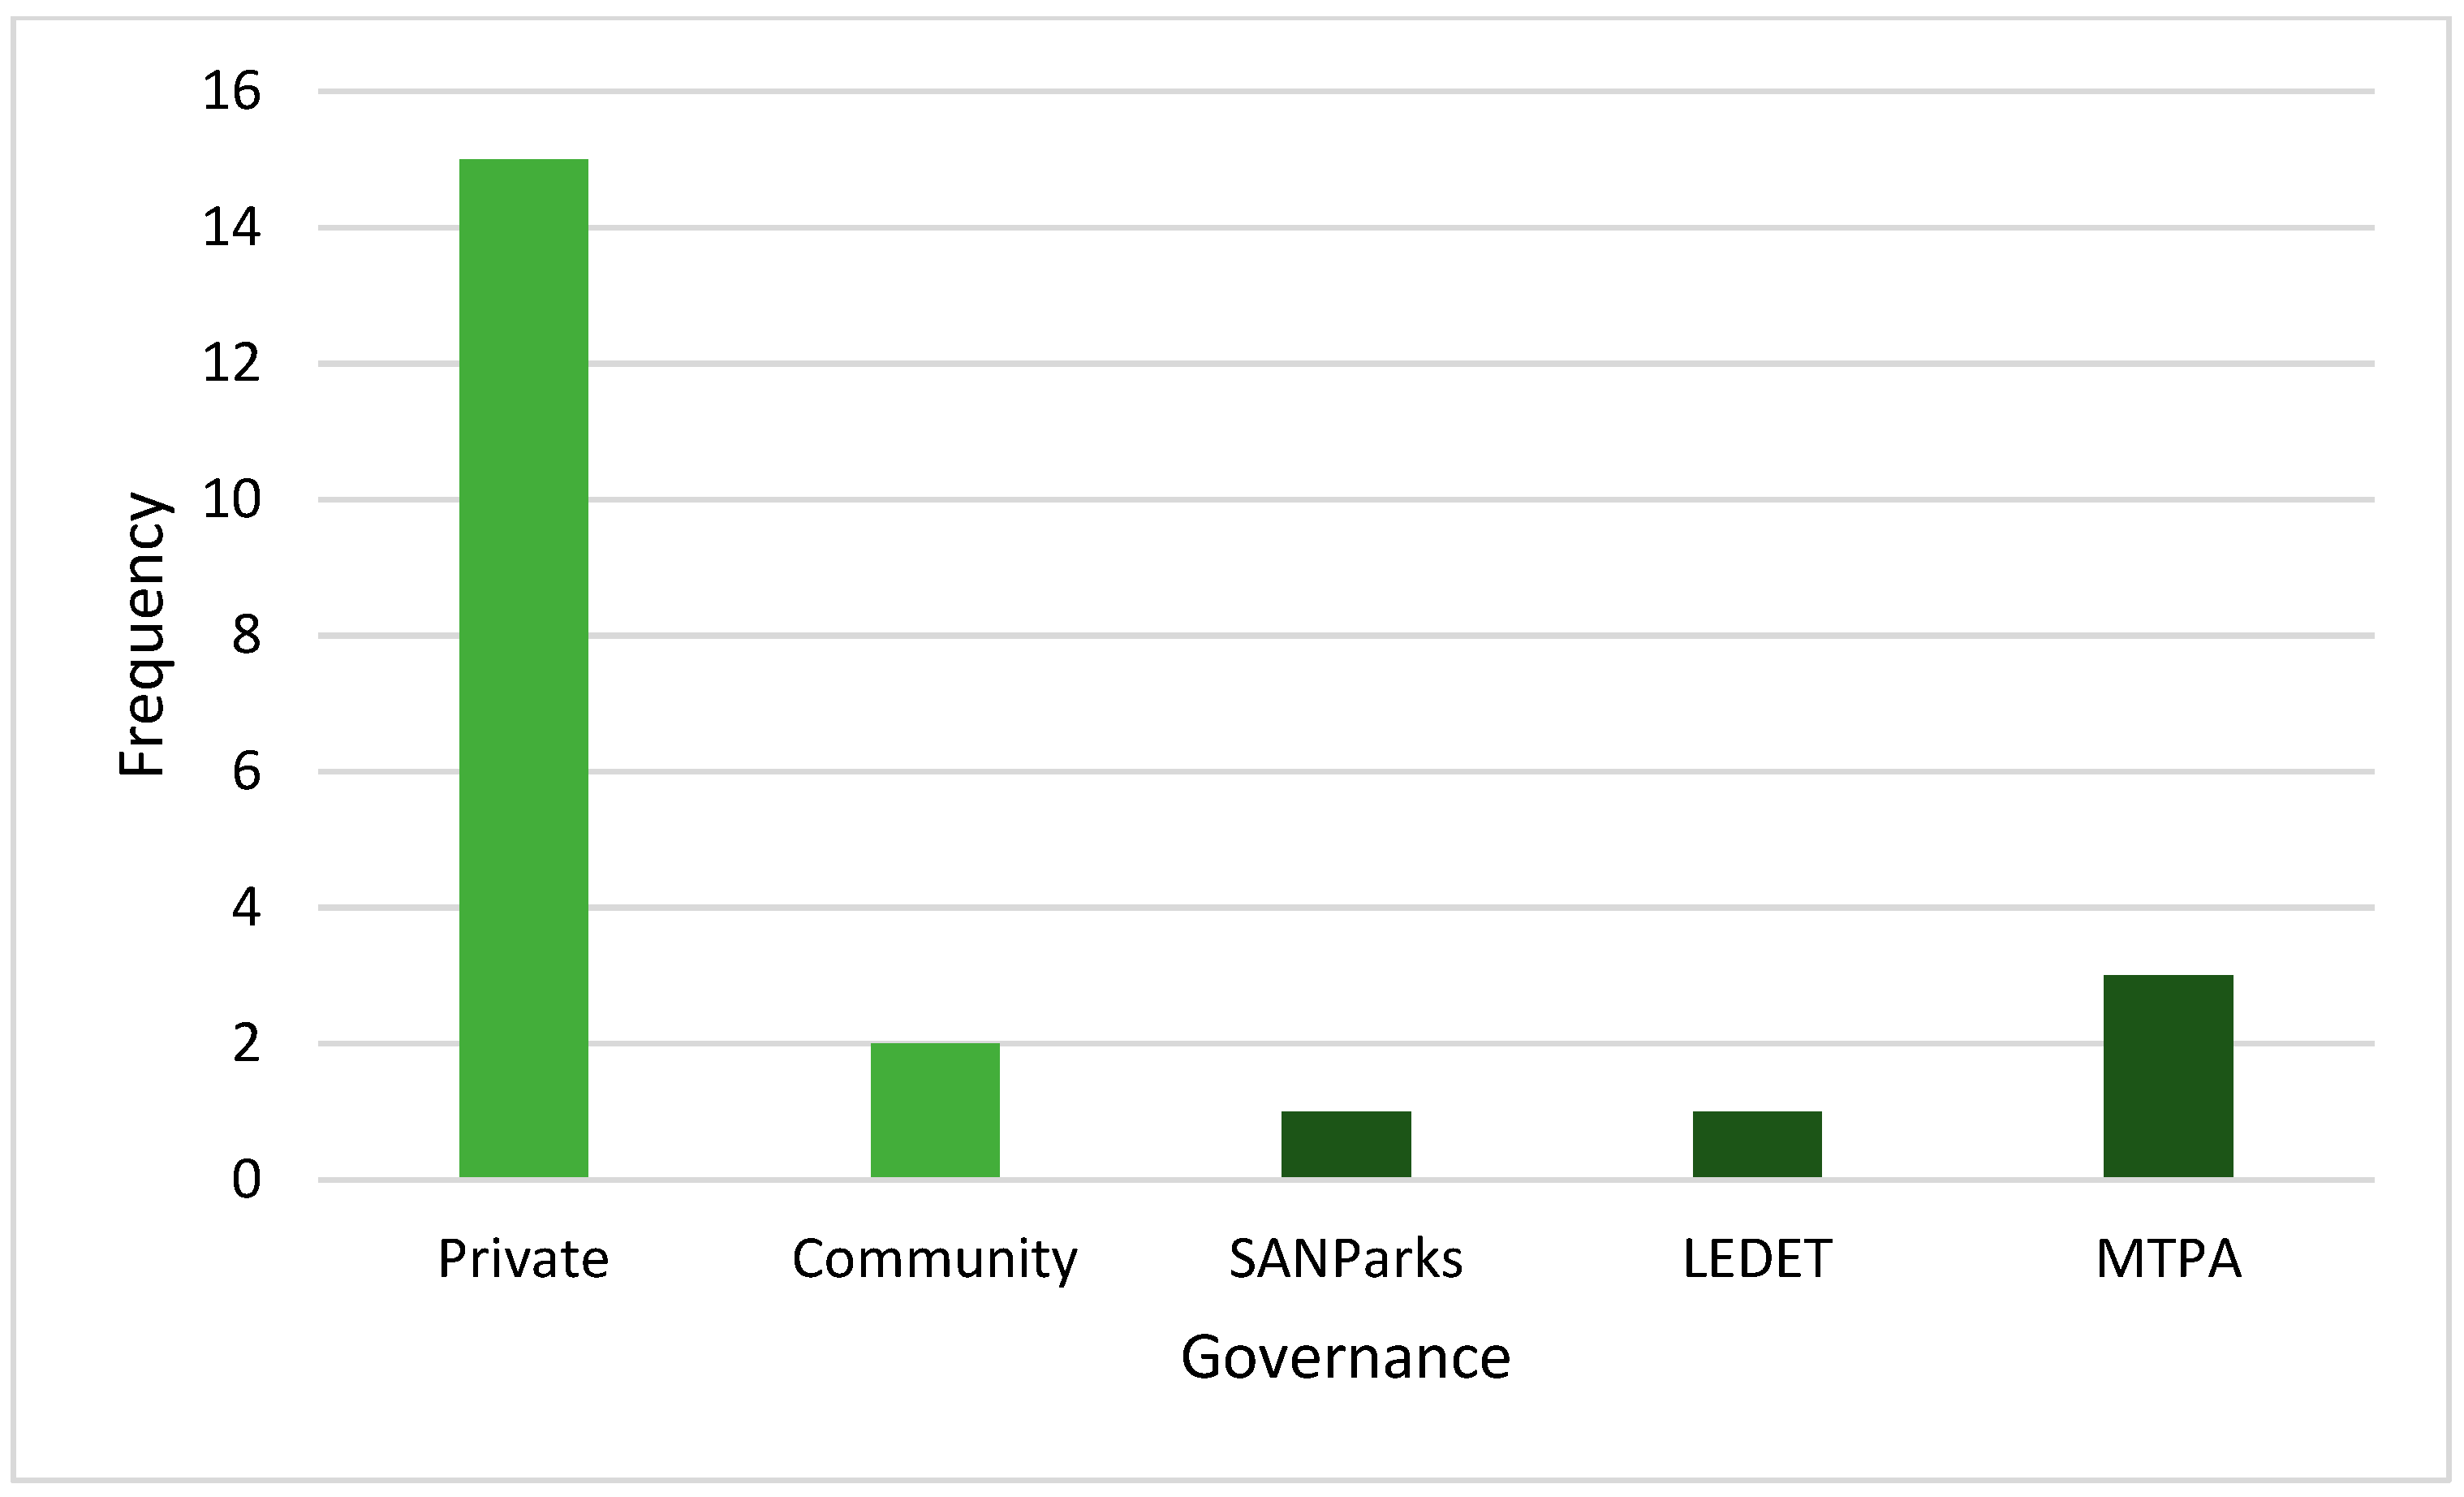
which was thrown out because there was some issue in the department and they didn’t process our application”. Similarly, the governance context of the PAs may result in challenges or opportunities which impact the monitoring and evaluation of management effectiveness, as well as the ability of the PAs to implement management adjustments once monitoring and/or evaluation has indicated the need for a directional change, as part of an adaptive management process. Thus, the varied governance models of the PAs in K2C (
Figure 6) contribute to the complexity of the landscape.
Budgetary and staffing constraints of the provincially managed reserves in K2C have resulted in a loss of monitoring programmes, as expressed in frustration by some of the interviewees. These sentiments reflect concerns regarding equipment and software needs: “Our problem currently is, there is no budget for these devices, and there’s also no money for the development of the apps, and management of the database to analyse the stuff”; monitoring programme implementation: “…next year, our veld condition assessments have been removed from our budget by the department, saying they don’t have money for it”; and staffing shortages: “So we are totally out of staff. So that’s where we fall flat”.
These views of PAs within the K2C echo the global pattern of under-resourcing of PAs [
29]. Privately governed PAs within K2C vary in terms of both the number of landowners within the PA and the use of the PA by those landowners. Some may be owned by a single person, some by less than ten people, and others by more than 20 people (pers. comm., K2C management team). Some of the landowners may only utilise the land for private enjoyment, while others run internationally acclaimed ecotourism lodges, and others still use the land for game hunting. In fact, these various types of land uses can also co-exist within one PA (pers. comm., K2C management team). These variances within one governance type further complicate management effectiveness, and monitoring and evaluation thereof.
In the PAs where governance is noted as “community”, management may be undertaken by a private entity on behalf of the community. Provincial-level PAs also often have co-ownership or co-management agreements in place with surrounding communities. In these cases, usually, the protected land has undergone a land claim. Land claims are a type of land reform introduced to South Africa after the end of Apartheid, which allows indigenous South Africans to reclaim land their forefathers were forcibly removed from in the past [
30]. In South African PAs subject to land claims, settlement is nearly always followed by a co-management arrangement between conservation authorities and the successful claimant communities [
31]. The structure for these PAs differs between individual PAs and across different provinces but usually involves the community gaining a direct benefit from the PA.
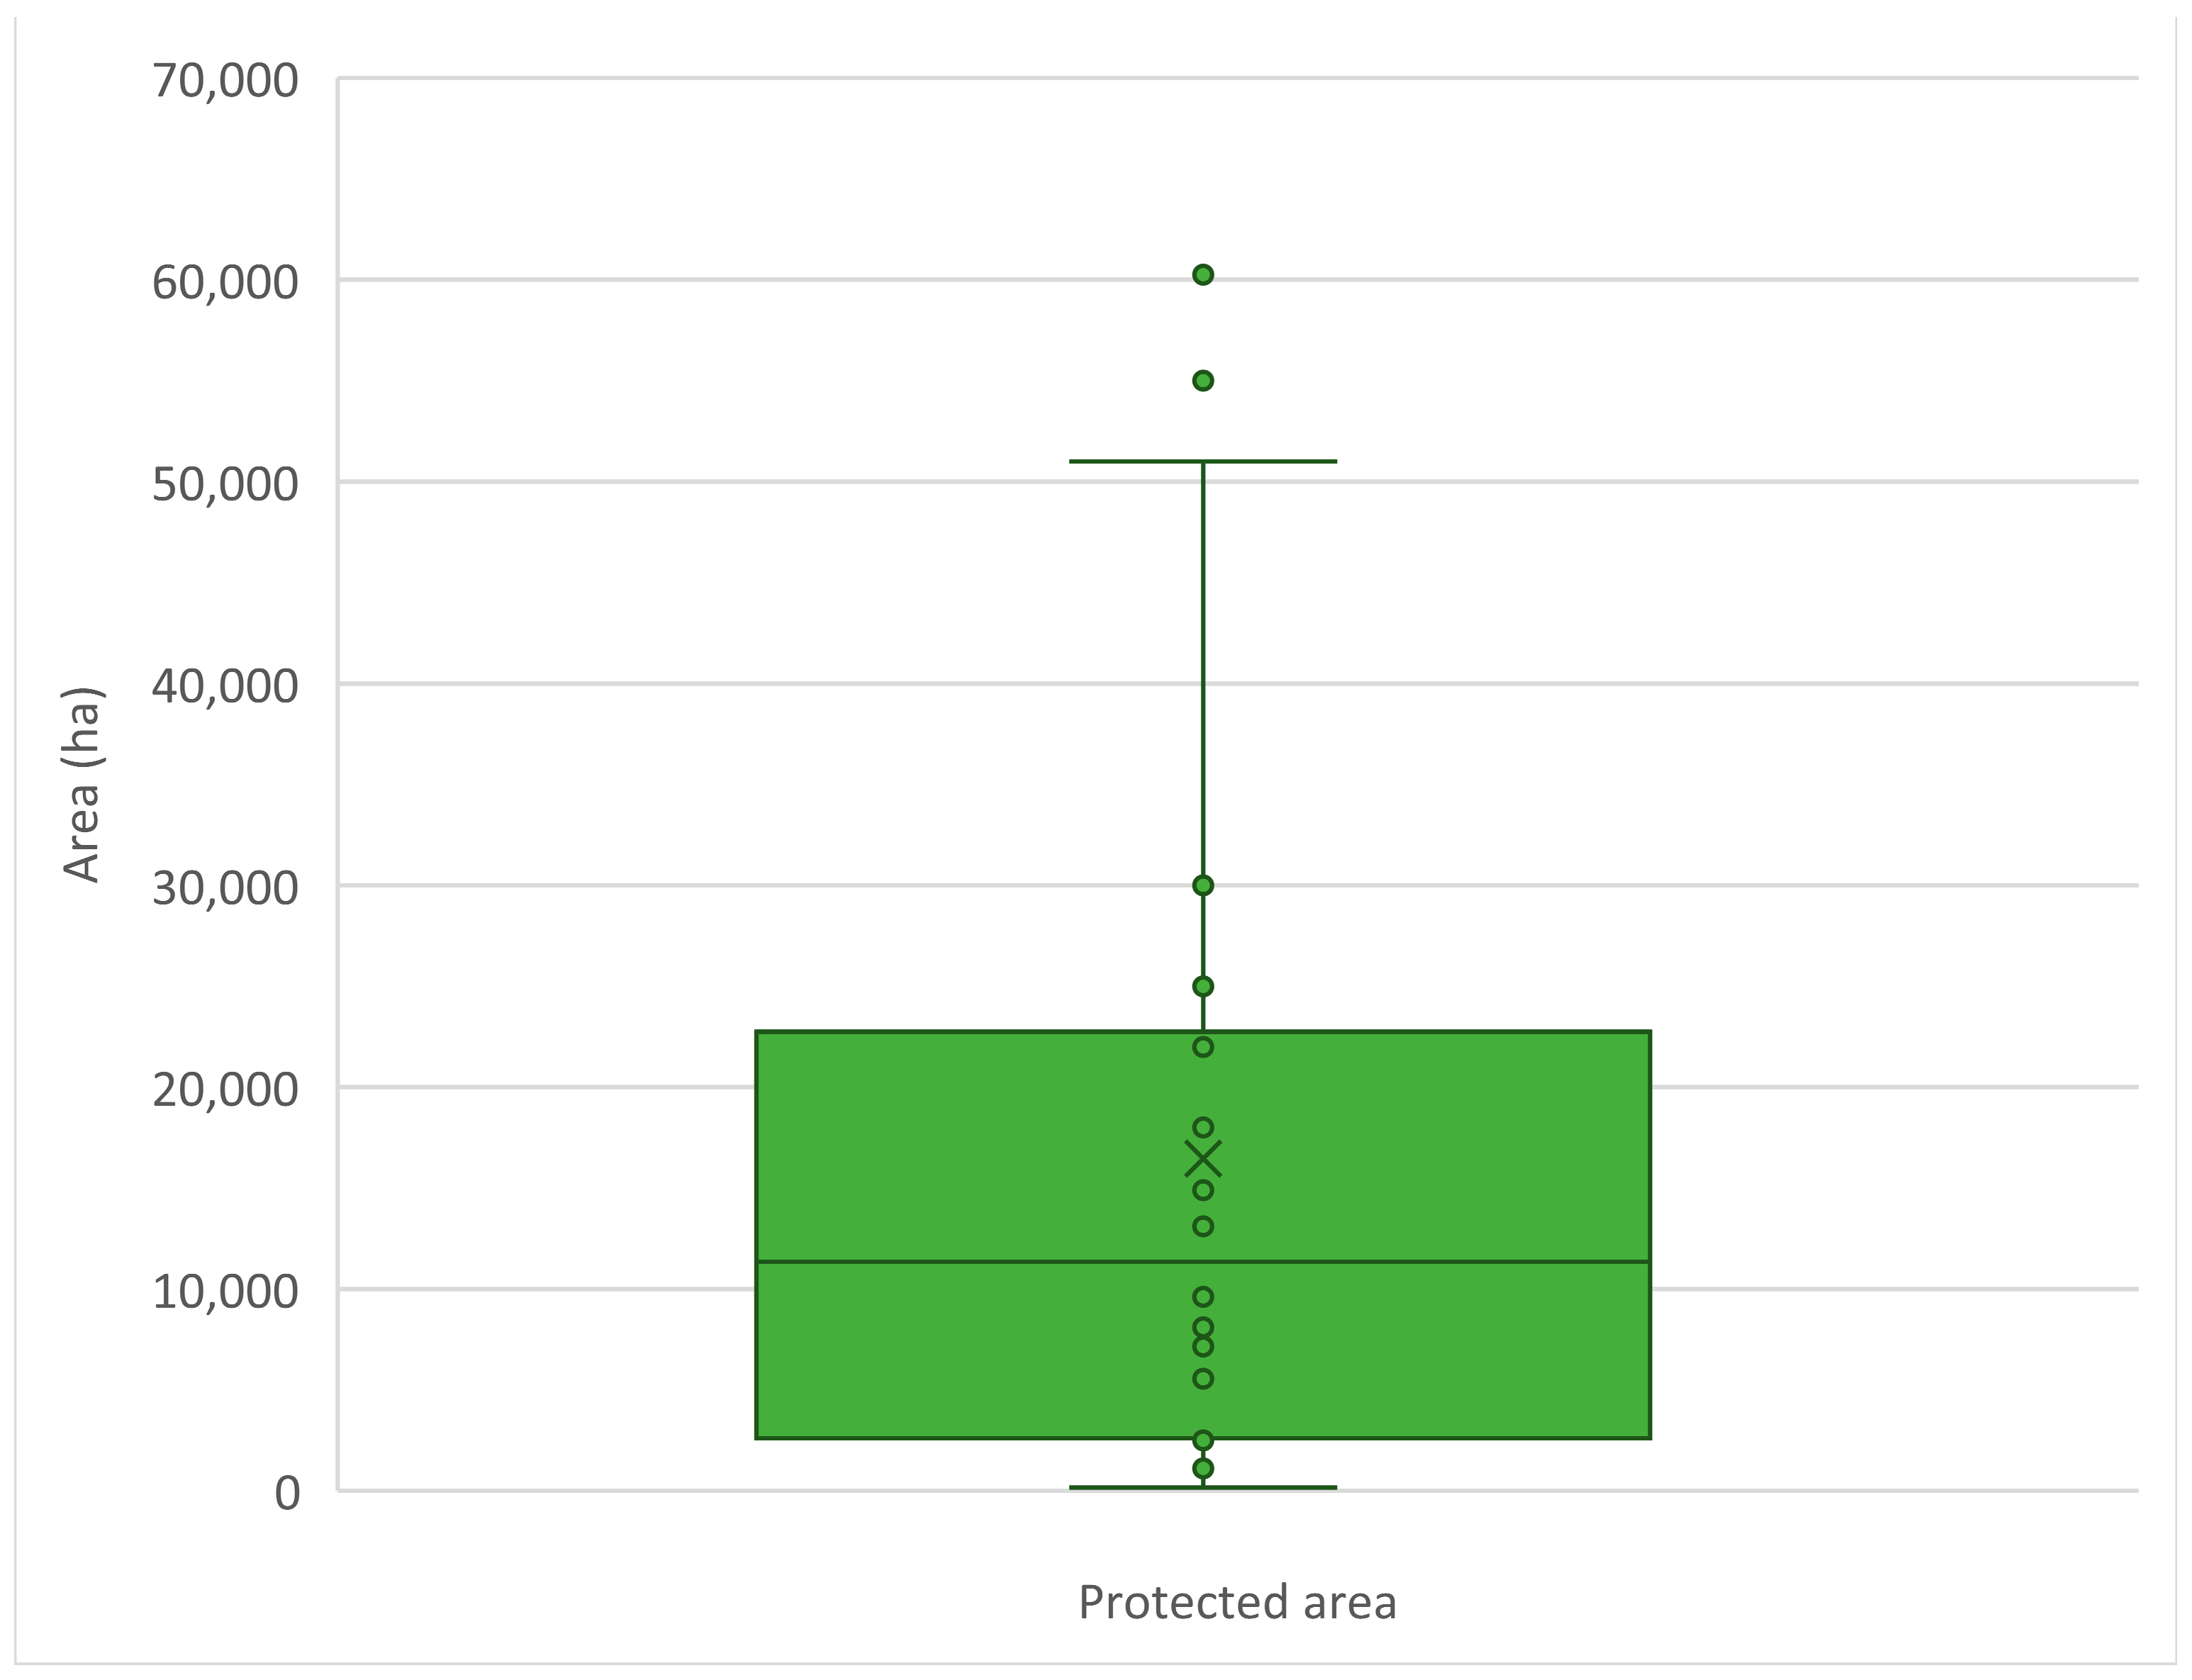
The size of a PA impacts multiple facets of management, from the amount of revenue that can be made off the land (carrying capacity) to the animals that can be placed within its boundaries and the tools that can be used, as indicated by this manager: “
Is there anything that small reserves- and I’m not talking about like 10,000 hectares, I’m talking about 3–4000 hectares- there’s no tool that we can use for that?” PAs in K2C range from just over 100 to 60,000 ha (mean = 16,454.2 ha, sd = 17,470.46;
Figure 7). This adds another layer of complexity to the region and to the management, monitoring and evaluation of the PAs within it.
3.2. Planning for Monitoring and Evaluation in K2C PAs
Here, we focus on the intention of PA managers in K2C to monitor and evaluate management effectiveness and the inclusion of that intention into PA planning.
Ten of 16 (62.5%) respondents noted that their PA management plans contained specific reference to “effective management”, while six respondents noted the term was not referenced at all in their plans. This may indicate that, although some PAs may plan and implement monitoring and evaluation, this may not be directly linked to “management effectiveness”.
All but one of the questionnaire respondents noted that they had a plan to monitor and evaluate the effectiveness of their PA (either a formal monitoring and evaluation plan in writing or they had the intention to start a monitoring and evaluation programme). In the case of the single PA without monitoring and evaluation plans, the PA representative noted that the PA is currently facing multiple start-up challenges, including the presence of cattle farmers on the land, lack of funding to complete infrastructure development, fencing issues, and staffing shortages. This indicates that managers may prioritise certain basic aspects of PA establishment and management before considering the planning and implementation of monitoring and evaluation, as explained by another manager: “Sure, obviously, there’s a lot of stuff we don’t monitor at the moment. That’s just because we don’t have the capacity… And we deal with the most important things at the moment. So roads are fairly important because we had an erosion problem. And then, obviously it was first anti-poaching because that was our biggest problem, then budget, then roads. The vegetation management has started now where we’re implementing fire”. The large proportion of respondents who noted “yes” in our sample indicates a widespread acknowledgement of the importance of monitoring and evaluation in protected area management.
3.3. Implementation of Monitoring and Evaluation in K2C PAs
The sub-section above indicated that the majority of the questionnaire respondents have a plan for, or intend to start, monitoring and/or evaluating their PAs. However, questionnaire responses showed that only nine of 16 respondents (56.3%) actually implemented their plans, indicating tangible challenges and barriers to the implementation of monitoring and evaluation plans in K2C PAs. The PAs that answered “no” to implementation are all disconnected from the GLTFCA PAs and relatively small in size (≤15,000 ha), suggesting that smaller PAs in K2C or those not connected to the BR core or GLTFCA network may either face more barriers to implementation of monitoring and evaluation, or have fewer incentives to implement it. Non-GLTFCA PAs generally (with some exceptions) have less access to funds and are often managed by a single manager rather than a team. They are also not usually mandated to monitor and evaluate their effectiveness, unlike GLTFCA PAs; discussed further in
Section 3.4. These smaller, disconnected PAs could potentially also benefit the most from increased support for the facilitation of monitoring and evaluation. Many of these PAs are located within critical connectivity or water-provisioning areas of K2C.
All but one of the respondents who indicated “yes” to implementation indicated “yes” to the use of a PAME tool. Of the eight PAs that indicated the use of a PAME tool, five (62.5%) indicated that they implemented changes to management after using the tool. One manager selected the option, “Sometimes changes are implemented” in the questionnaire and, in his reasoning, noted that he was a new manager who had not yet been in his post after a PAME assessment. This shows that, in general, the PAME tools are being utilised to improve management in accordance with the adaptive management process. Some PAs, in contrast, may see the PAME assessments as a paper or tick-box exercise, as indicated by one manager during the interviews: “It was just done in totally the incorrect way, and it was just a tick box thing”. Some provincial representatives expressed frustration at staff and resource constraints affecting their ability to appropriately implement changes and follow the adaptive management process: “So the whole system to react is falling apart due to staff shortages and stuff like that”; “we need to move fast to take advantage, because a lot of things are changing around the landscape, but we are slowly changing. But that has to do with the issue of organisational challenges-when it comes to budgeting”.
3.4. Use of Specific PAME Tools in K2C PAs
In addition to the 16 PAs discussed above, insight from two additional PAs was gained from interviews (n = 18), but six of the original PA perspectives could not be corroborated with interview data (i.e., the PA representatives participated in the questionnaire but not the interview). In the case of these six PAs, it is possible that other methods of monitoring and evaluating effectiveness are employed (such as formal or informal biodiversity or other surveys), which may have been omitted from the questionnaires.
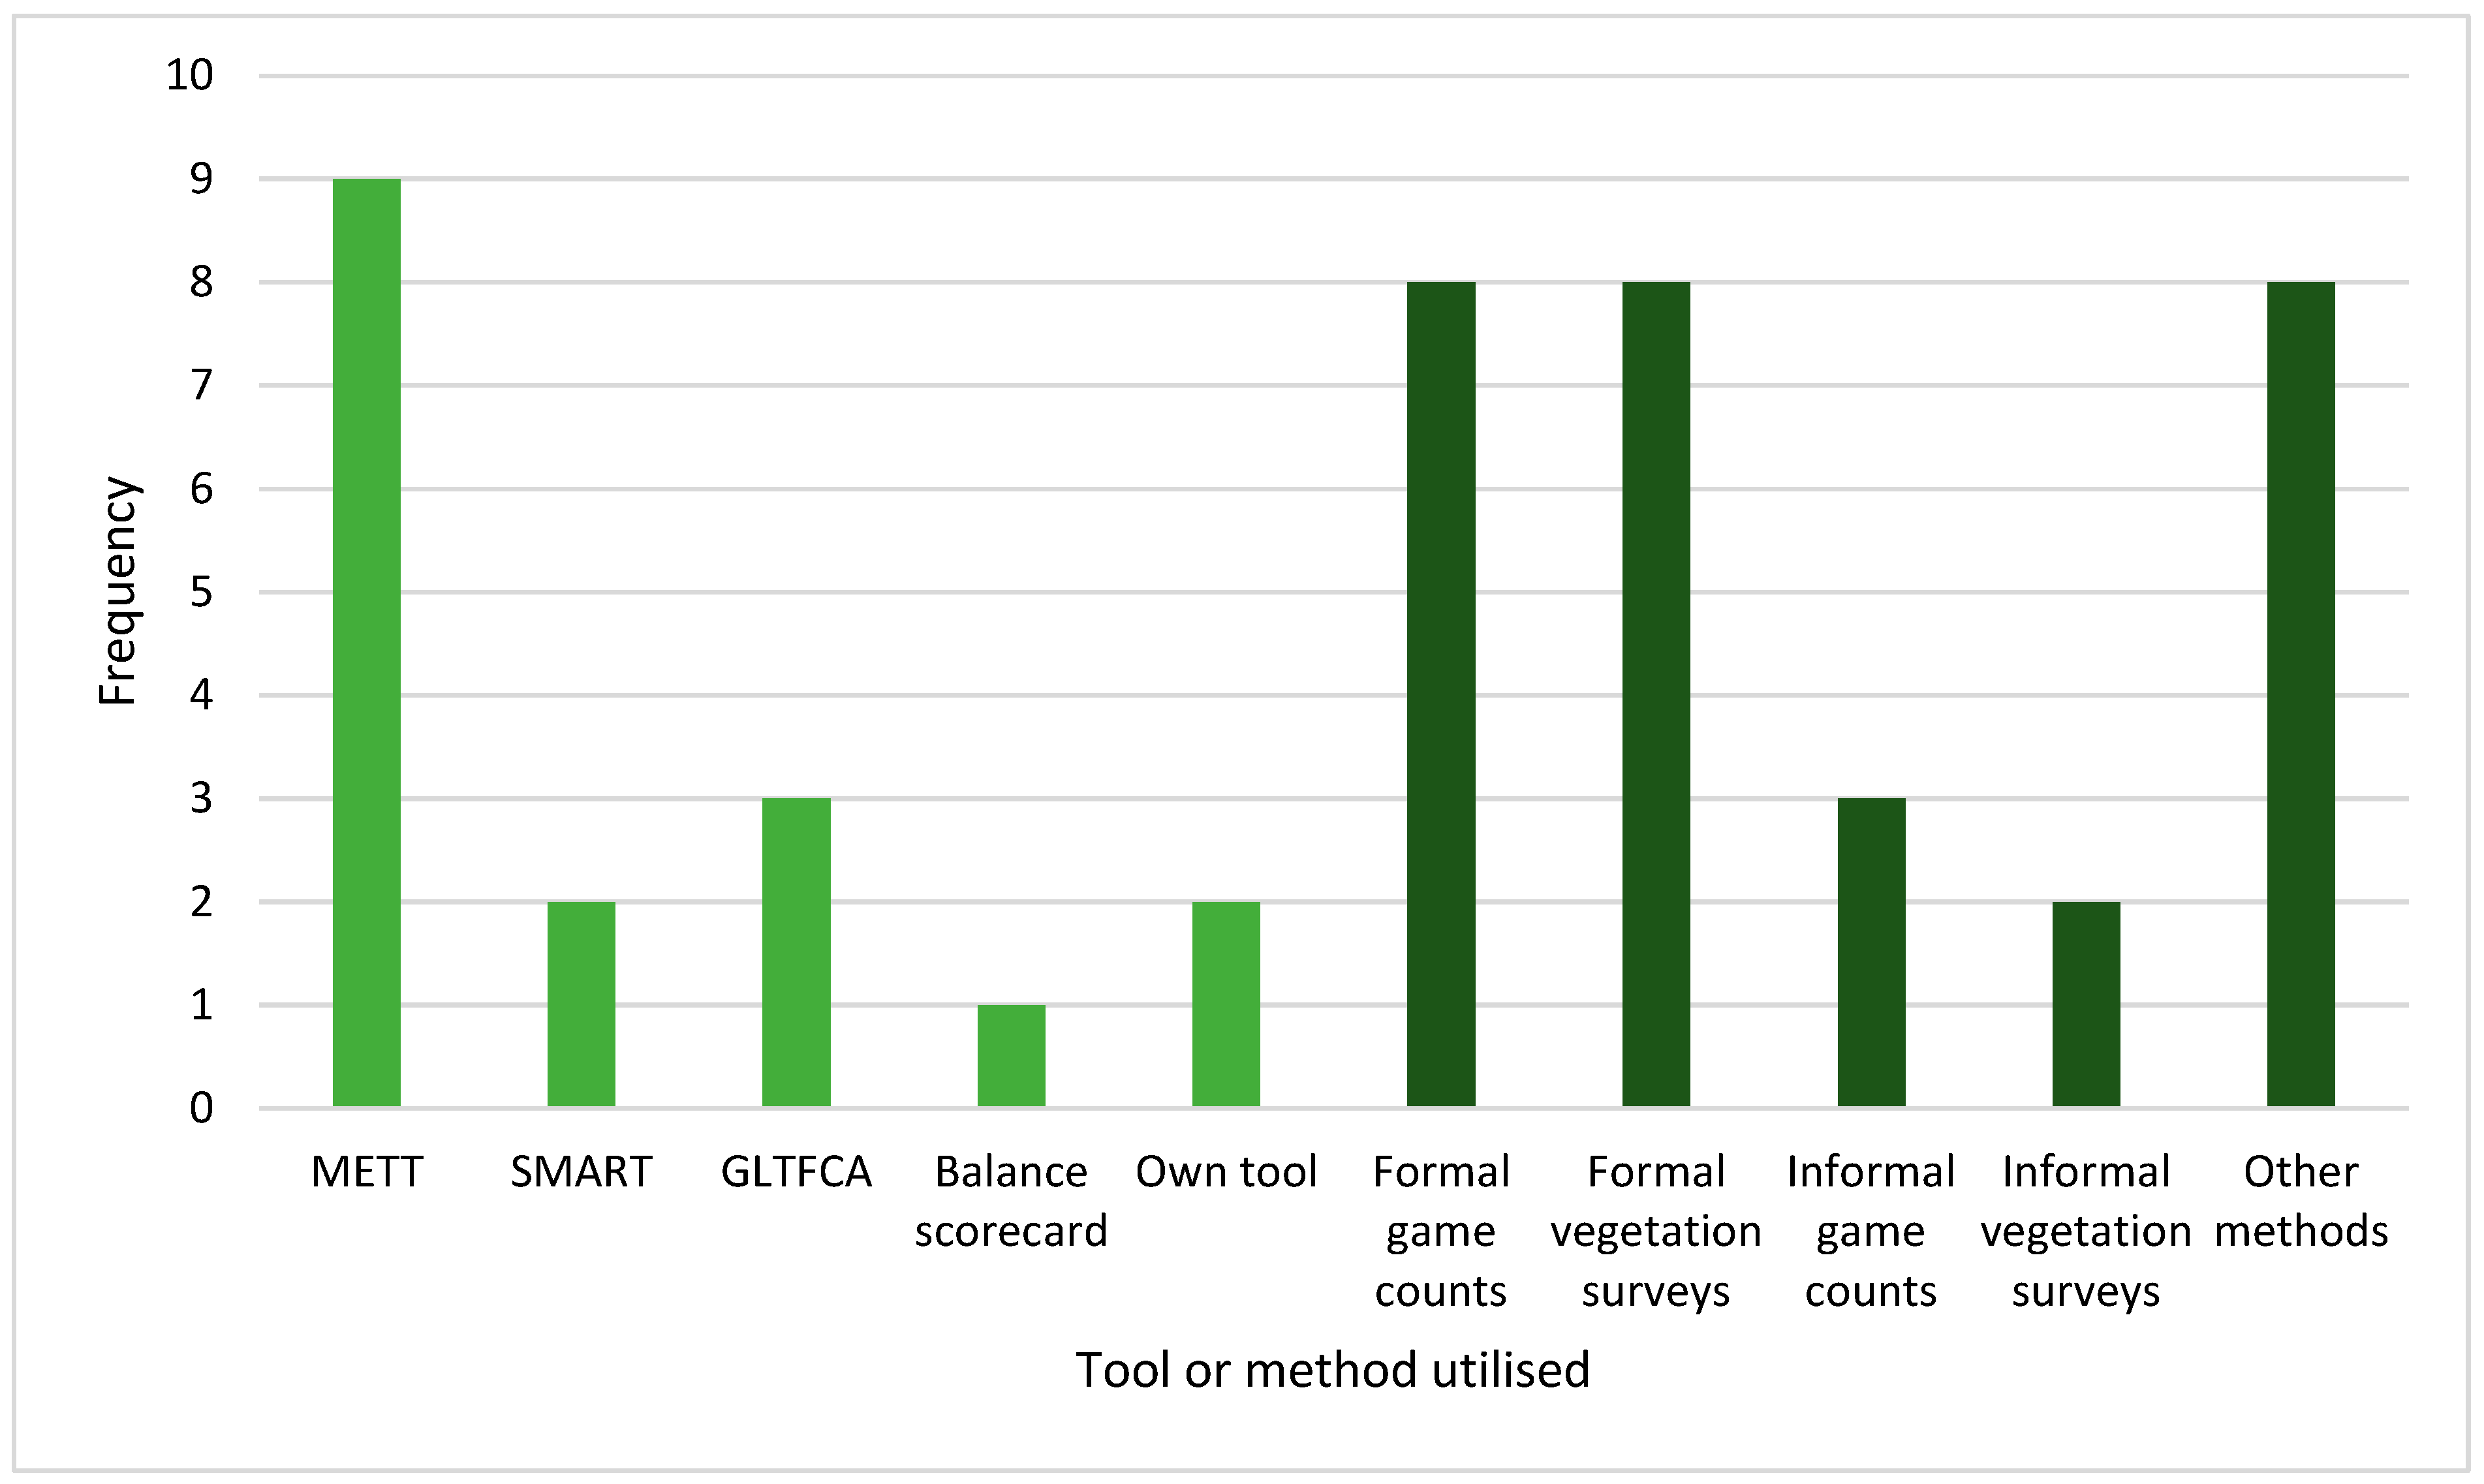
The METT-SA Ver. 3 (a South African version of the METT) is the most widely utilised standardised PAME tool across our sampled PAs in K2C (
Figure 8). All respondents who indicated “yes” to the use of a PAME tool indicated that they utilised METT-SA (Ver. 3). Some PAs within the K2C network (including KNP and those with open borders to KNP) are part of the GLTFCA Cooperative Agreement [
32]. As part of this agreement, those PAs need to adhere to guidelines for PA monitoring, evaluation and reporting, which aim to ensure compliance with legislative and regulatory requirements, create a standardised reporting process and ensure reports are correctly prepared and submitted [
32]. The guidelines give direction to monitoring and evaluation, and reporting of PA management so as to ensure that adaptive management is encouraged, monitoring is relevant and scientific, actions are suitably recorded and reported on, and a level of transparency is ensured [
32]. In order for the PAs to adhere to the guidelines, they implement the METT-SA Ver. 3 to measure management effectiveness [
32]. This process also assists them in adhering to the requirements of South Africa’s National Environmental Management: Protected Areas Act (NEMPAA, Act 57 of 2003) Norms and Standards regarding reporting [
32]. Provincially-managed South African PAs are also required to undertake annual METT-SA assessments in order to comply with South African legislation. These requirements contribute to the high usage of METT-SA in the landscape. However, several representatives of provincially-managed PAs expressed frustration at the implementation and outcome of the METT process, noting that budgetary constraints hinder changes to management once METT results are received: “
But I’m behind with that because of budget constraints and stuff like that”; “
…on a reserve scale, realistically, the managers don’t have the money, so they just say, ah, you know what, METT is not working, it’s too difficult, we don’t have budget, we can’t do anything, we keep on sending requisitions, so METT is just to tick off”.
Three respondents, all of whom are within the GLTFCA network, indicated that they use the GLTFCA Cooperative Agreement reporting template. All signatories of the cooperative agreement are required to complete the report. Two PAs indicated that they utilised the Spatial Monitoring and Reporting Tool (SMART,
https://smartconservationtools.org/, Accessed on 20 March 2023), although, in an interview, one representative noted that he didn’t think the PA was using it yet to its full capabilities, arguing that “
We have to use that more effectively. We have this amazing technological tool, we’re just not using it effectively”. This statement could indicate that there is a need for further training or support in the use of various PAME tools within the BR, which is highlighted again by the general interest and curiosity around the tools expressed by several managers. Two PAs indicated that they use tools of their own design, and one indicated the use of the Balanced Scorecard [
33]. Formal game and/ or vegetation surveys formed the basis of many of the respondents’ monitoring programs, with other methods including informal counts (such as using citizen science or photographic series) and monitoring other biophysical data (e.g., rainfall, temperature, invasive alien plants, erosion). As the methods for carrying out this type of data collection vary, it is not possible to make assumptions around the robustness or accuracy of such data, nor to what extent it genuinely reflects management effectiveness. None of the PAs indicated that management effectiveness or PA effectiveness was monitored through the collection of socio-economic data (outside of socio-economic data that forms part of some of the tools in use). This may be in part due to the relative difficulty of collecting this type of data, as emphasised by one interviewee, “
The hearts and minds of communities and things like that are a lot more difficult to measure, and I think we often fail more than we succeed in this regard”. It may also reflect the general lack of appropriate measures and indicators for socio-economic PA outcomes, even across a variety of PAME tools [
34].
3.5. K2C PA Managers’ Perspectives on Tools
Questionnaire respondents were asked to score PAME tools from a number of perspectives, including their ‘usefulness’, on a scale of one (not at all helpful) to five (very helpful). The mean score was 3.88 (sd = 1.05), indicating a generally positive view of PAME tools, particularly METT, as the most widely used tool in the landscape. Several interview statements supported this sentiment and highlighted the tool’s general availability and utility (
Table 1). Questionnaire respondents also scored PAME tools in terms of ‘tediousness’ on a scale of one (extremely tedious) to five (not at all tedious). The mean score was 3.38 (sd = 1.11), indicating that many respondents felt the tools could be improved in this regard. Finally, questionnaire respondents were asked to choose from several options to describe their perception of the PAME tools they used. Five of eight respondents selected “I like them but I think they can be improved or streamlined” from the presented options. Two respondents selected “I like them”, and one selected “I neither like nor dislike them”. The need for improvement or streamlining of the tools, particularly METT, was supported by interview statements that highlighted weaknesses in its scope, versatility and potential bias (
Table 1). Reference was also made to the need for improved socio-economic indicators, which are becoming increasingly important in the K2C region (
Table 1). One interviewee, a newly appointed manager who had not yet undertaken the METT, noted that although he thought the METT would be useful, the lack of capacity in his PA created a barrier (
Table 1). Some interviewees expressed sentiments that METT-SA is being under- or misused in individual PAs or that its use should be underpinned by certain caveats (
Table 1). This opinion came across particularly strongly for provincial PAs. In general, while the overall response to PAME tools—METT in particular, but also the GLTFCA Cooperative Agreement reporting template and SMART—was positive, the underlying message was that there is a need to improve or streamline them.
Several PA representatives mentioned that they do not use the METT (or other PAME tools) due to specific time and resource constraints, particularly for smaller, younger PAs: “
It’s a time issue”; “
The biggest problem with that is getting people to spend money on it, when they’re used to getting it for cheap”; “
It’s just too much admin, there should just be more practical stuff happening”; “
A lot of us that work in the bush are kind of scared of admin”; “
So if I was to take another month to do something else that’s going to compare stuff, there would have to be a massive difference in how we do management to get that done, because I just don’t have time”. One new manager of a large reserve who had not yet undertaken METT also noted capacity constraints. Time, money and administrative burden were highlighted as issues that may preclude certain PAs from utilising METT or other PAME tools. This is a reflection of global challenges currently facing PAs, which are expected to increase with the new CBD target [
29,
35,
36], particularly concerning conservation spending, which can be utilised to improve capacity and resources, and has been linked to biodiversity persistence within PAs [
37].
However, some interviewees expressed interest, curiosity, or excitement towards using PAME tools, including METT, in the future: “
Absolutely [would consider using some of these tools].
I would like to start putting EarthRanger (https://www.earthranger.com/, Accessed on 20 March 2023)
into place now already”; “
I think that’s excellent… It’s coming, it’s coming (regarding the use of METT in future)”; “
No, we would use a tool. Because obviously, at the moment, instead of having everything in one place, it takes me days to compare data, it’s painful”.
Our findings indicate that there may be an opportunity to develop a PAME monitoring tool that is more accessible to PAs with fewer resources, i.e., a quicker, simpler, and less resource-intensive tool. Such a tool could potentially be utilised in the early stages of PA establishment and could later be replaced by one of the established tools that evaluate PAME in more detail but requires more time, effort and understanding from the management team. The development of a resource-effective tool could be beneficial to other regions, particularly in light of findings indicating that only a small percentage of PAs globally are adequately funded and resourced [
29,
35]. This should be underpinned by training and/or facilitative support in order to ensure that maximum benefit is derived from the use of such tools. Training or facilitated sessions may also present an opportunity to increase the collaboration and communication between PAs, a theme which we return to in
Section 3.6. There is also a need to continually refine and streamline the tools in use, e.g., the METT. It would be beneficial to continue this streamlining process in consultation with the managers and networks or conglomerates (such as provincial networks or the GLTFCA PAs) who utilise these tools. A particular focus on the social–economic elements of the METT may improve its usefulness for South African PAs going forward.
The creation or use of PAME tools in itself is not enough to improve PAME, and some managers expressed frustration over having the tools to identify challenges but no resources to rectify them: “
the only discouraging part is when you complain about the same thing all over again, that needs funding, and you don’t get buy-in or assistance”. This is of particular concern to provincial PAs but applies to many other PAs as well and, to reiterate, is an issue faced by PAs across the globe, not only those in K2C [
29,
35]. This highlights the importance of improving funding and resource availability for PAs alongside the development of monitoring and evaluation techniques. Recent studies quantifying global PA personnel found that numbers fell far short of what is required and suggested that these shortages are a major factor contributing to management effectiveness deficiencies [
29,
35]. The studies suggest that if this issue is not adequately addressed, it could compromise progress towards achieving the aims of Target 3 of the GBF [
29,
35]. Another study, which examined over 2000 PAs, indicated that less than 25% of PAs reported adequate budget or staff [
29]. A continual lack of resources may lead to continued or intensified habitat loss and degradation within PAs, which are often the last refuge for biodiversity [
38,
39]. Additionally, it has been shown that increased funding can assist PAs in their mandate to protect biodiversity [
37]. Therefore, when considering how PAME can be improved, the challenge of under-resourcing cannot be over-emphasised in order for managers to be able to enact changes and improvements based on the results of monitoring and evaluation. Furthermore, provincially managed PAs in K2C (and South Africa in general) are accountable to several tiers of government and may face challenges as a result of this administrative complexity. PA management is not confined to PA boundaries but requires systemic action to reduce corruption, strengthen law enforcement and improve stakeholder engagement [
36]. Issues such as these, where governance systems in highly complex and dynamic systems are not adapted to properly facilitate the adaptive management process, persist throughout the world and create barriers to implementation of adaptive management, including monitoring and evaluation processes [
40].
3.6. Perspectives on the PAME Process in K2C PAs
Several participants expressed the multi-faceted value of communication concerning adaptive management, indicating that informal communication was as valuable (if not more so) than formal communication: “I mean, yesterday’s meeting was just-so the networking that you do with colleagues, and finding out what they’re doing, and helping each other-it was a great day”; “…we did the joint METT review which, like I said, it was big value. And I think in the discussions around coffee afterwards, everyone started talking around the solutions”; “We have a conservation think tank WhatsApp group where we share all our stuff and what we’re doing, and stuff like that… have a chit chat, share ideas, what’s working, what’s not working.” Many participants emphasised the importance of sharing lessons learnt regarding management and how doing so could save time and/or money: “I don’t think we share enough the lessons learnt specifically around management”; “I work quite closely with [neighbouring PA], so if we try something and it doesn’t work, I get together with them and say, listen, it didn’t work because of this”; “And it’s something that’s very helpful because when we discuss it on that level, you get to know how other people are doing it on their site. More especially in areas where you might be struggling”; “When we share information of how you are doing it, you are probably saving costs for someone else. And time as well”. One manager expressed the belief that improved communication would be the start to improving adaptive management in the system: “There’s ways to still improve the situation, and that’s just by starting with information sharing.”
The PA network in K2C would likely benefit from increased connectivity, communication and collaboration between PA managers to encourage the sharing of experiences and lessons learned. Social learning is an important element of the adaptive management process, and the complexity of social learning is often underestimated [
8,
9]. In particular, connecting new managers or managers of smaller, more isolated PAs to more experienced managers or managers in well-connected, large, or centrally located PAs - perhaps through the use of forums - may encourage social learning and improved effectiveness in the network. This underlines the idea that the process of PAME evaluations, including a variety of stakeholders and the availability of results, is sometimes of greater importance than the methodology chosen [
41]. Open communication, diverse participation, various knowledge sources, extended engagement, and facilitation can encourage social learning [
42]. Our findings indicate that the K2C system has an opportunity to improve social learning as the PAs within its boundaries represent diverse participation, and the K2C organisation structures are already in place to assist with facilitation. Lessons learnt in the K2C context could be shared with other South African and African BRs.


