Perspective

A Conceptual Framework for Biodiversity Monitoring Programs in Conservation Areas

1
UNESCO Chair on Sustainable Management of Conservation Areas, Engineering & IT, Carinthia University of Applied Sciences, Europastraße 4, 9524 Villach, Austria
2
School of Geography, Planning, and Spatial Sciences, University of Tasmania, Rm. 439 Geography Building, Sandy Bay Campus, Hobart, TAS 7000, Australia
3
Scientific Services Skukuza, Kruger National Park, Private Bag x 402, Skukuza 1350, South Africa
4
Ministry for Primary Industries, P.O. Box 2526, Wellington 6140, New Zealand
5
E.C.O. Institute for Ecology, Lakeside Park B07b, 9020 Klagenfurt, Austria
6
NaravaNarave d.o.o., Pod kostanji 44, 1000 Ljubljana, Slovenia
*
Author to whom correspondence should be addressed.
Sustainability 2023, 15(8), 6779; https://doi.org/10.3390/su15086779
Submission received: 10 March 2023 / Revised: 9 April 2023 / Accepted: 14 April 2023 / Published: 17 April 2023
(This article belongs to the Special Issue Emerging Challenges to Protected Areas Management)

Abstract

:
Maintaining and improving the state of biodiversity is a primary factor guiding management activities in conservation areas, including protected areas (PAs) and other effective area-based conservation measures (OECMs). Due to the complex nature of conservation programs, a common management approach cannot be prescribed. Robust monitoring programs supporting management activities are required to evaluate the state of species and habitats. However, limited resources, poor data management practices, and competing requirements of stakeholder groups increase the challenges that must be addressed through realization of monitoring programs. We propose a framework of seven basic questions to guide conservation area managers to implement effective biodiversity monitoring techniques. The result is identification of indicators, site characteristics, and resources to promote the development of a biodiversity monitoring program. We call for adoption of a strategic guideline providing this framework to harmonize decision making processes across national and international networks. Implementation of this robust framework will support comparative monitoring data, contributing to systematic approaches for adaptive management in PAs and OECMs and improving the body of knowledge surrounding global biodiversity.

1. Introduction

Conservation areas include protected areas (PAs) and other effective area-based conservation measures (OECMs) that are key refugia for global biodiversity. Land managers utilize biodiversity monitoring as the primary tool for determining the effect of measures designed to maintain or improve the state of biodiversity. In the field of biodiversity conservation, a great volume of work has been dedicated to important issues of governance, methods on how to conduct biodiversity monitoring, and evaluation of results [1,2,3,4,5]. To standardize approaches for biodiversity monitoring on the global scales, frameworks on biodiversity monitoring have been elaborated [6,7,8]. These earlier frameworks fulfill specific purposes and target institutional or research actors. However, with nearly 300,000 PAs and OECMs worldwide [9], a structured developmental process is clearly needed for development of a monitoring framework that meets today’s significant challenges. Faced with potential long-term personnel turnover, a lack of consistent funding support, and weak scientific output following an often-insufficient number of monitoring cycles, this article is intended to provide an important complement to previous works by targeting on-the-ground users of biodiversity monitoring systems. We structure the decision making processes through a four-step approach to developing and conducting biodiversity monitoring programs. The following structured monitoring framework addresses the key considerations that managers must make in developing effective biodiversity monitoring programs and provides a precise roadmap for developing new programs.
We first provide a brief overview on the current state of global biodiversity and the recent history of international strategies designed to improve it. The remainder of the article describes in a step-by-step manner our four-phase approach to designing biodiversity monitoring programs, with particular emphasis on six questions related to the conceptual phase of each program and a seventh question related to the implementation phase.

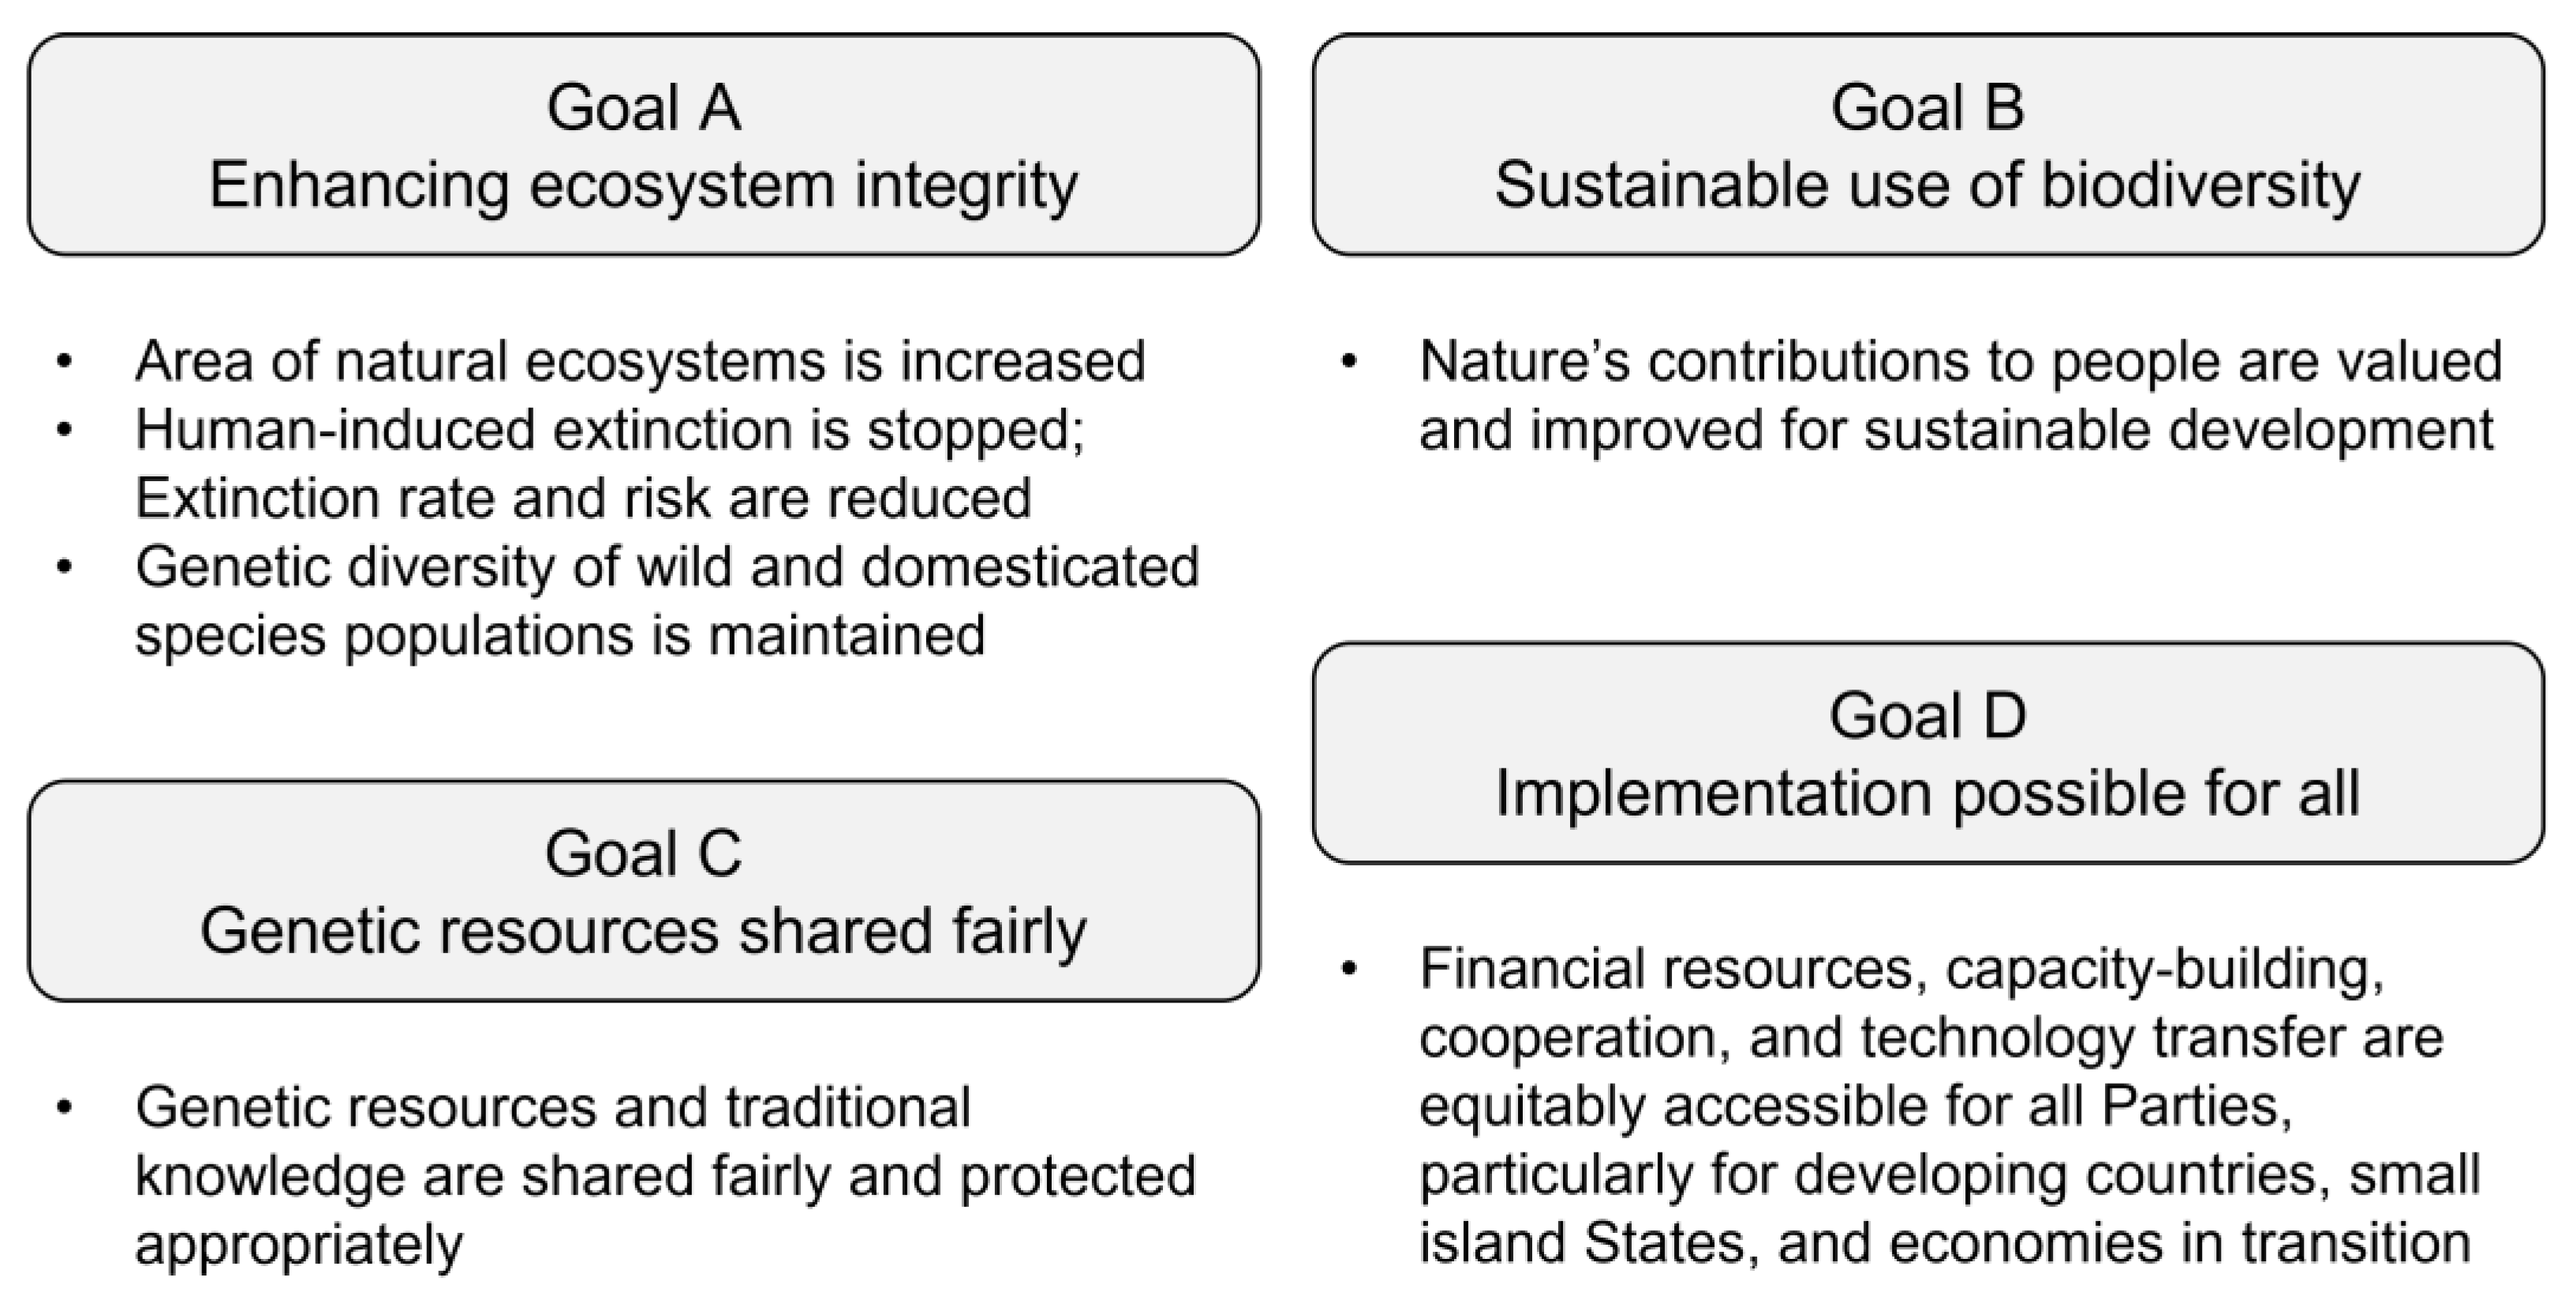
2. State of Biodiversity

The state of biodiversity continues its global downward trajectory despite intergovernmental policies intended to preserve it [10,11]. The ratification of the Convention on Biological Diversity (CBD) in 1993 was a landmark achievement that outlined the need for the global protection of biodiversity. The CBD contains three relevant foci, including conservation of biodiversity, sustainable use of its components, and fair and equitable sharing of biological resources [12]. Biodiversity refers not only to incidence, abundance, or genetic characteristics of species in the ecosystem, but also to levels of interaction between and amongst species [13]. The benefits of biodiversity conservation are indisputable; however, inadequate outcomes following ratification of the CBD led to the development of the CBD Strategic Plan for Biodiversity from 2011–2020. The Strategic Plan included 20 so-called Aichi biodiversity targets to halt biodiversity loss, conserve ecosystems, and sustain ecosystem services. Aichi Target 11 called for at least 17% of terrestrial areas and 10% of coastal and marine areas to be conserved worldwide, while Aichi Target 17 called for all signatories to develop National Biodiversity Strategic Action Plans (NBSAPs) [14].
To date, efforts to reach Aichi targets have not been sufficient to protect the global state of biodiversity, let alone improve it [15]. In 2022, the 15th Conference of the Parties of the CBD culminated in a revision of many global biodiversity objectives, as expressed in the landmark Kunming–Montreal Global Biodiversity Framework (GBF) [16]. The GBF incorporates a Theory of Change model to support policies promoting sustainable development goals. A Theory of Change is an outcome-based strategy that describes a pathway to transform the status quo in short-, medium-, and long-term perspectives [17]. Given the urgent global threats associated with erosion of biodiversity, the GBF Theory of Change attempts to address the drivers of biodiversity loss, allowing the recovery of all ecosystems and promoting the CBD vision of living in harmony with nature by 2050 [16]. The GBF strives to reach four main goals by 2050 (Figure 1). To meet the goals, 23 targets are partitioned amongst three themes: (1) reducing threats to biodiversity; (2) meeting people’s needs through sustainable use and benefit-sharing; and (3) tools and solutions for implementation and mainstreaming. Target 2 of the new agreement calls for the restoration of at least 30% of degraded terrestrial, freshwater, coastal, and marine ecosystems. The GBF further mandates in Target 3 that global networks of PAs and OECMs protect and effectively conserve at least 30% of the planet with focus on particularly valuable areas for biodiversity. PAs are conservation areas in which the primary management objective is active conservation of biodiversity, whereas OECMs are managed for other purposes with in situ conservation of biodiversity being a key by-product of management [18]. Supporting the objectives of the GBF, the United Nations Agenda 2030 is implementing an ambitious set of 17 Sustainable Development Goals (SDGs) intended to be achieved by 2030 [19]. Among others, SDG 14 “life below water” and SDG 15 “life on land” are of particular relevance to guiding the conservation and management of biodiversity.
As biodiversity remains under threat, much work remains to be completed [20]. It has long been recognized that management effectiveness is essential to conservation of key habitats and species. In PAs and OECMs, management effectiveness is generally evaluated using specially tailored Protected Area Management Effectiveness (PAME) reporting tools [21]. Efforts to encourage improved management effectiveness are being further incentivized through initiatives including the IUCN Green List of Protected and Conserved Areas Standard [22]. The Green List Standard identifies four categories that must be fulfilled in order for sites to reach the elite Green List status. All themes are applicable globally and include good governance, sound design and planning, and effective management leading to realization of conservation objectives. The Green List Standard allows for customization of locally important indicators, such as endemic species or rare habitats, empowering site-specific management for successful conservation outcomes [23]. Additional approaches to PA management and evaluation—including ambient monitoring, management assessment, and impact evaluation—may provide additional linkages in advancing a PA toward attaining Green List status [24].
Effective action leading to successful conservation outcomes can be made using an adaptive management approach. Adaptive management is a decision making process that enables improved resource management by accounting for uncertain and unpredictable dynamics in the biological system [25]. Changes in the state of monitored populations or ecosystems might only be apparent after a lag period following changes to a management activity [26,27]. Thus, adaptive management decisions are most effective when guided by observations from well-designed long-term monitoring programs. Monitoring programs are based on specific management objectives and monitoring is, therefore, established as a process of systematic, repeated observation of a feature over time to describe its state or detect changes [28]. Monitoring objectives can include complying with regulations, responding to an event or action, or evaluating management outcomes. Monitoring of key indicators is the primary mechanism to track the state of biodiversity at a site. Based on the selected indicators, monitoring may occur on landscape, ecosystem, habitat, species, population, or genetic scales.
The urgency of achieving improved conservation outcomes is expressed in the text of current international agreements, including the GBF [16]. Protected area networks are growing in size and scope worldwide and further increases will occur for decades to come. The demand for effective biodiversity monitoring already exceeds the capacity of expert-based monitoring. Use of high-throughput automated monitoring technologies is a solution that will help PAs and OECMs conduct accurate and rapid biodiversity assessments while reducing the need for expert-based fieldwork (Figure 2). In many cases, well-designed citizen science-based projects can track the changes of key biodiversity measurements, leveraging the abilities of today’s automated monitoring technologies with the enthusiasm of volunteer assistance, including, among other platforms, iNaturalist, https://www.inaturalist.org/ (accessed on 18 November 2022) and eBird, https://ebird.org/home (accessed on 14 November 2022) [29]. Citizen science programs and sensor-based technologies may generate large volumes of data that can be interpreted through artificial intelligence algorithms. These approaches provide, on the one hand, opportunities to improve scientific observation of ecosystems despite potential deficiencies of human resources or expertise. On the other hand, reliance on big data introduces challenges, such as the requirement for efficient information technology and reliable database management [30]. Modern molecular techniques allow assessment of species and habitats over large areas of PAs and OECMs by using non-destructive sampling. Well-planned environmental DNA collection campaigns can be performed rapidly by trained staff or volunteers [31]. Genetic sequences can be deposited in online databases, providing a permanent record and allowing present-day and future analysis on species composition. Most PAs and OECMs will not have the capacity to analyze DNA samples in-house; thus, outsourcing to specialized laboratories needs to be considered during budgeting and planning.
Standardization of indicators across PA networks must be prioritized to allow cross-comparison of findings in a scientifically valid way [32,33]. The Group on Earth Observations Biodiversity Observation Network (GEO BON) has developed a framework to standardize monitoring approaches that consists of 21 essential biodiversity variables (EBVs) across six classes (Table 1) [34]. EBVs complement other essential variables used in monitoring, including the essential climate and ocean variables [35,36]. The EBVs seek to measure environmental or species characteristics that could guide managers when selecting indicators. Indicators should be simple to monitor, especially with regard to the technological and financial resources available to the management program. Indicators should also represent important spatial and temporal scales of the observed biological system and contribute to a common framework that is applicable across ecosystems [37]. The EBVs are a key component to allowing scientists to evaluate the status of indicators that help determine whether the GBF reaches its objectives because they facilitate sound management planning for successful conservation outcomes.
The EBVs proposed by GEO BON mark an important development in the standardization of monitoring protocols because they outline common factors that should apply to the monitoring of indicators for most PA and OECM management programs. However, EBVs only address part of the decision making process. Below, we describe a four-step framework that PA and OECM managers may use when developing a monitoring program (Figure 3). The steps involve gathering site-specific background information in the preparatory phase, considering the key logistical questions in the conceptual phase, conducting the monitoring activities in the implementation phase and, finally, by assessing whether the monitoring program has met its objectives in the re-evaluation phase. The framework is intended to act as a road map to consider all important factors in developing a biodiversity monitoring program. It helps to reduce complexity by compartmentalizing the essential considerations. By following the proposed framework, managers can, therefore, develop a monitoring program for site-specific objectives and obligations.

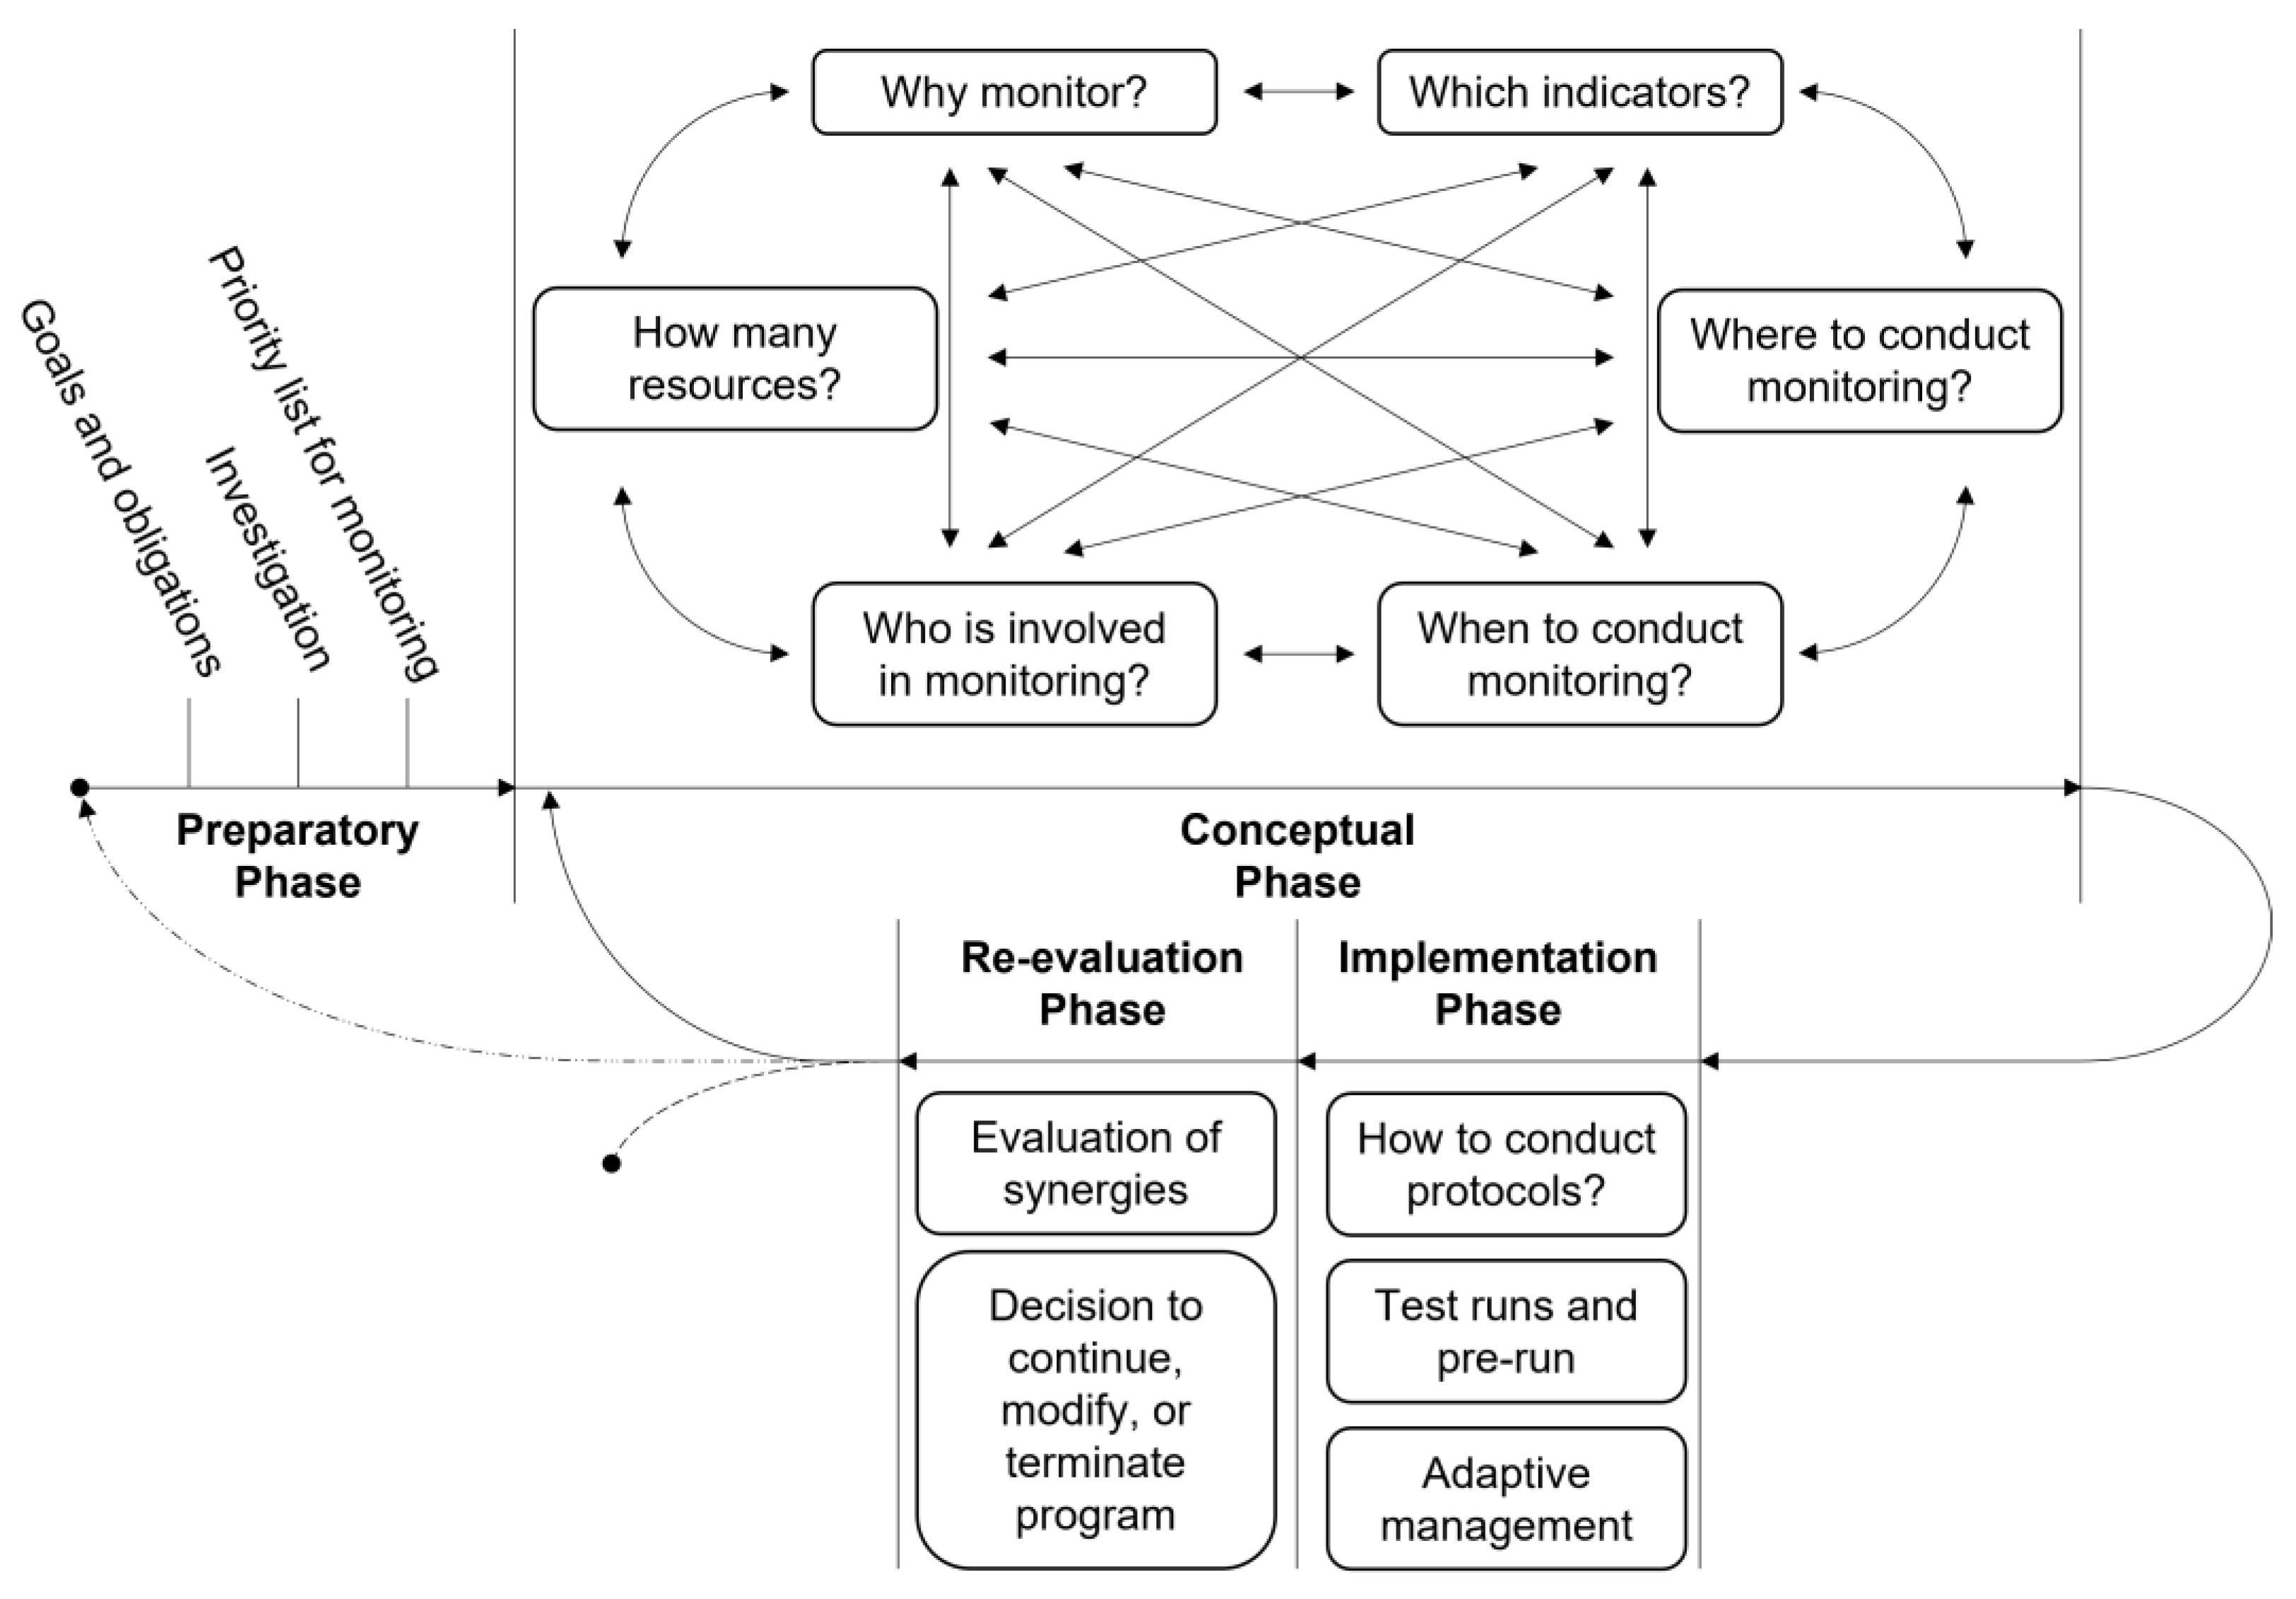
3. Developing the Monitoring Framework

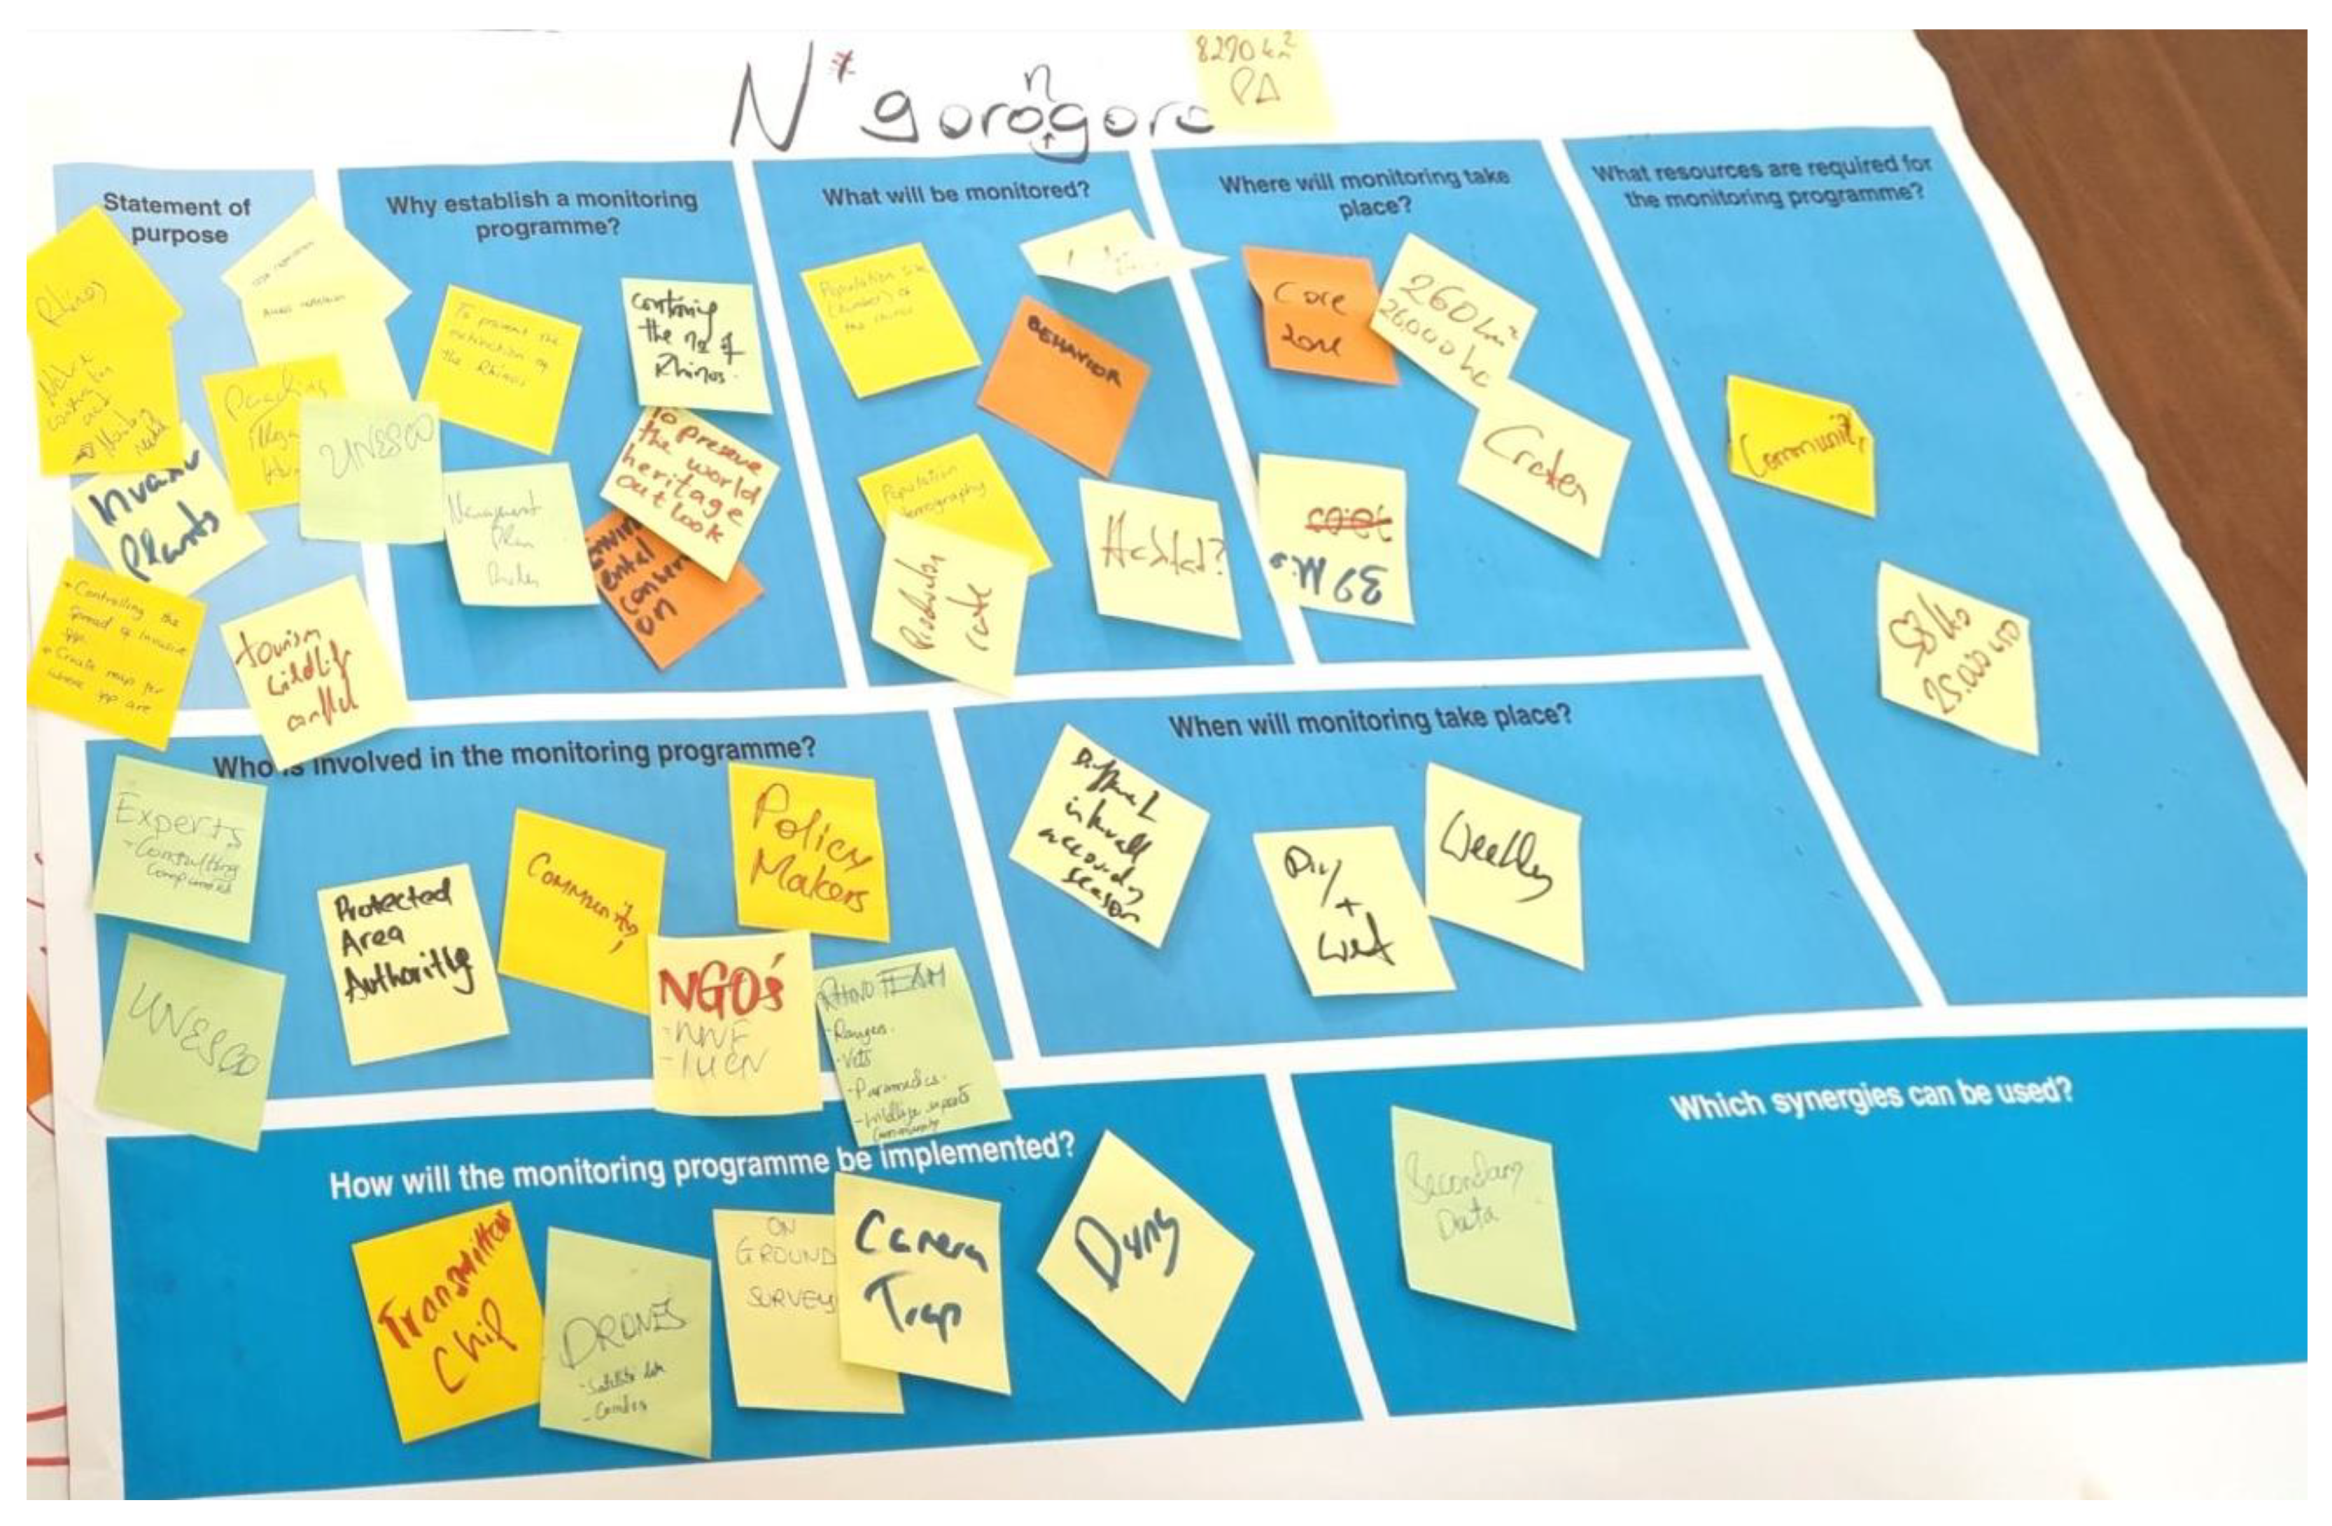
3.1. Preparatory Phase: Identify and Prioritize Monitoring Targets

The first step in the framework is to prioritize a list of monitoring targets. This list is generated through assessment of legal obligations, site-specific goals including major site values, and a background analysis of the site including the threats facing it. Monitoring targets will most often be species or habitats of high conservation value but may, in some cases, be surrogate variables acting as proxy indicators of the key biotic features. Diverse resources can be used in this step, including referencing the categories of EBVs, previous site biodiversity management plans, baseline inventories, IUCN and national Red List status lists of species, and evaluation of sensitive habitats. Integration of methods that are used in other sites—particularly Green List status sites or those that are part of an NBSAP—is another valuable approach [38].
The preliminary site assessment should help the management body develop a brief summary of the objectives guiding the monitoring program, along with a description of how the monitoring program will evaluate the conservation activities on key species and habitats, considering threats, previously defined site objectives, and obligations.

3.2. Conceptual Phase: Produce the Conceptual Framework

The conceptual phase of monitoring program development will identify the participants, methods, and technologies that will be involved in the subsequent field implementation phase. Effective long-term monitoring programs are developed through reflection on the fundamental questions of the conceptual phase [39]. Compartmentalizing the key questions allows managers to consider factors individually, minimizing the complexity of each topic. Questions can be revisited over the course of discussions with stakeholders and the PA staff (Figure 4). The six key questions of the conceptual phase are:
  • Why monitor?
  • What indicators should be included?
  • Where will monitoring take place?
  • When will monitoring occur?
  • Who will be involved?
  • How many resources are required?

3.2.1. Why Monitor?

To stem the biodiversity crisis, management activities must result in successful conservation outcomes. Clearly defined management objectives and biodiversity protection targets are required from the start [39]. An analysis of main site conservation requirements, as identified in gazettement paperwork, site assessment reporting, and legal obligations, can guide the monitoring objectives. Monitoring a species or habitat of value is one of the primary activities contributing to adaptive management strategies [25,40,41]. The obligations from international strategies, relevant NBSAPs, conventions, and policy frameworks usually justify the main purposes of a biodiversity monitoring program. Standardization of monitoring approaches is particularly valuable in national or regional networks to enable cohesive policy decisions [8,32]. Site-specific goals may further direct monitoring programs [42].
Biodiversity monitoring is a multi-functional approach that may contribute to baseline research, site management, and documentation of the state of habitats and species [41,43]. In PAs, performance measurement is used for identifying achievements toward reaching the targets outlined in the management plan, thereby contributing to program accountability and adaptive management [24]. Performance measurement can, conversely, direct changes in the management plan by showing where conservation efforts can be improved [44]. Outcomes measured through PAME reporting can be compared to the expected outcomes to determine the effect of the management strategy. Outcomes can also be framed in the context of counterfactual thinking, i.e., what the outcome would be in the absence of the management activity. Biodiversity monitoring should promote operative conservation or enhancement of the site. Furthermore, it could be an effective mechanism for outreach and education, ensuring program acceptance and long-term support from local stakeholders and non-scientists [45,46].

3.2.2. What Indicators Should Be Included?

A monitoring program must survey appropriate indicators to ensure that management activities help meet the desired conservation objectives. A widely accepted framework for indicator selection is based on the SMART principle: a suitable indicator must be Specific to the goals of the program; Measurable with objective evaluation; realistically Attainable for monitoring; Relevant for decision makers; and contain Time-bound elements to allow periodic interpretation of data [47]. Monitoring programs should include assessment of target habitats because the state of the habitat may be correlated with the performance of a key indicator species [48]. Selection of indicators depends on the scope of the biodiversity conservation targets, including the legal reporting requirements. Well-chosen indicators should allow programs to meet local goals while meaningfully contributing to integrated national and global efforts (e.g., Bellingham et al. [32]).
Measuring physical parameters, such as species richness, abundance, incidence, or health, is typically the simplest and most direct way of monitoring in PAs and OECMs. Trends of indicator species can be tracked in space and time, generating information on their conservation status. These types of measurements could allow inferences on population trends and how to mitigate threats [37]. In some cases, the ease of monitoring proxy variables may facilitate management goals. Key trade-offs exist through examining a proxy rather than monitoring species directly, including compromised accuracy of measuring the species directly, uneven responsiveness of the proxy to actual change, and oversimplification of the ecosystem [49,50].

3.2.3. Where Will Monitoring Take Place?

Recognizing the management objectives will help managers select the appropriate spatial parameters for a monitoring program. Selecting a representative Area of Interest (AoI) is key to effective site-based biodiversity monitoring. The first consideration is whether the AoI is accessible for monitoring purposes. In many instances, consultation with local or indigenous residents will guide selection of the AoI, allowing secure access to key sites [51]. Additional considerations include whether the location reflects the magnitude of human impact on the biotic community or is affected by drivers such as climate change [52]. Human or animal activity within the AoI may guide other decisions—for example, where monitoring equipment should be installed to minimize animal impact or vandalism.
Understanding target species’ life histories and their natural distribution within habitats will help identify a suitable AoI for the monitoring program. Many species are restricted to a unique habitat. In this case, habitat mapping for the target species will focus the monitoring efforts within a site. Satellite earth observation tools can be implemented in a semi-automatic way for preliminary analysis of habitats suitable for a target indicator [53]. For large AoI, area-based monitoring procedures should be applied to a representative section. Stratified or grid-based sub-sampling can help to reduce the monitoring commitment while delivering statistically sound results. For linear or plot-based monitoring, number and dimensions of the sampling unit should be decided in advance because post hoc scale correction may dramatically affect interpretation of findings [54]. Consultation with a statistician may be necessary to ensure that the data collection design will meet the objectives of the monitoring program and gain knowledge about the minimum mapping unit to reduce costs (Table 2) [39].

3.2.4. When Will Monitoring Occur?

A monitoring program becomes more valuable the longer it is in place. Deciding when to begin the monitoring program is a critical consideration. A manager must first have a strong understanding of the life cycle of the indicator. Some indicator species may be active for long periods of the year. Other indicators may be only ephemerally present. Timing of seasonal monitoring activities should target the same phenological stage of the indicator. Inconsistent timing could result in apparent fluctuations of abundance or documented life stages, leading to faulty conclusions. Sampling for the least time-sensitive life stage, such as the viable seed bank of a plant, will produce the most consistent results [55]. Periodic events (e.g., fire, avalanches) may further motivate a monitoring program. The timing of such events may not be predictable and, therefore, monitoring programs for such situations should be conceptualized in advance. If resources allow, baseline data should be collected in a representative habitat before the event occurs. If baseline data are unavailable, response monitoring should still be conducted to capture valuable data immediately following the event.
In addition to well-timed initiation of monitoring, the interval between monitoring cycles needs to be carefully evaluated to maximize the value of data relative to resource use. The choice of interval will depend on the objectives of the monitoring program. If the temporal dynamics of the indicator species are not well known, it is recommended to initially perform pilot monitoring activities at short intervals using multiple approaches. The most effective combination will be apparent after a few cycles, saving resources in the long term.
The third factor is consideration of the duration of a monitoring program. At minimum, a monitoring program should provide enough data to allow revision of species status according to the criteria of the IUCN Red List of Threatened Species. Currently, Red List species are evaluated based on population trends over the previous 10 years or 3 generations, whichever is longer [56]. While practical in terms of planning and decision making, this duration might not be suitable for all species. When possible, a power analysis should be conducted to determine the number of monitoring cycles required to detect changes in populations [57]. In reality, if faced with insufficient data and an immediate need for decision making, the precautionary principle could be applied to assume that action is needed to conserve a population [58].

3.2.5. Who Will Be Involved?

The transformative processes envisioned by the GBF Theory of Change will require social endorsement of biodiversity monitoring programs by Indigenous Peoples and Local Communities (IPLC) [59]. These groups bring to the table key traditional knowledge of the local biodiversity and should be included in the decision making processes from the beginning. Stakeholders with vested interests in the PA or OECM should be encouraged to participate in conservation activities [60]. Supporting staff of the PA include secretaries, internal management, and external partners. Field staff include the PA field manager and an actively involved team of technicians. In some PAs, monitoring will be sub-contracted to external experts. Such professional service providers are becoming increasingly important because PAs are usually too understaffed to perform the monitoring activities. Assessment of the staff and sub-contractors involved in the monitoring program will impact budget calculations.
A stakeholder map is a convenient decision making tool for managers to sort out the complex web of participants. It will help determine the size, structure, and composition of the core monitoring team, providing expectations and accountability for individual roles. Depending on program goals, participants may be quite diverse. The competence map will identify interest groups, such as researchers, nature associations, and IPLC [45].
For the monitoring program to have value, its key findings must be used by the managerial body to improve the conservation of the PA. Findings should be disseminated to visitors and the general public, as well as to PA network authorities. Active communication among staff, decision-makers, and the public promotes effective adaptive management based on previous experiences. Visitors can contribute their observations and perspectives through citizen science endeavors, creating awareness and supporting conservation [61].

3.2.6. How Many Resources Are Required?

The question of resource availability for the monitoring program involves two important elements: the amount of financial and material support required to establish and maintain the program; and the amount of available human resources required for implementation [62]. An estimated budget should be prepared for material acquisition and plot establishment, including personnel costs, travel, data processing and management, and material resources. Materials may include up-front investments, such as field vehicles, and ongoing costs for consumables and data management [63]. Monetary costs during program establishment are greater than costs of ongoing implementation. Plot establishment, including documentation of initial conditions and an extensive test run, is a one-time expense. Many field resources, such as high-tech monitoring devices and vehicles, are large one-time expenditures. Test runs incur additional costs but identify and remedy shortcomings of the site protocols. Small-scale test runs, therefore, optimize resource use in the long term. Office expenses may include establishing and maintaining an information technology infrastructure, including computers, data analytical software, and financing for data storage. Depending on the nature of collections and the capacity of the PA infrastructure and personnel, analysis of biological samples can be performed in-house; however, in many cases, analysis will be outsourced to experts. Citizen science volunteers may be motivated through incentives, training opportunities, and other non-monetary forms of compensation [64].
Biodiversity monitoring programs are limited by the availability of funding, administrative barriers, and human resources. The capacity for monitoring is profoundly affected by the technical skills of the involved employees [65]. Qualified personnel should be hired and retained for multiple monitoring cycles to save on training expenses and provide continuity to the monitoring process. To compensate for deficiencies, money should be set aside for external experts. Human resources must be sufficiently coordinated with stakeholders. Early cycles may occur at closer time intervals, incurring greater costs early in the program. Realistic estimations of the time for site assessments will help determine how many teams are needed for field work. If the available resources are not guaranteed for the full program, sites should be prioritized in advance for consistent collection of the most important data. If possible, supplemental resources that can be activated in an emergency should be identified.

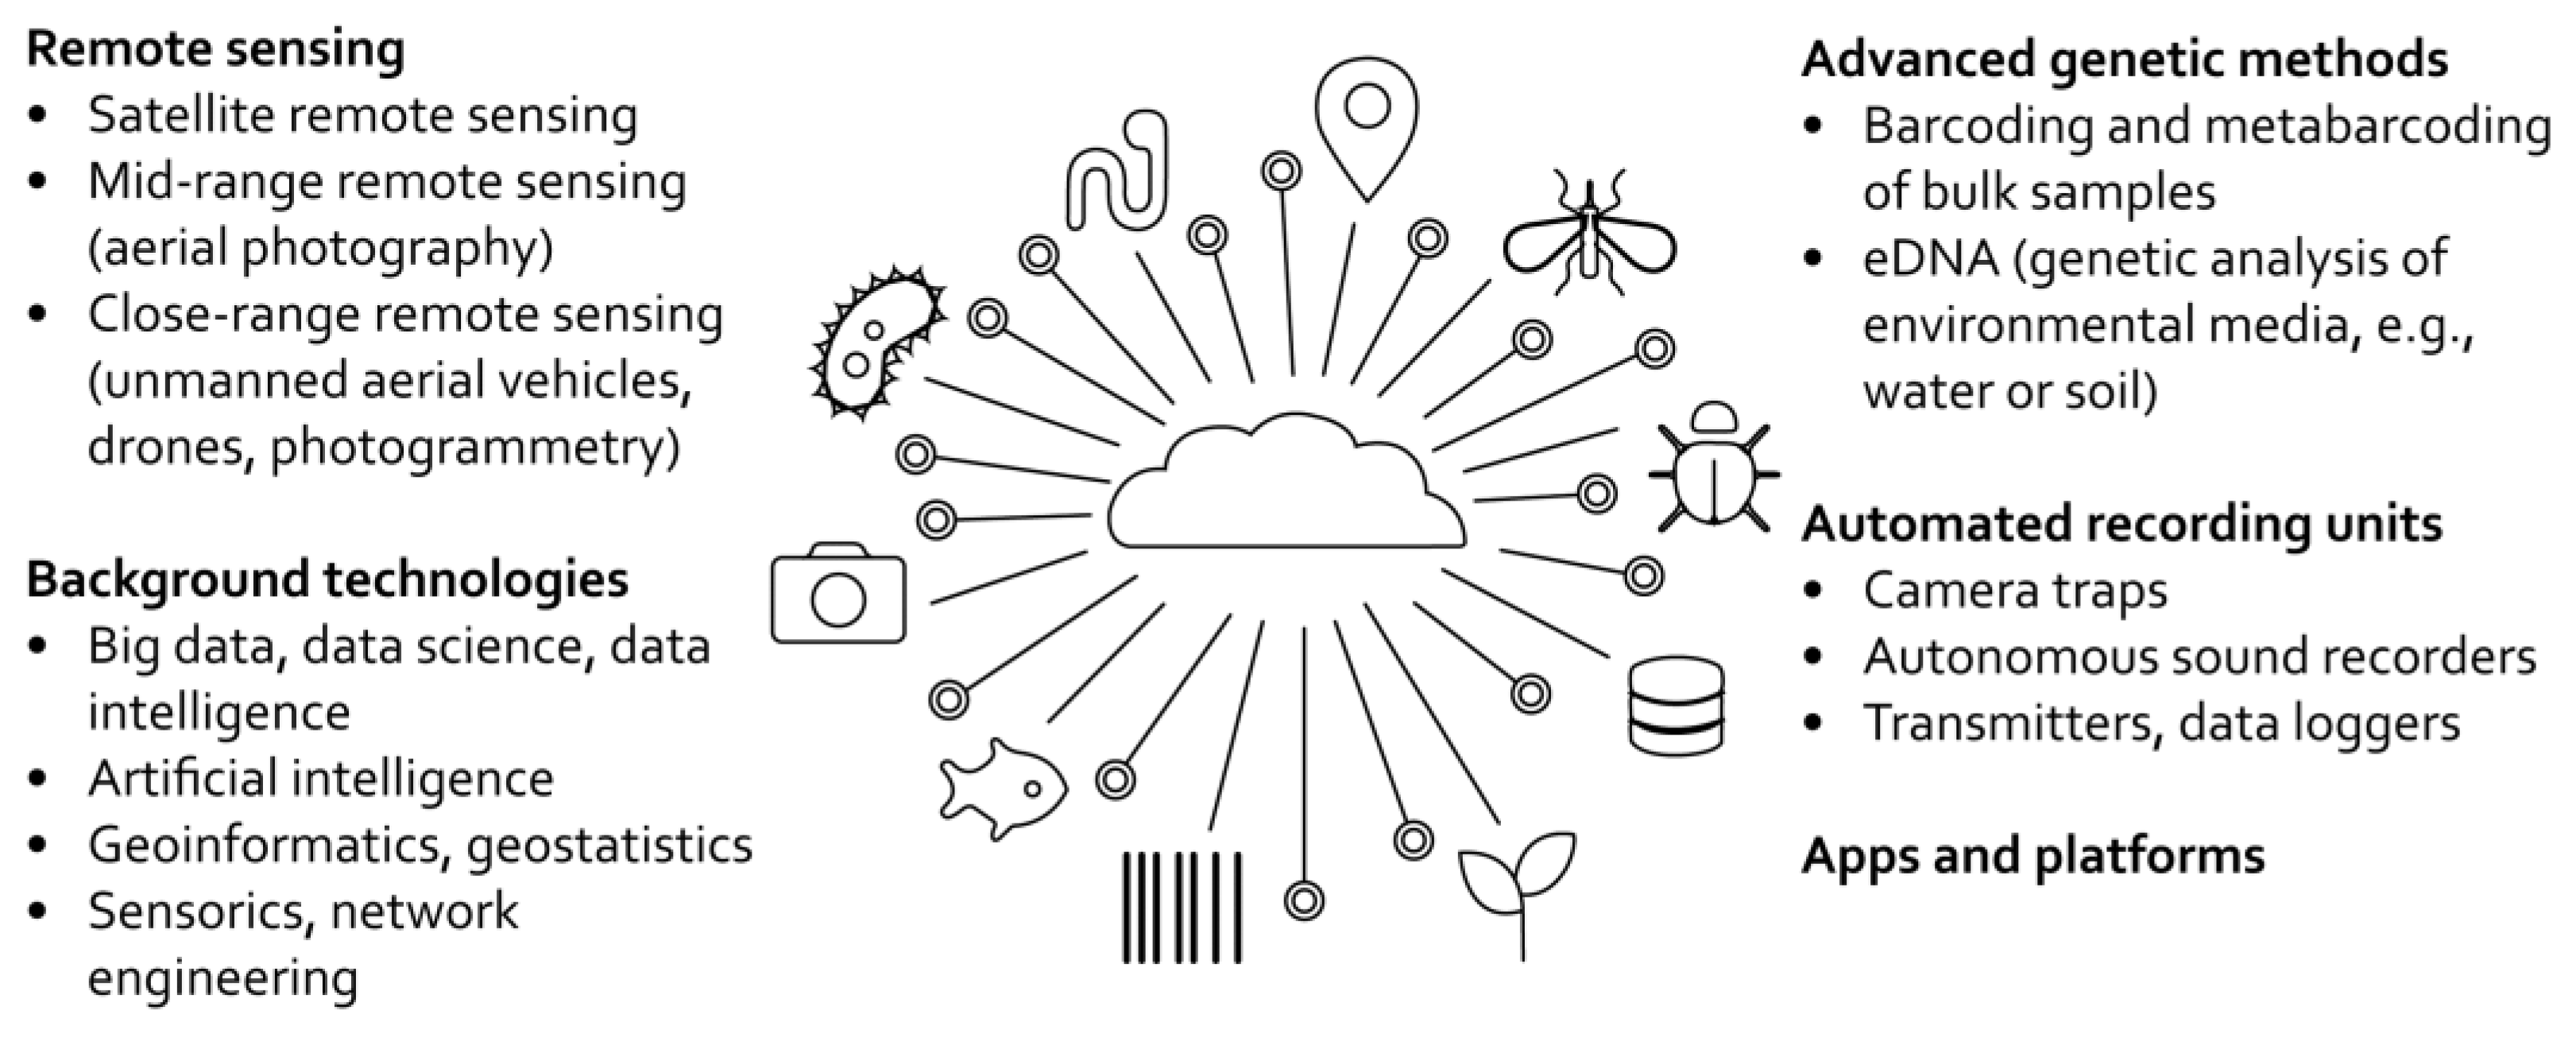
3.3. Implementation Phase: Performing the Work in the Field

The implementation phase occurs after the logistical details of the conceptual phase are determined. In this phase, the field protocol is drafted, test runs are recommended, and, once the protocol functions as envisioned, the ongoing monitoring cycles will occur. Mid-program evaluations of the procedures during implementation will identify possible adaptive management actions. The seventh question of the framework is, thus, defined:
  • How will field monitoring be achieved?
Field implementation of the monitoring program should focus on high quality control of the data. A preliminary field manual should be developed as the end result of working through the conceptual phase. Materials are acquired at the beginning of the implementation phase. Core methods will differ based on selected indicators or taxa [8]. Selection of methodology is critical as the number of available tools has evolved rapidly in recent decades. However, many of the specialized techniques that were developed decades ago will continue to be utilized into the future. Yet, data collection cannot reach its full potential without the adoption of high-tech tools [66]. High-tech monitoring solutions and their current limitations are documented in recent review papers [30,31,67,68].
The processes for data transfer and management must be established. Data sheets should be designed as simply as possible while prompting the field workers to collect all of the relevant data and metadata. Test runs at an easily accessible site are highly recommended because they indicate where efficiencies can be made, saving resources in the long term. This exercise will further calibrate data collection procedures amongst team members. Pre-runs at an actual field site should then occur to test the finalized protocols under field conditions. The pre-run is the final chance to revise the field manual without affecting program data quality. If any changes are made at a later stage, the previous approach should be used alongside the new approach for enough monitoring cycles to draw correlations between methods.
Each monitoring cycle should include data analysis, data storage, and presentation of methods and results after the field work has occurred. After each monitoring cycle, the results should be evaluated by the managers and adaptive management measures discussed by the team. Stakeholders can be invited to actively participate in the monitoring processes and feedback. These measures will foster transparency, which is a key element of effective communication.

3.4. Re-Evaluation Phase: Identifying Synergies

The final element of the biodiversity monitoring framework is to identify how the monitoring program increases knowledge about target biodiversity indicators. Archiving project data in open-source repositories, such as GBIF, or through data centers is essential for transparent data management and provides a resource for future programs [69].
The monitoring program should be re-evaluated at pre-defined intervals to ensure maximum quality [70]. End-program evaluation will identify synergies for future iterations of the program. The process of re-evaluation at the program’s conclusion will show whether the management approach has contributed effectively to the conservation of biodiversity. Internal review will further indicate how the results can be transferred into day-to-day management activities. As the value of a monitoring program increases the longer it operates, continuation of the current monitoring activity may be justified. On the other hand, shortcomings identified during post-program evaluation may indicate that the monitoring program should be modified or even discontinued. Presentation of findings to decision makers will help them determine the most efficient allocation of resources for future programs [44].

4. Conclusions

Management of PAs and OECMs is critical for conservation of biodiversity worldwide. The key activity to inform effective management is a robust biodiversity monitoring program. As conservation areas are needed to safeguard biodiversity in all regions of the globe, no specific monitoring plan can satisfy the requirements of every PA or OECM. We provide a robust conceptual framework for monitoring based upon six key conceptual questions related to the broad application and development of effective biodiversity monitoring programs: “why monitor”, “which indicators” should be included, “where” and “when” monitoring will occur, “who” will be involved, and “how many” resources are required. These six questions are highly interconnected and, while they can be considered individually, they must all complement each other in the development of a holistic approach to monitoring. The seventh question of “how” to conduct protocols is the result of the conceptual requirements and is considered in the implementation phase. Site management objectives, synergies, and program re-evaluation will be advanced through this systematic approach. The framework is robust against changing legal obligations, site goals, stakeholders, technological frameworks, and availability of resources. A widely adopted common approach will contribute to standardization of biodiversity monitoring protocols, allowing comparability of data across PAs and OECMs, promoting effective management of irreplaceable landscapes around the globe, and improving our knowledge of global biodiversity.

Author Contributions

Conceptualization, V.B., M.J., H.K. and A.S.; resources, V.A., J.B., D.T.D., S.H. and V.Š.; writing—original draft preparation, V.B., D.T.D., H.K., M.J. and K.S.; writing—review and editing, all authors; supervision, M.J.; validation, D.T.D., V.B., K.S. and V.Š.; project administration, V.B.; funding acquisition, V.B. and M.J. All authors have read and agreed to the published version of the manuscript.

Funding

This work was made possible through funding and support from the Austrian Research Promotion Agency (Österreichische Forschungsförderungsgesellschaft, FFG) COIN project BioMONITec number 884138 and the Austrian Federal Ministry for Digital and Economic Affairs (Bundesministerium für Digitalisierung und Wirtschaftsstandort, BMDW).

Institutional Review Board Statement

Not applicable.

Informed Consent Statement

Not applicable.

Data Availability Statement

No new data were created or analyzed in this study. Data sharing is not applicable to this article.

Acknowledgments

We thank Anneliese Fuchs and Elisabeth Wiegele for their consultation on the figures used in this study. The manuscript was substantially improved through the comments of Sunita Chaudhary and an anonymous reviewer.

Conflicts of Interest

The authors declare no conflict of interest. The funders had no role in the design of the research; in the collection, analyses, or interpretation of data sources; in the writing of the manuscript; or in the decision to publish the results.

References

  1. Bialowolski, P.; Rakotobe, D.; Marelli, A.; Roggeri, P.; Paolini, C. Use of the IMET tool in the evaluation of protected area management effectiveness in Central Africa. J. Environ. Manag. 2022, 326, 116680. [Google Scholar] [CrossRef]
  2. Elzinga, C.L.; Salzer, D.W.; Willoughby, J.W. Measuring & Monitoring Plant Populations; US Department of the Interior, Bureau of Land Management Papers: Denver, CO, USA, 2019.
  3. Hockings, M.; James, R.; Stolton, S.; Dudley, N.; Mathur, V.; Makombo, J.; Courrau, J.; Parrish, J. Enhancing Our Heritage Toolkit. Assessing Management Effectiveness of Natural World Heritage Sites; UNESCO: Paris, France, 2008. [Google Scholar]
  4. Lockwood, M. Good governance for terrestrial protected areas: A framework, principles and performance outcomes. J. Environ. Manag. 2010, 91, 754–766. [Google Scholar] [CrossRef] [PubMed]
  5. Magurran, A.E. Measuring Biological Diversity; Blackwell: Oxford, UK, 2004. [Google Scholar]
  6. Lee, W.; McGlone, M.; Wright, E. Biodiversity Inventory and Monitoring: A Review of National and International Systems and a Proposed Framework for Future Biodiversity Monitoring by the Department of Conservation; Department of Conservation: Wellington, New Zealand, 2005. [Google Scholar]
  7. Dallmeier, F.; Szaro, R.C.; Alonso, A.; Comiskey, J.; Henderson, A. Framework for Assessment and Monitoring of Biodiversity. In Encyclopedia of Biodiversity; Academic Press: Waltham, MA, USA, 2013; pp. 545–559. [Google Scholar]
  8. Herrick, J.E.; van Zee, J.W.; McCord, S.E.; Courtright, E.M.; Karl, J.W.; Burkett, L.M. Monitoring Manual for Grassland, Shrubland, and Savanna Ecosystems, 2nd ed.; USDA—ARS Jordana Experimental Range; University of Arizona Press: Tucson, AZ, USA; Las Cruces, NM, USA, 2005. [Google Scholar]
  9. UNEP-WCMC. Protected Areas Map of the World: January 2023. Available online: https://www.protectedplanet.net/en/resources/january-2023-update-of-the-wdpa-and-wd-oecm-1 (accessed on 12 January 2023).
  10. Cowie, R.H.; Bouchet, P.; Fontaine, B. The Sixth Mass Extinction: Fact, fiction or speculation? Biol. Rev. Camb. Philos. Soc. 2022, 97, 640–663. [Google Scholar] [CrossRef]
  11. IPBES. Summary for Policymakers of the Global Assessment Report on Biodiversity and Ecosystem Services of the Intergovernmental Science-Policy Platform on Biodiversity and Ecosystem Services; IPBES: Bonn, Germany, 2019. [Google Scholar]
  12. CBD. The Convention on Biological Diversity: CBD. Available online: https://www.cbd.int/doc/legal/cbd-en.pdf (accessed on 6 March 2023).
  13. Lausch, A.; Bannehr, L.; Beckmann, M.; Boehm, C.; Feilhauer, H.; Hacker, J.M.; Heurich, M.; Jung, A.; Klenke, R.; Neumann, C.; et al. Linking Earth Observation and taxonomic, structural and functional biodiversity: Local to ecosystem perspectives. Ecol. Indic. 2016, 70, 317–339. [Google Scholar] [CrossRef]
  14. CBD. Revised and Updated Strategic Plan: Technical Rationale and Suggested Milestones and Indicators. Available online: https://www.cbd.int/doc/meetings/cop/cop-10/official/cop-10-09-en.pdf (accessed on 23 January 2022).
  15. Woodley, S.; Locke, H.; Laffoley, D.; MacKinnon, K.; Sandwith, T.; Smart, J. A review of evidence for area-based conservation targets for the post-2020 global biodiversity framework. Parks 2019, 25, 31–46. [Google Scholar] [CrossRef]
  16. CBD. Decision Adopted by the Conference of the Parties to the Convention on Biological Diversity. Available online: https://www.cbd.int/doc/decisions/cop-15/cop-15-dec-04-en.pdf (accessed on 23 January 2022).
  17. Serrat, O. Knowledge Solutions. Tools, Methods and Approaches to Drive Organizational Performance/by Olivier Serrat; Springer: Singapore, 2017. [Google Scholar]
  18. IUCN-WCPA Task Force on OECMs. Recognising and Reporting Other Effective Area-Based Conservation Measures; IUCN—International Union for Conservation of Nature: Gland, Switzerland, 2019. [Google Scholar]
  19. Kroll, C.; Warchold, A.; Pradhan, P. Sustainable Development Goals (SDGs): Are we successful in turning trade-offs into synergies? Palgrave Commun. 2019, 5, 140. [Google Scholar] [CrossRef]
  20. Maxwell, S.L.; Cazalis, V.; Dudley, N.; Hoffmann, M.; Rodrigues, A.S.L.; Stolton, S.; Visconti, P.; Woodley, S.; Kingston, N.; Lewis, E.; et al. Area-based conservation in the twenty-first century. Nature 2020, 586, 217–227. [Google Scholar] [CrossRef]
  21. Coad, L.; Leverington, F.; Knights, K.; Geldmann, J.; Eassom, A.; Kapos, V.; Kingston, N.; de Lima, M.; Zamora, C.; Cuardros, I.; et al. Measuring impact of protected area management interventions: Current and future use of the Global Database of Protected Area Management Effectiveness. Philos. Trans. R. Soc. Lond. Ser. B Biol. Sci. 2015, 370, 20140281. [Google Scholar] [CrossRef]
  22. IUCN WCPA. IUCN Green List of Protected and Conserved Areas: User Manual; Version 1.2; IUCN—International Union for Conservation of Nature: Gland, Switzerland, 2019. [Google Scholar]
  23. Hockings, M.; Hardcastle, J.; Woodley, S.; Sandwith, T.; Wilson, J.; Bammert, M.; Valenzuela, S.; Chataigner, B.; Lefebvre, T.; Leverington, F.; et al. The IUCN Green List of Protected and Conserved Areas: Setting the standard for effective conservation. Parks 2019, 25, 57–66. [Google Scholar] [CrossRef]
  24. Mascia, M.B.; Pailler, S.; Thieme, M.L.; Rowe, A.; Bottrill, M.C.; Danielsen, F.; Geldmann, J.; Naidoo, R.; Pullin, A.S.; Burgess, N.D. Commonalities and complementarities among approaches to conservation monitoring and evaluation. Biol. Conserv. 2014, 169, 258–267. [Google Scholar] [CrossRef]
  25. Linkov, I.; Satterstrom, F.K.; Kiker, G.; Batchelor, C.; Bridges, T.; Ferguson, E. From comparative risk assessment to multi-criteria decision analysis and adaptive management: Recent developments and applications. Environ. Int. 2006, 32, 1072–1093. [Google Scholar] [CrossRef]
  26. Dullinger, S.; Essl, F.; Rabitsch, W.; Erb, K.-H.; Gingrich, S.; Haberl, H.; Hülber, K.; Jarosík, V.; Krausmann, F.; Kühn, I.; et al. Europe’s other debt crisis caused by the long legacy of future extinctions. Proc. Natl. Acad. Sci. USA 2013, 110, 7342–7347. [Google Scholar] [CrossRef] [PubMed]
  27. Kuussaari, M.; Bommarco, R.; Heikkinen, R.K.; Helm, A.; Krauss, J.; Lindborg, R.; Ockinger, E.; Pärtel, M.; Pino, J.; Rodà, F.; et al. Extinction debt: A challenge for biodiversity conservation. Trends Ecol. Evol. 2009, 24, 564–571. [Google Scholar] [CrossRef] [PubMed]
  28. Pulsford, I.; Lindenmayer, D.; Wyborn, C.; Lausche, B.; Vasilijević, M.; Worboys, G.L. Connectivity Conservation Management. In Protected Area Governance and Management; Worboys, G.L., Lockwood, M., Kothari, A., Feary, S., Pulsford, I., Eds.; ANU Press: Canberra, Australia, 2015. [Google Scholar]
  29. Joly, A.; Vrochidis, S.; Karatzas, K.; Karppinen, A.; Bonnet, P. Multimedia Tools and Applications for Environmental & Biodiversity Informatics; Springer International Publishing: Cham, Switzerland, 2018. [Google Scholar]
  30. Dalton, D.T.; Pascher, K.; Berger, V.; Steinbauer, K.; Jungmeier, M. Novel Technologies and Their Application for Protected Area Management: A Supporting Approach in Biodiversity Monitoring. In Protected Area Management—Recent Advances; Nazip Suratman, M., Ed.; IntechOpen: London, UK, 2022. [Google Scholar]
  31. Pascher, K.; Švara, V.; Jungmeier, M. Environmental DNA-Based Methods in Biodiversity Monitoring of Protected Areas: Application Range, Limitations, and Needs. Diversity 2022, 14, 463. [Google Scholar] [CrossRef]
  32. Bellingham, P.J.; Richardson, S.J.; Gormley, A.M.; Allen, R.B.; Cook, A.; Crisp, P.N.; Forsyth, D.M.; McGlone, M.S.; McKay, M.; MacLeod, C.J.; et al. Implementing integrated measurements of Essential Biodiversity Variables at a national scale. Ecol. Solut. Evid. 2020, 1, e12025. [Google Scholar] [CrossRef]
  33. Jetz, W.; McGeoch, M.A.; Guralnick, R.; Ferrier, S.; Beck, J.; Costello, M.J.; Fernandez, M.; Geller, G.N.; Keil, P.; Merow, C.; et al. Essential biodiversity variables for mapping and monitoring species populations. Nat. Ecol. Evol. 2019, 3, 539–551. [Google Scholar] [CrossRef]
  34. Pereira, H.M.; Ferrier, S.; Walters, M.; Geller, G.N.; Jongman, R.H.G.; Scholes, R.J.; Bruford, M.W.; Brummitt, N.; Butchart, S.H.M.; Cardoso, A.C.; et al. Ecology. Essential biodiversity variables. Science 2013, 339, 277–278. [Google Scholar] [CrossRef] [PubMed]
  35. Bojinski, S.; Verstraete, M.; Peterson, T.C.; Richter, C.; Simmons, A.; Zemp, M. The Concept of Essential Climate Variables in Support of Climate Research, Applications, and Policy. Bull. Am. Meteorol. Soc. 2014, 95, 1431–1443. [Google Scholar] [CrossRef]
  36. Miloslavich, P.; Bax, N.J.; Simmons, S.E.; Klein, E.; Appeltans, W.; Aburto-Oropeza, O.; Andersen Garcia, M.; Batten, S.D.; Benedetti-Cecchi, L.; Checkley, D.M.; et al. Essential ocean variables for global sustained observations of biodiversity and ecosystem changes. Glob. Chang. Biol. 2018, 24, 2416–2433. [Google Scholar] [CrossRef]
  37. Butler, S.J.; Freckleton, R.P.; Renwick, A.R.; Norris, K. An objective, niche-based approach to indicator species selection. Methods Ecol. Evol. 2012, 3, 317–326. [Google Scholar] [CrossRef]
  38. Haines, A.M.; Leu, M.; Costante, D.M.; Treakle, T.C.; Parenti, C.; Miller, J.R.B.; Malcom, J.W. Benchmark for the ESA: Having a Backbone Is Good for Recovery. Front. Conserv. Sci. 2021, 2, 630490. [Google Scholar] [CrossRef]
  39. Lindenmayer, D.B.; Likens, G.E. Adaptive monitoring: A new paradigm for long-term research and monitoring. Trends Ecol. Evol. 2009, 24, 482–486. [Google Scholar] [CrossRef]
  40. Granizo, T.; Molina, M.E.; Secaira, E.; Herrera, B.; Benitez, S.; Maldonado, O.; Libby, M.; Arroyo, P.; Isola, S.; Castro, M. Manual de Planificacion Para la Conservacion de Areas; PCA: Quito, Ecuador, 2006. [Google Scholar]
  41. Magurran, A.E.; Baillie, S.R.; Buckland, S.T.; Dick, J.M.; Elston, D.A.; Scott, E.M.; Smith, R.I.; Somerfield, P.J.; Watt, A.D. Long-term datasets in biodiversity research and monitoring: Assessing change in ecological communities through time. Trends Ecol. Evol. 2010, 25, 574–582. [Google Scholar] [CrossRef] [PubMed]
  42. Jungmeier, M.; Köstl, T.; Lange, S.; Bliem, M. The art of omission: BRIM Nockberge—Designing a Biosphere Reserve Integrated Monitoring for the Carinthian part of the Biosphere Reserve Salzburger Lungau and Kärntner Nockberge. J. Prot. Mt. Areas Res. Manag. 2013, 5, 15–22. Available online: http://hw.oeaw.ac.at/?arp=0x002f50f1 (accessed on 29 March 2021). [CrossRef]
  43. Lindenmayer, D.B.; Gibbons, P.; Bourke, M.A.X.; Burgman, M.; Dickman, C.R.; Ferrier, S.; Fitzsimons, J.; Freudenberger, D.; Garnett, S.T.; Groves, C.; et al. Improving biodiversity monitoring. Austral Ecol. 2012, 37, 285–294. [Google Scholar] [CrossRef]
  44. Bottrill, M.C.; Joseph, L.N.; Carwardine, J.; Bode, M.; Cook, C.; Game, E.T.; Grantham, H.; Kark, S.; Linke, S.; McDonald-Madden, E.; et al. Is conservation triage just smart decision making? Trends Ecol. Evol. 2008, 23, 649–654. [Google Scholar] [CrossRef]
  45. Beltran, J. Indigenous and traditional peoples and protected areas. In Principles, Guidelines and Case Studies; Best Practice Protected Area Guidelines Series No. 4; Beltrán, J., Ed.; IUCN: Gland, Switzerland, 2000. [Google Scholar]
  46. Roux, D.J.; Rogers, K.H.; Biggs, H.C.; Ashton, P.J.; Sergeant, A. Bridging the Science-Management Divide: Moving from Unidirectional Knowledge Transfer to Knowledge Interfacing and Sharing. Ecol. Soc. 2006, 11, 4. [Google Scholar] [CrossRef]
  47. Hoban, S.; Bruford, M.W.; Funk, W.C.; Galbusera, P.; Griffith, M.P.; Grueber, C.E.; Heuertz, M.; Hunter, M.E.; Hvilsom, C.; Stroil, B.K.; et al. Global Commitments to Conserving and Monitoring Genetic Diversity Are Now Necessary and Feasible. BioScience 2021, 71, 964–976. [Google Scholar] [CrossRef]
  48. Habel, J.C.; Zamora, C.; Rödder, D.; Teucher, M.; Cuadros-Casanova, I.; Fischer, C. Using indicator species to detect high quality habitats in an East African forest biodiversity hotspot. Biodivers. Conserv. 2021, 30, 903–915. [Google Scholar] [CrossRef]
  49. Lindenmayer, D.; Pierson, J.; Barton, P.; Beger, M.; Branquinho, C.; Calhoun, A.; Caro, T.; Greig, H.; Gross, J.; Heino, J.; et al. A new framework for selecting environmental surrogates. Sci. Total Environ. 2015, 538, 1029–1038. [Google Scholar] [CrossRef] [PubMed]
  50. Sato, C.F.; Westgate, M.J.; Barton, P.S.; Foster, C.N.; O’Loughlin, L.S.; Pierson, J.C.; Balmer, J.; Chapman, J.; Catt, G.; Detto, T.; et al. The use and utility of surrogates in biodiversity monitoring programmes. J. Appl. Ecol. 2019, 56, 1304–1310. [Google Scholar] [CrossRef]
  51. Game, E.T.; Lipsett-Moore, G.; Hamilton, R.; Peterson, N.; Kereseka, J.; Atu, W.; Watts, M.; Possingham, H. Informed opportunism for conservation planning in the Solomon Islands. Conserv. Lett. 2011, 4, 38–46. [Google Scholar] [CrossRef]
  52. Pauli, H.; Halloy, S.R. High Mountain Ecosystems Under Climate Change. In Oxford Research Encyclopedia of Climate Science; Pauli, H., Halloy, S.R., Eds.; Oxford University Press: Oxford, UK, 2019. [Google Scholar]
  53. Lang, S.; Mairota, P.; Pernkopf, L.; Schioppa, E.P. Earth observation for habitat mapping and biodiversity monitoring. Int. J. Appl. Earth Obs. Geoinf. 2015, 37, 1–160. [Google Scholar] [CrossRef]
  54. Joseph, L.N.; Possingham, H.P. Grid-based monitoring methods for detecting population declines: Sensitivity to spatial scale and consequences of scale correction. Biol. Conserv. 2008, 141, 1868–1875. [Google Scholar] [CrossRef]
  55. Adams, V.M.; Marsh, D.M.; Knox, J.S. Importance of the seed bank for population viability and population monitoring in a threatened wetland herb. Biol. Conserv. 2005, 124, 425–436. [Google Scholar] [CrossRef]
  56. Rodrigues, A.S.L.; Pilgrim, J.D.; Lamoreux, J.F.; Hoffmann, M.; Brooks, T.M. The value of the IUCN Red List for conservation. Trends Ecol. Evol. 2006, 21, 71–76. [Google Scholar] [CrossRef]
  57. White, E.R. Minimum Time Required to Detect Population Trends: The Need for Long-Term Monitoring Programs. BioScience 2019, 69, 40–46. [Google Scholar] [CrossRef]
  58. Thompson, P.M.; Wilson, B.; Grellier, K.; Hammond, P.S. Combining Power Analysis and Population Viability Analysis to Compare Traditional and Precautionary Approaches to Conservation of Coastal Cetaceans. Conserv. Biol. 2000, 14, 1253–1263. [Google Scholar] [CrossRef]
  59. Reyes-García, V.; Fernández-Llamazares, Á.; Aumeeruddy-Thomas, Y.; Benyei, P.; Bussmann, R.W.; Diamond, S.K.; García-del-Amo, D.; Guadilla-Sáez, S.; Hanazaki, N.; Kosoy, N.; et al. Recognizing Indigenous peoples’ and local communities’ rights and agency in the post-2020 Biodiversity Agenda. Ambio 2022, 51, 84–92. [Google Scholar] [CrossRef]
  60. Hoffmann, D. The Sajama National Park in Bolivia. Mt. Res. Dev. 2007, 27, 11–14. [Google Scholar] [CrossRef]
  61. Maund, P.R.; Irvine, K.N.; Lawson, B.; Steadman, J.; Risely, K.; Cunningham, A.A.; Davies, Z.G. What motivates the masses: Understanding why people contribute to conservation citizen science projects. Biol. Conserv. 2020, 246, 108587. [Google Scholar] [CrossRef] [PubMed]
  62. Danielsen, F.; Balete, D.S.; Poulsen, M.K.; Enghoff, M.; Nozawa, C.M.; Jensen, A.E. A simple system for monitoring biodiversity in protected areas of a developing country. Biodivers Conserv. 2000, 9, 1671–1705. [Google Scholar] [CrossRef]
  63. Lindenmayer, D.B.; Zammit, C.; Attwood, S.J.; Burns, E.; Shepherd, C.L.; Kay, G.; Wood, J. A novel and cost-effective monitoring approach for outcomes in an Australian biodiversity conservation incentive program. PLoS ONE 2012, 7, e50872. [Google Scholar] [CrossRef] [PubMed]
  64. De Moor, T.; Rijpma, A.; Prats López, M. Dynamics of Engagement in Citizen Science: Results from the “Yes, I do!”-Project. Citiz. Sci. Theory Pract. 2019, 4, 38. [Google Scholar] [CrossRef]
  65. Schmeller, D.S.; Böhm, M.; Arvanitidis, C.; Barber-Meyer, S.; Brummitt, N.; Chandler, M.; Chatzinikolaou, E.; Costello, M.J.; Ding, H.; García-Moreno, J.; et al. Building capacity in biodiversity monitoring at the global scale. Biodivers. Conserv. 2017, 26, 2765–2790. [Google Scholar] [CrossRef]
  66. Wägele, J.W.; Bodesheim, P.; Bourlat, S.J.; Denzler, J.; Diepenbroek, M.; Fonseca, V.; Frommolt, K.-H.; Geiger, M.F.; Gemeinholzer, B.; Glöckner, F.O.; et al. Towards a multisensor station for automated biodiversity monitoring. Basic Appl. Ecol. 2022, 26, 2765–2790. [Google Scholar] [CrossRef]
  67. Lahoz-Monfort, J.J.; Magrath, M.J.L. A Comprehensive Overview of Technologies for Species and Habitat Monitoring and Conservation. BioScience 2021, 71, 1038–1062. [Google Scholar] [CrossRef] [PubMed]
  68. Stephenson, P.J. Technological advances in biodiversity monitoring: Applicability, opportunities and challenges. Curr. Opin. Environ. Sustain. 2020, 45, 36–41. [Google Scholar] [CrossRef]
  69. Costello, M.J.; Wieczorek, J. Best practice for biodiversity data management and publication. Biol. Conserv. 2014, 173, 68–73. [Google Scholar] [CrossRef]
  70. Pauli, H.; Gottfried, M.; Lamprecht, A.; Niessner, S.; Rumpf, S.; Winkler, M.; Steinbauer, K.; Grabherr, G. The GLORIA Field Manual—Standard Multi-Summit Approach, Supplementary Methods and Extra Approaches, 5th ed.; GLORIA-Coordination, Austrian Academy of Sciences & University of Natural Resources and Life Sciences: Vienna, Austria, 2015. [Google Scholar]
Figure 1. The four long-term goals as outlined in the Montreal–Kunming Global Biodiversity Framework 2050 Vision for Biodiversity. Adapted from CBD [16].
Sustainability 15 06779 g001
Figure 2. Modern automated biodiversity monitoring technologies utilize diverse types of remote data collection techniques. Approaches include remote sensing using satellites, manned and unmanned aerial vehicles, high-throughput genetic analytical techniques, sensor-based automated recording units, user-friendly computer applications and data platforms, and advanced computer technologies for analysis of big data and development of artificial intelligence algorithms.
Sustainability 15 06779 g002
Figure 3. Four phases of framework for establishing biodiversity monitoring programs. Preparatory phase is an initial assessment of legal obligations, goals, and site investigations, leading to a prioritized list of monitoring targets. A series of six interacting questions is addressed in conceptual phase to indicate a monitoring framework, providing the basis of how to conduct a program during implementation phase. Effective monitoring will improve adaptive management decisions. A re-evaluation phase at end of program provides reflection on whether it should be continued, modified, or terminated.
Sustainability 15 06779 g003
Figure 4. Discussion on key questions of monitoring program should be performed collaboratively by stakeholders and staff.
Sustainability 15 06779 g004
Table 1. The Essential Biodiversity Variables by class and name. Adapted from: Pereira et al. [34]; https://geobon.org/ebvs/what-are-ebvs/ (accessed on 16 March 2023).
EBV ClassName
1Genetic compositionGenetic diversity—richness and heterozygosity
Genetic differentiation—number of genetic units and genetic distance
Effective population size
Inbreeding
2Species populationsSpecies distributions
Species abundances
3Species traitsMorphology
Physiology
Phenology
Movement
Reproduction
4Community compositionCommunity abundance
Taxonomic/phylogenetic diversity
Trait diversity
Interaction diversity
5Ecosystem functioningPrimary productivity
Ecosystem phenology
Ecosystem disturbances
6Ecosystem structureLive cover fraction
Ecosystem distribution
Ecosystem vertical profile
Table 2. Sampling design, description, and main advantages and disadvantages for select random and non-random sampling strategies.
Sampling StrategyDesignDescriptionAdvantagesDisadvantages
RandomSimple randomAll subjects have an equal chance of being surveyed.Statistically robust inferences can be drawn.Due to chance, rare features may not be observed.
SystematicSampling occurs at regular intervals.Easier to conduct than simple random sampling; statistically robust.Due to chance, rare features may not be observed; hidden patterns may bias selection.
StratifiedSubjects divided into sub-groups; random or systematic selection within subgroups.All sub-groups represented in survey.Defining sub-groups may be difficult.
ClusterSubjects divided into sub-groups; entire subgroup is selected.Effective to sample large and dispersed populations.Clusters may differ demographically from one another, may not represent entire population.
Non-randomConvenienceSubjects that are easiest to sample are surveyedEasy to collect dataResults cannot be generalized to the larger population
PurposiveExpert opinion to select the subjectsMost useful samples for research question are selectedValuable only in specific situations, clear rationale is needed
SnowballOne sample leads to discovery of additional population membersImproved recruitment of subjects from populations that are difficult to accessPotentially high sampling bias
QuotaPopulation stratified by characteristics; target number determined for all subdivisions; samples collected until numbers are reachedRepresentation of sub-divisions is controlledPotentially high sampling bias
Disclaimer/Publisher’s Note: The statements, opinions and data contained in all publications are solely those of the individual author(s) and contributor(s) and not of MDPI and/or the editor(s). MDPI and/or the editor(s) disclaim responsibility for any injury to people or property resulting from any ideas, methods, instructions or products referred to in the content.

