Article

Changes in the Vegetation, Soil Seed Bank and Soil Properties at Bait Sites in a Protected Area of the Central European Lower Montane Zone

1
Department of Nature Conservation and Landscape Management, Hungarian University of Agriculture and Life Sciences, Páter Károly utca 1, H-2100 Gödöllő, Hungary
2
Department of Botany, Hungarian University of Agriculture and Life Sciences, Páter Károly utca 1, H-2100 Gödöllő, Hungary
3
Institute of Plant Sciences and Environmental Protection, Faculty of Agriculture, University of Szeged, H-6800 Hódmezővásárhely, Hungary
*
Author to whom correspondence should be addressed.
Sustainability 2022, 14(20), 13134; https://doi.org/10.3390/su142013134
Submission received: 18 September 2022 / Revised: 11 October 2022 / Accepted: 11 October 2022 / Published: 13 October 2022
(This article belongs to the Special Issue Emerging Challenges to Protected Areas Management)

Abstract

:
Feeding places for shooting wild boar (so-called bait sites) are spreading in some regions and they have a growing impact on natural ecosystems. Bait sites were investigated to detect the changes in vegetation, the soil seed bank and soil nutrients. The study area is situated in the Mátra Landscape Protection Area, representing a typical oak forest in the Central European lower montane zone (in Hungary). Two types of bait sites were selected: forests and clearings. A vegetation survey, a soil seed bank experiment and a soil analysis were conducted. The degree of degradation of vegetation was similar at the various bait sites, but only the abundance of weeds was higher in the clearings. The density of weed seeds in the soil varied regardless of type, clearly showing the effects of artificial seed sources. The number of weed species was, however, significantly higher in the clearings. The degree of Jaccard-similarity between the vegetation and the seed bank was the highest in the clearings. The dominance of long-term persistent seeds did not differ among bait sites, indicating frequent disturbances at these sites. The amount of soil nutrients was significantly (more than 10 times) higher in the clearings and this, along with their greater openness, may be responsible for the higher number of weed species in their seed banks. The vegetation and the soil of the clearings proved to be more degraded, mainly due to their habitat characteristics, but the seed bank was similarly infected in the less weedy forests; thus, all bait sites may equally be the focal points of a possible invasion. It means new challenges for the management, considering that climate change and the intensive logging and hunting activities can strengthen the effects of bait sites.

1. Introduction

Wild game feeding is a practice prevalent all over the world and is undertaken as a form of protection and as a regulatory tool, especially in Europe and North America [1]. Most studies of this phenomenon have focused on the effects on animal populations, but only a few have examined the effects on vegetation. These studies have found that feeding places can be potential sources of exotic species’ invasion and the drivers of significant habitat degradation [1,2]. In the Carpathian Basin, because of the increasingly mild winters, the importance of supplementary winter feeding is quite low. In contrast, feeding places for shooting wild boar (bait sites) are more frequent and their negative impact on the environment is obvious. A bait site is a small clearing established approximately 30 to 50 m from hunting blinds. The feed usually consists of corn cobs or seeds scattered on the ground, but other agricultural and food industry byproducts (e.g., molasses, fresh and dried beet slices) are also used in many cases [3]. Currently, there are more than 30,000 such feeding sites in Hungary and the total weight of the different kinds of forage used exceeds 60,000 tons per year [4]. Given that agricultural products, especially cereals, contain weed seeds [5], this practice can cause the accumulation of undesirable seeds—agricultural weeds and exotic species—in seed banks. Moreover, the detrimental impact of bait sites is only magnified by the anthropogenic activity associated with feeding, increased game density, bare and degraded soil and the increased availability of nutrients. A previous survey focusing on bait sites in a typical Central European low mountain region, the Mátra Landscape Protection Area, has shown that these sites can cause significant degradation of natural habitats [6]. Their vegetation is similar to that of a ruderal community with a high abundance of agricultural weeds and some invasive species. However, it was found that the specific characteristics of the invasion at the sites was different: forest bait sites were less weedy, possibly due to the dense canopy cover, while bait sites in clearings proved to be highly degraded.
What is more, though soil seed banks play an important role in the natural environment of many ecosystems, in previous studies, only the vegetation was investigated, despite the fact that it is well known that plant invasions not only alter the above-ground vegetation but the below-ground flora as well [7,8]. Invasions by alien plant species may decrease seed bank species’ richness, diversity, and composition [9]. The above-ground vegetation and seeds in the soil respond differently to environmental conditions, so the impact of plant invasions may thus also be expected to differ. For example, seed banks are altered less rapidly and support more species than the vegetation in invaded communities [10] or a species may disappear from the above-ground vegetation but still be present in the seed bank [11]. In this way, seed banks can regulate and promote dispersal, not only over space but also through time [12], so native species may still be present in the soil for years after being displaced from the vegetation. However, in an invaded plant community, most invasive and weed species have their germination enhanced in vegetation gaps due to the higher temperature fluctuation and greater light availability [13], giving them the advantage and leading to their accelerated establishment and potential dominance over the native species in the case of any disturbance to the area. Therefore, if propagules of these species are present in the seed bank of a plant community, they usually have a better chance of becoming established if given the opportunity. This can happen when, for example, gaps are caused by disturbances to the vegetation [14]. Most studies have examined the effects of invasions by alien species but not the occupancy of weeds. It is, however, a matter of common experience that an invaded location can then promote a secondary invasion due to its impact on the seed bank, as encapsulated in the ‘invasional meltdown hypothesis’ [15].
It is also known that the disturbance or fragmentation of successionally advanced communities, their nutrient enrichment, plus the slow recovery rate of resident vegetation are all factors potentially promoting plant invasion [16]. Moreover, the seeds of alien species may be regarded as ‘sleeper cells’ that, under changing environmental conditions, may exhibit their invasive potential by the replacement of long-lived native species with short-lived alien species. This process is particularly relevant, not only in the case of invasive alien species, but also in weed species because of their high persistence and ability to germinate in a wide range of ecological conditions [17]. It is also known that eutrophication negatively influences the soil seed bank [18].
Despite all this, the effects of bait sites on soil seed banks are unknown. What is clear is that it is not only weed invasion and its associated seed rain that cause changes in the underground vegetation, but it is also the presence of contaminated forage. The level of this contamination could be very significant given the fact that local arable lands are often very weedy, the high rate of treatment with artificial herbicides notwithstanding [19]. Feeding and frequent disturbance cause an increased presence of nutrients, which in turn leads to further changes in vegetation and also in the soil seed bank.
Thus, the aim of this study is to examine the effects of bait sites on vegetation, soil seed banks and soil nutrients in a typical lower mountain area in the Mátra Mountains of Hungary. In recent years, the issue of identifying what changes will occur in natural habitats at bait sites has come to be a topic of growing interest and concern for the managers of local protected areas. Most of the forests have become degraded through intensive forestry practices over the last couple of centuries and forest management still concentrates mainly on the artificial regeneration of woodlands [20,21]. As a result, intensive commercial forestry often conflicts with the aims of nature conservation (e.g., short clearing cycles, large clear cuts, artificial forest regeneration). Hunting activities have also become more important, with the result that intensive wild game management causes significant stress in protected areas [6,21]. Moreover, climate change also presents new challenges in the region, e.g., [22,23]. These problems are well known throughout Europe, especially in Central and Eastern European countries, where the aims of wildlife management and forestry are often in conflict with the prime objectives of nature conservation. Thus, managers of protected areas often have difficulties in enforcing conservation goals. Taking into consideration the effects of climate changes and the spreading of invasive alien species, this is becoming an increasingly important issue, not only in Europe but globally.
Based on the results of a previous study [6], in this study it was theorized that: (1) the vegetation and seed banks of bait sites are more infected with weed seeds than the control sites and baits at the clearings are more degraded than the forest sites; (2) the degree of similarity between the seed banks and the vegetation is highest at the clearing sites; (3) the bait sites have more persistent seed banks because of the frequent disturbances; (4) the soil in the clearings is more nutrient rich than in the forest and the control sites.

2. Materials and Methods
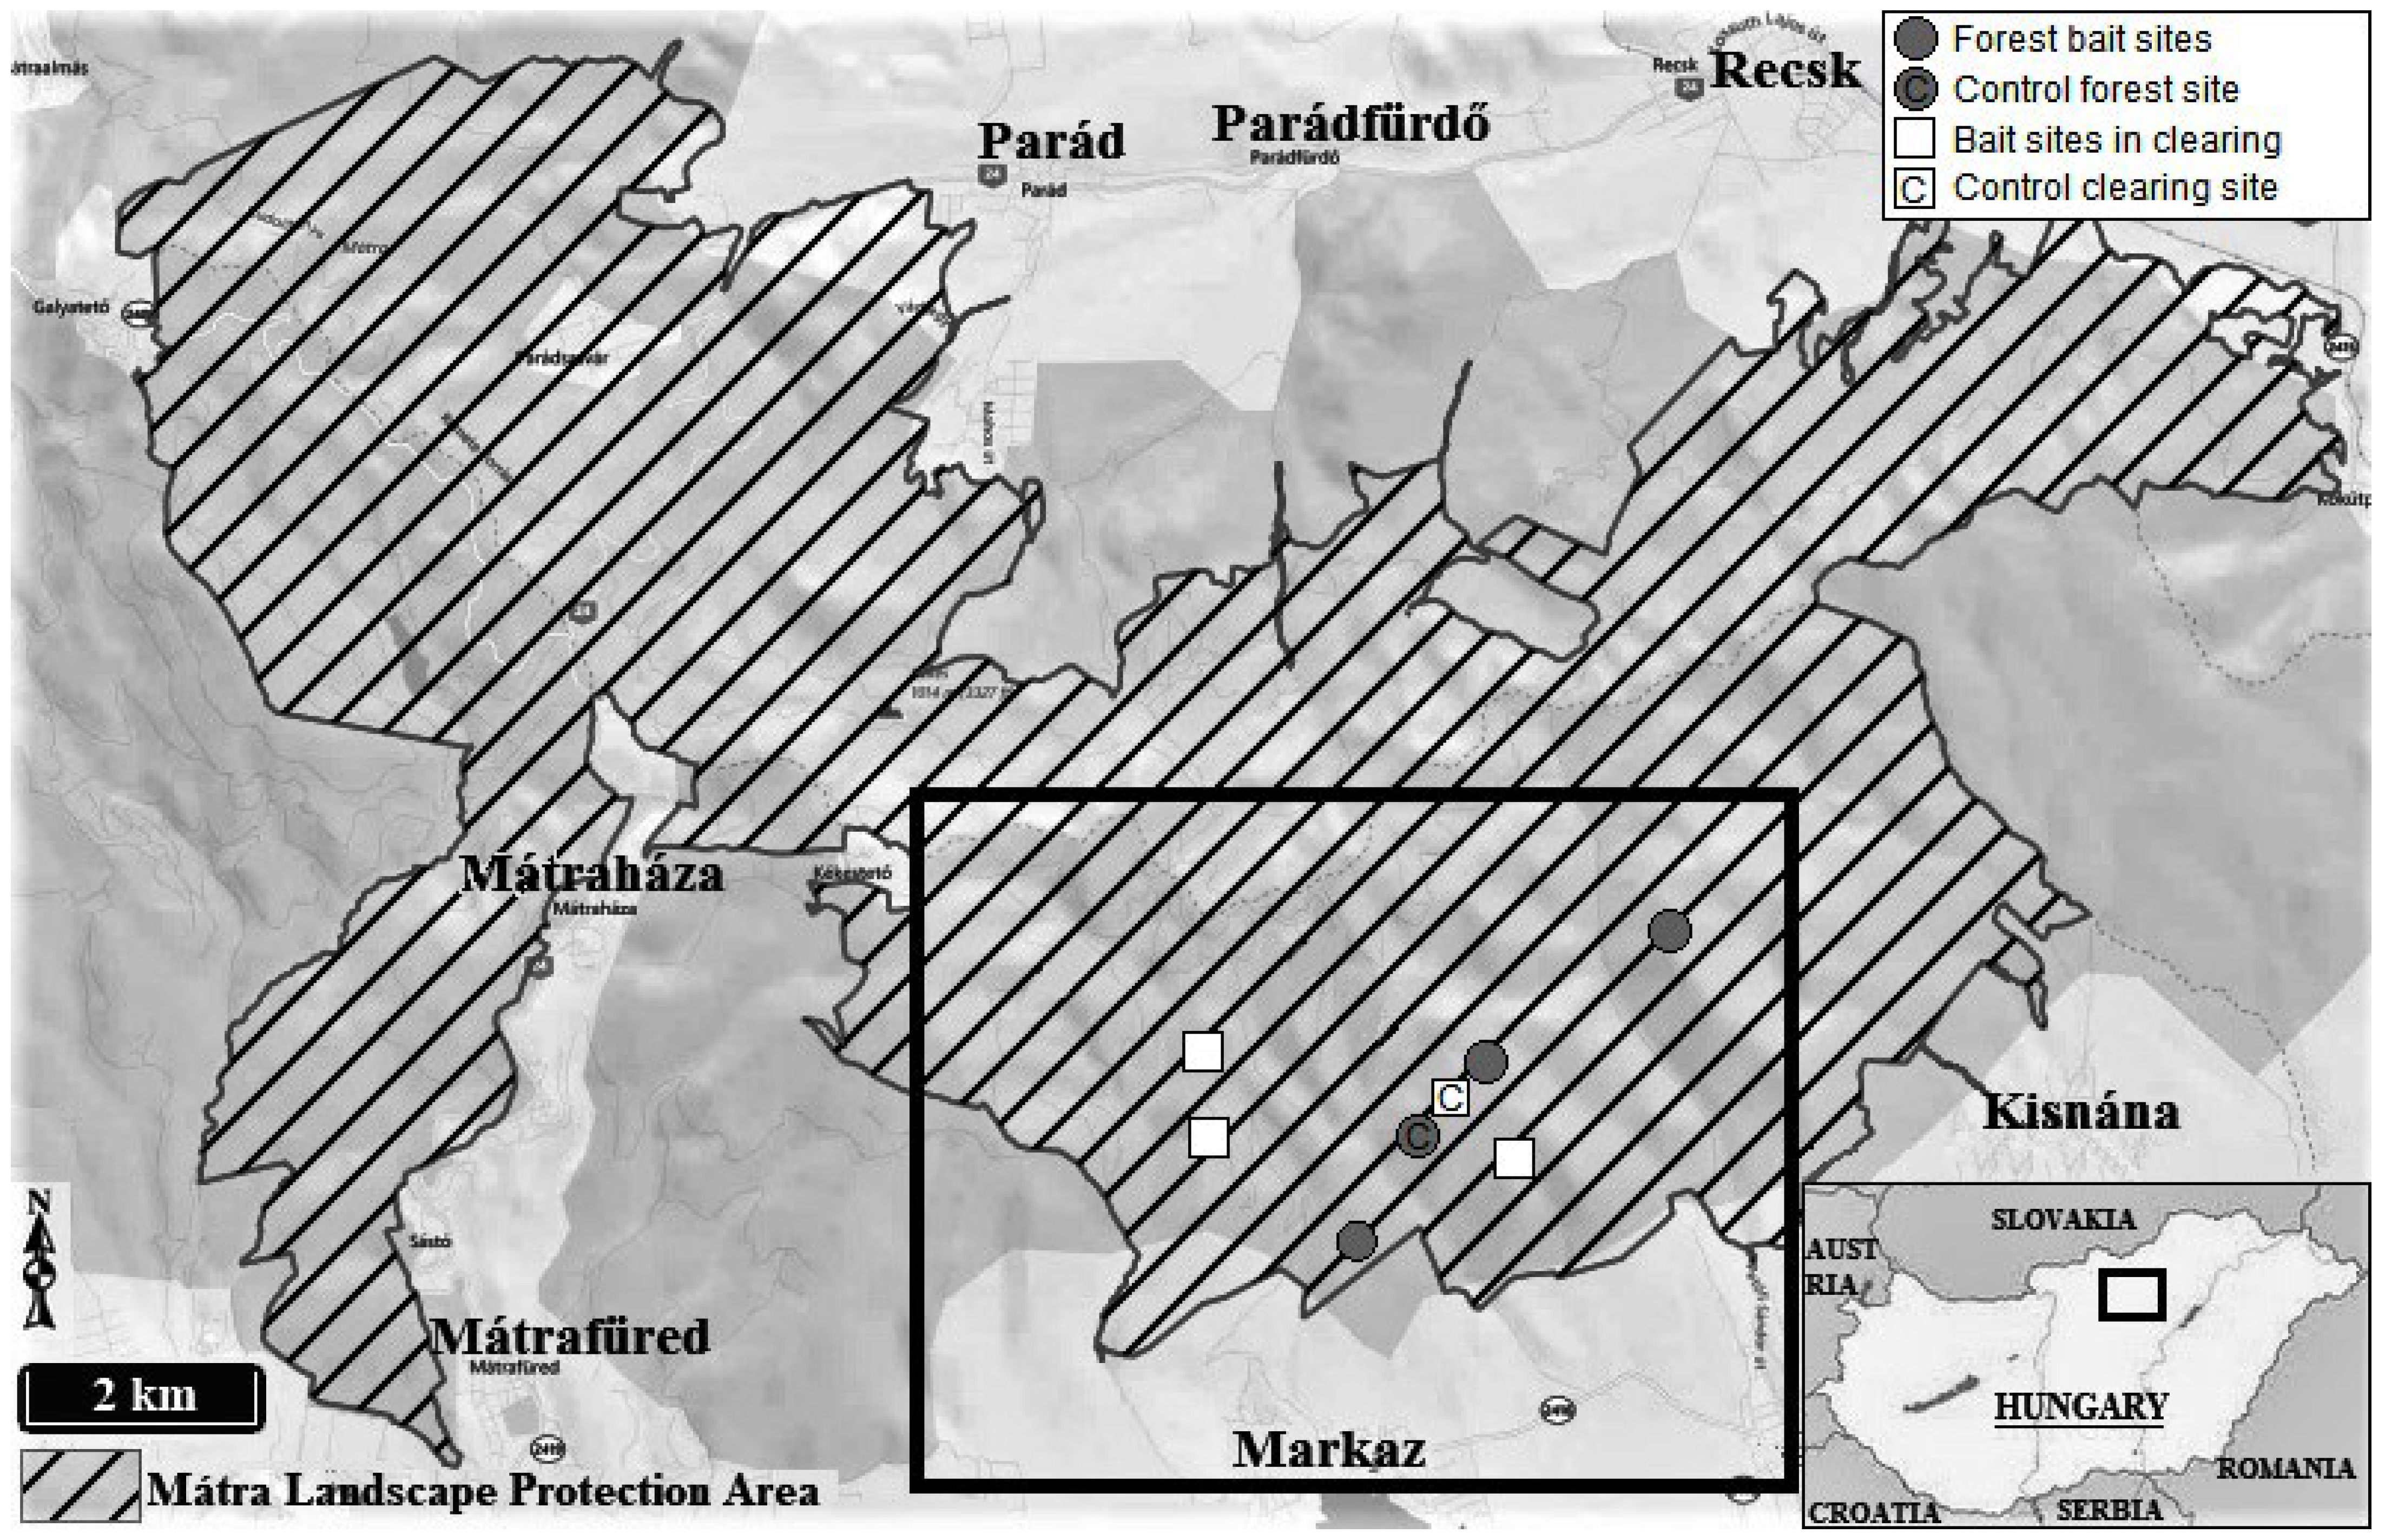
2.1. Study Area

The study area is situated in Hungary in the Mátra Mountains, representing a typical Central European lower montane zone oak forest. This mountain range is a member of the inner volcanic arc of the Carpathians. Specifically, the Mátra is part of the North Hungarian Mountain Range, which belongs to the submontane region of the Carpathians, an environment characterized by mainly oak forests [24]. The climate of the area is cool and wet. The average temperature is 6.0–8.0 °C. The annual amount of precipitation is 800–850 mm on the higher peaks and 600–700 mm in the lower parts of the mountains [25]. Among the soil types, the most common is brown forest soil with a high clay content [26]. The study area is located in the southern part of the mountain range in the turkey oak–sessile oak zone. This habitat type is a variable mixture of turkey oak (Quercus cerris L.) and sessile oak (Quercus petraea (Matt.) Liebl.). The forests are intensively logged, as a result mixed tree species are absent or very rare [20]. The study area is located in the Mátra Landscape Protection Area, where semi-natural forests are dominant. Quercus species are quite abundant, while other native woody species are rare, as is typical in Central and Eastern Europe in the turkey oak–sessile oak zone [21]. In the second half of the last century the population of big game species increased in most parts of Europe because of the extermination of apex predators (e.g., brown bear and wolf), game management (e.g., supplementary feeding) and climate change [27]. In the Pannonian Region, roe deer and wild boar numbers in particular have increased [28], resulting in the serious deterioration of forest ecosystems [21].

2.2. Sampling Setup

Based on preliminary field surveys, three different bait site types, each characteristic of the area, were chosen in 2019. Altogether, 6 bait sites were included in our assessment: three in the forest (F1, F2 and F3) and three in the clearings (C1, C2 and C3) (see Table 1 and Figure 1).
All bait sites have been in use for 5–10 years. The forest sites are located in turkey oak–sessile oak stands, with at least 80% canopy cover. The designation clearing sites refers to old clear cuttings 50–100 m in diameter, characterized by grassland species. Additionally, control sites were chosen, since reference ecosystems represent a key concept in ecology and they may provide a benchmark by which to evaluate subsequent changes in a certain habitat. As it has been proven that the most environmentally similar sites are not necessarily those geographically closest to each other [29], the reference sites should occur in the same life zone, close to the site under investigation or to the restoration project. They should also be exposed to similar natural disturbances [30]. Thus, in this study habitat, conditions were the primary concern in the choice of the control sites. A control forest (CF) and a control clearing area (CC) were chosen in the vicinity (<1 km) of the bait sites with similar habitat conditions.

2.3. Collection of Soil Seed Bank and Vegetation Data

Following the selection, the survey was conducted in May 2019. Soil was sampled in 12 plots of 10 cm × 10 cm × 5 cm at the center of all bait sites, randomly located in a circle with a radius of 2 m (a total of 6 × 12, i.e., 72 samples). At the control sites, 12 samples were taken randomly (a total of 2 × 12, i.e., 24 samples). Considering that 90% of seeds are found in the upper 5 cm of the soil [31,32], the soil was sampled to a depth of 5 cm. Soil samples were sieved through a 2 mm mesh to remove plant roots, large pebbles and other unwanted materials. Then, samples were transferred into double-layer plastic trays. The collected soil was distributed in the upper trays (forming layers approximately 3 cm thick), while the trays were perforated at the bottom to prevent water accumulation. The 12 cores were pooled for each site. The bottom tray was a simple flat plastic tray without holes. This double-decker design helps trap just the right amount of moisture and is optimal for germination. To catch any small seeds that may be washed out, the water accumulating in the bottom tray was regularly poured back into the upper tray. The trays were kept in a greenhouse, where they were irrigated regularly. Seedlings were regularly counted and removed. Unidentified seedlings were transplanted and grown until identification was possible. The typical greenhouse weed Oxalis stricta was removed from the trays and not considered in the analyses [33]. A vegetation survey was also performed in May 2019 in the middle of the baits in a circle with a radius of 2 m. At the control sites, 10 randomly placed quadrats (r = 2 m) were surveyed. The percentage cover of each species was recorded. ‘Vegetation cover’ was given based on the surface covered with plants (max. 100%), while ‘Total cover’ means the sum of all plant levels (and could be more than 100%). The cover of stones and the bare soil surface were also determined (max. 100%).

2.4. Soil Sampling

Samples for the laboratory analysis of soil were collected in May 2019. Ten samples per site, each of about 100 cm3, were taken randomly from the middle (r = 2 m) of all bait sites and control sites. During sampling, the organic horizon was removed and samples were collected from the mineral topsoil from the 0-10 cm layer. At all sites, the soil is shallow rocky brown forest soil with a high clay content [26]. The laboratory experiments were carried out at the Department of Agrochemistry of the Hungarian University of Agriculture and Life Sciences. After the mechanical preparation (chopping and sieving through meshes of 1 and 0.1 mm) and the drying of the samples, soil pH was measured in a 1:2.5 ratio (w/v) soil: water and a 1M KCl suspension with a digital pH meter, a Radelkis OP-211/2 [34]. Salinity was expressed in terms of soil electrical conductivity (ECa), measured with an electrical conductivity meter (Jenway 4520 Bench Conductivity Meter, Jenway, UK). To measure the available nitrogen content, the soil extract was dissolved in a 1 mol KCl solution. Samples were then mechanically shaken for 1 h and filtered through 0.45-μm membrane filters. The ammoniacal nitrogen (NH4+-N) and nitrate nitrogen (NO3-N) content were determined with a Parnas–Wagner steam distillation apparatus, using FeSO4 and CuSO4 for NO3 reduction [35]. Available potassium (K2O) and phosphorus (P2O5) were estimated on the basis of the ammonium lactate solution method (AL method) using a flame photometer (Jenway PFP 7, Jenway, UK) [35]. The soil organic carbon (SOC) content was determined using the Tyurin method, which is based on the decomposition caused by potassium dichromate, followed by titration with Mohr salt, following Hungarian standard MSZ-08-0210-1977 [36]. Soil moisture was also measured (10 samples per site) with a soil moisture sensor (Eijkelkamp Penetro Viewer Vs. 6.08).

2.5. Data Processing

The seed bank and the vegetation of the bait sites by types (forest or clearing) were evaluated on the basis of the species present and their abundance. To estimate the naturalness of communities, Borhidi’s social behavior type (SBT) classification [37] was used. This is a version of Ellenberg’s grouping [38] and Grime’s CSR plant functional type system [39] adapted to Pannonian flora. SBTs derive from species’ behavior and ecological attributes at a given observation level [37]. In this study, the categories were divided into two large groups: (1) naturalness indicator species/stress tolerant specialists (S), competitors of natural habitats (C), stress tolerant generalists (G), natural pioneers (NP), disturbance tolerant plants (DT); (2) degradation indicator/weed species/native weed species (W), introduced crops running wild (I), adventitious weeds (A), ruderal competitors of the natural flora (RC), alien competitors/aggressive invaders (AC). The ecological indicator values reflecting the species’ preferences for light (LB) was also evaluated (all values from Borhidi) [37]. The vegetation and seed bank composition were evaluated on the basis of their species’ lists, seed number and cumulative cover. The different bait sites and control sites were compared using the t-test and then Kruskal–Wallis, a non-parametric method for testing whether samples originate from same distribution, then the non-parametric Wilcoxon test, a paired signed rank test for paired comparison. In the interests of visualization and classification, a DCA analysis was performed. To evaluate the further characteristics of the seed banks, a transient (T), short-term persistent (SP) and long-term persistent (LP) seed bank type classification was introduced, following Thompson et al. (1997) [40]. The degree of similarity between the vegetation and the soil seed bank was calculated employing Jaccard similarity.

3. Results

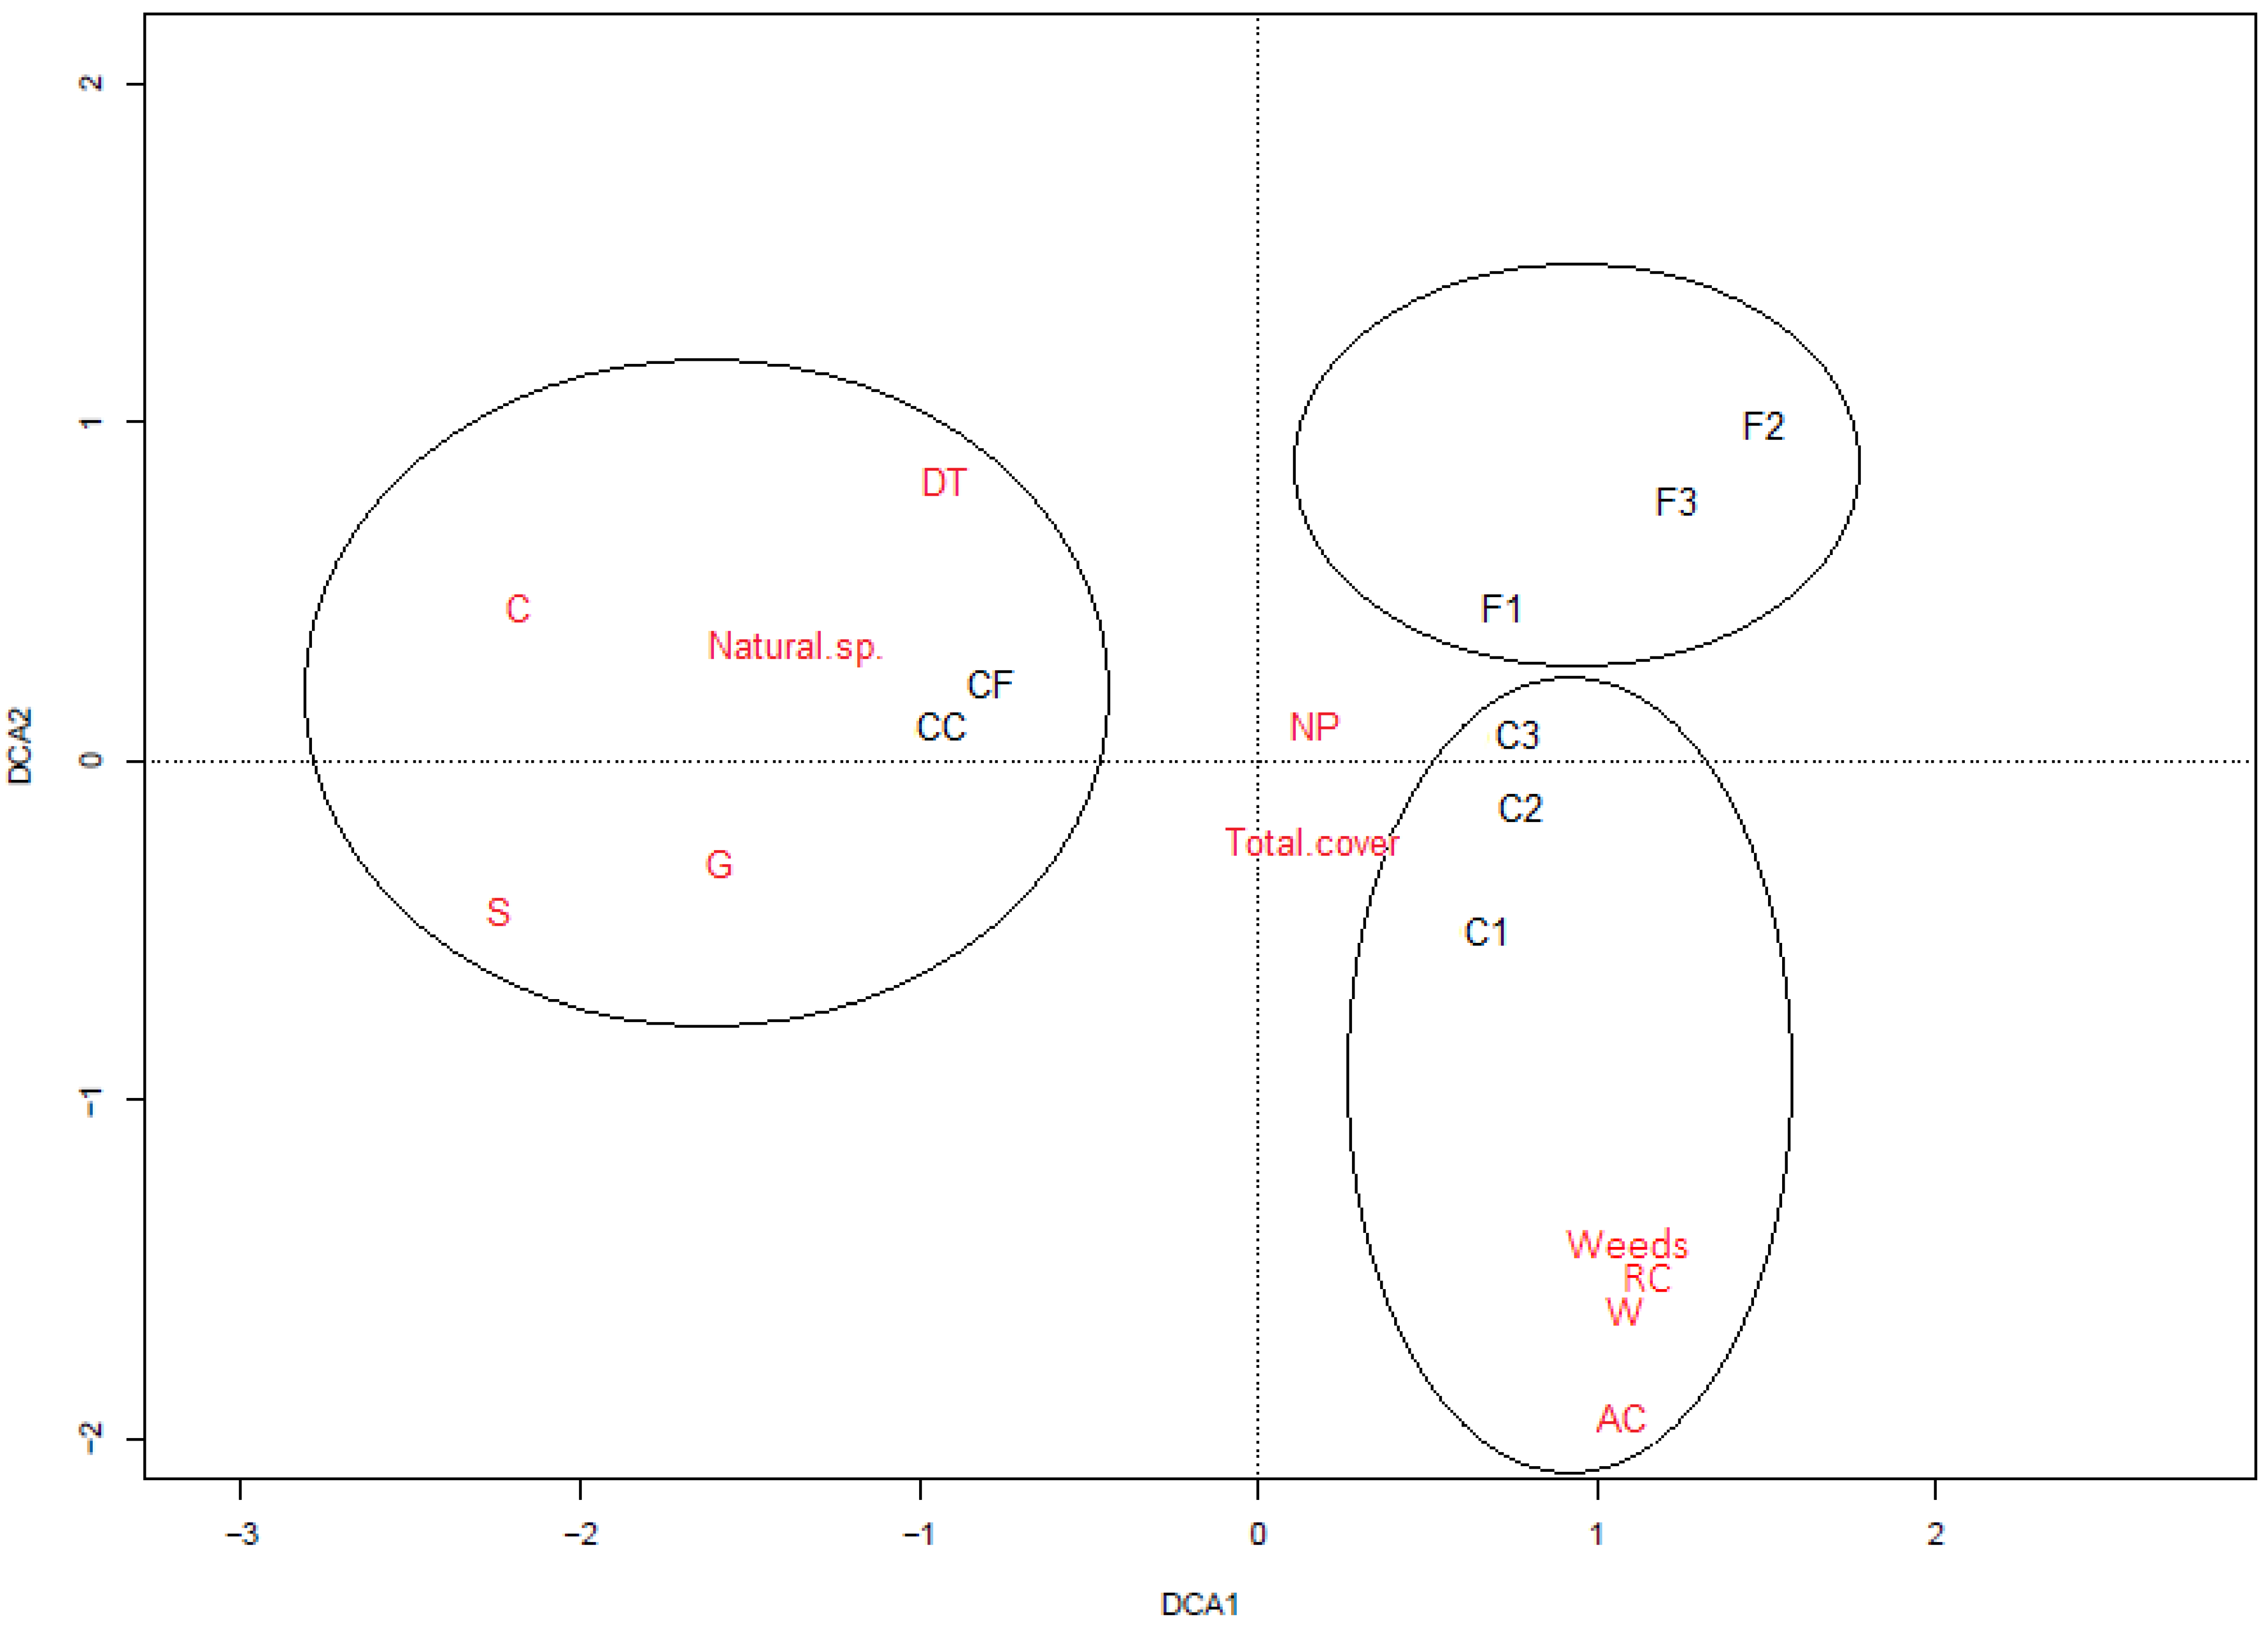
3.1. Vegetation Composition

The total number of sampled species was 109, of which 15 were found at the forest bait sites and 39 in the clearings, while at the control sites the number of species was 32 and 44, respectively. The number of alien species was 3 at the forest bait sites and 7 in the clearings, representing about one-fifth of their species pool. In contrast, no alien species were found at the control sites. At the forest bait sited, the vegetation cover was typically low (2–5%) and a bare soil surface dominated (Table 2). The sparse vegetation was characterized by only a few weeds and some seedlings of arable crops, such as sunflower (Helianthus annuus L.) and maize (Zea mays L.). In the clearings, the cover was significantly higher (p < 0.05), ranging between 30–95%. The most abundant species was common knotgrass (Polygonum aviculare L.), with a coverage reaching up to 80%. In addition, weeds associated with mainly arable crops, such as Xanthium spinosum (L.), Tripleurospermum inodorum (L.) and Amaranthus retroflexus (L.), were abundant. However, no significant difference was found between the two bait types, only the number of ruderal competitors (RC) was significantly higher at bait sites in the clearings (p < 0.05). The proportion and the abundance of degradation indicator species were very similar at the bait sites, with more than half of the species and the cover being weeds at each site. In contrast, the vegetation of both control sites was characterized by the high-percentage cover of naturalness indicator species; in this respect, a significant difference was found between them and the bait sites. The total number of species (p < 0.05) and the number of natural species (p < 0.001) was higher at the control sites, while the proportion of degradation indicator species was significantly lower (p < 0.01). The cover of the natural species (p < 0.001) and the total cover (p < 0.05) were also significantly higher at the control sites. The cover and the number of weeds did not differ between the bait sites and the control sites, but this is only due to the sparse vegetation of the forest sites in contrast to the cover of the clearing sites.
According to the DCA analysis, the two types of bait sites and the control sites are well differentiated (Figure 2). Natural species (S, C, G, DT) were the most abundant at the two control sites, while weed species (W, I, A, RC, AC) were mainly abundant at bait sites in the clearings. Habitat differences between the types of bait sites were also found to be clearly detectable. The forest bait sites, with their sparse vegetation, form a group clearly distinguishable from the clearing sites, which are typically characterized by a high abundance of plants. In contrast, the total cover and the cover of natural pioneer (NP) species proved to be less determining.

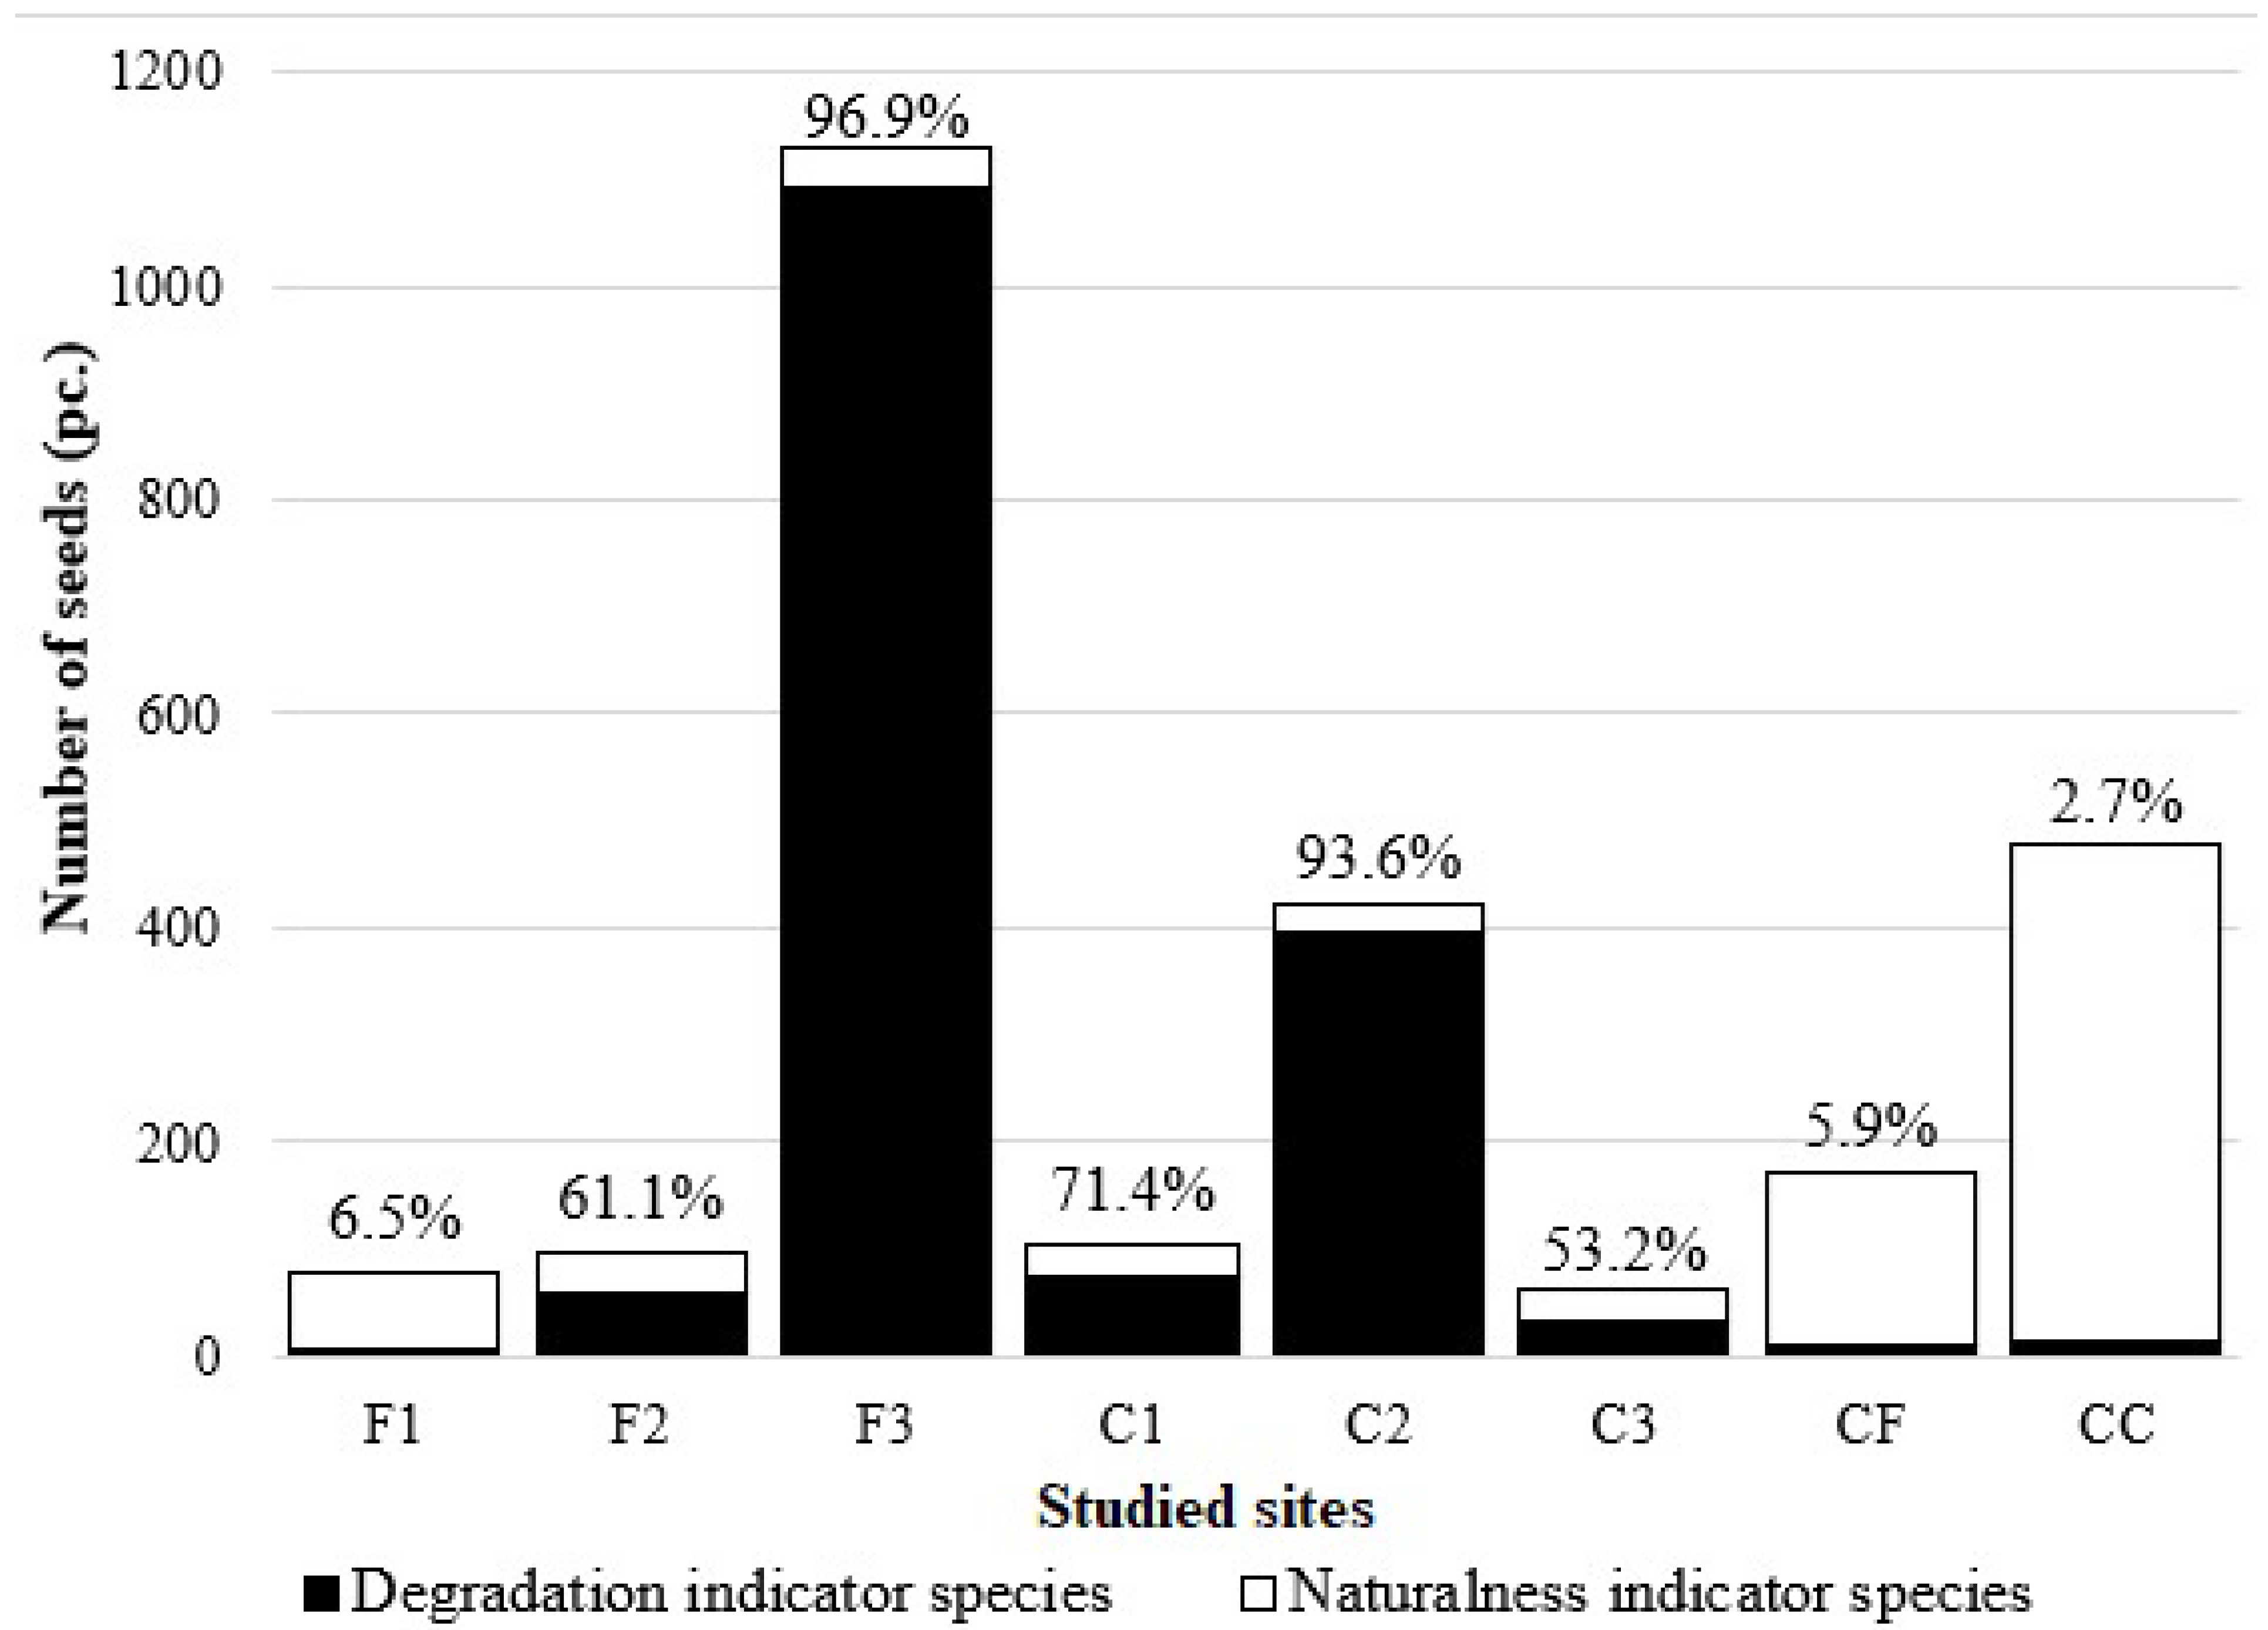
3.2. Seed Bank Composition and Density

The total number of species found in the soil seed bank investigation was 86, of which 52 were natural (60.5%) and 34 were weed species (39.5%). At the forest bait sites, 36 species were found, with 13 weed species (36.1%), of which 4 were alien taxa. At the bait sites in a clearing, 46 species, including 27 weeds (58.7%), were detected, of which 11 were alien. It means that nearly half of the weed species were alien plants (40.7%). Among the species occurring only in the seed banks of the clearing sites (27), there were 18 weed species (66.7%), including 7 alien plants. That means that just over a quarter of the site’s species pool was non-indigenous (25.9%). Weed species dominated the seed bank both in number and in seed density, and typical grassland species were virtually absent. It is also important to note that a significant difference was found between the levels of light demanded by the various species. Those occurring only in the seed banks of clearings have significantly higher (p < 0.05) light preference (LB) values than species occurring only in the seed banks of forest bait sites. By contrast, only 4 of the total forest bait site species (23.5%) were weeds and no alien varieties were present in this pool. In addition, typical forest species, such as Carex divulsa (Stokes), Juncus effusus (L.), Moehringia trinervia (L.), Scrophularia nodosa (L.), Prunella vulgaris (L.) and Mycelis muralis (L.), proved to be the most frequent species. Protected species such as Iris graminea were also found, though in this case it was present in the form of only one seed. The total seed density—likewise the amount and the proportion—of weeds varied between the sites (Figure 3). The total seed density had values of 642, 792 and 9400 seed/m2 at the forest bait sites, with 875, 3517 and 517 seed/m2 at the bait sites in the clearings, respectively. The proportion of weeds differed widely, from 6.5% to 96.9%, at the bait sites. At one control forest site the total seed density was 1417 seed/m2 and 3975 seed/m2 at a clearing site. All in all, the bait sites proved to be more infected, since the proportion of weed seeds was orders of magnitude higher at the bait sites (87.8%) than at the control sites (3.6%), with the difference proving to be slightly significant (p < 0.05). The seed density was lower at the bait sites than the control sites, apart from two cases (F3, C2) where the particularly high amount of weed seeds caused an increased total seed density. The proportion of weed seeds was significantly higher at all bait sites (p < 0.05), except site F1 which proved to be akin to the control site. At the same time, the number of seeds of natural species was clearly significantly higher at the control sites (p < 0.01). On average, 76.6% of the germinating seeds in the clearings were weed species, while in the control clearing area this proportion was only 2.5%. The average proportion of weed seeds at the forest sites was lower (57.3% at the forest bait sites, 5.6% at the control site). There was an especially high value in the case of F3, where a single common species, white goosefoot (Chenopodium album L.), represents 85.6% of the seed bank.
The number of species was also quite variable between the examined sites, but in general it was lower at the forest bait sites than at the sites located in a clearing. The total species numbers were 12, 23 and 19 (mean: 18.0) at the forest sites and 25, 29 and 26 (mean: 26.7) in the clearings, with no statistically detectable discrepancy. However, significant differences were found in the cases of the ruderal competitor species (RC) and the alien competitors/aggressive invaders (AC). The number of species belonging to these groups was higher at the clearing sites (p < 0.05 and p < 0.001, respectively). The number (p < 0.05) and the proportion (p < 0.05) of weeds also proved to be higher at the bait sites in a clearing. Between the bait sites and the control sites, only the number of competitors of natural habitats (C) (p < 0.001) and thus the number of natural species (p < 0.05) differed significantly. Contrasting with the total species pool of the six-examined bait sites and the two control sites, the proportion of weed species was higher at the bait sites (49.2%) than at the control sites (19.1%). As the DCA analysis showed, the two control sites may be clearly distinguished on the basis of the number of natural species (Figure 4). The forest bait sites proved to resemble the control sites, with more natural species, while the bait sites in the clearings formed a more distant group.

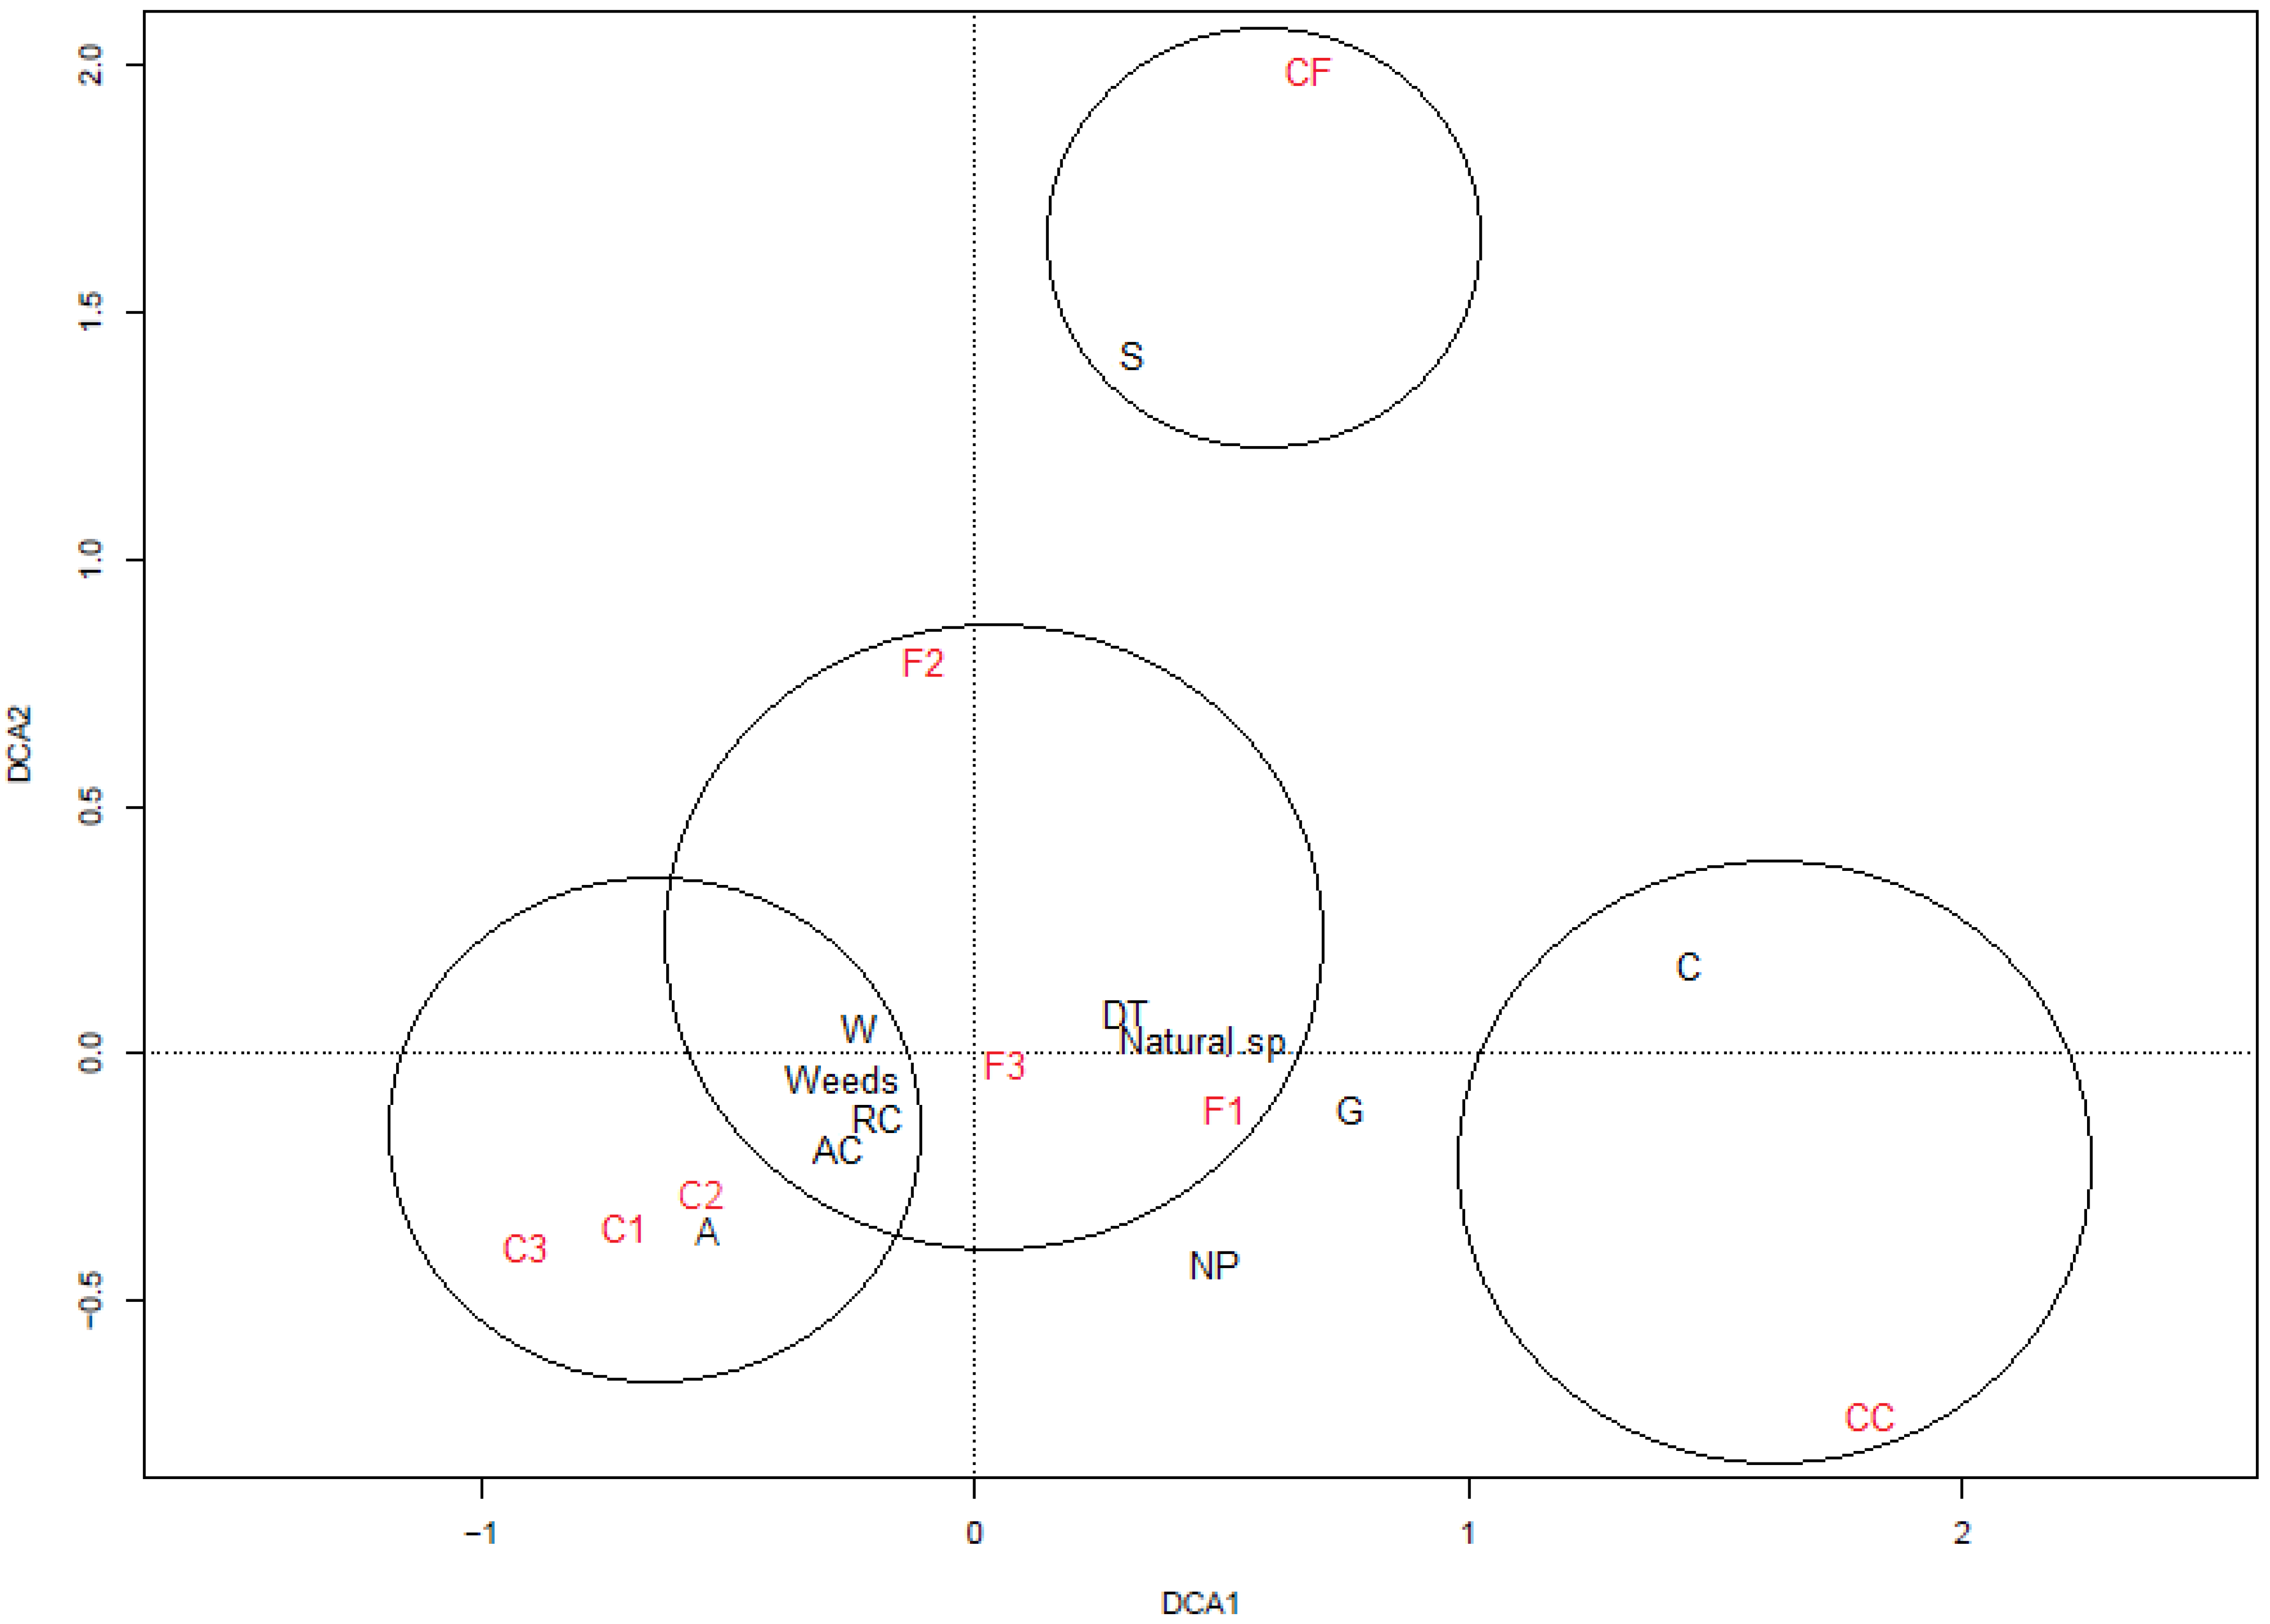
3.3. Relationship between Vegetation and Seed Bank

The similarity between the vegetation and the seed bank proved to be the highest at the bait sites in a clearing (Jaccard index: 0.31, 0.31 and 0.29; average: 0.30; standard deviation: 1.24). For bait sites in the forest, the average was only 0.05 and the difference between the two types of bait sites was highly significant (p < 0.001). The similarity was 0.19 at the control forest site and 0.23 at the control clearing site. Consequently, the number of species present in the vegetation and in the soil seed bank was significantly higher (p < 0.01) at the bait sites in the clearings than in the forest. Moreover, considering this group of species, the number of weed species proved to be significantly higher (p < 0.01) at the clearing sites. The number of species that can only be found in the vegetation was significantly higher (p < 0.01) at the control sites, while the proportion of weeds was lower (p < 0.01).

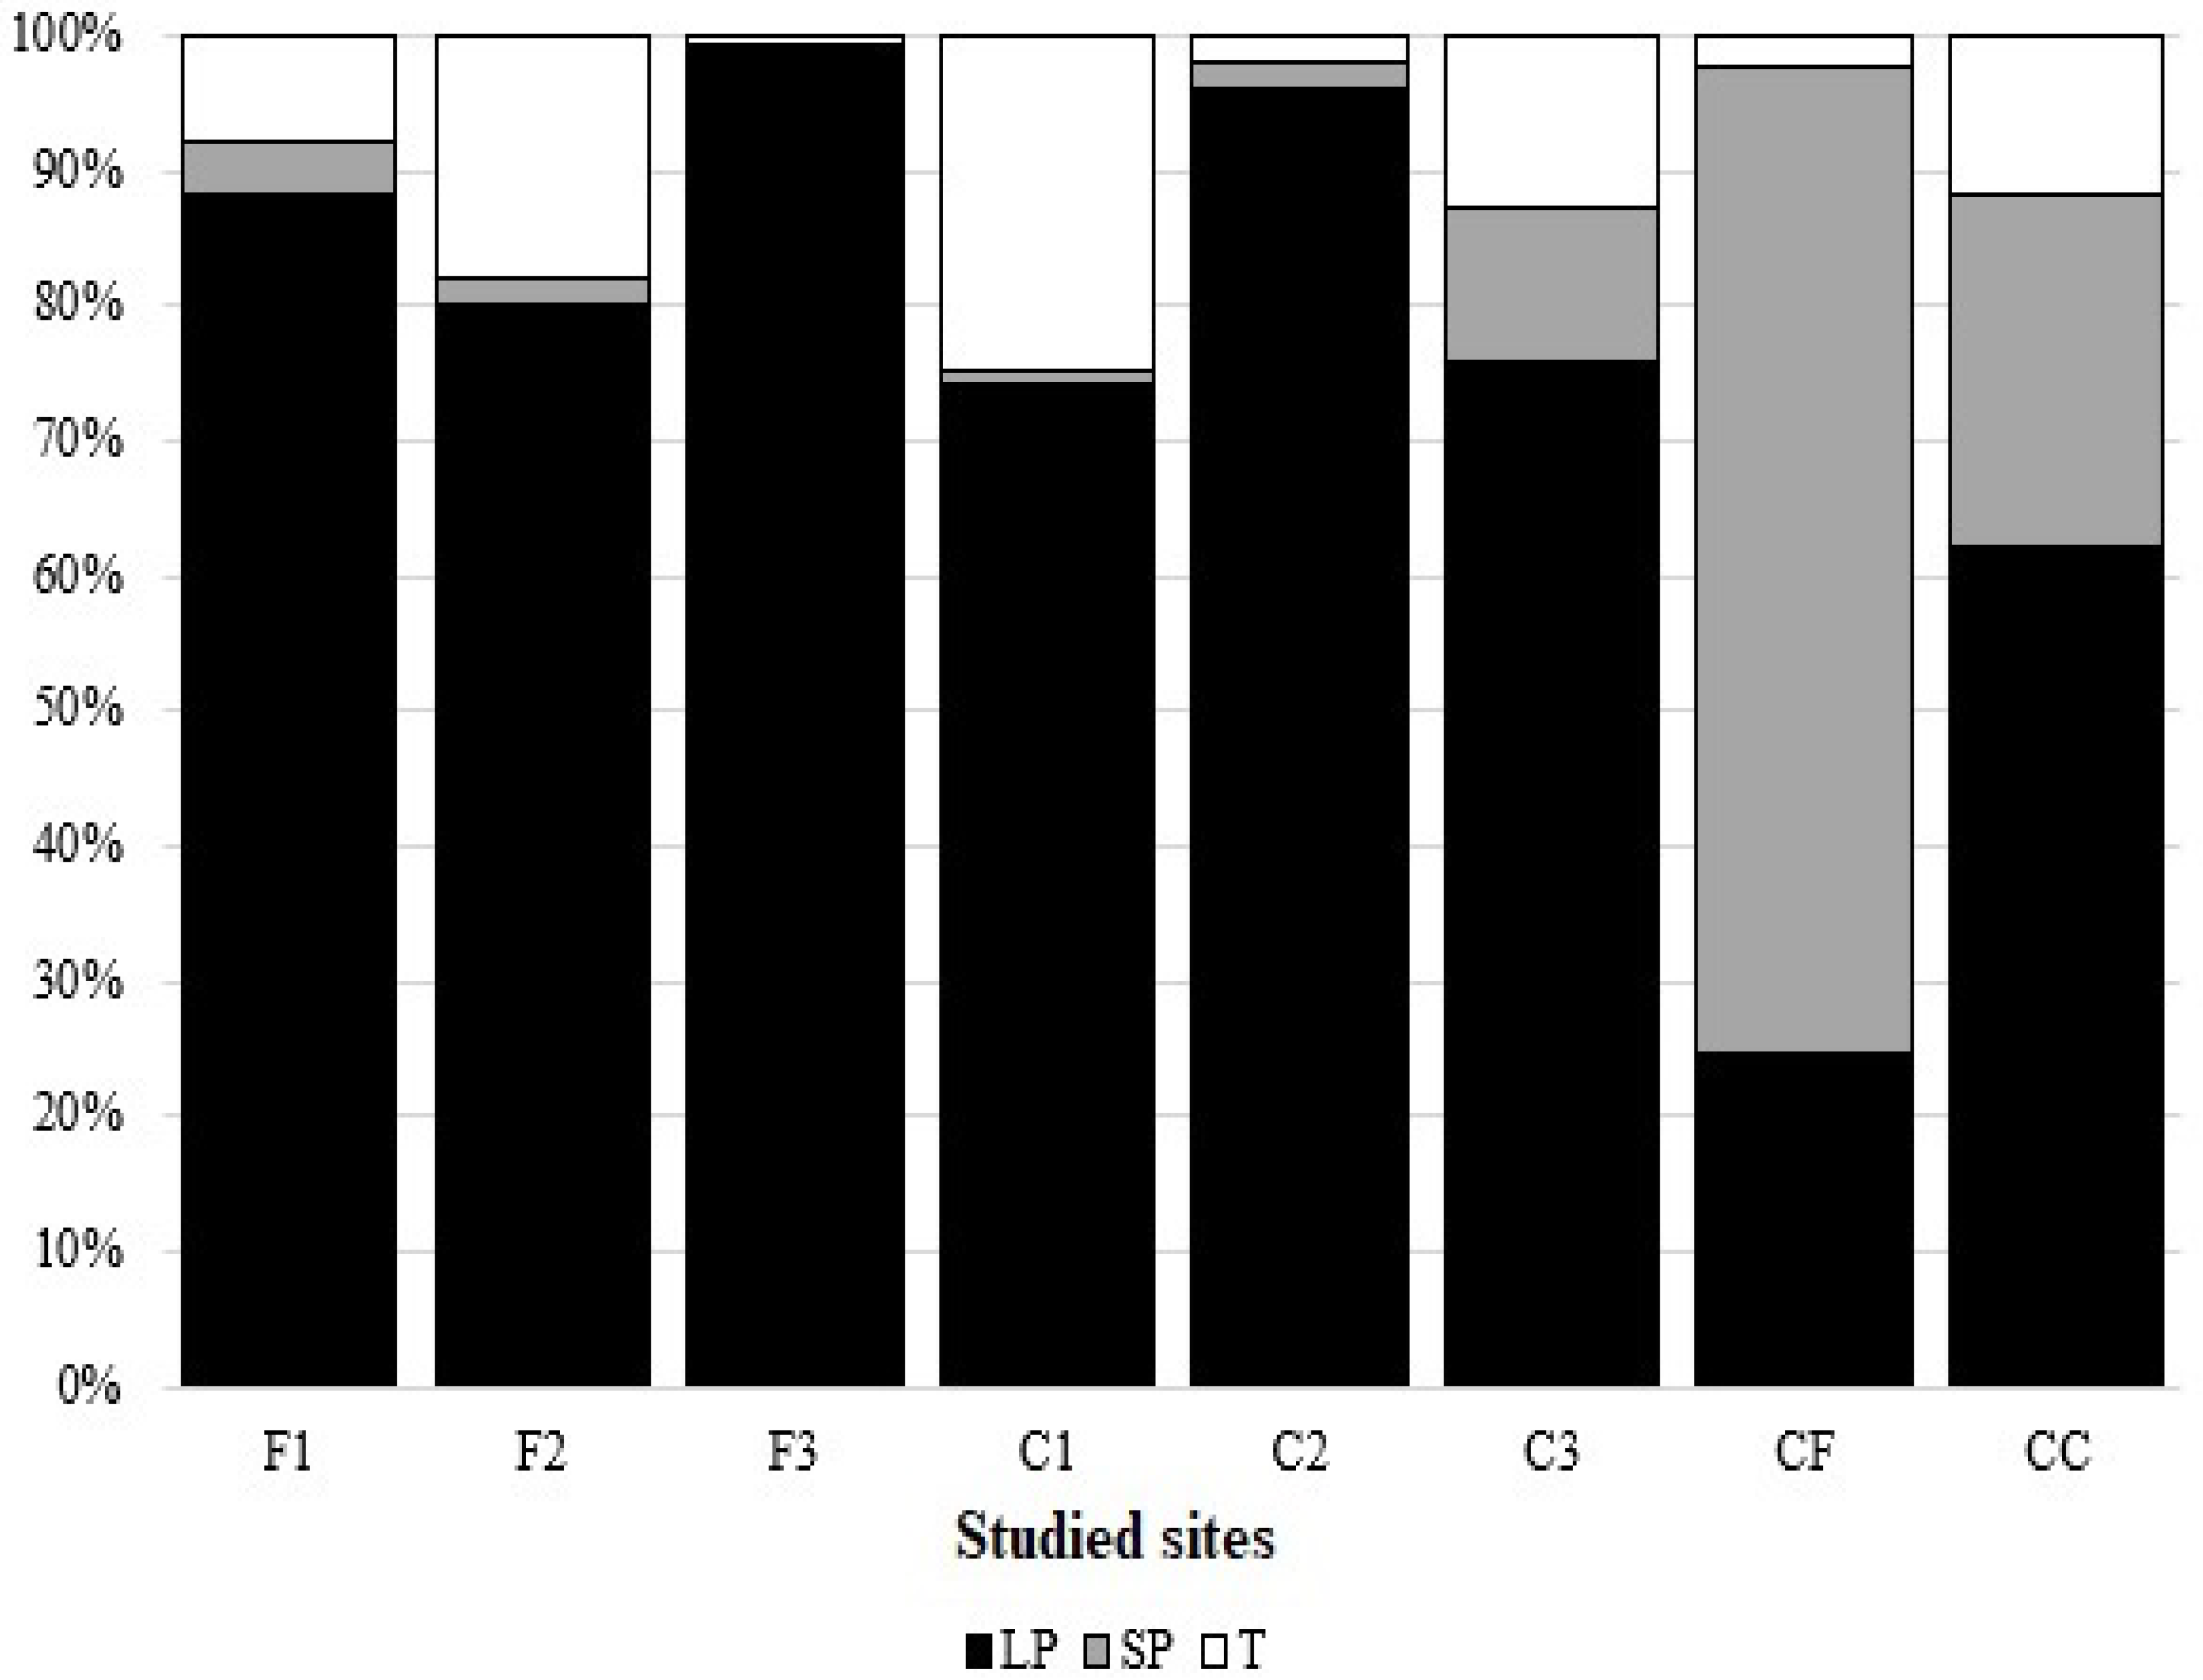
3.4. Seed Bank Persistence

Regarding the different persistence categories, no significant differences were found between the bait sites. Considering seed density and species number, the number and proportion of the different persistence categories were similar (Figure 5). Long-term persistent species dominated in all cases. Only between the six bait sites and the two control sites were there any significant differences. The seed number (p < 0.001) and their proportion (p < 0.01) of short-term persistent (SP) species were significantly higher at the control sites. In the case of the long-term persistent (LP) species, the proportion of their seeds (p < 0.05) and their species number (p < 0.01) was significantly higher at the bait sites. In the case of the transient (T) category, only the proportion of the species proved to be significantly higher (p < 0.05) at the control sites.

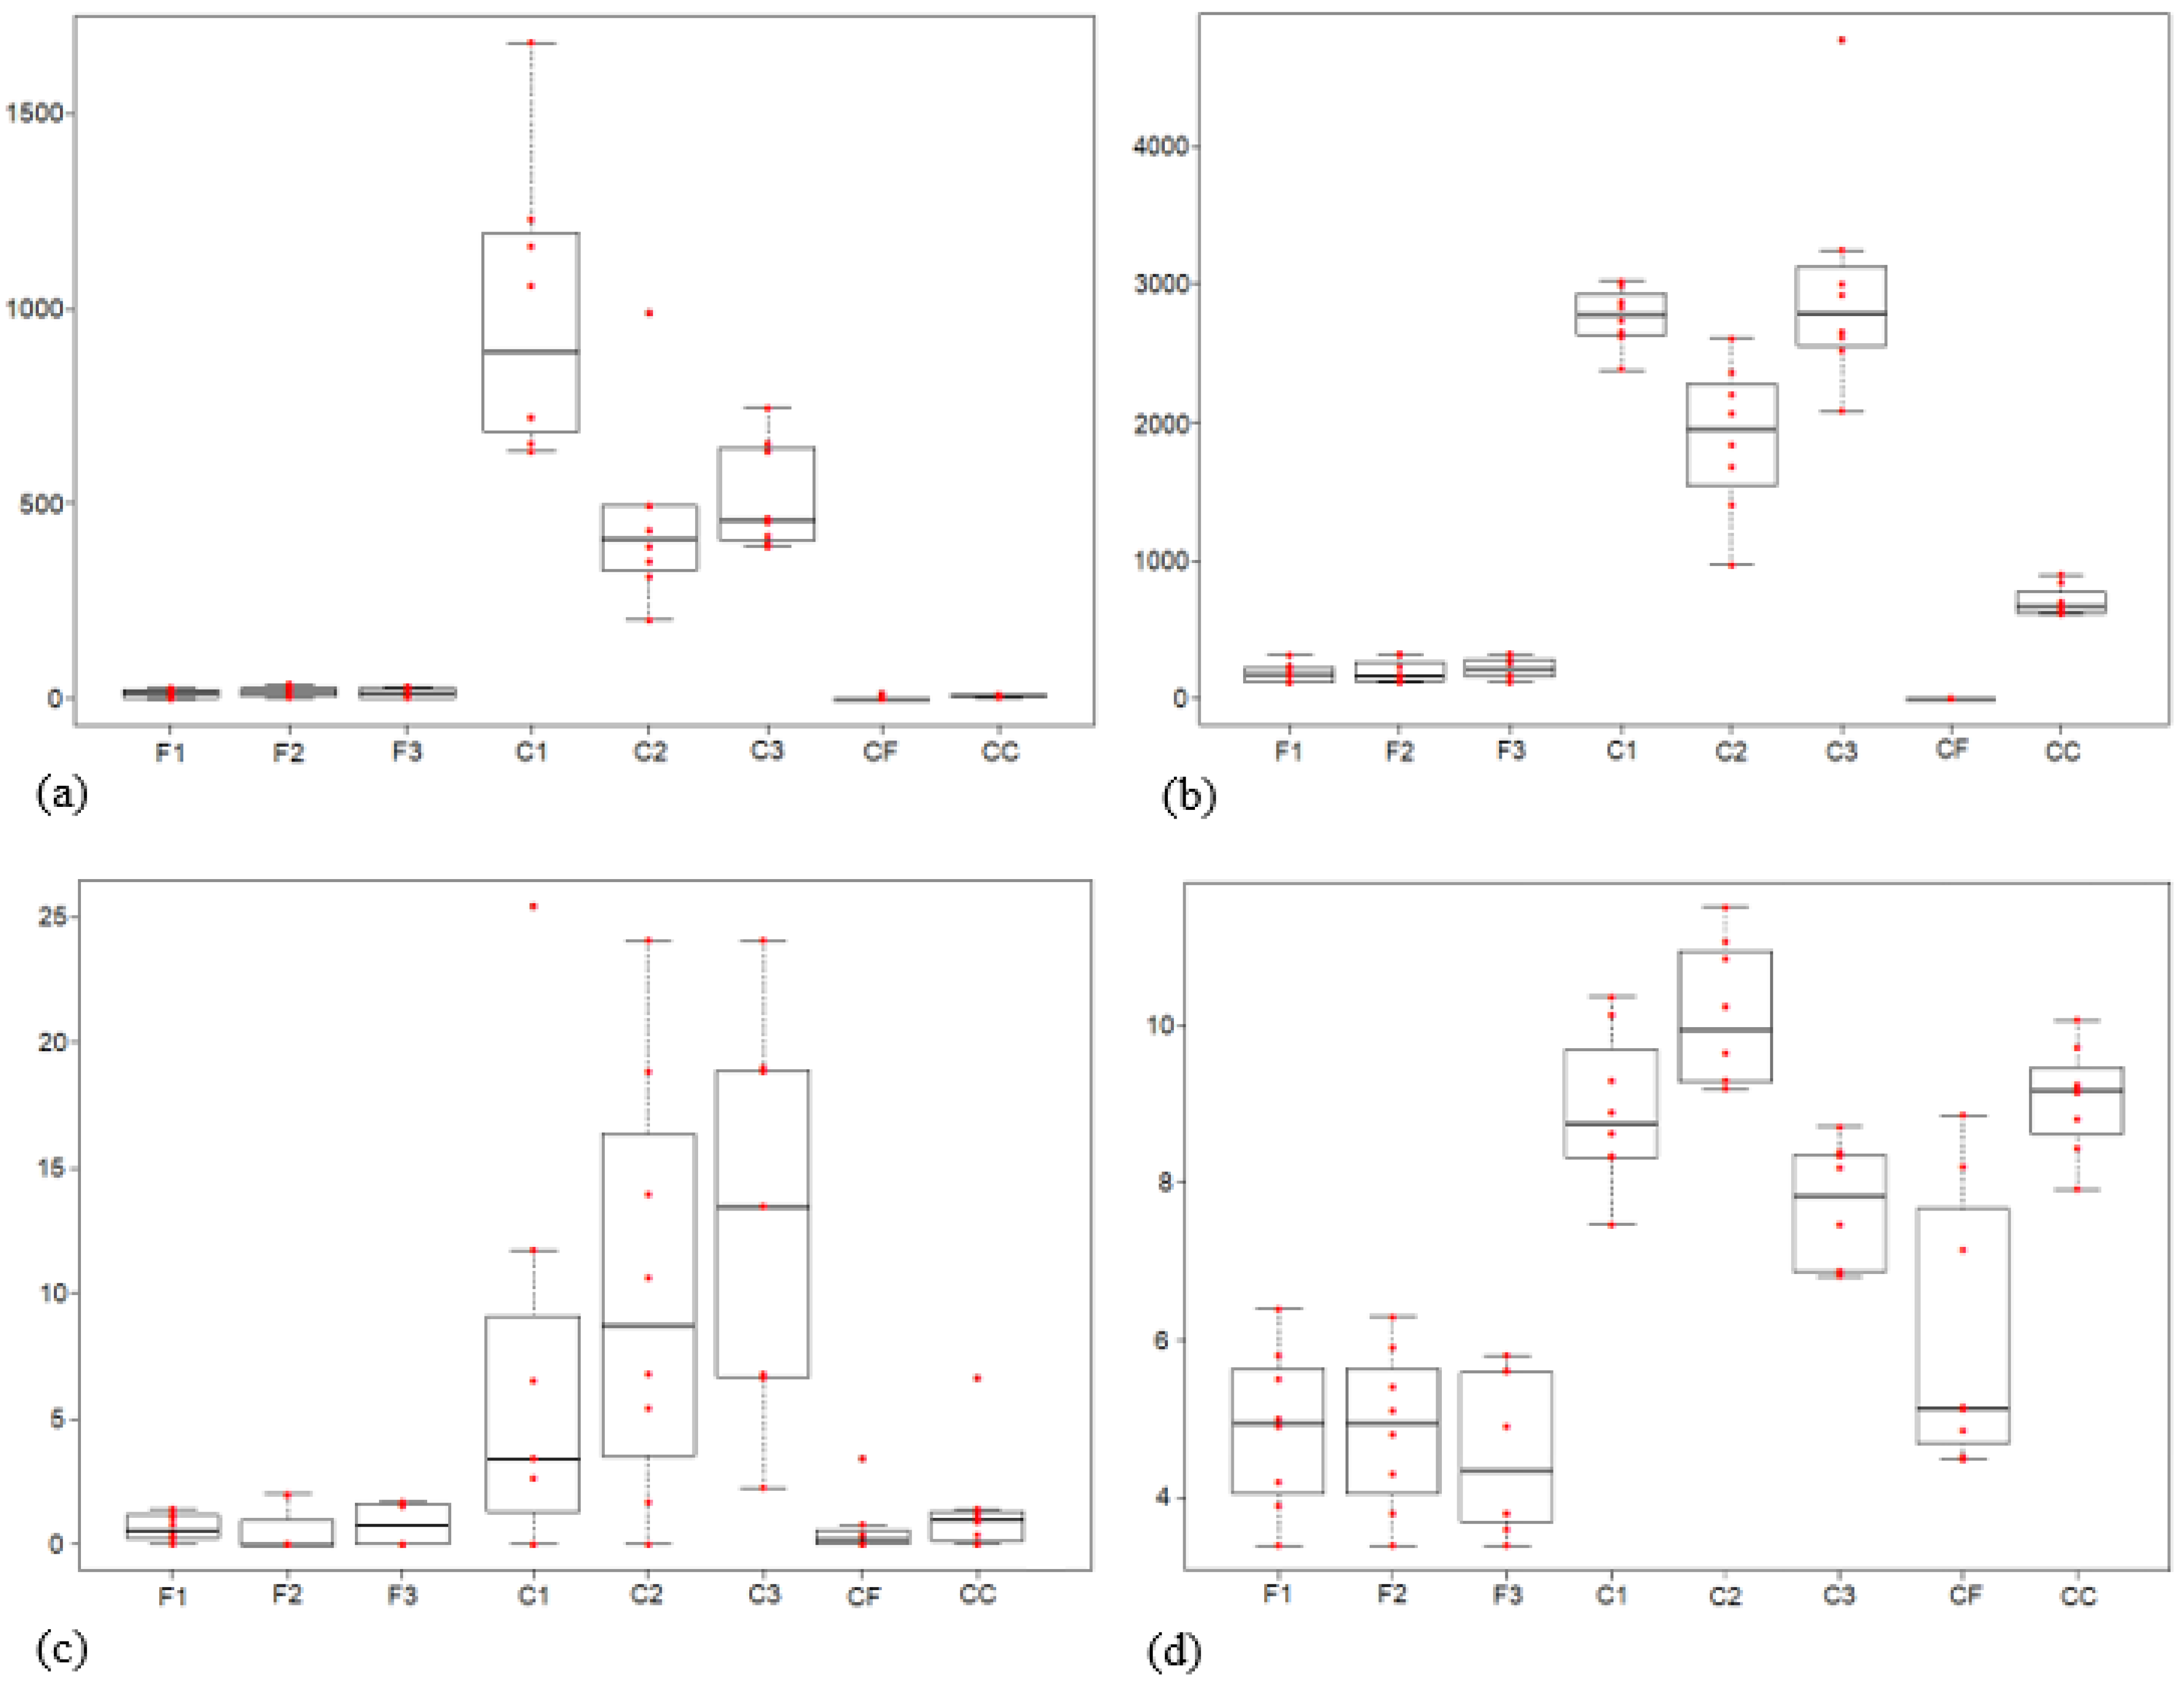
3.5. Soil Characteristics

Major differences in soil properties were revealed at the examined sites, especially between the two types of bait sites (Table 3). A bare soil surface was significantly higher (p < 0.05) at the forest bait sites, while soil pH proved to be lower at these sites (pH (H2O): p < 0.05; pH (KCl): p < 0.05). The cover of stones, the salinity, the soil humidity and NH4-N did not differ significantly. Between the bait sites and the control sites, we found no differences, aside from the salinity, which was significantly higher (p < 0.05) at the bait sites.
However, the main soil nutrients—phosphate (p < 0.05), potassium (p < 0.01) and nitrate (NO3-N) (p < 0.01)—as well as humus% (p < 0.01) were significantly (more than 10 times) higher in the clearings (Figure 6a–d).

4. Discussion

4.1. Vegetation Composition

Considering the density and the number of degradation indicator species in the vegetation, no significant difference was found between the two types of bait sites. The proportion and the abundance of degradation indicator species were very similar at the bait sites; more than half of the species and the cover were weeds in all cases. Only the number of ruderal competitors (RC) was significantly higher at the clearing bait sites. Differences were found in the total number of species and the number of alien species. Both were higher in the clearings than in the forest and higher than in their control sites. The absolute cover of vegetation also proved to be significantly higher at the clearing sites. The aforementioned differences arise from the habitat characteristics of the selected types. Mainly, open habitats are demonstrably more susceptible to invasion. It is also generally assumed that forests with a closed canopy are highly resistant to plant invasions [41]. Although there is evidence that invasions may occur in closed forests, in such cases this is closely related to human intervention [42]. In the case of the bait sites, there is a high amount of contaminated forage, which is presumably free of shade-tolerant species, as it originates from open agricultural habitats and contains mainly light-demanding species. These, in turn, are not able to get established at closed-canopy sites. It is also important to note, however, that disturbances can strongly affect the extent to which a habitat is susceptible to invasion. Furthermore, given that weeds are mostly therophytes with a higher specific leaf area, earlier and longer flowering, plus a higher affinity for nutrient-rich, sunny and dry environments compared with non-weeds [43], they are much more likely to colonize such a disturbed environment. In this way, they may cause a more extensive invasion not only in clearings but also in forests, especially when canopy closure is not so dense or a gap is formed due to human or natural disturbance. The degradation of the bait sites has already been clearly demonstrated. In general, there was a high density of weeds at the clearing sites, while the forest bait sites were characterized by sparse vegetation with a strongly disturbed bare soil surface. Previous results have also indicated this tendency [6]. It is possible to confirm that there are significant differences between the bait sites and their control sites. The vegetation of both control sites was characterized by a high-percentage cover of naturalness indicator species. The cover and the number of natural species were higher at the control sites and the relation proved to be strongly significant. The proportion of weeds was also significantly lower at these sites.

4.2. Seed Bank Composition and Density

As was also the case with the vegetation, slight differences were found between the two types of bait sites in terms of their soil seed banks. The proportion of weed seeds was similarly high in the case of all the bait sites. However, the species pool of the sites located in the clearings was characterized by the presence of more weed and alien species, and typical grassland species were nearly absent. In contrast, a relatively large number of natural forest species was found at the forest bait sites. These differences mainly originate from habitat characteristics. Firstly, environmental conditions at the clearing sites are preferable for the more light-demanding weed species. Secondly, it has been found that in several grassland types most of the characteristic species have only sporadically persistent seed banks [44,45]. The total seed density proved to be variable, which is also true of most natural and semi-natural habitats [46]. The amount and the proportion of weed species also fluctuated between bait sites. In this respect, there was no detectable difference between the different types of bait sites, with the highest value found at a forest bait site, which proved to be not so infected in terms of the above-ground vegetation. In the case of F3, 96.9% of the total seed density was weed species. Similar results were found in an invaded community studied by Dairel and Fidelis (2020) [14], in which invasive species contributed 98% of the total seed number. This is presumably due to the different (and often poor) quality of forage used at bait sites and maybe the epizoochorous dispersal by wild boar. Heinken et al. (2006) [47] examined forest areas in central Europe and proved that many more ruderal species were found near places where wild boar rub against trees. As in the results presented here, Chenopodium album proved to be the most frequent species.
The relatively low seed density at the bait sites in clearings was presumably caused by the shading effects of invading weeds [43,48] and may be due to their frequent disturbance. Results to the contrary have also been found, since many studies have demonstrated that the greatest species richness and seed density are to be expected on the most stressed grasslands [49,50]. However, these studies examined the effects of grazing at different levels of intensity, a phenomenon not nearly as severe as baiting, one in which external seed inputs are more intensive, soil disturbance caused by frequent animal and human trampling is more serious and much deeper layers of the soil are affected. The mechanisms are similar, also resulting in more aggregated seed distribution in the soil and unfavorable soil conditions, such as a high degree of soil compaction. This, in turn, may lead to decreased oxygen availability in the soil, which can reduce the chances of seed survival [46]. The outstanding values may well be due to the fact that baiting is not strictly regulated, thus feeding is conducted with forage from different sources and of variable quality. This may have caused the high amount of weed seeds at one of the forest bait sites (F3), and may also be the reason why no differences in weed seed density were detected between the different types of bait sites despite the discrepancies revealed in the above-ground cover. The seed density of the control sites was similar to other studies. The seed density detected at the forest control site (1417 seed/m2) was very similar to those which have been found in oak forests [51,52]. The value in the control clearing (3975 seed/m2) was also consistent with other studies, which give values of 3395–6300 seed/m2 in dry-mesophilous mountain grasslands in Hungary [53]. In some cases, the abundance of weed seeds at the bait sites was so high that it was already close to the density found in arable fields. These other studies, however, usually involve much deeper layers of soil, thus they generally give weed densities from a few thousands up to hundreds of thousands [54,55]. However, studies that—as is the case in this study—sampled the topsoil have found only a few thousand weed seeds. In Serbia, a density of 1630–9350 seeds/m2 was found in the upper 4 cm layer of the soil [56], which is similar to the results revealed at the bait sites in this study. This clearly shows the effects of baiting, which mainly arise from the use of huge amounts of weedy forage by hunters.

4.3. Relationship between Vegetation and Seed Bank

In general, a low degree of similarity was observed between the composition of vegetation and the seed bank, and this agrees with the results of other studies carried out in other different habitats in Hungary [45,57]. The highest degree of similarity was found at the bait sites in the clearings, while the lowest was detected at the forest bait sites. In the case of the control sites, the forest site also displayed a lower degree of similarity to the clearing site. This is consistent with the results of many studies, in which it has been found that the degree of similarity between standing vegetation and its associated seed bank is lowest in forests, while these are most alike in grasslands [58]. The results of this study confirm a higher degree of similarity at the two types of bait sites compared with their control sites. The highest values were found at the bait sites located in the clearings (0.29–0.31). Likewise, it is possible to confirm the notion according to which frequently disturbed communities will have a high degree of similarity, and that similarity increases with an increasing level of disturbance [31,50]. Many studies have found that overgrazing and other forms of intensified land use result in a greater similarity between established vegetation and seed banks [59]. For instance, a similar result was seen in a study by Tóth and Hüse (2014) [60]. However, in general, a low degree of similarity was found in the values in the case of all sites examined. The value observed at the control clearing site (0.23) proved to be consistent with some studies implemented in semi-natural mesophilous mountain grasslands [61]. In contrast, Bossuyt and Honnay (2008) [49] reported higher Jaccard similarity in the case of grasslands, and we have also found studies reporting degrees of similarity up to 0.48 in Hungary [45]. This is presumably due to the differences between grassland types [33] as, in general, drier meadows have a lower level of similarity [53]. The similarity of the values also depends on the season in which the sampling is conducted. Kemény et al. (2005) [62] found that the similarity was lower in samples taken in the spring than in the autumn. Thus, the lower values in this study may have been caused in part by sampling in May and the fact that the sites are located on ridges, in a dry environment and the objects of the examination were not extended habitat patches, but rather point-like patches.

4.4. Seed Bank Persistence

Persistent seeds dominated in all cases, especially at frequently disturbed bait sites. No significant differences were found between the two types of baits. Only the relatively undisturbed control sites differed from the actual bait sites. Many studies have shown that in general, invaded sites are dominated by species with persistent seeds, as increases in seed persistence are associated with increases in the level of disturbance [46]. This has also proven true in cases of disturbances caused by grazing [31,50] and it is evident in habitats such as arable fields, fire-prone shrublands and temporary wetlands as well, all of which may suffer unpredictable catastrophic disturbances [46]. In degraded habitats, such as mine and quarry spoil, waste soil, cinders and rubble, a high level of seed persistence has been observed in many studies since these habitats are spatially highly unpredictable [63]. The same is presumably true in the case of bait sites, where the quality and the quantity of seed influxes and the level and frequency of physical soil disturbances are also unforeseeable. It is also important to note that if the frequency of disturbance in woodlands is increased by human harvesting, then seed banks can come to be very important in regeneration. At the same time, the importance of the persistent seed bank will increase in that habitat as well [64]. Thus, soil seed banks may become important in mature woodlands, especially if the amount of disturbance increases (for example due to maintaining bait sites or logging activities). It has been shown that seed persistence is greater in annuals than in related perennials [63]. This could be the other reason for the high percentage of persistent seeds at bait sites, since most of the weeds invading the above-ground vegetation are annuals [43].
In general, grasslands are not conspicuously associated with either low- or high-seed persistence, largely because these plant communities are compatible with a wide range of disturbance regimes such as grazing, drought and fire, which cause relatively minor disturbances. Therefore, many grasslands contain species with a wide spectrum of seed longevity [29], as has been shown at the control clearing sites. The low seed persistence in the control forest is also apparent, and this has been shown many times in semi-natural forests as they prove to be stable habitats [46]. In conclusion, the seed bank theory, according to which the proportion of persistent species increases with disturbance [65], is proven to be true.

4.5. Soil Characteristics

Regarding soil properties, the bait sites located in the clearings proved to be more nutrient rich than the forest bait sites. The forest sites proved to be exceedingly similar to the control sites, which well illustrates their special characteristics as sites. As is also the case with above-ground vegetation, habitat differences may have played a very important role in terms of soil properties and could be the reason the vegetation and the seed bank were similarly degraded at the two types of bait sites. Meanwhile, the degree of deterioration of the soil proved to be significantly different. Soils in the Pannonian dry oak forests are very acidic and nutrient poor [66], while most of the mesophilous grasslands are more nutrient rich [67]. Thus, low pH values were detected at the forest bait sites and also at the forest controls. Baiting did not significantly change the acidity of the soils, as also observed at feeding stations in Finland [68]. The higher pH values at the clearing sites may be due to the higher above-ground weed abundance. In accordance with other studies, which showed that, due to better nutrient and growth conditions, the weed mass is greater in alcalic soils [69]. Considering soil nutrients, the results presented here for the bait sites in the clearings agree with those of many studies examining the effects of invasions. It has been repeatedly demonstrated that soil fertility is generally greater at invaded sites than at uninvaded sites, as has the positive relationship between the amount of nutrients and the degree of invasion [70]. Rooting by wild boar may also be responsible for increasing the amount of N in the soil, since this mechanical activity alters N-transformation processes [71]. From the personal observations of the authors, the amount of litter is typically higher at the bait sites located in the clearings than at the forest sites. The remaining forage, and sometimes also the bales of hay and straw placed at bait sites, can also be responsible for the high nutritional values of their soil. Besides the habitat differences, the human factor may also be important. Hunters prefer to use the bait sites located in clearings, because the natural habitat preference of wild game is also concentrated in this habitat type, and the hunting opportunities (site accessibility, visibility) are also better here. Due to these habitat differences between the two bait site types, a significant difference can be detected between the bait sites and the controls only in terms of salinity. This can be explained by the fact that, unfortunately, salt blocks for animals are often placed at these sites. This type of wild game nutrition means separate objects (salt licks) are mainly located near supplementary feeding stations. In practice, however, they are often placed at bait sites, even though this is forbidden.

5. Conclusions and Management Implications

In summary, bait sites can cause significant changes to forest and grassland habitats, not only in terms of the vegetation but also in terms of the soil seed bank and soil parameters. As our previous study shows, above-ground weed infestation does not spread over long distances, but it can cause severe degradation, especially in open habitats [6]. In this study, the fact that unfavorable changes in soil characteristics are also greatest in the case of highly degraded clearing sites is demonstrated. However, the degree of soil seed bank degradation may be equal to or even surpass that observed as a result of infection at the forest sites compared with the clearing sites. Therefore, there is a high risk of expanded invasion at all bait sites. The presence of invading weeds in the seed bank may facilitate invasion by other species and, according to the ‘invasional meltdown hypothesis’ [15], the result may be secondary invasions, as demonstrated in many studies [72]. Dairel and Fidelis (2020) [14] also suggest that the presence of invading species comprising more than 30% of the seed bank gives a great potential for invasion. In this study, much higher values, up to almost 100%, have been recorded, and this despite only the topsoil layer being sampled. At some bait sites, however, weed seed banks may even be larger because of the high amount of accumulated litter. It is well documented that litter can act as a seed trap and can have positive effects on the preservation of soil seed banks [73].
It is also reasonable to assume that anthropogenic effects may be of considerable significance and play a very important role in the changes of above- and below-ground communities. For example, the amount of foreign seed influxes depends entirely on humans, as do the number of seeds dispersed via transportation on vehicles and on clothes. This may be the reason some forest bait sites with less degraded vegetation but heavily infected soil seed banks have been found. In addition, the amount of nutrients depends not only on the amount of forage placed by humans but also on the quantity of animal consumption, how much feed remains and the quantity of feces left. What is more, weed seeds can remain viable in soil for periods up to decades [74], so the examination of the forage placed at bait sites over the course of a year would not necessarily yield adequate results, because the question of whether the weed seeds found in the soil originate from actual baiting or have been there for many years remains unanswered.
These results represent an important outcome for protected area management, as more exacting regulation of the quantity and quality of forage is essential. Currently, feeding is implemented individually by members of hunting societies, which means that a very wide range of forage is used and its quality is often not adequate. Thus, the revision of relevant laws concerning supplementary feeding would be important. The creation of bait sites in forests and not in clearing sites and protected areas may still be a key factor in preventing habitat degradation. Considering that the quality of the surrounding habitat has also been a substantial factor, the regulation of intensive forestry interventions and the restriction of other human activities are also very important. Additional field research is also urgent if the relationship between the vegetation, soil seed bank and soil characteristics of bait sites is to be thoroughly understood. Experimental studies need to be conducted that consider factors such as the time elapsed since the bait site was established, the amount and the quality of forage and its distribution over time, which animals visit the baits and how often, as well as a consideration of the effects of climate change. Such studies would be better able to reveal interlinkages and would help to evaluate the complex effects of baiting in natural habitats.

Novelty and Innovation

Most studies on wild game feeding focus on animal populations and only a few deal with its effects on vegetation [1,2,3]. In this study, the effects of bait sites were investigated. It is an under-researched area because most studies examine the effects of supplementary winter feeding and not baiting. Furthermore, considering that the quantity, quality and the temporal distribution of the forage placed at natural habitats are very different, the effects are also variable. Additionally, not only the herbaceous layer but also the soil seed bank and the main soil parameters were investigated at these sites. Results show that baiting has many direct and indirect effects on the natural environment, a fact that poses new challenges to protected area managers. Above- and below-ground vegetation and also the main soil characteristics can be significantly degraded at these sites, the prevention and control of which require intersectoral collaboration among wildlife, forestry and protected area management.

Author Contributions

Conceptualization, methodology, data collection, writing: K.R.; data validation, methodology, software analysis, visualization: B.W.; software analysis, visualization: D.S.; writing—review and editing, visualization: V.G. and J.S.; supervision: S.C. All authors have read and agreed to the published version of the manuscript.

Funding

This research received no external funding.

Institutional Review Board Statement

Not applicable.

Informed Consent Statement

Not applicable.

Data Availability Statement

The data that support the findings of this study are available on request from the corresponding author.

Acknowledgments

We are grateful to Paul Thatcher for English proofreading. The research was supported by the Doctoral School of Environmental Sciences of Hungarian University of Agriculture and Life Sciences.

Conflicts of Interest

The authors declare no conflict of interest.

References

  1. Arnold, J.M.; Gerhardt, P.; Steyaert, S.M.J.G.; Hochbichler, E.; Hacklander, K. Diversionary feeding can reduce red deer habitat selection pressure on vulnerable forest stands, but is not a panacea for red deer damage. For. Ecol. Manag. 2018, 407, 166–173. [Google Scholar] [CrossRef]
  2. Rinella, M.J.; Dean, R.; Vavra, M.; Parks, C.G. Vegetation responses to supplemental winter feeding of elk in western Wyoming. W. N. Am. Nat. 2012, 72, 78–83. [Google Scholar] [CrossRef] [Green Version]
  3. Selva, N.; Berezowska-Cnota, T.; Elguero-Claramunt, I. Unforeseen Effects of Supplementary Feeding: Ungulate Baiting Sites as Hotspots for Ground-Nest Predation. PLoS ONE 2014, 9, e90740. [Google Scholar] [CrossRef]
  4. Heltai, M.; Sonkoly, K. The role and opportunities of feeding in game management (Review). Anim. Welf. Ethol. Hous. Syst. 2009, 5, 1–22. [Google Scholar]
  5. Gervilla, C.; Rita, J.; Cursach, J. Contaminant seeds in imported crop seed lots: A non-negligible human-mediated pathway for introduction of plant species to islands. Weed Res. 2019, 59, 245–253. [Google Scholar] [CrossRef]
  6. Rusvai, K.; Saláta, D.; Falvai, D.; Czóbel, S. Assesment of weed invasion at bait sites in a Central European lower montane zone. Perspect. Plant Ecol. Evol. Syst. 2022, 55, 125667. [Google Scholar] [CrossRef]
  7. Gioria, M.; Pyšek, P. The legacy of plant invasions: Changes in the soil seed bank of invaded plant communities. Bioscience 2015, 66, 40–53. [Google Scholar] [CrossRef] [Green Version]
  8. Galloway, A.D.; Holmes, P.M.; Gaertner, M.; Esler, K.J. The impact of pine plantations on fynbos above-ground vegetation and soil seed bank composition. S. Afr. J. Bot. 2017, 113, 300–307. [Google Scholar] [CrossRef]
  9. Gioria, M.; Osborne, B.A. Assessing the impact of plant invasions on soil seed bank communities: Use of univariate and multivariate statistical approaches. J. Veg. Sci. 2009, 20, 547–556. [Google Scholar] [CrossRef]
  10. Gooden, B.; French, K. Impacts of alien grass invasion in coastal seed banks vary amongst native growth forms and dispersal strategies. Biol. Conserv. 2014, 171, 114–126. [Google Scholar] [CrossRef] [Green Version]
  11. Gioria, M.; Osborne, B.A. Resource competition in plant invasions: Emerging patterns and research needs. Front. Plant Sci. 2014, 5, 501. [Google Scholar] [CrossRef] [PubMed]
  12. Venable, D.L.; Brown, J.S. The selective interactions of dispersal, dormancy, and seed size as adaptations for reducing risk in variable environments. Am. Nat. 1988, 131, 360–384. [Google Scholar] [CrossRef]
  13. Baskin, C.C.; Baskin, J.M. Seeds: Ecology, Biogeography, and Evolution of Dormancy and Germination; Academic Press: San Diego, CA, USA, 1998. [Google Scholar]
  14. Dairel, M.; Fidelis, A. The presence of invasive grasses affects the soil seed bank composition and dynamics of both invaded and non-invaded areas of open savannas. J. Environ. Manag. 2020, 276, 111291. [Google Scholar] [CrossRef]
  15. Simberloff, D.; von Holle, B. Positive interactions of nonindigenous species: Invasional meltdown? Biol. Invasions 1999, 1, 21–32. [Google Scholar] [CrossRef]
  16. Cadenasso, M.L.; Pickett, S.T.A. Effect of edge structure on the flux of species into forest interiors. Conserv. Biol. 2001, 15, 91–97. [Google Scholar] [CrossRef]
  17. Turner, P.J.; Scott, J.K.; Spafford, H. The ecological barriers to the recovery of bridal creeper ((Asparagus asparagoides L.) Druce) infested sites: Impacts on vegetation and the potential increase in other exotic species. Austral. Ecol. 2008, 33, 713–722. [Google Scholar] [CrossRef]
  18. Zhang, C.; Willis, C.G.; Ma, Z.; Ma, M.; Csontos, P.; Baskin, C.C.; Baskin, J.; Li, J.; Zhou, H.; Zhao, X.; et al. Direct and indirect effects of long-term fertilization on the stability of the persistent seed bank. Plant Soil 2019, 438, 239–250. [Google Scholar] [CrossRef]
  19. Lehoczky, E.; Reisinger, P.; Kőmíves, T. Loss of nutrients caused by excessive weediness at the early stage of maize vegetation period. Commun. Plant Soil Anal. 2005, 36, 415–422. [Google Scholar] [CrossRef]
  20. Bölöni, J.; Molnár, Z.; Biró, M.; Horváth, F. Distribution of the (semi-) natural habitats in Hungary II. Woodlands and shrublands. Acta Bot. Hung. 2008, 50, 107–148. [Google Scholar] [CrossRef]
  21. Katona, K.; Szemethy, L.; Csányi, S. Forest management practices and forest sensitivity to game damage in Hungary. Hung. Agric. Res. 2011, 1, 12–16. [Google Scholar]
  22. Manninger, M.; Edelényi, M.; Pödör, Z.; Jereb, L. The effect of temperature and precipitation on growth of beech (Fagus sylvatica L.) in Mátra Mountains, Hungary. In Applied Forestry Research in the 21st Century; Book of Abstracts; Forestry and Game Management Research Institute: Jíloviště, Czech Republic, 2011; p. 22. [Google Scholar]
  23. Juhász, O.; Fürjes-Mikó, Á.; Tenyér, A.; Somogyi, A.Á.; Aguilon, D.J.; Kiss, P.J.; Bátori, Z.; Maák, I. Consequences of Climate Change-Induced Habitat Conversions on Red Wood Ants in a Central European Mountain: A Case Study. Animals 2020, 10, 1677. [Google Scholar] [CrossRef] [PubMed]
  24. Bereczki, K.; Ódor, P.; Csóka, G.; Mag, Z.; Báldi, A. Effects of forest heterogeneity on the efficiency of caterpillar control service provided by birds in temperate oak forests. For Ecol. Manag. 2014, 327, 96–105. [Google Scholar] [CrossRef]
  25. Dövényi, Z. (Ed.) Mátra-Vidék. In Magyarország Kistájainak Katasztere; MTA Földrajztudományi Kutatóintézet: Budapest, Hungary, 2010; pp. 713–736. [Google Scholar]
  26. Standovár, T. Comparative Study of Vegetation and Soil Pattern in a Mountain Meadow (Mátra, Hungary) II. Soil Pattern and Its Overlap with Vegetation Pattern. Abstr. Bot. 1986, 10, 291–315. Available online: http://www.jstor.org/stable/43519136 (accessed on 8 October 2022).
  27. Milner, J.M.; Bonenfant, C.; Mysterud, A.; Gaillard, J.M.; Csányi, S.; Stenseth, N. Temporal and spatial development of red deer harvesting in Europe: Biological and cultural factors. J. Appl. Ecol. 2006, 43, 721–734. [Google Scholar] [CrossRef]
  28. Csányi, S.; Lehoczki, R. Ungulates and their management in Hungary. In European Ungulates and Their Management in the 21st Century; Apollonio, M., Andersen, R., Putman, R., Eds.; Cambridge University Press: Cambridge, UK, 2010; pp. 291–318. [Google Scholar]
  29. Durbecq, A.; Jaunatre, R.; Buisson, E.; Cluchier, A.; Bischoff, A. Identifying reference communities in ecological restoration: The use of environmental conditions driving vegetation composition. Restor. Ecol. 2020, 28, 1445–1453. [Google Scholar] [CrossRef]
  30. Hobbs, R.J.; Harris, J.A. Restoration ecology: Repairing the earth’s ecosystems in the new millennium. Restor. Ecol. 2001, 9, 239–246. [Google Scholar] [CrossRef] [Green Version]
  31. Matus, G.; Papp, M.; Tóthmérész, B. Impact of management on vegetation dynamics and seed bank formation of inland dune grassland in Hungary. Flora 2005, 200, 296–306. [Google Scholar] [CrossRef]
  32. Jacquemyn, H.; van Mechelen, C.; Brys, R.; Honnay, O. Management effects on the vegetation and soil seed bank of calcareous grasslands: An 11-year experiment. Biol. Conserv. 2011, 144, 416–422. [Google Scholar] [CrossRef]
  33. Török, P.; Kelemen, A.; Valkó, O.; Miglécz, T.; Tóth, K.; Tóth, E.; Sonkoly, J.; Kiss, R.; Csecserits, A.; Rédei, T.; et al. Succession in soil seed banks and its implications for restoration of calcareous sand grasslands. Restor. Ecol. 2017, 26, 134–140. [Google Scholar] [CrossRef]
  34. Buzás, I. Talaj-és agrokémiai vizsgálati módszerkönyv 2. A talajok fizikai-kémiai és kémiai vizsgálati módszerei. Agrokem. Talajtan 1989, 38, 504–505. (In Hungarian) [Google Scholar]
  35. Egner, J.; Riehm, H.; Domingo, W. Untersuchungen über die che-mische Bodenanalyse als Grundlage für die Beurteilung des Nährst-offzustandes der Böden II. Chemische Extraktionsmethoden zur Phosphor- und Kaliumbestimmung. K. Lantbr. Ann. 1960, 26, 199–215. (In German) [Google Scholar]
  36. MSZ-08-0210-1977; Methods for the Determination of the Organic Carbon Content of the Soil. Department of Agriculture and Tourism: Budapest, Hungary, 2021.
  37. Borhidi, A. Social behaviour types, the naturalness and relative ecological indicator values of the higher plants in the Hungarian Flora. Acta Bot. Hung. 1995, 39, 97–181. [Google Scholar]
  38. Ellenberg, H.; Weber, H.E.; Düll, R.; Wirth, V.; Werner, W.; Paulißen, D. Zeigerwerte von Pflanzen in Mitteleuropa. Scr. Geobot. 1991, 18, 1–248. [Google Scholar] [CrossRef]
  39. Grime, J.P. Plant Strategies and Vegetation Processes; John Wiley: Chichester, NY, USA, 1979. [Google Scholar]
  40. Thompson, K.; Bakker, J.P.; Bekker, R.M. The Soil Seed Banks of North West Europe: Methodology, Density and Longevity; Cambridge University Press: Cambridge, UK, 1997. [Google Scholar]
  41. Rejmánek, M.; Richardson, D.M.; Pyšek, P. Plant Invasions and Invasibility of Plant Communities. In Vegetation Ecology, 2nd ed.; John Wiley & Sons, Ltd.: Hoboken, NJ, USA, 2013; pp. 387–424. [Google Scholar] [CrossRef]
  42. Martin, P.H.; Canham, C.D.; Marks, P.L. Why forests appear resistant to exotic plant invasions: Intentional introductions, stand dynamics, and the role of shade tolerance. Front. Ecol. Environ. 2009, 7, 142–149. [Google Scholar] [CrossRef]
  43. Bourgeois, B.; Munoz, F.; Fried, G.; Mahaut, L.; Armengot, L.; Denelle, P.; Storkey, J.; Gaba, S.; Violle, C. What makes a weed a weed? A large-scale evaluation of arable weeds through a functional lens. Am. J. Bot. 2019, 106, 90–100. [Google Scholar] [CrossRef]
  44. Tóth, K.; Lukács, B.A.; Radócz, S.; Simon, E.A. Magbank szerepe a szikes gyepek diverzitásának fenntartásában a Hortobágyi Nemzeti Park területén. Bot. Közlemények 2015, 102, 141–157. (In Hungarian) [Google Scholar] [CrossRef]
  45. Kiss, R.; Valkó, O.; Tóthmérész, B.; Török, P. Seed bank research in Central-European grasslands—An overview. In Seed Banks: Types, Roles and Research; Chapter 1; Murphy, J., Ed.; Nova Science: Hauppauge, NY, USA, 2016; pp. 1–34. [Google Scholar]
  46. Fenner, M.; Thompson, K. The Ecology of Seeds, 2nd ed; Cambridge University Press: Cambridge, UK, 2005. [Google Scholar]
  47. Heinken, T.; Schmidt, M.; von Oheimb, G.; Kriebitzsch, W.-U.; Ellenberg, H. Soil seed banks near rubbing trees indicate dispersal of plant species into forests by wild boar. Basic Appl. Ecol. 2006, 7, 31–44. [Google Scholar] [CrossRef] [Green Version]
  48. Xiong, S.; Johansson, M.; Hughes, F.; Hayes, A.; Richards, K.; Nilsson, C. Interactive effects of soil moisture, vegetation canopy, plant litter and seed addition on plant diversity in a wetland community. J. Ecol. 2003, 91, 976–986. [Google Scholar] [CrossRef]
  49. Bossuyt, B.; Honnay, O. Can the seed bank be used for ecological restoration? An overview of seed bank characteristics in European communities. J. Veg. Sci. 2008, 19, 875–884. [Google Scholar] [CrossRef]
  50. Miaojun, M.; Xianhui, Z.; Guozhen, D. Role of soil seed bank along a disturbance gradient in an alpine meadow on the Tibet plateau. Flora 2010, 205, 128–134. [Google Scholar] [CrossRef]
  51. Pickett, S.T.A.; McDonell, M.J. Seed bank dynamics intemperate deciduous forest. In Ecology of Soil Seed Banks; Leck, M.A., Parker, V.T., Simpson, R.L., Eds.; Academic Press: London, UK, 1989; pp. 123–147. [Google Scholar]
  52. Csontos, P. A természetes magbank, valamint a hazai flóramagökológiai vizsgálatának új eredményei. Some new results improving the knowledge of the natural soil seed banks of the Hungarian flora. Kanitzia 2010, 17, 77–110. (In Hungarian) [Google Scholar]
  53. Valkó, O.; Török, P.; Tóthmérész, B.; Matus, G. Restoration potential in seed banks of acidic fen and dry-mesophilous meadows: Can restoration be based on local seed banks? Restor. Ecol. 2011, 19, 9–15. [Google Scholar] [CrossRef]
  54. Lacko-Bartosova, M.; Minar, M.; Vranovska, Z.; Strasser, D. Weed seed bank in ecological and integrated farming system. Rostl. Vyrob. 2000, 46, 319–324. [Google Scholar]
  55. Magyar, I.E. Gyógynövényes fűmagkeverék gyomosodási vizsgálata a telepedési idő és a talaj magbank hatására. Magy. Gyomkutatás Technol. 2005, 6, 37–51. (In Hungarian) [Google Scholar]
  56. Simić, M.; Spasojević, I.; Brankov, M.; Dragicevic, V. Weeds Seed Bank Richness in Maize Field: Effects of Crop Rotation and Herbicides. In Proceedings of the 5th International Scientific Agricultural Symposium Agrosym 2014, Jahorina, Bosnia and Herzegovina, 25–28 September 2014; pp. 501–507. Available online: https://www.cabdirect.org/cabdirect/abstract/20153437535 (accessed on 8 October 2022).
  57. Koncz, G.; Papp, M.; Török, P.; Kotroczó, Z.; Krakomperger, Z.; Matus, G.; Tóthmérész, B. The role of seed bank in the dynamics of understorey in an oak forest in Hungary. Acta Biol. Hung. 2010, 61, 109–119. [Google Scholar] [CrossRef] [Green Version]
  58. Bossuyt, B.; Hermy, M. Influence of land use history on seed banks in European temperate forest ecosystems: A review. Ecography 2001, 24, 225–238. [Google Scholar] [CrossRef]
  59. Halassy, M. Possible role of the seed bank in the restoration of open sand grasslands in old fields. Commun. Ecol. 2001, 2, 101–108. [Google Scholar] [CrossRef]
  60. Tóth, K.; Hüse, B. Soil seed banks in loess grasslands and their role in grassland recovery. Appl. Ecol. Environ. Res. 2014, 12, 537–547. [Google Scholar] [CrossRef]
  61. Handlová, V.; Münzbergová, Z. Seed banks of managed and degraded grasslands in the Krkonoše Mts., Czech Republic. Folia Geobot. 2006, 41, 275–288. [Google Scholar] [CrossRef] [Green Version]
  62. Kemény, G.; Nagy, Z.; Tuba, Z. Seed bank dynamics in a semiarid sandy grassland in Hungary. Ekol. Bratisl. 2005, 24, 1–13. [Google Scholar]
  63. Thompson, K.; Hodkinson, D.J. Seed mass, habitat and life history: A re-analysis of Salisbury. New Phytol. 1998, 138, 163–166. [Google Scholar] [CrossRef]
  64. Tierney, G.L.; Fahey, T.J. Soil seed bank dynamics of pin cherry in a northern hardwood forest, New Hampshire, USA. Can. J. For. Res. 1998, 28, 1471–1480. [Google Scholar] [CrossRef]
  65. Thompson, K. The functional ecology of seed banks. In Seed Ecology; Fenner, M., Ed.; Chapman & Hall: London, UK, 1985; pp. 231–258. [Google Scholar]
  66. Ádám, R.; Ódor, P.; Bidló, A.; Somay, L.; Bölöni, J. The effect of light, soil pH and stand heterogeneity on understory species composition of dry oak forests in the North Hungarian Mountains. Community Ecol. 2018, 19, 259–271. [Google Scholar] [CrossRef]
  67. Lengyel, A.; Purger, D.; Csiky, J. Classification of mesic grasslands and their transitions of South Transdanubia (Hungary). Acta Bot. Croat. 2012, 71, 31–50. [Google Scholar] [CrossRef]
  68. Turunen, M.; Oksanen, P.; Vuojala-Magga, T.; Markkula, I.; Sutinen, M.-L.; Hyvönen, J. Impacts of winter feeding of reindeer on vegetation and soil in the sub-Arctic: Insights from a feeding experiment. Polar Res. 2013, 32, 18610. [Google Scholar] [CrossRef]
  69. Skuodiené, R.; Repšiené, R.; Karcauskiene, D.; Siaudinis, G. Assessment of the weed incidence and weed seed bank of crops under different pedological traits. Appl. Ecol. Environ. Res. 2018, 16, 1131–1142. [Google Scholar] [CrossRef]
  70. Weidenhamer, J.D.; Callaway, R.M. Direct and Indirect Effects of Invasive Plants on Soil Chemistry and Ecosystem Function. J. Chem. Ecol. 2010, 36, 59–69. [Google Scholar] [CrossRef]
  71. Barrios-Garcia, M.N.; Ballari, S.A. Impact of wild boar (Sus scrofa) in its introduced and native range: A review. Biol. Invasions 2012, 14, 2283–2300. [Google Scholar] [CrossRef]
  72. Jeschke, J.M.; Aparicio, L.G.; Haider, S.; Heger, T.; Lortie, C.J.; Pyšek, P.; Strayer, D.L. Support for major hypotheses in invasion biology is uneven and declining. NeoBiota 2012, 14, 1–20. [Google Scholar] [CrossRef]
  73. Ruprecht, E.; Szabó, A. Grass litter is a natural seed trap in long-term undisturbed grassland. J. Veg. Sci. 2012, 23, 495–504. [Google Scholar] [CrossRef]
  74. Lewis, J. Longevity of crop and weed seeds: Survival after 20 years in soil. Weed Res. 1973, 13, 179–191. [Google Scholar] [CrossRef]
Figure 1. Map of the study area showing the sampling points.
Sustainability 14 13134 g001
Figure 2. DCA analysis of the vegetation according to the cumulative cover of the SBT categories. F1, F2, F3—forest bait sites; C1, C2, C3—bait sites in a clearing; CF—control forest site; CC—control clearing site; S—stress tolerant specialists; C—competitors of natural habitats; G—stress tolerant generalists; NP—natural pioneers; DT—disturbance tolerant plants; W—native weed species; I—introduced crops running wild; A—adventitious weeds; RC—ruderal competitors of the natural flora; AC—alien competitors/aggressive invaders.
Sustainability 14 13134 g002
Figure 3. Seed abundance and the proportion of degradation indicator species in the seed banks of bait sites and their control sites. F1, F2, F3—forest bait sites; C1, C2, C3—bait sites in a clearing; CF—control forest site; CC—control clearing site.
Sustainability 14 13134 g003
Figure 4. DCA according to the species number of different SBT categories in the seed bank. F1, F2, F3—forest bait sites; C1, C2, C3—bait sites in a clearing; CF—control forest site; CC—control clearing site; S—stress tolerant specialists; C—competitors of natural habitats; G—stress tolerant generalists; NP—natural pioneers; DT—disturbance tolerant plants; W—native weed species; I—introduced crops running wild; A—adventitious weeds; RC—ruderal competitors of the natural flora; AC—alien competitors/aggressive invaders.
Sustainability 14 13134 g004
Figure 5. The distribution of the different persistence categories according to their seed density. F1, F2, F3—forest bait sites; C1, C2, C3—bait sites in a clearing; CF—control forest site; CC—control clearing site; LP—long-term persistent; SP—short-term persistent; T—transient.
Sustainability 14 13134 g005
Figure 6. Main soil nutrient contents of the examined sites. (a) Phosphate; (b) potassium; (c) nitrate; (d) humus%. F1, F2, F3—forest bait sites; C1, C2, C3—bait sites in a clearing; CF—control forest site; CC—control clearing site.
Sustainability 14 13134 g006
Table 1. GPS coordinates of the sampling points.
Sampling PointTypeGPS Coordinates
F1forest bait site47°50′32.8″ N 20°03′54.7″ E
F2forest bait site47°51′57.6″ N 20°06′03.5″ E
F3forest bait site47°51′20.9″ N 20°04′49.4″ E
C1bait site in clearing47°51′24.7″ N 20°02′50.8″ E
C2bait site in clearing47°51′00.3″ N 20°02′52.6″ E
C3bait site in clearing47°50′55.0″ N 20°04′58.9″ E
CFcontrol forest site47°51′14.4″ N 20°04′49.8″ E
CCcontrol clearing site47°51′16.3″ N 20°04′50.3″ E
Table 2. Vegetation survey data of the examined sites. F1, F2, F3—forest bait sites; C1, C2, C3—bait sites in a clearing; CF—control forest; CC—control clearing; forest vs. clearing—t-test between forest and clearing bait sites; baits vs. control—t-test between bait sites and the two control sites; * p < 0.05; ** p < 0.01; *** p < 0.001; ns.—not significant.
F1F2F3C1C2C3CFCCForest vs. ClearingBaits vs. Controls
Vegetation cover (%)52595503036.5100.0*ns.
Total cover (%)15361845443140.6271.0ns.*
Cover of natural species902281114138.1269.1ns.***
Cover of weeds63415643292.52ns.ns.
Weed%40.0100.066.784.879.667.41.80.7ns.**
Total sp. no. (pc.)11333413143244ns.*
Number of natural species60112263142ns.***
Number of weeds5322211812ns.ns.
Weed%45.5100.066.764.784.657.13.14.5ns.**
Table 3. Soil characteristics of examined sites. Forest vs. clearing—t-test between forest and clearing bait sites; * p < 0.05; ** p < 0.01; ns.— not significant.
F1F2F3C1C2C3CFCCForest vs. ClearingBaits vs. Controls
Bare soil surface (%)8593805504059.350,00*ns.
Stones (%)1051500304.150.00ns.ns.
Soil pH (H2O)5.35.75.36.56.06.85.65.7*ns.
Soil pH (KCl)4.54.84.55.55.25.84.74.9*ns.
Salinity (%)0.090.070.070.080.070.090.050.06ns.*
SOC (%)4.94.94.68.910.17.76.09.1**ns.
Soil humidity47.149.049.044.942.350.339.448.1ns.ns.
Phosphate (µg/g)14.717.815.9980.5457.0517.91.97.6*ns.
Potassium (µg/mL)183.0196.7220.12763.21888.12976.00.0702.7**ns.
NO3-N (mg kg−1)0.70.50.86.610.213.10.61.4**ns.
NH4-N (mg kg−1)16.418.619.316.518.918.716.218.6ns.ns.
Publisher’s Note: MDPI stays neutral with regard to jurisdictional claims in published maps and institutional affiliations.

