Article

Learning-by-Doing Methodology towards Urban Decarbonisation: An Application in Valletta (Malta)

by
Matteo Maccanti
1,2,
Romina D’Ascanio
3,*,
Federica Di Pietrantonio
3,
Michela Marchi
1,*,
Jesús Vargas Molina
4,
Riccardo Maria Pulselli
5,
Andrea Poldrugovac
6,
Diane Schembri Cassar
7,
Lorenzo Barbieri
3,
Josefina López Galdeano
4,
Valentina Niccolucci
1,
Carmela Gioia
1,
Francesca Paola Mondelli
3,
Jesmond Xuereb
7,
Anna Laura Palazzo
3 and
Simone Bastianoni
1
1
Ecodynamics Group, Department of Physical, Earth and Environmental Sciences, University of Siena, 53100 Siena, Italy
2
Etika Consulting Srl, 55018 Capannori, Italy
3
Department of Architecture, Roma Tre University, 00153 Rome, Italy
4
Global Change Research Laboratory, Department of Geography, History and Phylosophy, Pablo de Olavide University, 41013 Seville, Spain
5
Heritage Architecture Urbanism Department of Mediterranean University of Reggio Calabria, 89124 Reggio Calabria, Italy
6
Istrian Regional Energy Agency, 52220 Labin, Croatia
7
Malta Intelligent Energy Management Agency, VLT 1310 Valletta, Malta
*
Authors to whom correspondence should be addressed.
Sustainability 2023, 15(7), 5807; https://doi.org/10.3390/su15075807
Submission received: 31 January 2023 / Revised: 11 March 2023 / Accepted: 21 March 2023 / Published: 27 March 2023

Abstract

:
Since approximately 75% of Europeans currently live in cities, and this number will rise, urban areas are the most important testbeds for energy transition, climate change adaptation measures, and decarbonisation models, on which studies and efforts for concrete change must focus. The teaching of mitigation and adaptation measures to climate change and decarbonisation models has gradually taken up space within university courses. However, the complexity of the decarbonisation issue is raising awareness on the urgency of an interdisciplinary approach that can be conveyed by spatial planning. Currently, this approach is not widespread in Higher Education Institutions in Europe but is nonetheless necessary to let new professional profiles emerge who are able to coordinate different stakeholders, data, and information sources. The Erasmus+ project CITY MINDED (2020–2022) has worked in this direction, by developing and testing a methodology for the design of a structured ordinary practice for teaching urban decarbonisation to students in Higher Education. This practice (at the same time, interdisciplinary, collaborative, experiential, and place-based) aims to offer students a combination of different approaches and working methods to investigate and improve urban neighbourhoods and districts, resulting in the definition of an operative roadmap for decarbonisation in the medium-to-long-term. The aim of this article is to highlight the learning-by-doing experience developed by the project consortium, with reference to the testing of the methodology conducted within an Intensive Course in the City of Valletta (Malta). In particular, the paper illustrates how this experience succeeded in stimulating students with different academic backgrounds to establish connections across disciplines, in raising their awareness about the complexity of city decarbonisation processes. Overcoming the strict time and budget constraints of an EU-funded project, such an approach can be further developed, replicated on theoretical grounds, and implemented within different degree programmes dealing with urban sustainability.

1. Introduction

The growing attention paid to climate change is leading nations and international organisations to pursue common goals to limit the inevitable climatic variations that the planet will experience in the near future and to move to a post-carbon economic and social model. The European Union, following its commitment to global climate action, has set the goal of becoming climate neutral by 2050, for example, by achieving net greenhouse gas emissions (GHG) equal to zero, improving sustainable energy supply, and integrating green infrastructure and nature-based solutions in urban planning and policies [1,2]. To achieve this ambitious goal, acknowledged as the cornerstone of the “European Green Deal”, the intermediate target of reducing GHG emissions by 55% by 2030, compared to 1990 levels, was also set [3]. On 15 November 2022, the world population reached 8 billion people, a milestone in human development [4,5] and, according to United Nations estimates, should grow to 8.5 billion in 2030 and add 1.18 billion people in the following two decades, reaching 9.7 billion in 2050 [6]. Currently, 56% of the world population lives in urban areas and this is projected to grow to 68% by 2050 [7]. Despite cities covering just 3% of the global surface, they consume 78% of the world’s energy and emit more than 60% of GHG emissions [8]. In Europe, the urbanisation rate was 75% in 2020 and it is expected to increase to approximately 84% in 2050 [7,9]. Furthermore, the building stock is responsible for approximately 40% of EU energy consumption and 36% of the total GHG emissions [10]. Urbanisation represents a major contributor to climate change and biodiversity loss [11,12,13], two interrelated processes that profoundly affect the functioning and stability of ecosystems and, consequently, the overall quality of human life [14,15]. Therefore, the sustainability of cities is currently a fundamental challenge, and subsequently the long-term strategy of the European Commission has identified cities as strategic points, ideal laboratories, and testbeds for the study and application of energy transition and decarbonisation models [16,17]. In fact, according to the European Biodiversity Strategy, decarbonising the energy system is fundamental for climate neutrality and for recovery from the COVID-19 crisis, especially to set long-term strategies [2]. According to Agenda 2030, there is a growing need to create liveable places that contribute to healthy towns that are able to support adapted and resilient communities [18,19]. A new approach to design and planning cities and landscape, including that of multifunctional green spaces and the implementation of green infrastructure, has the potential to become the main driver for pursuing the goal of climate-neutral urban systems, improving inhabitants’ quality of life and also urban resilience [20,21,22]. The implementation of suitable environmental policies and projects for reducing energy and materials consumption, as well as GHG emissions, in neighbourhoods are crucial to increasing environmental performances in built environments [23]. The strategies planned in specific management plans represent the response of local actors (e.g., public administrations, citizens, businesses, and associations) to environmental and societal challenges [24]. To achieve neutrality, the design and regeneration of urban spaces calls for the need to implement nature-based solutions, the use of renewable resources, and sustainable consumption systems for both energy production and mobility [25,26].
This framework requires a systemic interdisciplinary and multi-scalar approach that is currently not widespread in Higher Education but looks necessary to allow new professional profiles to emerge who are able to coordinate different sources of information, stakeholders, and practitioners (e.g., urban designers, environmental specialists, energy managers, etc.).
There have been several attempts to address the challenge of translating interdisciplinarity into ordinary teaching practices. For instance, in the US, a renewed interest in collaborative studio teaching resulted in adaptations of such experiences according to the lens of interdisciplinarity, for example, at the universities of Stanford [27] and Washington D.C. [28].
To pursue this goal, the CITY MINDED project (City Monitoring and Integrated Design for Decarbonisation, started in 2020 and concluded in 2022), funded by the EU Erasmus+ Programme, was conceived to create a methodology, applicable to Higher Education Institutions (HEIs), that would allow the identification, analysis, and interpretation of weaknesses and potentialities of an urban context towards decarbonisation. The main objective of this paper is to describe the CITY MINDED methodology, designed to create a learning-by-doing environment and refined along four workshops, in reference to the experience obtained during the international Intensive Course that represented the last learning and teaching activity of the project. The methodology intends to help fulfil the needs of Higher Education in issues related to the built environment and urban sustainability, which often lack an interdisciplinary approach, field experiences, and contacts with real urban contexts beyond classroom activities. Due to these shortcomings, when confronted by their first job experiences, new graduates and post-docs can face difficulties in correctly interpreting the context and in interacting with the stakeholders (e.g., industries, decision makers, knowledge partners, and citizens) who have a role in the achievement of urban decarbonisation objectives and can thus influence the success of their work. It is known, in fact, that long-term sustainability, though strongly relying on technology and specialist know-how, cannot overlook contextual sensitivity and transparent and cooperative processes. The interdisciplinary approach of this project was mirrored in the diversity of its partnership, which included three universities with different specialisations and two energy agencies: Istrian Regional Energy Agency (IRENA), Croatia, as the lead partner; the Ecodynamics Group at the Department of Physical, Earth and Environmental Sciences of the University of Siena, Italy (UNISI); the Department of Architecture of the Roma Tre University, Italy (UNIROMA3); the Global Change Research Lab at the Department of Geography, History and Philosophy of the Pablo de Olavide University, Spain (UPO); and the Malta Intelligent Energy Management Agency, Malta (MIEMA).

2. Materials and Methods

2.1. The CITY MINDED Methodology

The CITY MINDED methodology aims to combine different skills and competencies regarding the decarbonisation of the urban contexts, outlining an innovative teaching and learning-by-doing experience meant for graduate students and doctoral students from the partners’ universities. The focus is on the design of urban sustainability agendas, the process that leads to their definition, and the learning environment in which this process takes place. The methodology is centred on interdisciplinary workshops composed of four teaching modules, with each one focusing on a different aspect of (and approach to) urban decarbonisation. The modules, in turn, are structured around dedicated training sessions, consisting of brief lectures aimed at transferring knowledge to students, and co-working sessions, where students, divided into small groups, can immediately apply the knowledge acquired to a study area and quickly design a decarbonisation strategy for it (Figure 1). The teaching modules are sided with study visits and complemented with the contribution of local stakeholders, who are invited to share with the students their first-hand knowledge of the study areas. The results obtained by each group of students during each co-working session are collectively discussed, so as to enrich the learning experience. The structure of the workshops proposed in CITY MINDED derives from the improvement and capitalisation of the holistic and interdisciplinary approach that the partners have put into practice during other EU Erasmus+ projects (e.g., EH-Cmap, ENEPLAN, and E-RESPLAN) and of the results obtained by the FP7 City-Zen Project [29,30].
Specifically, the methodology developed in the CITY MINDED project focused primarily on the examination and potential transformation of target districts, neighbourhoods, and regional systems to address site-specific challenges and provide roadmaps for the decarbonisation of urban areas. The methodology described herein was tested in different urban districts of four European cities, namely, the so-called “City Decarbonisation Workshops” in Siena (Italy) involving twenty graduate students from UNISI, Rome (Italy) involving twentyfive graduate and doctoral students from UNIROMA3, and Seville (Spain) involving ten graduate and doctoral students from UPO, and the Intensive Course in Valletta (Malta) involving seven graduate and doctoral students from the three universities. The paper shows the application of the methodology to the City of Valletta and to the Southern and Northern Harbour Districts in Malta as a way to validate its feasibility and usefulness.
The modules making up the methodology have been chosen to conduct analyses from the territorial framework to the neighbourhood and building scale. Each partner, according to their specific expertise, developed both a training module and a co-working session as follows:
  • Placemaking Framework by UNIROMA3 (see Section 2.1.1);
  • Vulnerability Assessment by UPO (see Section 2.1.2);
  • Carbon Accounting and Carbon Footprint mitigation measures by UNISI (see Section 2.1.3);
  • Energy efficiency and renewable energy technologies by IRENA and MIEMA (see Section 2.1.4).
Finally, a comprehensive presentation, composed of the results of all the co-working sessions, was drafted to define a city decarbonisation roadmap.

2.1.1. Placemaking Framework

Placemaking refers to an integrated approach to planning and management of public spaces that exploits local knowledge and needs in order to improve the well-being and quality of life of communities [31]. Placemaking is a participative and collaborative process based on the enhancement of specific features of a place and the fulfilment of people’s needs for the improvement of the public space and liveability.
The Placemaking Framework Module intends to provide students with basic capabilities of cityscape interpretation, considering their different backgrounds and the variety of the neighbourhoods selected as case studies. Such an approach to the planning, design, and management of public spaces benefits from local community assets, inspiration, and potential, under two main assumptions: (i) effective and socially sustainable planning should be place-specific; (ii) irrespective of the scale involved, the main focus should be on public space, deemed as the most authentic dimension of community relationships. Accordingly, Placemaking entails dynamic surveys of all kinds of outdoor spaces liable to incorporate new uses, thus renewing the vitality of the city [31,32,33].
The Placemaking methodology has been addressed to define strategies for the improvement of the urban environment, and adaptation measures to climate change and decarbonisation to put in place. Furthermore, through surveys, drawings, sketches, and analysis of the stakeholders involved, it is possible to define the tangible and intangible networks of the case study.
Any transformation should be underpinned by the ability to read the city features and morphologies (urban fabric, open spaces, cityscape) and to understand their relationships with the experience, memory, and needs of the inhabitants.
The qualitative methodology of urban analysis applied in this module, mainly rooted in the discipline of urban planning and design, is divided into different phases: (i) experience, (ii) analysis, and (iii) strategies.
The first fundamental step (training session) is the acquisition of a basic knowledge of the study area. For this reason, the first phase should include training lessons, aimed at providing the basic tools for reading and analysing the context, and a field trip during which students can annotate, sketch, and pin down the significant elements of the area. The presentations by UNIROMA3 encompassed three main topics: town planning and mobility, ecological networks, and green infrastructure [34,35,36,37,38], urban design, and landscape [39,40,41].
Phases two and three constitute the co-working session of the module encompassing both graphic exercises and critical thinking exercises.
In the second phase, the mobility system, built-up environment, green urban areas, and network of public spaces and services are taken into account in order to identify on a satellite map three main features: barriers (natural and artificial), connections (ecological and mobility), and key elements (main natural spaces, derelict areas, and public spaces). Simultaneously, a qualitative analysis of the strengths and weaknesses of the case study is implemented. The purpose of the analysis is to define the development of regional and urban intervention, which derive from an enhancement of the strengths and a containment of the weaknesses in the light of the framework of opportunities and threats that usually derive from the external situation. The strengths and weaknesses analysis is designed to facilitate a realistic, fact-based, data-driven look at the strengths and weaknesses.
Finally, the third phase has the goal of defining a strategy to design solutions for the urban decarbonisation to be implemented for the improvement of mobility, green areas, public space, and services. On the one hand, the main physical intervention is sketched and designed on a satellite map. On the other hand, the intended objectives and activities should be listed, as follows:
  • Objective—Concise statement describing specific, critical, actionable, and measurable tasks to achieve in order to effectively execute the strategy and achieve the project vision. Objectives often begin with action verbs such as increasing, reducing, improving, achieving, etc. (e.g., improving soft mobility).
  • Activity—Detailed and operative tasks and actions to be carried out to achieve each objective. Activities often begin with operative action verbs such as implementing, designing, planning, defining, etc. (e.g., implementing bicycle paths along the main roads).

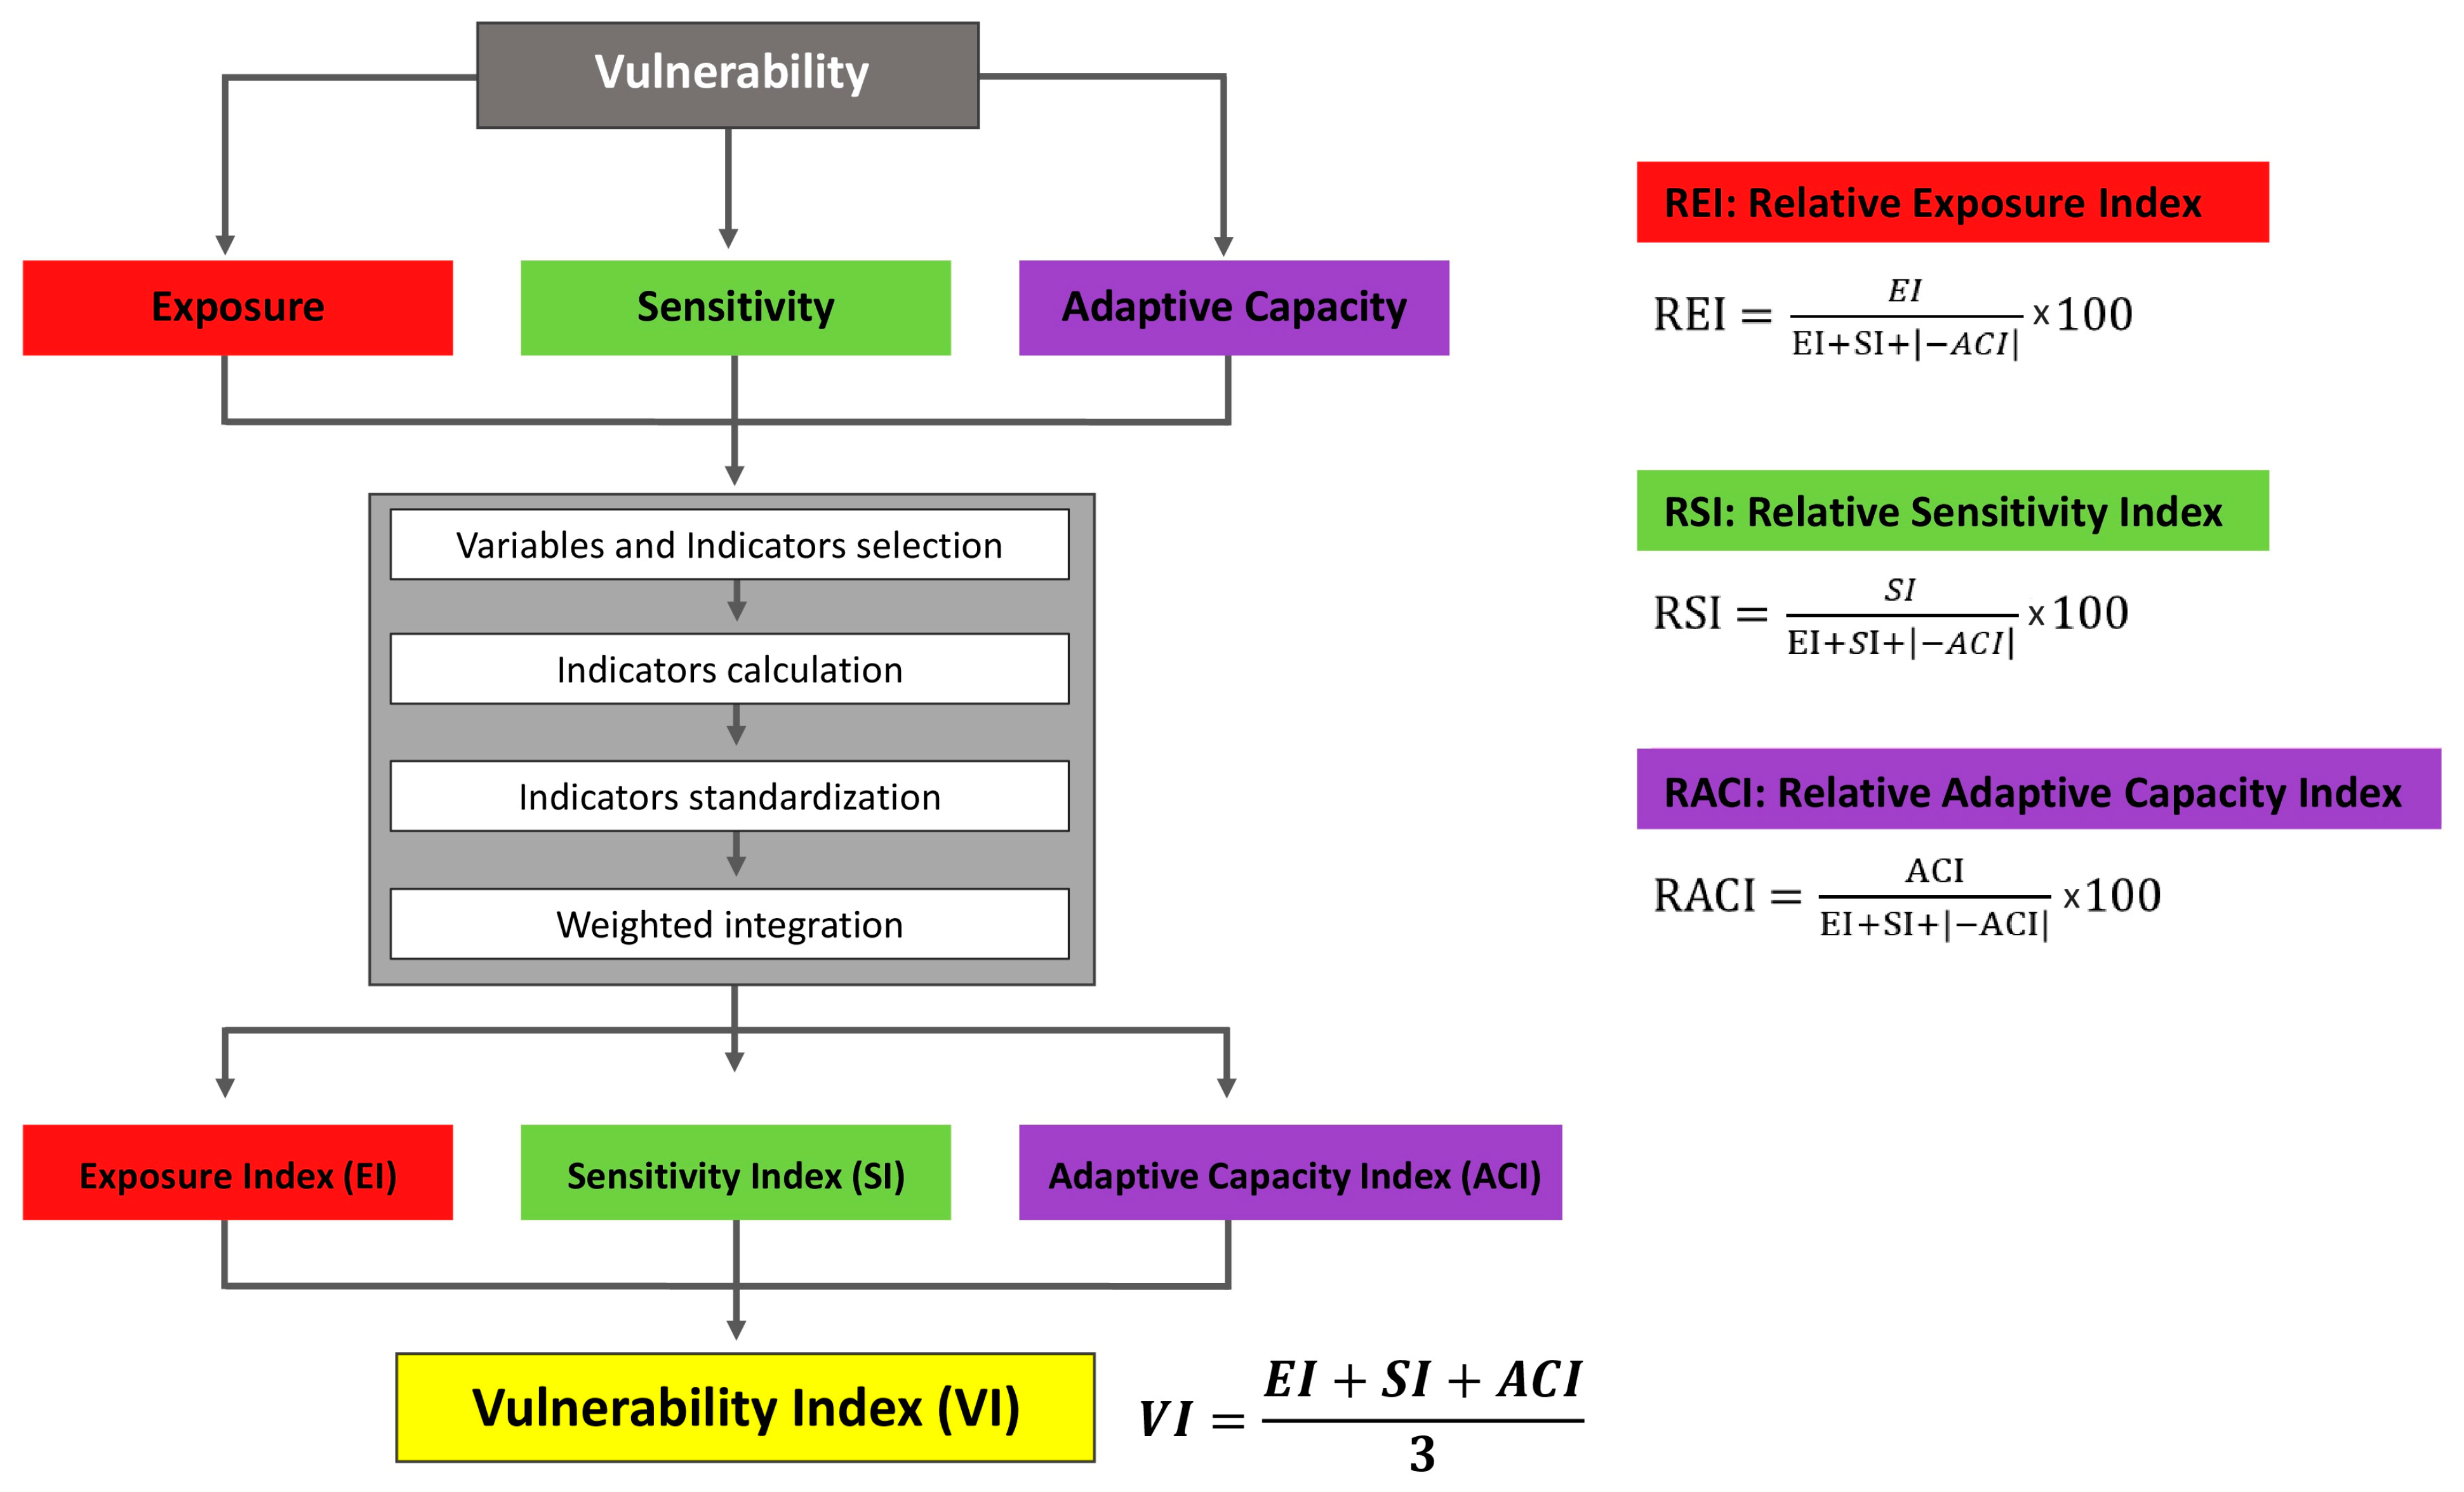
2.1.2. The Vulnerability Assessment

This module introduces students to risk assessment through the analysis of vulnerability. Vulnerability assessment has become one of the main tools for preventing and mitigating natural hazards’ effects on society, the economy, and the environment. The proposed method is based on the framework adopted by the Intergovernmental Panel on Climate Change (IPCC) that defines vulnerability based on three main components: Exposure, Sensitivity, and Adaptive Capacity; hence the Risk Equation (i.e., Vulnerability = Exposure + Sensitivity − Adaptive Capacity) [42,43]. It was applied and tested throughout different research projects with several applications in the river basin scale (droughts and floods) and in urban areas (heatwaves) [44,45,46,47]. A specific methodology to calculate a vulnerability compound index in two steps is used: (1) vulnerability assessment; (2) analysis of the causes that generate the vulnerability. Figure 2 shows the methodological proposal to assess vulnerability and the three indexes (REI, RSI, and RACI) that students will calculate within the working session.
The Vulnerability Structure Triangle [48] is then applied to analyse the causes of vulnerability and compare results. This equilateral triangle map denotes the summary of REI, RSI, and RACI indexes; each side of the triangle represents the perimeter of the rate of each index, with a range between 0 and 100 and the intersection of the three lines indicating the value of the Vulnerability Index [48]. Due to the multidimensional nature of the vulnerability, data of different types (social, physical, environmental, institutional, and economic) and sources (official database, surveys, interviews, official reports, etc.) are used. The first step of the data elaboration is to select the variables and indicators to characterise each of the vulnerability components and calculate the value of the indicators. The set of variables and indicators are previously selected based on two criteria: (1) availability of data; (2) to be diverse enough to capture the multidimensional nature of vulnerability (social, natural, economic, institutional, and technological) and allowing students to train different tools and research techniques and data. To facilitate the process of calculating the indicators and the final assessment of vulnerability, two different materials are provided:
  • A step-by-step document providing the variables and indicators selected, the justification for their use, their relationship with vulnerability, the sources from which to obtain the data, and the necessary formulation for the calculation and standardisation of the results obtained.
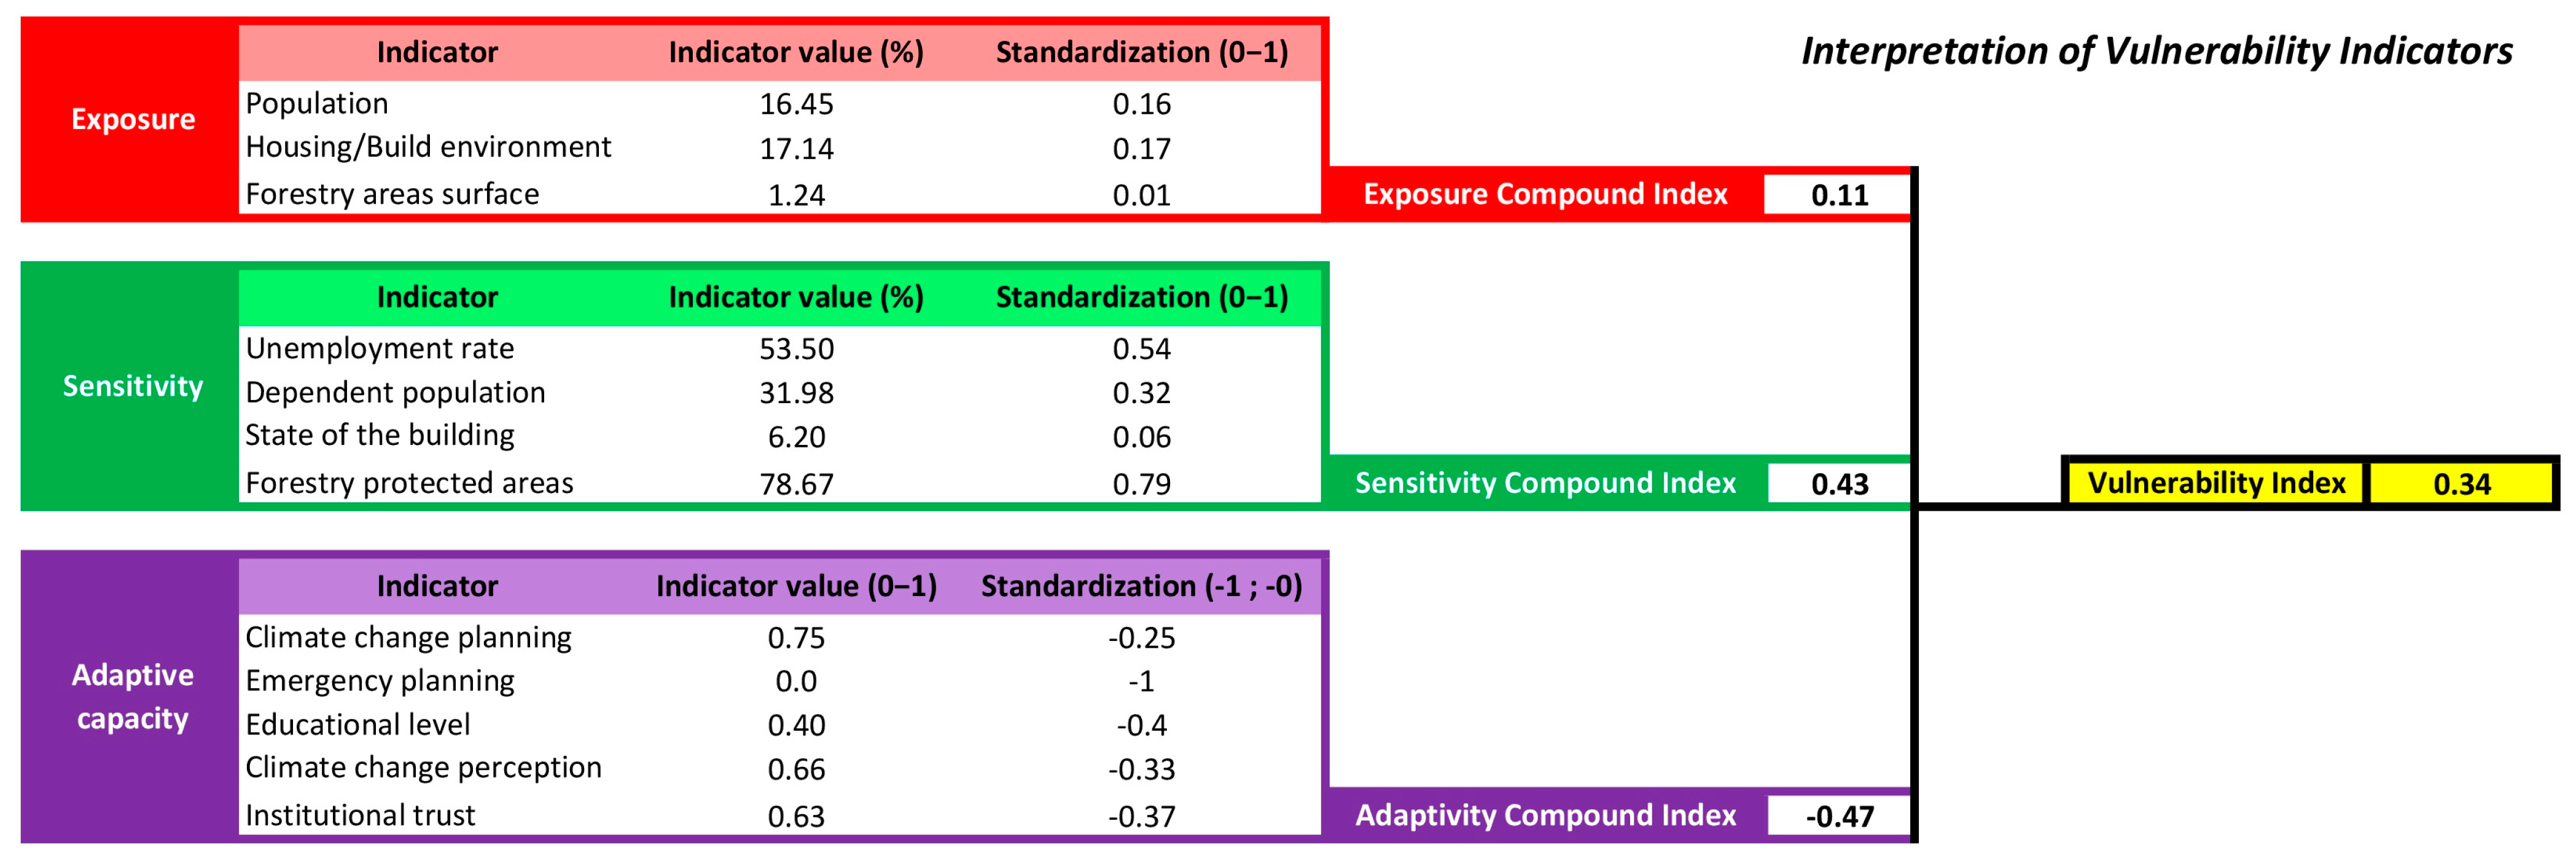
  • A results Excel sheet where students can enter the indicator results obtained, with the composite indicators of exposure, sensitivity, adaptive capacity, and the final Vulnerability Index automatically calculated. Afterwards, the indicators are normalised on a scale from 0 to 1.
A weighting of the drivers is then applied to integrate them into the different indices of Exposure, Sensitivity, and Adaptive Capacity which contribute the same weight to the composite index, i.e., the Vulnerability Index (VI), which quantifies the vulnerability level (from very low to very high) of each case study.

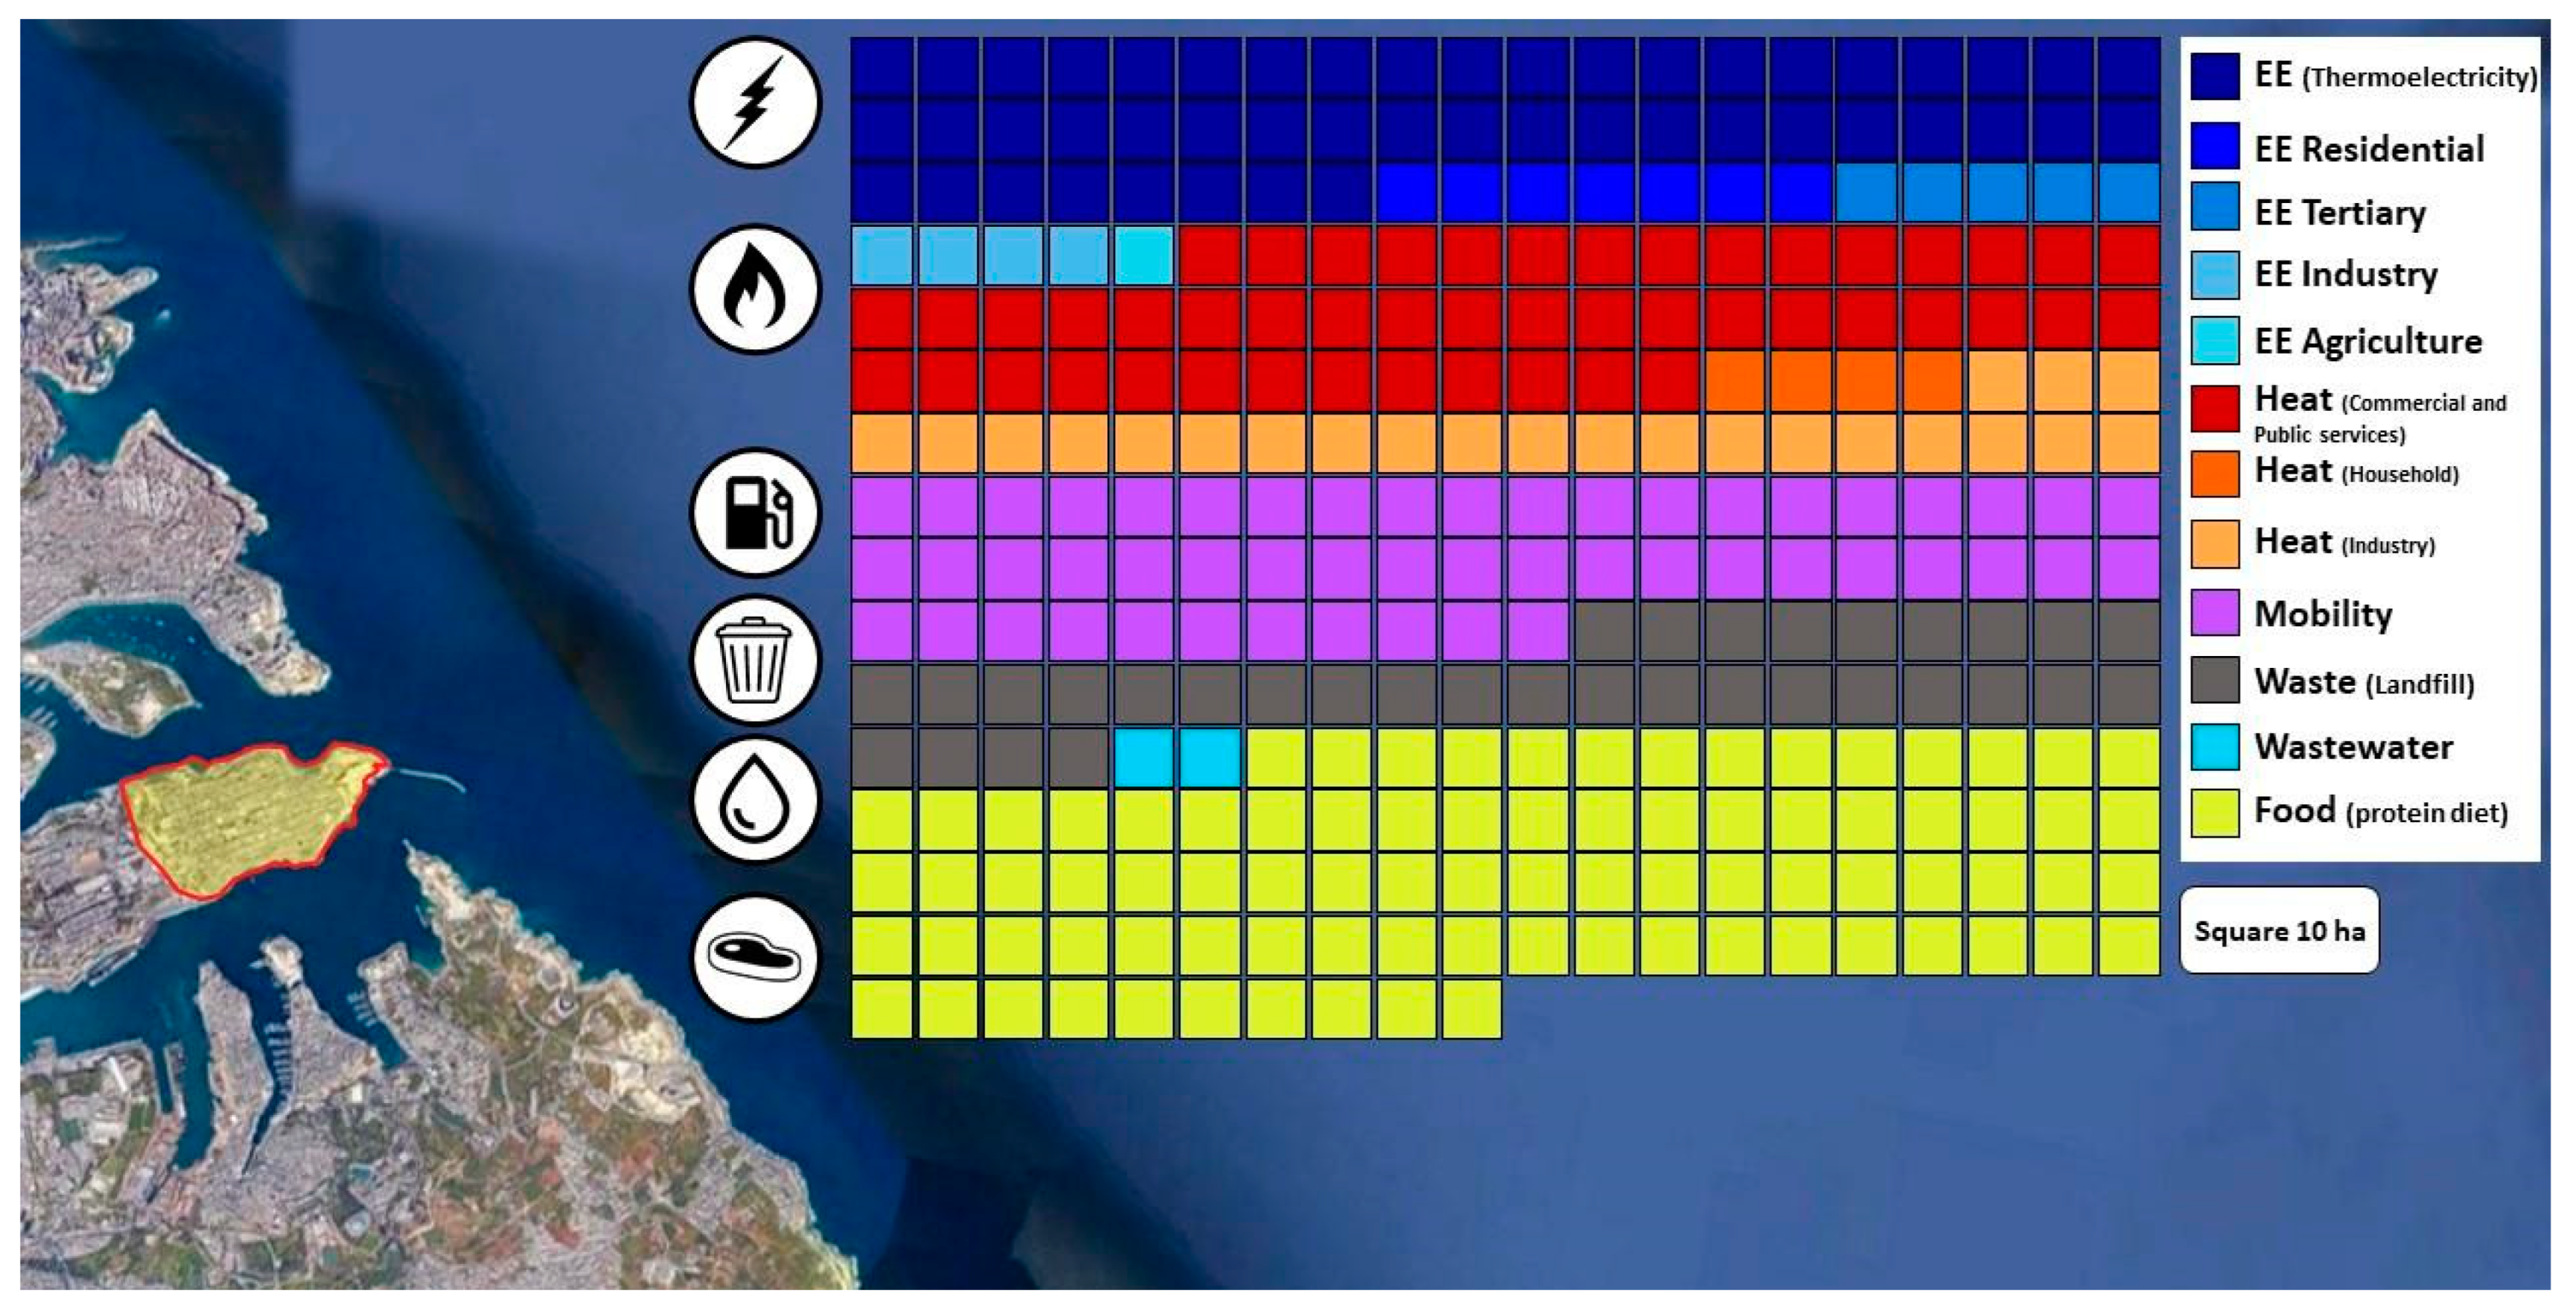
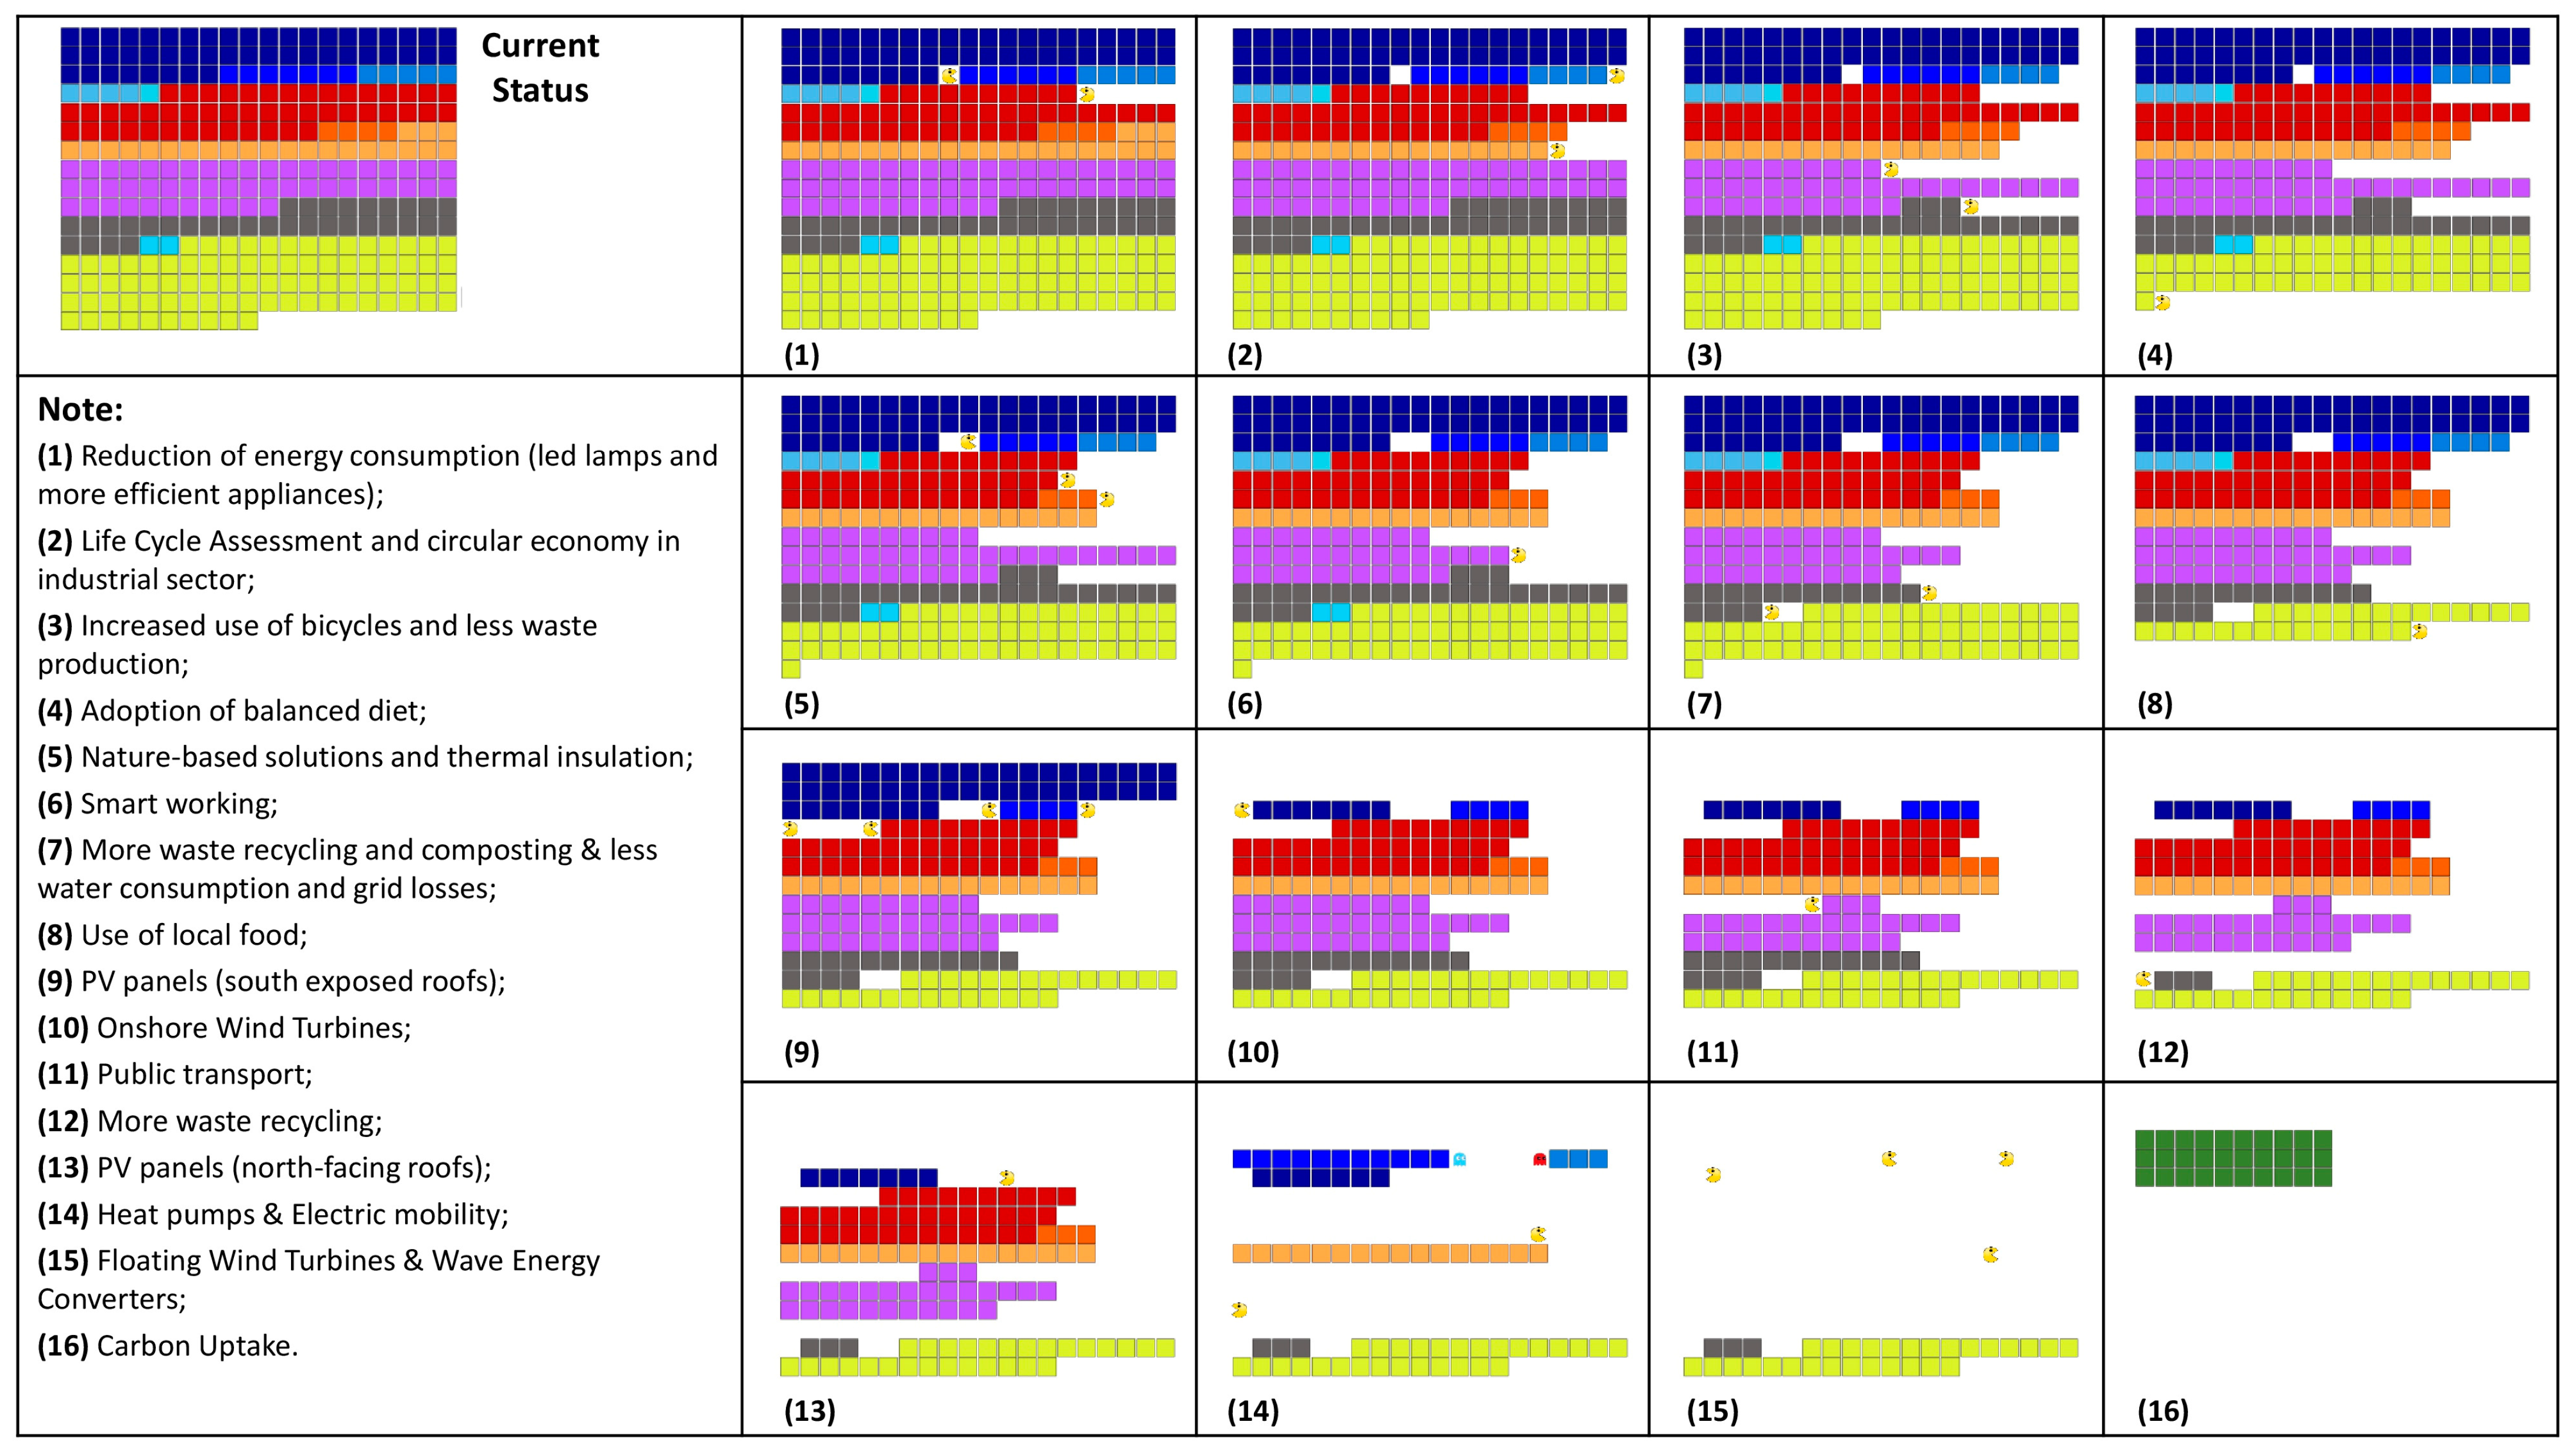
2.1.3. The Carbon Accounting Methodology

The goal of this module is to quickly assess the Carbon Footprint (CF) of an urban neighbourhood, quantifying the current direct GHG emissions and removals of the study area, and designing the effects of action plans addressed to carbon neutrality in terms of CF mitigation.
This method is inspired by the IPCC standard methodology for the GHG emissions inventory of Nations [49,50,51] and based on the research work carried out to adapt it to subnational areas, such as provinces, cities, and smaller urban areas, including neighbourhoods [29,30,52,53,54,55,56,57,58,59]. Several specific emission sectors (i.e., Energy, Industrial Processes, Waste, and Agriculture, Forestry, and Other Land Use—AFOLU) and emission sources (i.e., energy use, mobility, waste, wastewater management, and eating habits) are considered to quantify the overall GHG balance of the analysed urban district.
This accounting method starts with the data collection of the emission sources considered, usually obtained from local administrations and operators, following a bottom-up approach. However, much information comes from national databases and official reports, which contain data that must be split to the urban level applying specific downscaling parameters as expected in a top-down approach.
Regarding the eating habits, different types of diet are considered: (1) a diet with medium-high consumption of animal protein (assumed to be the current food habit); (2) a balanced diet and a balanced one with the purchase of local food (considered both as environmentally friendly aptitudes to be implemented).
The main greenhouse gases released into the atmosphere, considered in the analyses, are carbon dioxide (CO2), methane (CH4), and nitrous oxide (N2O), converted into carbon dioxide equivalents (CO2eq) applying the respective last values of 100-year Global Warming Potential (GWP) [51].
The GHG emissions were calculated by applying the following basic equations:
C F i = A D i × E F i
C F T O T = i = 1 n C F i
where:
CFi = carbon dioxide equivalent (CO2eq) emissions in one year (kg CO2eq);
ADi = activity data (e.g., tons of gasoline consumed for transport);
EFi = emission factor per unit of activity (e.g., kg CO2eq/t gasoline for transport).
To better understand the climate change pressure, the Carbon Footprint of the urban system is represented and visualised in terms of Equivalent Virtual Forestland (EVF) surface, i.e., the area covered by a relatively young forest that would be needed to absorb an equivalent amount of carbon emissions generated within the assessed administrative boundaries. The EVF surface was estimated considering a removal rate of 1.3 kg CO2 (m2)−1 [60].
In the end, a dynamic representation of the decarbonisation plan for city neighbourhoods by "crunching” the EVF was carried out [60]. A sequence of mitigation actions and policies are applied to show how they could progressively reduce the Carbon Footprint of the urban area potentially bringing the system to climate-neutral conditions. To achieve this, the famous vintage “Pac-Man” game is used as a gimmick [60], in order to easily visualise the CO2 emissions reduction based on a learning-by-doing approach and a tool named CF Pac-Man game. A small yellow and hungry creature (i.e., Sustainability 15 05807 i001), called Pac-Man, appears, and it will eat an equivalent portion of virtual forest corresponding to the amount of CO2eq emissions saved, thanks to the measure applied to the neighbourhood. Similarly, but in the opposite direction, when a policy provides for an increase in GHG emissions, a small ghost (i.e., Sustainability 15 05807 i002), representing the bitter enemy of Pac-Man, appears, and the virtual forest surface increases according to the new amount of emissions.
An example of this scenario is the conversion of the car flat from fossil fuels to electric power. It generates both a reduction in emissions due to the decreased fossil fuels consumption for mobility, and simultaneously an increase of GHG emissions due to a greater demand of electricity imported from the national greed, resulting in a raise of the EVF surface.
The visual approach developed (CF Pac-Man game and maps) is a useful communication tool for a wide audience such as citizens, policymakers, companies, and other local stakeholders.
In fact, the carbon accounting mitigation measures can be implemented at different scales.
The combination of new devices and technologies, as well as other measures related to citizens’ behaviour and initiatives organised by local staff and administrations, provides the opportunity to evaluate the effects of different solutions and mitigation plans and can be easily visualised through the CF Pac-Man game.
The various interventions, activated in the mitigation plan, can occur in the short-term (approximately 10 years), in the medium-term (approximately 20 years), and in the long-term (30 years or more), depending on the complexity of their implementation, to reach a Climate Neutral status in the medium-to-long period.

2.1.4. Energy Efficiency and Renewable Energy Technologies

The exercise proposed in the module consists of proposing different levels of analysis at the scale of the building or building block and deals with the improvement of the energy performance of the building stock through the design of energy-saving solutions and the implementation of Renewable Energy Sources (RES). This module ensures a systematic and comprehensive approach to expand the student’s knowledge and motivate them to analyse the study area in the terms of the existing building stock and its characteristics, focusing on the energy needs and its improvement by proposing relevant energy efficiency (EE) measures and the implementation of RES.
In the training session, the students are first instructed on how an energy strategy at an urban scale is structured, based on four main pillars: (a) maximising energy efficiency through energy renovation; (b) integrating RES systems within existing buildings; (c) maximising energy self-consumption through energy storage to reduce energy losses; (d) implementing smart load management to decrease costs and reduce stress on the grid. To analyse the energy characteristics and needs of the building, the European nearly-zero energy building standards are introduced [61]. The method then starts with the analysis and presentation of the building before the measures in the module are explained and proposed possible solutions to reduce the energy consumption needed for heating, cooling, lightening, ventilation, and hot water are also presented. Some practical and design solutions are then presented: different types of RES for the urban environment (micro-wind, heat, power systems, photovoltaic panels, etc.) and technical and management solutions such as energy self-consumption and local energy communities, and micro-grids and battery storage systems. The theoretical explanation is supported by the illustration of real case studies implemented all around Europe. The next part focuses on the identification of different building typologies within the urban area and understanding specific barriers and challenges to energy renovation and the integration of RES systems. This is followed by the presentation of a strategy for defining solutions and mitigation measures to address the challenges and barriers. The final part is dedicated to the presentation of best practices and innovative projects from different European countries concerning the integration of RES systems within buildings. The aim is to provide students with an up-to-date overview of the latest solutions for improving the energy performance of buildings in urban contexts, which, if up-scaled to a neighbourhood or an entire city, can help achieve urban decarbonisation objectives.
The co-working session of this module is organised into four different tasks. The first task was to analyse the energy needs of a target building or building complex, based on its age and use, on construction materials, and on the characteristics of existing systems, including the hours of use, and to identify the measures already implemented for energy efficiency and renewable energy in/on the building. This task includes the identification of the most relevant energy consumers within the building, to point out the priority systems to focus on in the rest of the exercise. The second task was to propose additional measures solutions (in terms of energy refurbishment, RES installation, energy management, and behavioural changes of building users) to maximise energy performance and eventually quantify environmental benefits (i.e., CO2 emissions reduction from RES installation). The third task was to identify any barriers and challenges for the implementation of the proposed measures, and the related solutions or mitigation options. The fourth and last task was to propose an implementation timeline for the identified measures (short-, medium-, and long-term).

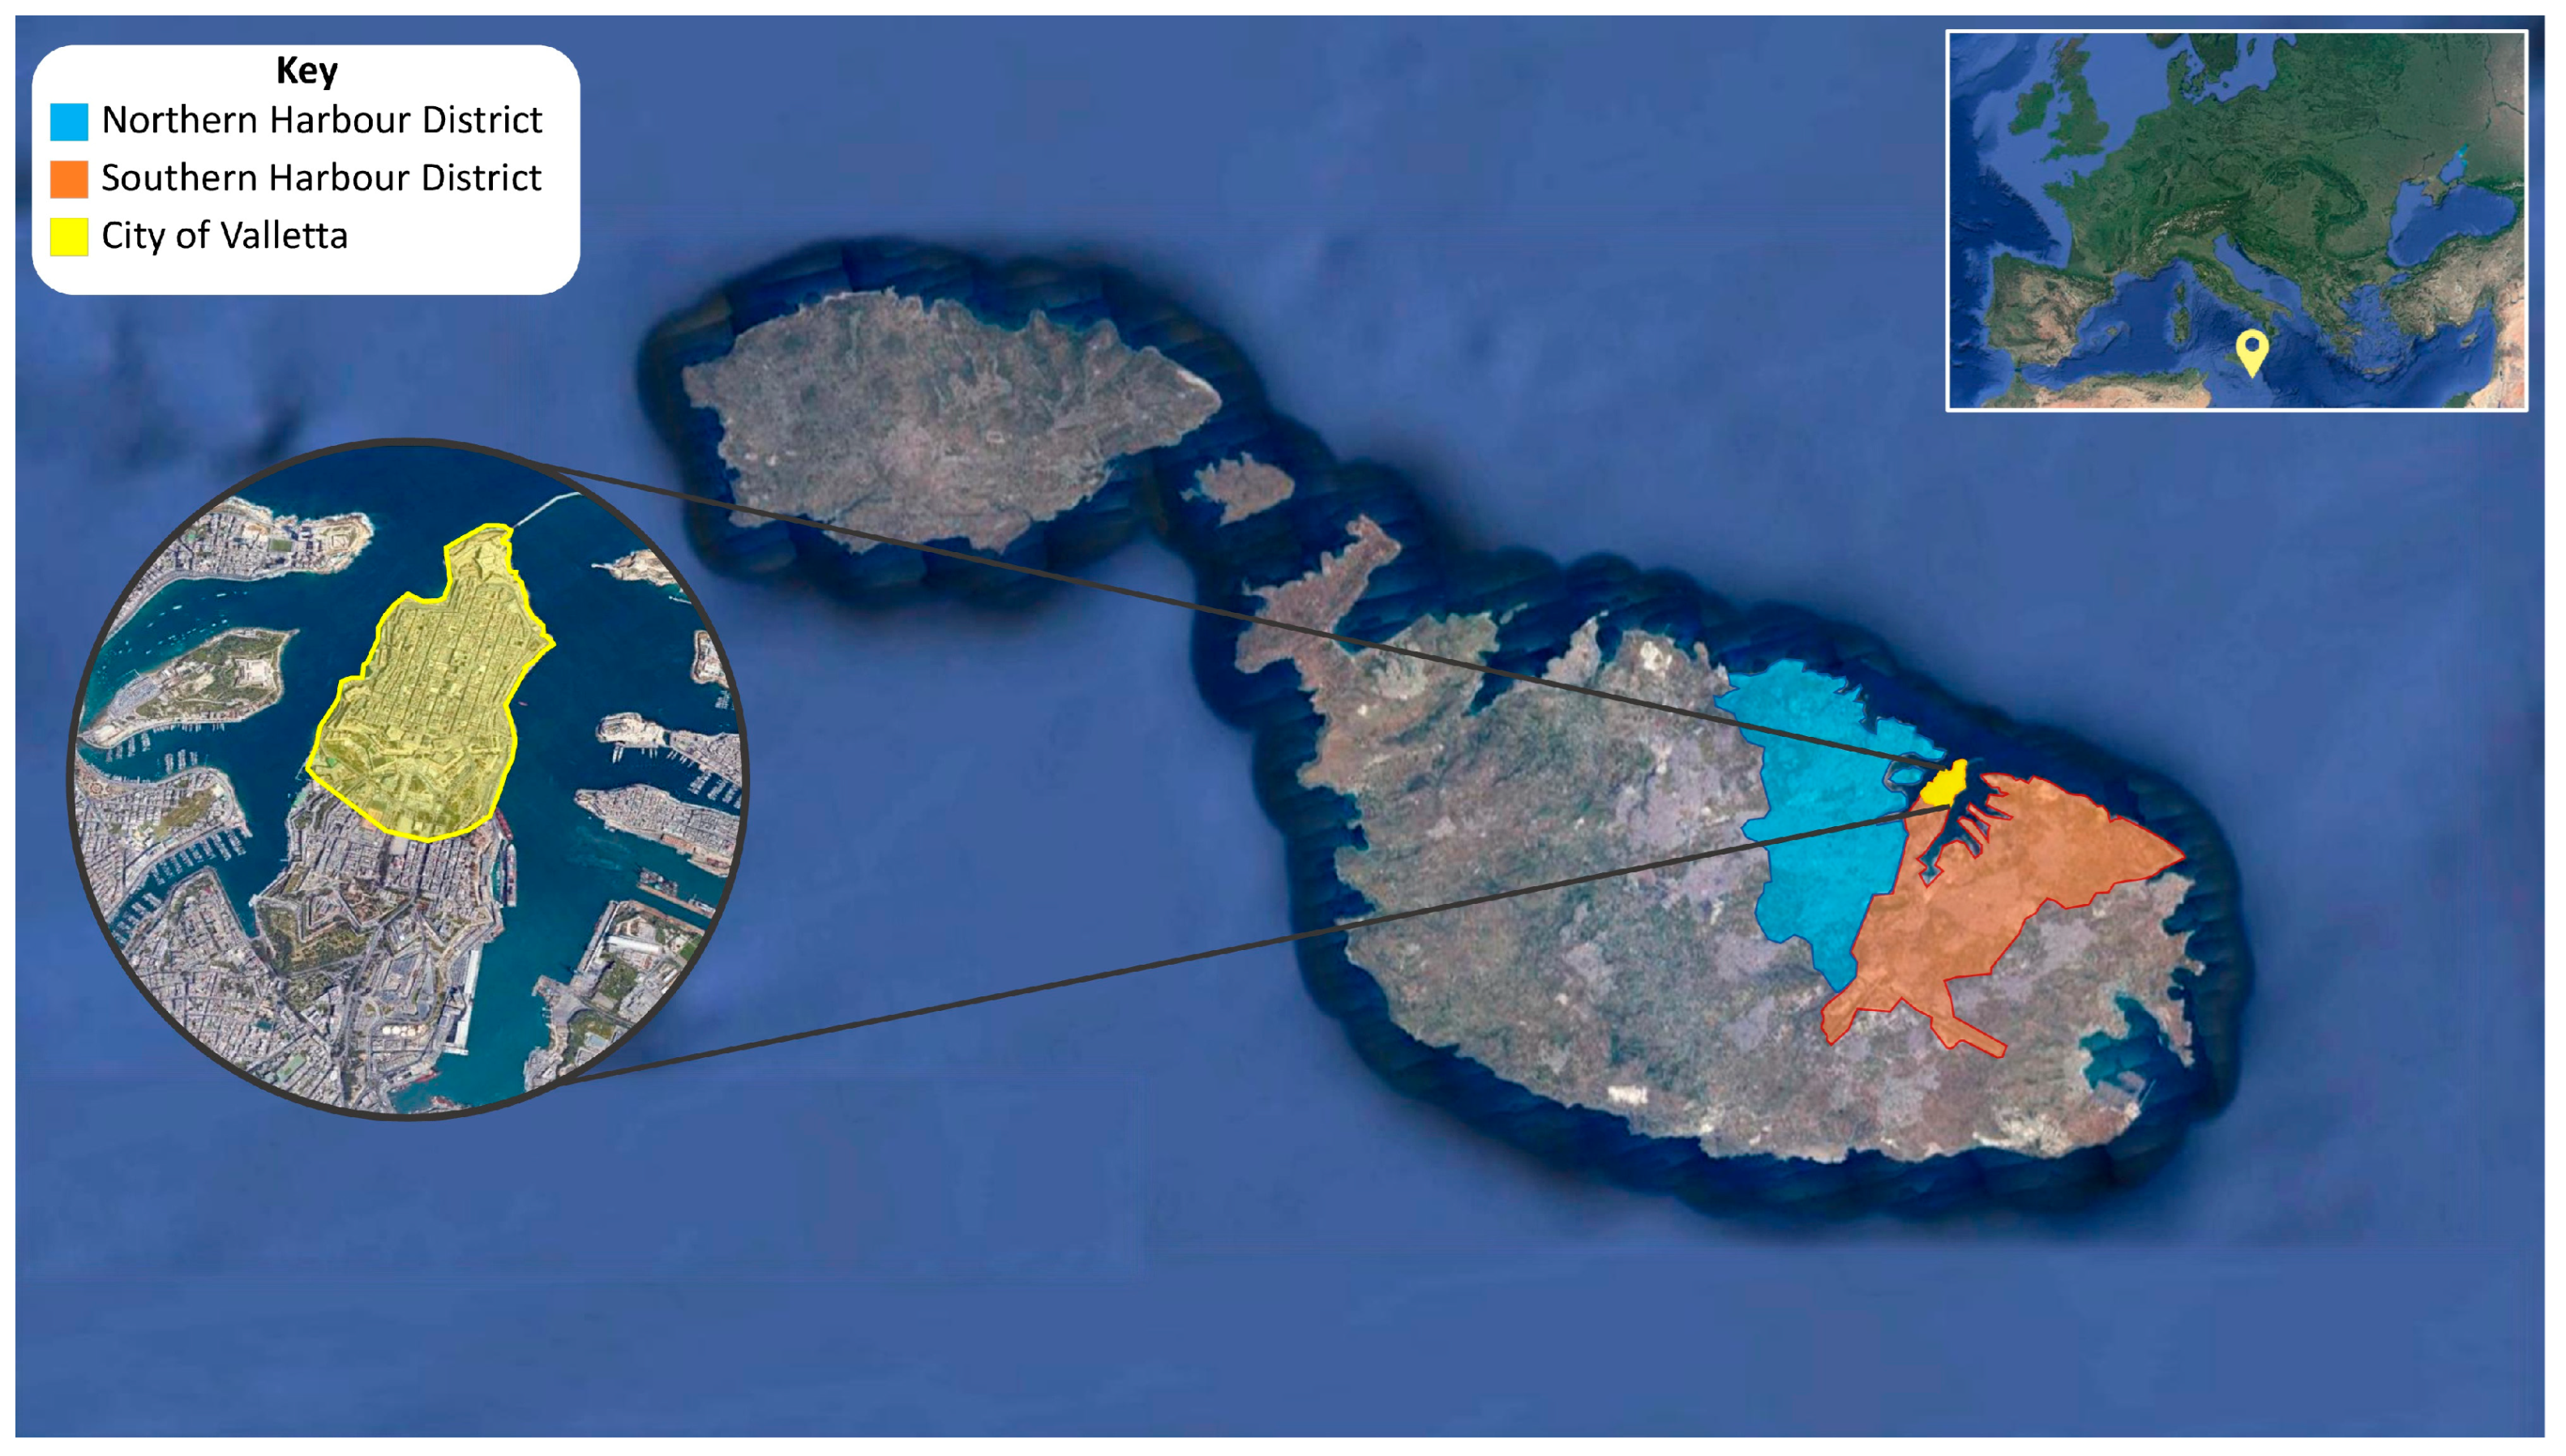
2.2. Case Study of the City of Valletta

The most comprehensive application of this methodology was put into practice during the CITY MINDED project’s Intensive Course held in hybrid form over two weeks (11–15 July and 18–22 July 2022) in Valletta, the capital of Malta. During the first week, which took place online, the teachers conducted specific training sessions explaining the different parts of the methodology. During the second week, held in-person, stakeholder presentations, field visits, and co-working sessions were carried out, involving the seven students (two from UNIROMA3, three from UPO, and two from UNISI), tutored by eight teachers and professionals from partner organisations.
Students were able to learn about the history and peculiarities of this ancient city and the state-archipelago of Malta, thanks to the presentations given by local stakeholders. The Republic of Malta is an island country in Southern Europe, between Sicily and North Africa. Eurostat divided Malta into Local Administrative Units (LAUs), following the Nomenclature of Territorial Units for Statistics (NUTS) applied in the European Union. Malta is divided into six LAU1 (LAU—level 1), also called districts (Southern Harbour, Northern Harbour, Southeastern, Western, Northern, and Gozo and Comino), and 68 LAU 2, also called localities [62] (Figure 3).
Valletta is one of the localities of the Southern Harbour District and is located on a peninsula between two natural harbours, Marsamxett and the Grand Harbour. It is the southernmost capital of Europe and the European Union’s smallest capital city with an area of 0.61 km2. Valletta was designed by engineer Francesco Laparelli da Cortona, appointed by Pope Pius V, and the foundation stone of the city was laid on 28 March 1566 [63,64]. The city is characterised by its fortifications and currently has approximately 5800 inhabitants. It was officially recognised as a UNESCO World Heritage Site in 1980 and was designated as an Urban Conservation Area in 1995 [65], with all constructions in Valletta considered of historical value and preserved.
The in-person part of the Intensive Course activities was hosted on the premises of the Valletta Design Cluster, a community space for cultural and creative practice, located in the renovated Old Abattoir (which in Maltese is called il-Biċċerija l-Antika) and managed by the Valletta Cultural Agency [66].
During the co-working sessions, the students who took part in the workshop were divided into two heterogeneous groups balancing different disciplines and skills. They undertook group work to overcome the challenges presented in each of the four modules, making a presentation at the end of each session. Based on the nature and topics covered in each module, group work did not always focus on the same study areas, but referred to the entire City of Valletta, some of its specific areas, or two Maltese districts. Table 1 shows the study areas considered in each module of the methodology.

3. Results

The results of the four co-working sessions are shown in the following subsections (Section 3.1,Section 3.2,Section 3.3 and Section 3.4). The most important aspect lies not so much in the objective results that emerged in the various sessions, but rather in the application of the process defined by the methodology, which can be considered as the main result of this European project.

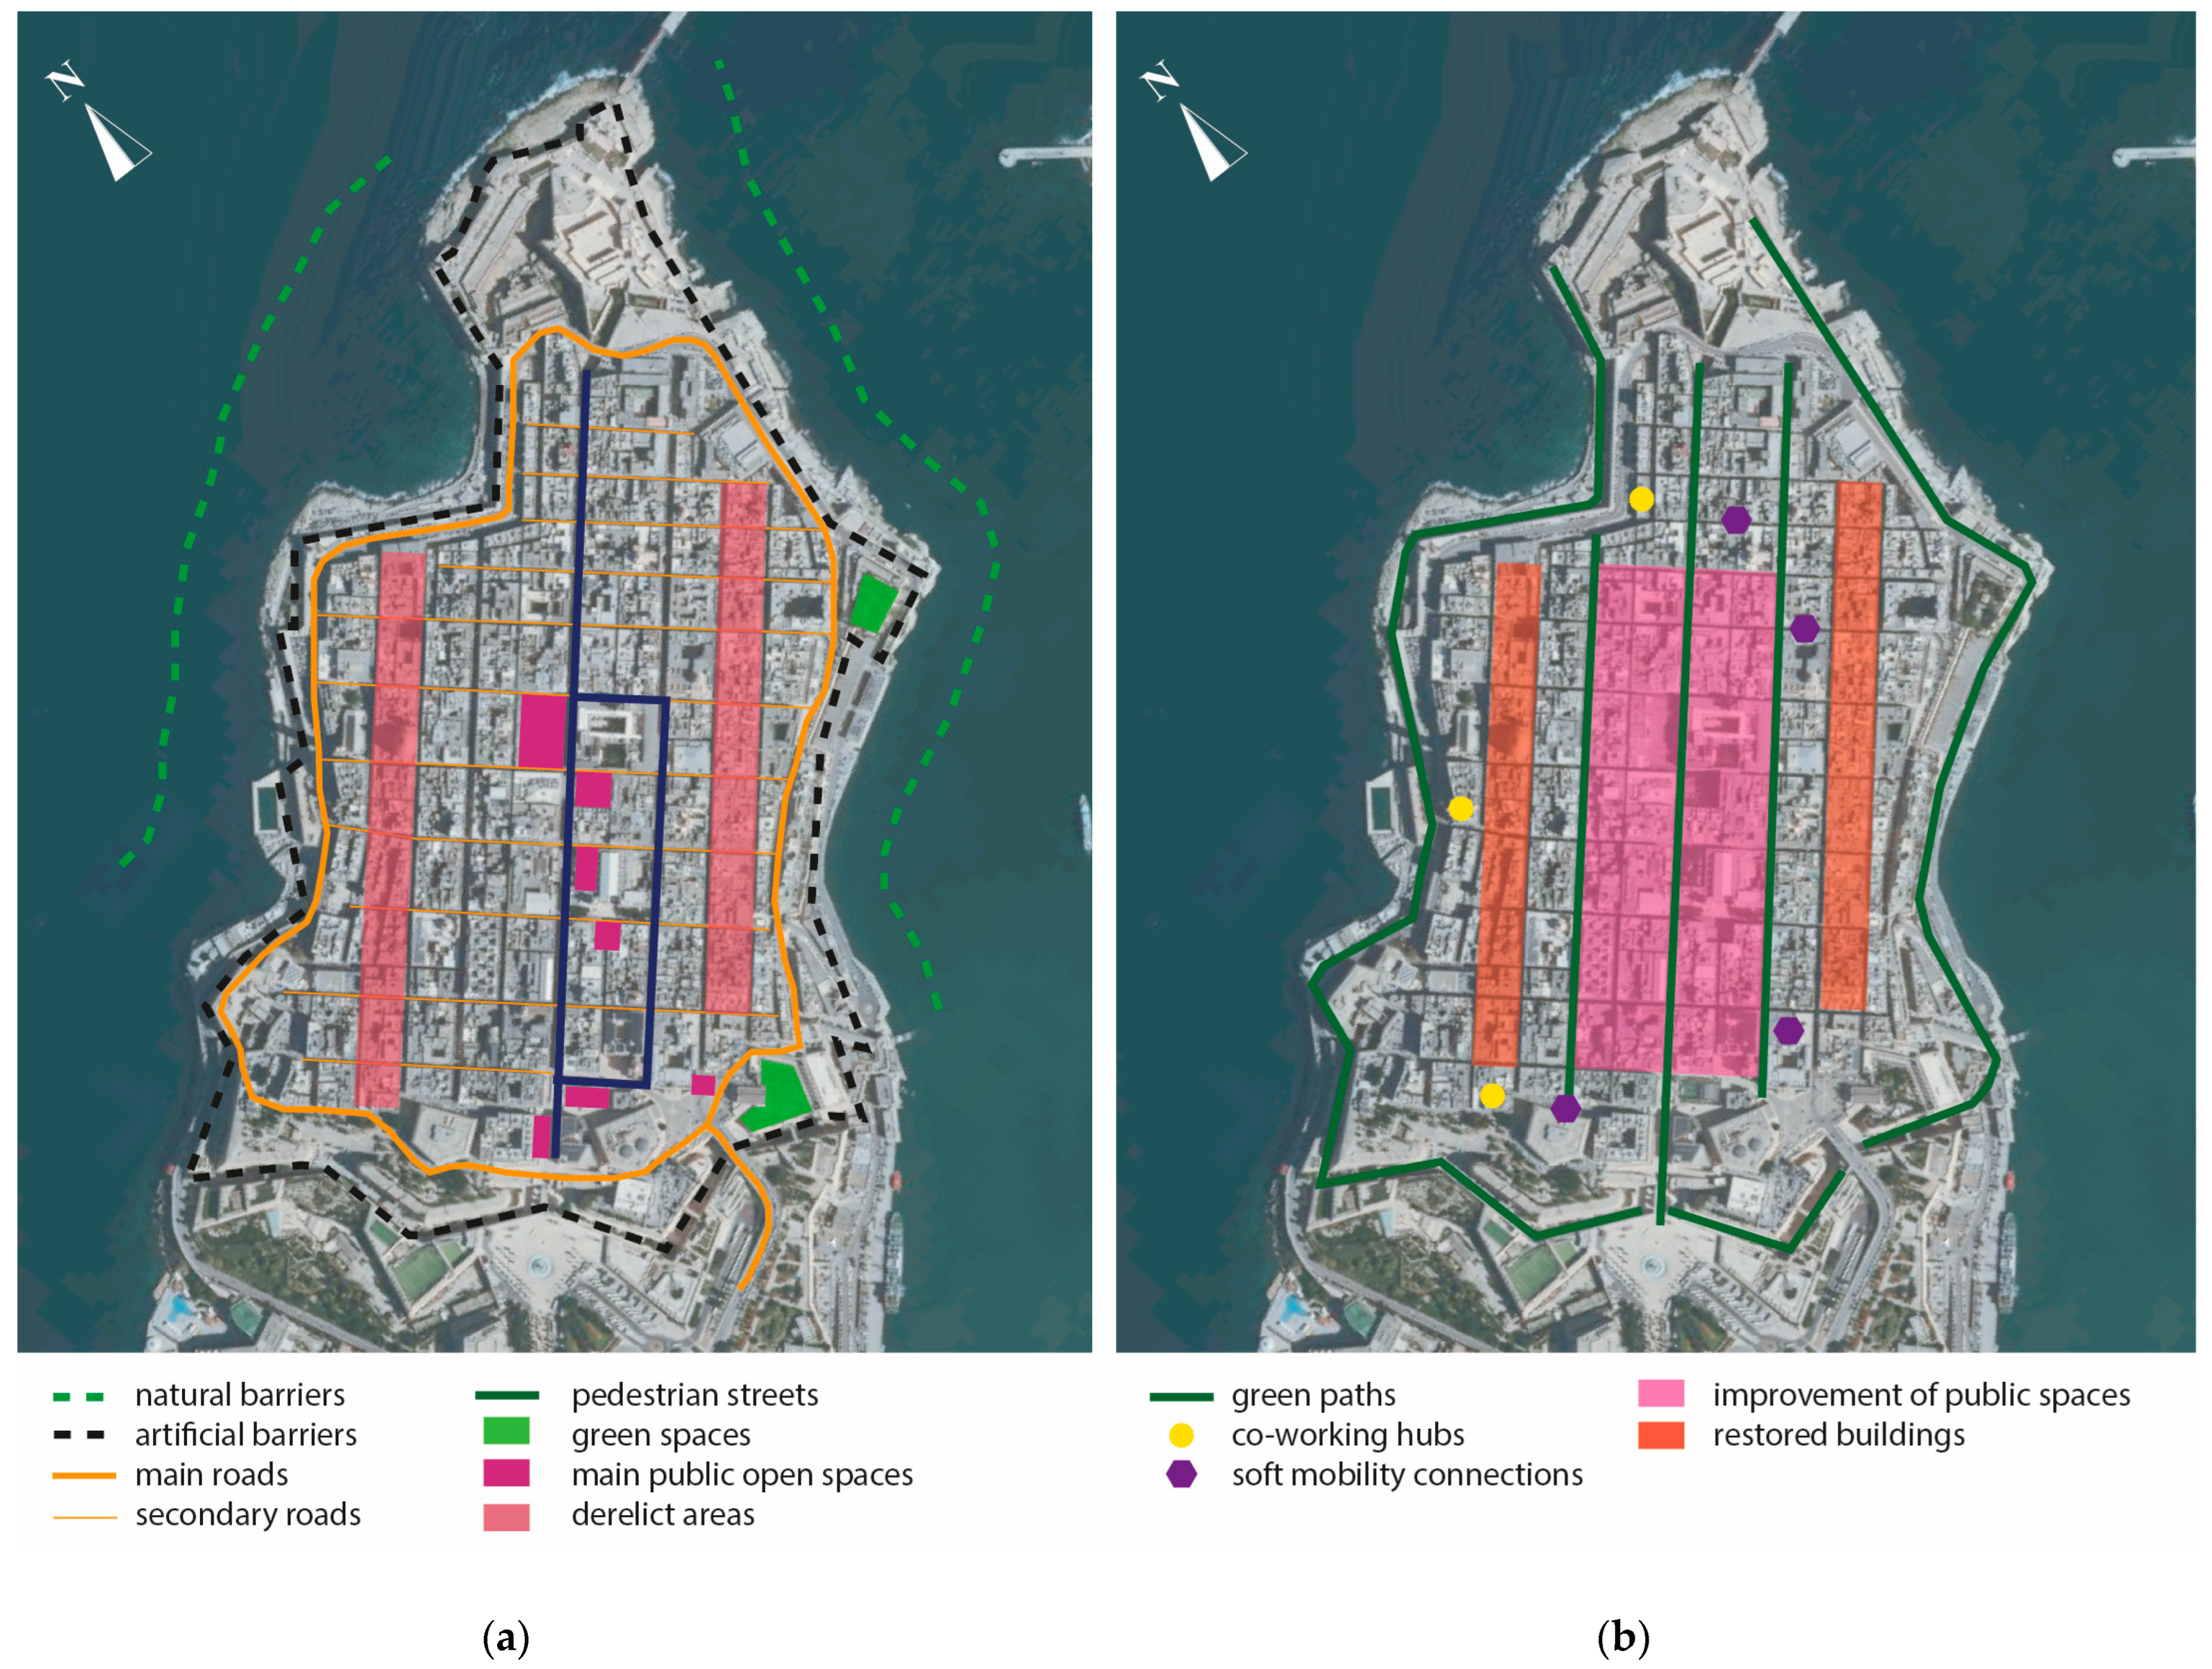
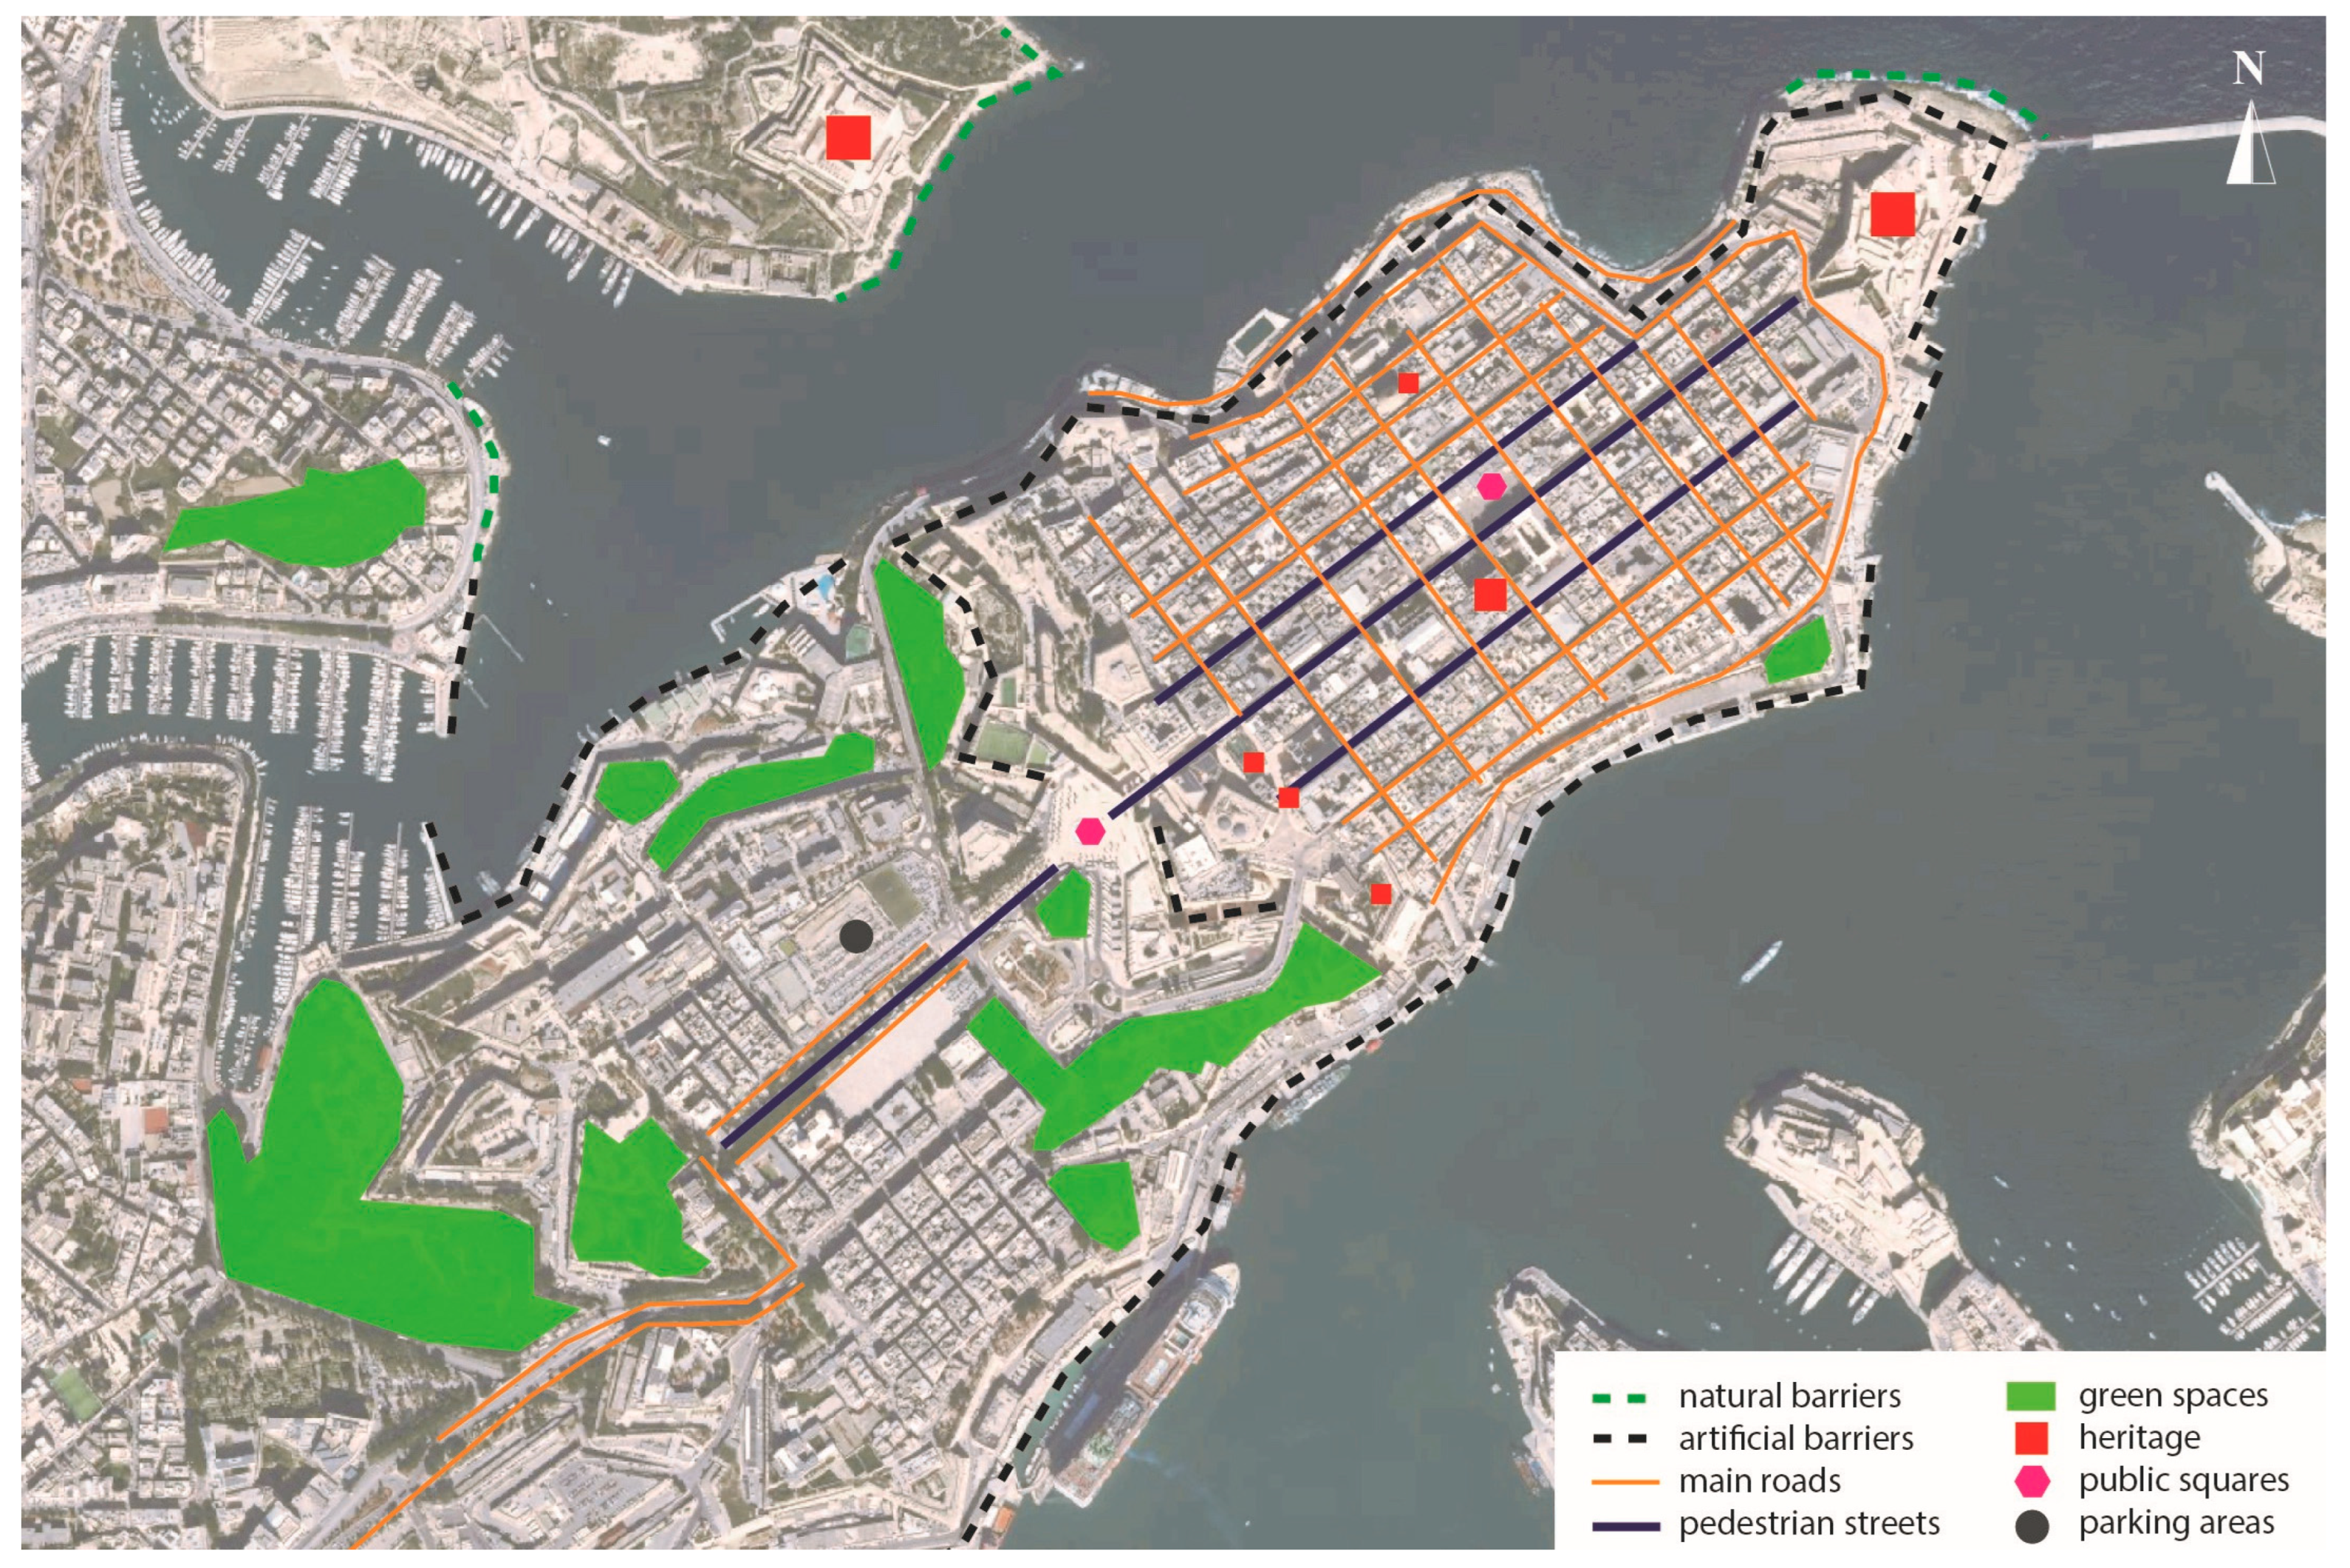
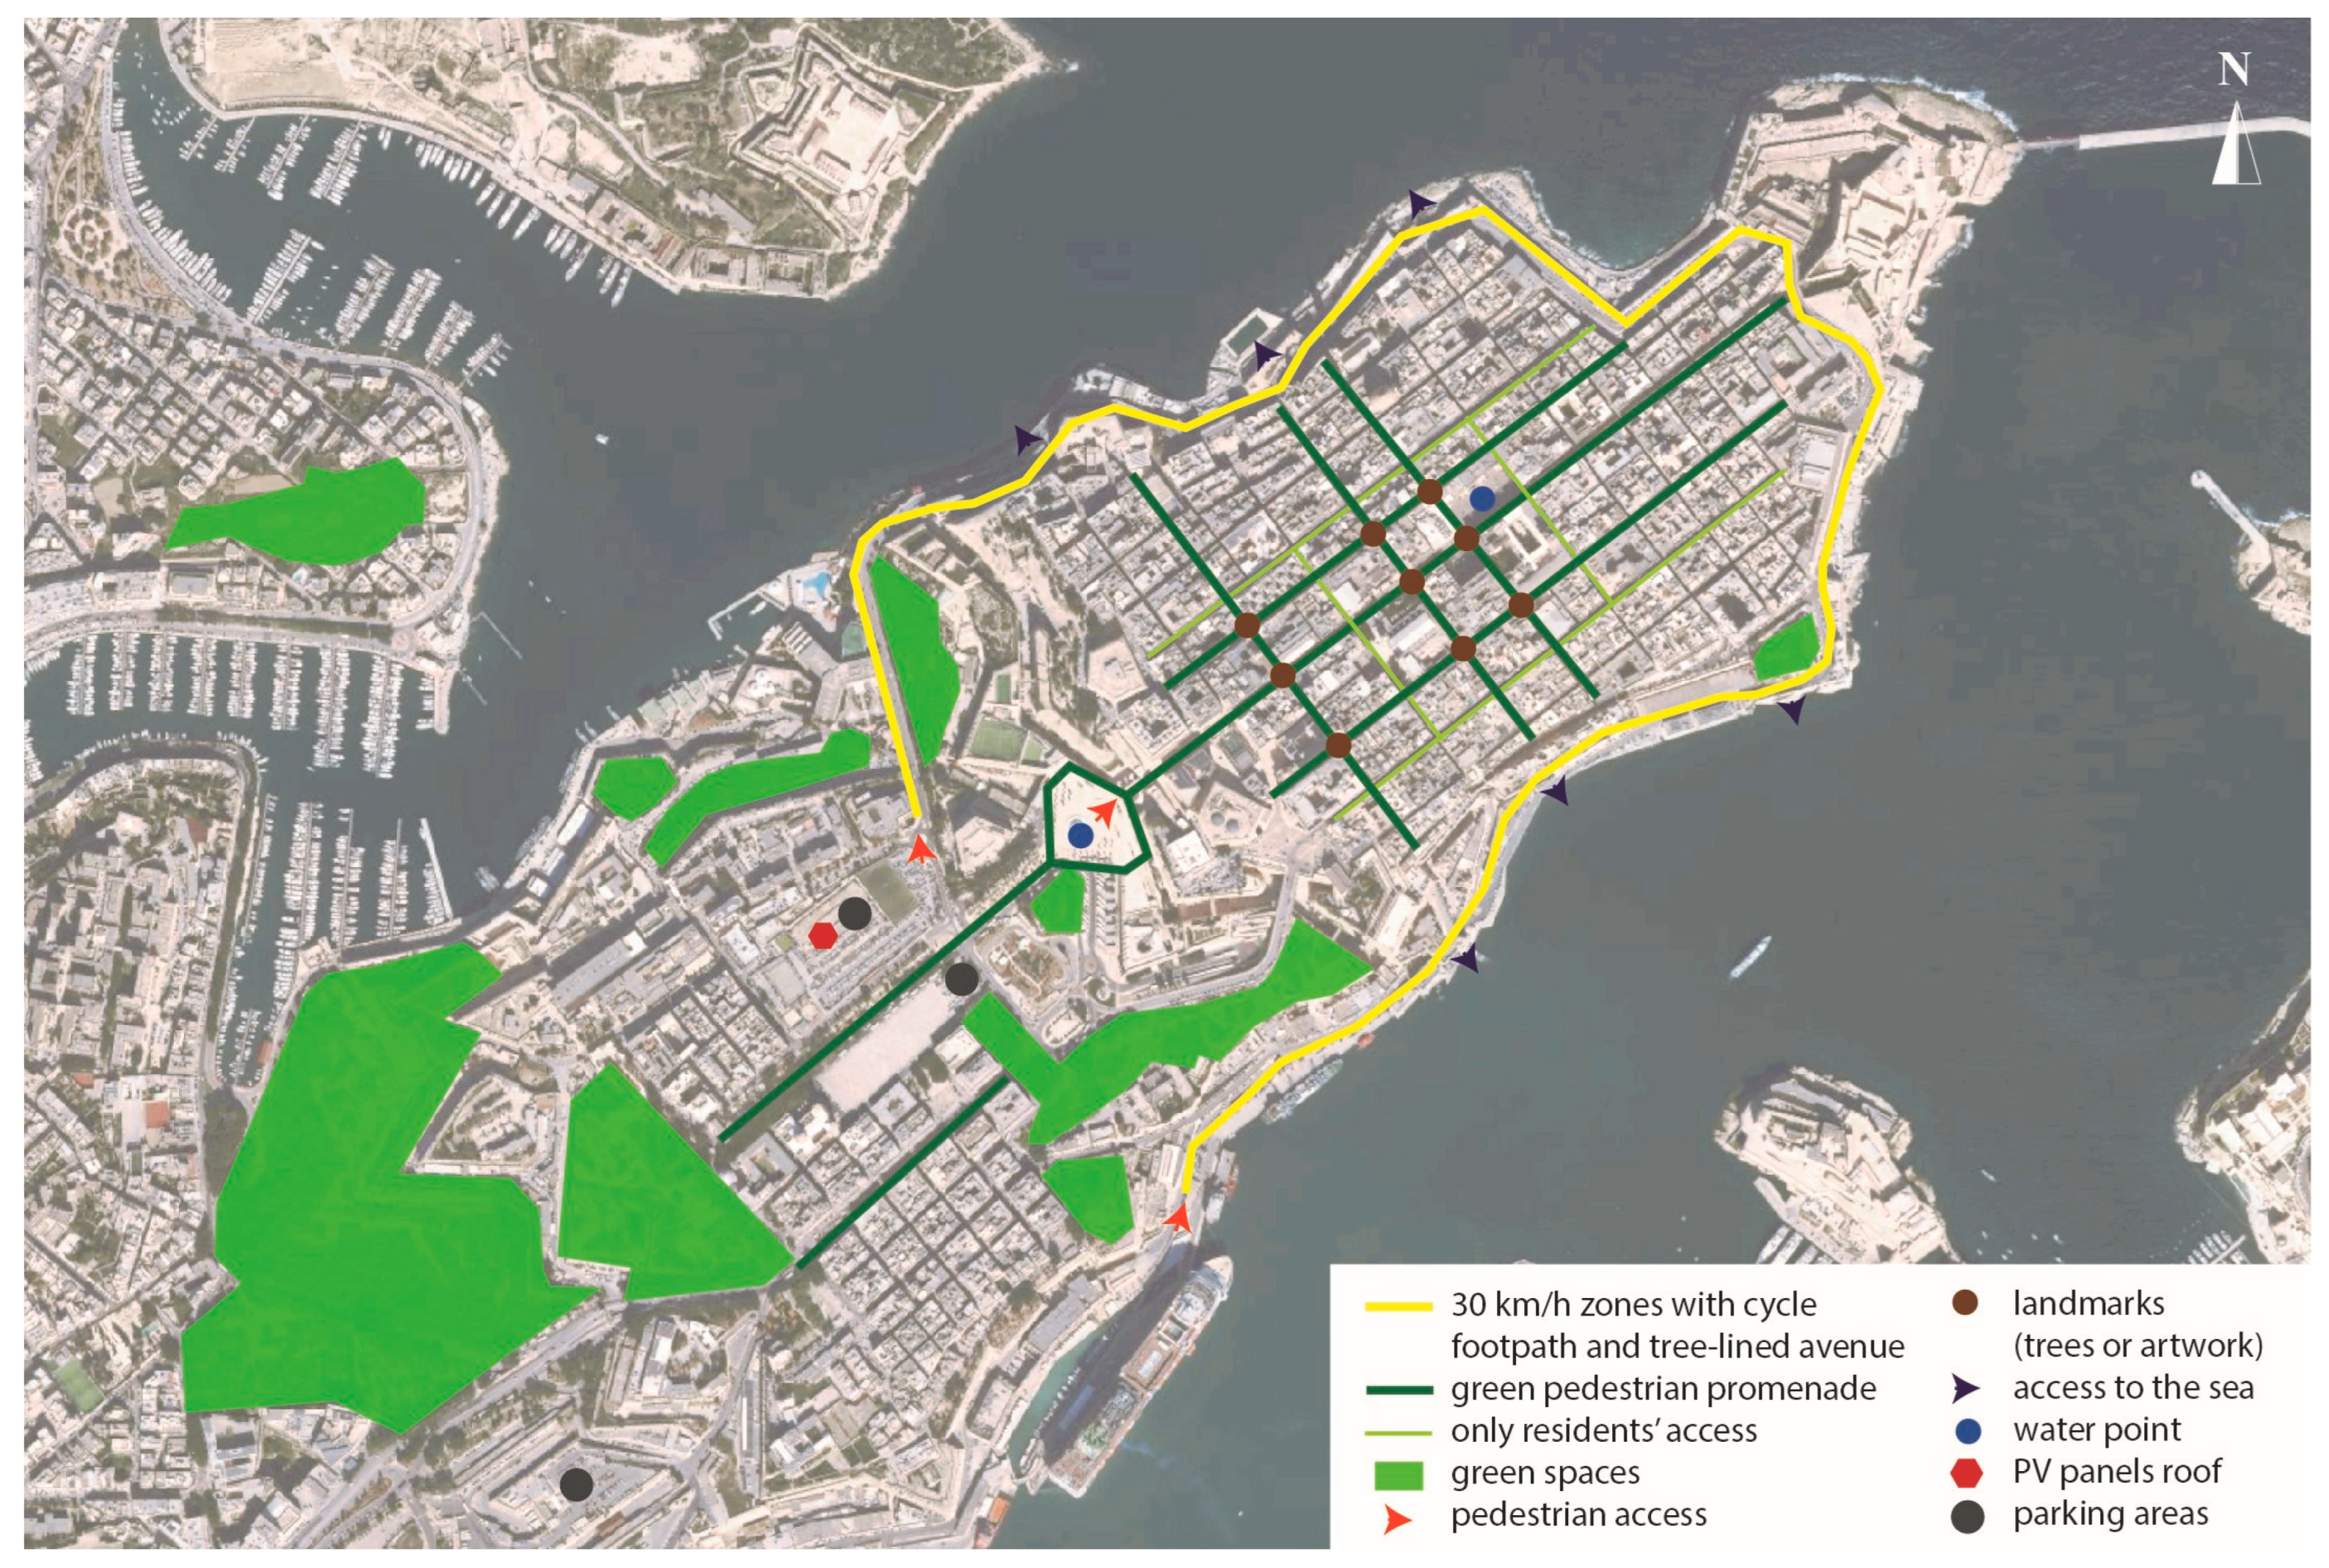
3.1. Placemaking Framework between Green Space Planning and Sustainable Mobility Improvement

In the first part of the co-working session, students were asked to highlight the strengths and weaknesses of Valletta (Table 2), and to identify on a satellite map, three main features of the city: barriers (natural and artificial), connections (ecological and mobility), and key elements (main natural spaces, derelict areas, and public spaces).
In the second part, based on the analysis, students devised objectives and actions for the urban improvement of Valletta (Table 3), and highlighted on the maps possible solutions for mobility (e.g., soft mobility and sustainable transport connections), green infrastructure (e.g., green areas, parks, community gardens, green corridors), and public space (e.g., squares, co-working hubs).
The students of the first group conducted an analysis at the urban scale, mainly focusing on the lack of green spaces and sustainable transport, the negative effects of tourism, and the large number of cars in the city. Furthermore, they recognised the high value of the seaside and the sea and the possibility of involving local people in co-design and co-planning activities to enhance local values (Figure 4a). They then defined their strategy, encouraging practices of materials reuse, and proposing to pedestrianise the city and improve the quality of buildings through urban regeneration and energy efficiency projects (Figure 4b).
The students of the second group conducted an analysis mainly focusing on the lack of green spaces, the overload of cars also within the very historical part of the city, and the scarce use of bicycles, as well as the lack of building maintenance. They also considered the hinterland to frame a wider understanding, especially related to the green areas and open spaces (Figure 5). They then defined the objective and the actions, according to their strategy, to promote pedestrianisation in many areas of the city and to free the city from cars, implement green infrastructure, and enhance the accessibility to the sea (Figure 6).
Both groups used effective representation methods, focusing their attention on the themes of sustainable mobility and pedestrianisation, but also on the increase of green areas and trees for cooling the city. Their strategies created tangible and intangible networks within the city of Valletta, and also within the surrounding areas.

3.2. Vulnerability Assessment for Two Districts of Malta

The starting point of the learning methodology was the Risk Equation. Each group selected a case study (see Table 1) for which they calculated the Vulnerability Index (VI) by following a series of steps included above. Starting from the indices of each Vulnerability Index (Exposure, Sensitivity, and Adaptive Capacity) calculated, the VI structure was analysed, that is, how each of the components influences the final determination of the value of the VI. This allows a first approach to the causes that generate vulnerability. To achieve this, the relative weights of each of the indices in the final value of vulnerability were calculated according to a series of equations (shown in Figure 2), and then they are represented in the Vulnerability Structure Triangle [48]. Once each group had calculated the index for their case study, the results were shared and the index values for each district were compared. Figure 7 and Figure 8 show the results reached by the two working groups.
With this work, the students identified the following main conclusions:
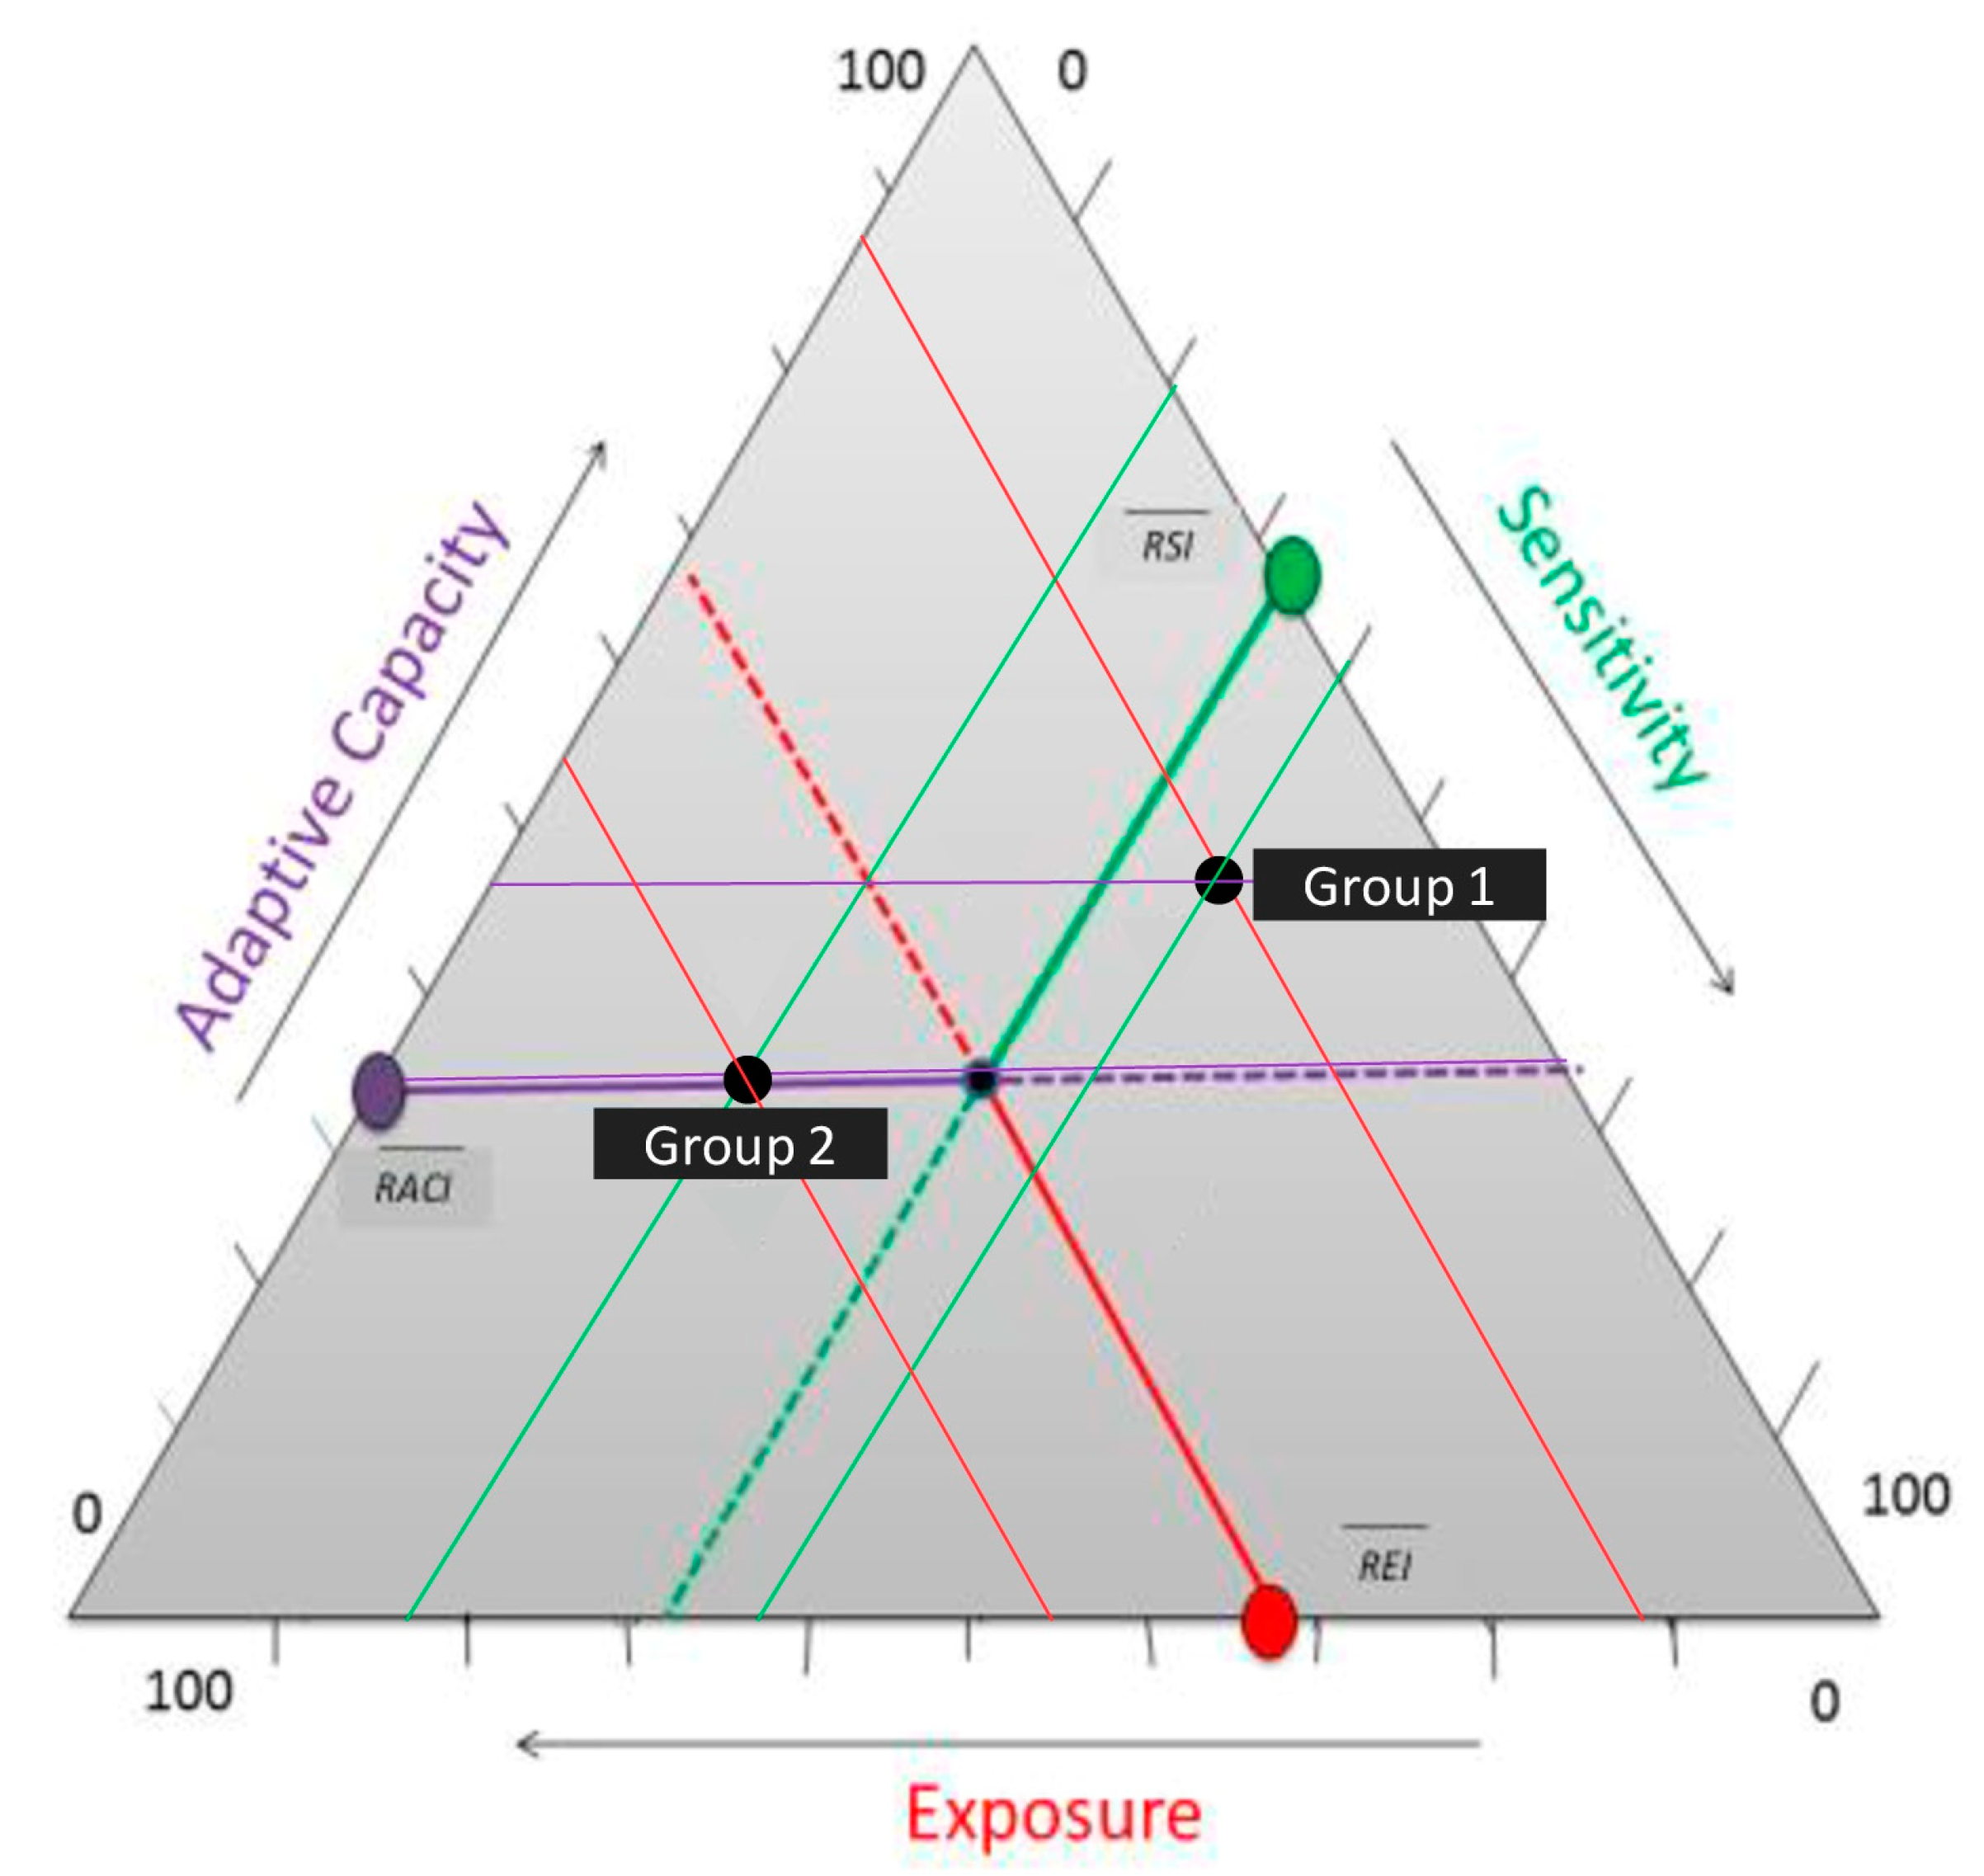
  • Sensitivity and lack of adaptive capacity are the main components of vulnerability for Valletta.
  • Vulnerability is dynamic as it could change between two closely related districts (Figure 9): low in Southern Harbour District (0.34), as quantified by Group 1; very low in Northern Harbour District (0.22), as quantified by Group 2).
  • We will only be able to deal with the risks posed by climate change if we understand what makes us vulnerable.
Furthermore, some conclusions regarding vulnerability are:
  • Vulnerability is multifaceted (social, environmental, institutional, economic, physical).
  • Vulnerability is dynamic (temporal and spatial changes).
  • Vulnerability assessment is hazard and context (territorial scale, availability of data, etc.) specific.
  • There is still a long way to go and many challenges in which to continue advancing these methodologies.

3.3. The Carbon Footprint of the City of Valletta and CF Mitigation Measures

Table 4 shows the results of the CF of the City of Valletta (expressed in t CO2eq), broken down by different sectors and emission sources, with the corresponding hectares (ha) of forest required for CO2 emission absorption. The results are also shown for the responsibility of each household and each inhabitant of Valletta, called Beltin (Table 4). The subtotal does not consider the contribution of diet, to allow comparison with other work that does not count that aspect. As can be seen, Valletta’s subtotal CF value amounts to 30,370 t CO2eq (without diet) and the value for a single household is approximately 15 t CO2eq (an average European household emits 7 t CO2eq [60]).
This very high value is due to several factors:
  • Malta’s energy mix, due to its high dependence on fossil fuels (approximately 74% of the total Maltese electric production), both as regards local production and imports from Italy (almost 17% of electricity derives from interconnector Italy–Malta, of which 66% is based on fossil fuels);
  • Valletta households, in many cases, are quite old and are in need of restoration and energy efficiency improvements;
  • The very high use of air-conditioning, with temperatures inside buildings kept far below those outside.
Moreover, another factor that may have affected the results could derive from the reliability of the data, which have been almost entirely downscaled from official national statistical reports and databases.
Figure 10 facilitates the visualisation of the GHG emissions amount, representing the EVF area required for the absorption of Valletta emissions. The values expressed in tons of GHG in Table 4 are converted and graphically represented through squares, whose area is equivalent to the forested surface (ha) necessary to remove GHG emissions from the atmosphere. In the case study of Valletta, 3085 ha of EVF are necessary to remove 41,643 t CO2eq, i.e., the emissions due to electricity, fuel consumption, mobility, waste, water, and food protein diet. The 310 squares (representing 10 ha of forest each) are used to visualise the 3085 ha of EVF. The forest area is reported in scale in comparison to the City of Valletta. As a result, approximately 50 times the surface of the city of Valletta (61 ha) is needed to remove the GHG emissions.
The steps described above are necessary to define the current emission state.
To design the mitigation plan, the students began an activity of brainstorming to evaluate the characteristics, limitations, and potentiality of the City of Valletta.
Based on the field visit and starting from the maps used during the co-working session 1 (see Section 3.1), the students selected some operational changes to apply to the city according to the mitigation measures suggested in [60] and the implementation of floating wind turbines [67] and Wave Energy Converter (WEC) devices [68].
Listed below are some of the main measures identified in the two working groups (Table 5).
The analysis undertaken by the students determines the GHG emission reductions due to the application of mitigation measures and environmental actions. The evaluation is based on the framework presented in [60], and the resulting values coming from the aggregation of the measures suggested by the two groups are shown in Table 6.
The Carbon Footprint at the end of the simulation is equal to 0 t CO2eq, reaching the carbon neutral status.
All the values obtained in this study have been used and visualised through the CF Pac-Man game. Starting from the current condition (Figure 10), the new representations of the EVF surface are obtained based on different applied environmental policies that students have hypothesised in various continuous decarbonisation scenarios and temporal periods towards carbon neutrality.
All mitigation scenarios for the City of Valletta and reduction of GHG emissions are represented in Figure 11.

3.4. Energy Efficiency Proposal for Historical Buildings in Valletta

The Group 1 students selected the Valletta Design Cluster building, where they analysed the measures already implemented for energy efficiency and renewable energy in/on the building, pointed out the aspects of the area that still have a bad energy performance, and identified the main energy consumers (Figure 12).
The group started the exercise with a walk around the building to identify the implemented measures on/in the building (Table 7): the rooftop garden, the green wall within the main courtyard, the photovoltaic panels on the canopy, the good use of natural light (glass walkways), the efficient organisation of space (module rooms plus external corridor), the use of adaptive and resistant materials (wood and steel) and of LED lights, and the restoration of the existing cisterns.
Following this analysis, the group proposed some additional solutions to improve the energy efficiency of the building and maximise the use of renewables. The proposals included the following: increasing the number of PV panels and construction of a movable PV canopy to increase the efficiency of solar retention; installation of sensors for lights and water taps in the building; limiting air-conditioning temperature; shading the roof garden to improve usability; improving air circulation to reduce the greenhouse effect; improving accessibility for persons with reduced mobility; providing a key map of the building. The main challenges identified by the group were the establishment of the maintenance plan, how to ensure regular checks for PV and service equipment, and the conservation rules (being the Valletta Design Cluster hosted in a heritage building in the historical centre of the city).
For the exercise, the students of Group 2 selected a buildings block located in Triq San Duminku in the historical centre of Valletta (Figure 13).
The group analysed the buildings in several ways. First, the students walked around the block and took notes about the visible interventions or weaknesses. They then interviewed several users and flat owners in order to collect valuable inputs regarding the energy performance of the buildings, the interventions made, and the challenges that the owners are facing, particularly in terms of energy consumption and living comfort.
Following the analysis of the area, the group proposed a set of energy efficiency measures and renewable energy systems, as shown in Table 7.
The group identified the absence of common areas, heritage regulation, and accessibility as the main challenges. As mitigation measures, the group proposed the organisation of common areas on the roofs, and the use of roofs for the installation of renewables and possibly of glass PV cells. As regards accessibility, the group proposed to install a common wood ramp to avoid steps at the entrance of the block, and to adapt the stairs and the street access to the roof for people with reduced mobility.

4. Discussion

Many scholars have acknowledged the importance for university teaching of adopting an interdisciplinary approach when dealing with complex issues such as those related to urban sustainability and, more recently, to low carbon transition in cities [69]. Recently, Sibilla and Kurul argued, though, that existing experiences often refer to “special learning events” and fail to rethink the overall pedagogical approach to university teaching to embed interdisciplinarity [70]. This resulted in the development of a new pedagogical approach, based on the use of concept maps as a tool to facilitate the integration of different backgrounds and levels of knowledge, and tested and developed this approach, also within the framework of other Erasmus+ projects such as EH-Cmap. In spite of this, structured teaching practices addressing urban decarbonisation in an interdisciplinary way, easily applicable to integrate and improve existing HE courses on urban matters, seem to be still lacking. The present paper aims to propose a methodology to design and replicate (and possibly further develop) a structured ordinary practice to teach urban decarbonisation. This practice has been designed to be at the same time interdisciplinary (i.e., involving both tutors and students with different backgrounds), collaborative (i.e., based on group work and collective discussion), experiential, and place-based (complementing the site visits already widely used in urban planning schools with direct interaction with local stakeholders).
The methodology here presented was designed, implemented, and tested as part of the Erasmus+ CITY MINDED project, and took advantage of the European framework offered by the programme to offer students a combination of different approaches and working methods for investigating and improving urban contexts from the climate mitigation and adaptation standpoints. The transnational scope of the project added to interdisciplinarity the opportunity to work in an international learning environment.
The methodology builds on the results of the FP7 City-Zen project [29], which used urban neighbourhoods as living labs, assessing their Carbon Footprint and designing feasible decarbonisation agendas with the direct involvement of local stakeholders and citizens in a series of brief, intense training and co-working sessions called “Roadshows”. CITY MINDED widened the scope of City-Zen to incorporate various approaches to urban climate mitigation and adaptation, adapted the City-Zen method and tools to a Higher Education context, and tested them with students of urban-related disciplines (architecture, urban planning, geography, etc.). The purpose was twofold: to improve the learning experience (developing students’ interdisciplinary knowledge and soft skills, and increasing their capacities to deal with complexity), and to test and promote new teaching approaches based on knowledge co-creation, international exchange, and real-life applications. Therefore, CITY MINDED focused less on the urban sustainability agenda as a product and more on the process leading to its definition, and on the learning environment where the process occurs.
The four modules were originally envisaged to create a framework allowing observation of the context from both a qualitative and quantitative point of view “on the spot”, with support from local stakeholders in Siena, Rome, Seville, and, lastly, Valletta. Besides the identification of problems, flaws, and merits of a neighbourhood, realistic solutions and proposals were targeted to obtain more sustainable neighbourhoods and, when possible, carbon neutral environments in the medium-to-long-term.
The COVID-19 pandemic, which arrived during the first phase of the project implementation, forced a complete revision of the initial design in order to work even remotely. At first, the presented method was tested mainly online, as three of the four workshops were developed during the COVID-19 restriction period. Only in the case of Valletta was it possible to directly explore the target areas and establish a more in-depth dialogue with stakeholders and inhabitants, through site visits and interviews. The in-person attendance at the Intensive Course in the City of Valletta has shown how this methodology, bringing together expertise and knowledge from five different partner organisations, enables students to effectively investigate an urban context, critically observe its characteristics and peculiarities, and find tailored solutions for its decarbonisation.
The methodology applied in the workshops represents a preliminary, non-exhaustive, and simplified analysis for the decarbonisation of the case studies. The goal was to define an immediate methodology applicable in different HEIs.
Without a doubt, this project had to deal with the restrictions caused by the COVID-19 pandemic, but this also allowed students to experience and understand the importance of fieldwork, direct exploration of public space and person-to-person relationships, and the role that sustainable planning and design can play in the improvement in the quality of life and the environment in cities.
The aim of this project, demonstrated by the results of the workshops, was to raise awareness of the use of multidisciplinary methods within HEIs, considering the still persisting sectorial nature of university faculties. To achieve the objectives of urban sustainability, it is necessary to train professionals who have highly specific skills but also the ability to have an overview that can range between disciplines. After the presentation of the results by both student groups, it was concluded that the developed methodology worked very smoothly in the real condition and that the workshop in presence gave more opportunity to produce tangible results than in the online workshops. Nevertheless, the developed methodology can work in both conditions, and this is certainly an added value of the project. The collective work of students and teachers from different universities and with different levels of knowledge provided significant proposals for the energy efficiency improvement of the target area and of Valletta in general, which can be further exploited by stakeholders and practitioners to prepare actions aiming at achieving carbon neutrality in the upcoming years.
The results show that the students have successfully integrated the knowledge and skills acquired within the different modules, placing the various solutions developed therein in relation to each other. In fact, some of the solutions proposed in the urban analysis of the Placemaking Framework have been better explored in the following modules, up to the definition of proposals on a building scale. In this sense, the project succeeded in achieving its didactic objectives, since it stimulated students to establish connections across disciplines.
The most important and innovative outcome of this experience lies not so much in the solutions developed, but rather in the application of the teaching and learning process defined by the methodology: the project, indeed, succeeded in stimulating students to establish connections across disciplines, and also in raising their awareness about the complexity of city decarbonisation processes, which considers many aspects both quantitative and qualitative. In this respect, students were also trained in data collection, and guided in understanding topographic maps and plans used for the simulation’s implementation.
Overall, a crucial point exists in the heterogeneity of data available in the field: environmental data notoriously concern areas much larger than the analysed contexts. The analysis process conducted by the quantitative modules (Carbon Accounting and Vulnerability Assessment), despite being multidisciplinary, was affected by the availability of homogeneous data. As for the Vulnerability Assessment module, data were available only at a territorial scale. Moreover, in the application of Carbon Accounting, some data have been downscaled from national statistics and simplified. This was considered acceptable during the project, due to the limited time and resources available for the workshop’s organisation. However, application of the methodology in HE courses will certainly allow for a more accurate data search and collection, which could even be conducted as a part of the course, actively involving students in the task.
The project also had the merit of improving teachers’ skills, by raising awareness of the importance of applying multidisciplinary teaching methods in a real environment, and by fostering the exchange of approaches, knowledge, and mutual learning, resulting in a gradual improvement of the teaching modules.
The CITY MINDED methodology, albeit non-exhaustive and limited in its application by time and budget constraints, can be replicated within different degree programs dealing with urban sustainability, bringing further integrations and developments. This project’s legacy will depend on the application that the partner universities make of this multidisciplinary methodology within their courses.
For the methodology to be capitalised and replicated, the CITY MINDED project has developed various support tools such as a monographic issue on the project topics, an online e-learning course for students, and a toolkit dedicated to teachers, available on https://elearning.cityminded.eu/ (accessed on 19 January 2023).
The online e-learning course, the teachers’ toolkit, and the publications made available by this project have been conceived to support such replication and help transfer the project’s legacy to other universities, in Europe and beyond. Under this standpoint, a main theme deserving to be investigated within university courses concerns the coupling between qualitative approaches—as a matter of fact, humanities convey “subjectivity”, yet are shared by a group of experts—and the so-called “hard science”, admittedly objective. This issue, embedded in the sustainability agendas of cities and regions, will demand ever greater attention in the years to come.

5. Conclusions

The main objective of the Erasmus+ CITY MINDED project was to develop and test an innovative and creative European-scaled learning environment in which students, specialists, and stakeholders can collaborate to identify and design the best solutions for decarbonising European cities. This work presented the methodology developed within the project, with a focus on the application carried out for the study of the City of Valletta in Malta.
This methodology was jointly designed by project partners at the beginning of the project, then tested and refined along three online workshops with students, and finally culminated in an in-person international Intensive Course in Malta. The methodology blends different disciplinary approaches to urban decarbonisation, represented by the partners’ specialised expertise, and combines theoretical teaching and practical group exercises allowing learners to apply acquired knowledge to concrete urban contexts in a short time span.
The final testbed of the methodology was an intensive workshop held in hybrid form over two weeks in Valletta involving seven students from partner universities. The workshop consisted of four modules, developed by the five partners in a training session and a co-working one, which combined to allow the analysis of the context from both a qualitative and a quantitative point of view. Stakeholders’ presentations and field visits were also arranged to enrich the learning experience. The workshop resulted in a multi-faceted analysis of the target neighbourhood, and in a set of realistic solutions and proposals to make the urban area more sustainable, innovative, and, if possible, carbon neutral in the medium-to-long-term.
Considering the results of the various workshops conducted within this project, for the future application of the methodology, it would be desirable if the different modules worked on the same scale in order to have data uniformity and the possibility of a more detailed comparison between the different outputs of the modules.
Furthermore, in order to have a complete analysis of the economic impacts of the corrective actions for the decarbonisation of the city, it could be helpful to introduce an additional simplified cost-benefit analysis module to also evaluate the economic aspects of urban sustainability.
The methodology, especially in order to be able to define more rigorous and coherent improvement interventions, would need the application phase to be enriched with greater insights into the planning and building regulations of the case studies taken into consideration, in order to define more likely scenarios.
Overall, further steps forward in the application of the methodology could therefore concern these further investigations, and also the provision of a pre-workshop in which the students could personally carry out the data collection and define more in-depth analyses of the case studies.

Author Contributions

Conceptualization, M.M. (Matteo Maccanti) and R.D.; Formal analysis, M.M. (Matteo Maccanti), M.M. (Michela Marchi) and J.V.M.; Investigation, M.M. (Matteo Maccanti), R.D., M.M. (Michela Marchi), J.V.M., A.P., D.S.C., L.B. and J.L.G.; Methodology, F.D.P., M.M. (Michela Marchi) and R.M.P.; Supervision, A.L.P. and S.B.; Writing—original draft preparation, M.M. (Matteo Maccanti), R.D., F.D.P., M.M. (Michela Marchi), J.V.M., R.M.P., A.P., D.S.C., L.B., J.L.G., V.N., C.G., F.P.M., J.X., A.L.P. and S.B.; Writing—review and editing, M.M. (Matteo Maccanti), R.D., F.D.P. and R.M.P. All authors have read and agreed to the published version of the manuscript.

Funding

This research was funded by the Erasmus+ CITY MINDED project, grant number 2019-1-HR01-KA203-060969.

Institutional Review Board Statement

Not applicable.

Informed Consent Statement

Not applicable.

Data Availability Statement

Not applicable.

Acknowledgments

The authors would like to thank all the students who participated in the Valletta workshop and also those who took part in the Siena, Rome, and Seville workshops. Thanks to their work and feedback, the project and the methodology have improved during the years of the CITY MINDED project.

Conflicts of Interest

The authors declare no conflict of interest.

References

  1. European Commission (EC). Communication from the Commission to the European Parliament, the Council, the European Economic and Social Committee and the Committee of the Regions. In Green Infrastructure (GI)—Enhancing Europe’s Natural Capital; European Commission: Brussels, Belgium, 2013; Available online: https://eur-lex.europa.eu/legal-content/EN/TXT/?uri=celex%3A52013DC0249 (accessed on 19 January 2023).
  2. European Commission (EC). Communication from the Commission to the European Parliament, the Council, the European Economic and Social Committee and the Committee of the Regions. In EU Biodiversity Strategy for 2030. Bringing Nature Back into Our Lives; European Commission: Brussels, Belgium, 2020; Available online: https://eur-lex.europa.eu/legal-content/EN/TXT/?uri=celex%3A52020DC0380 (accessed on 17 January 2023).
  3. European Commission (EC). The European Green Deal; European Commission: Brussels, Belgium, 2019. [Google Scholar]
  4. United Nations (UN). Day of Eight Billion. 2022. Available online: https://www.un.org/en/dayof8billion (accessed on 19 January 2023).
  5. World Economic Forum. Population Boom: Charting How We Got to Nearly 8 Billion People. 2022. Available online: https://www.weforum.org/agenda/2021/12/world-population-history (accessed on 19 January 2023).
  6. United Nations (UN). World Population Prospects 2022—Summary of Results; United Nations Department of Economic and Social Affairs, Population Division: New York, NY, USA, 2022; ISBN 978-92-1-148373-4. [Google Scholar]
  7. United Nations Human Settlements Programme (UN-Habitat). World Cities Report 2022—Envisaging the Future of Cities; UN-Habitat: Nairobi, Kenya, 2022; p. 422. ISBN 978-92-1-132894-3. Available online: https://unhabitat.org/sites/default/files/2022/06/wcr_2022.pdf (accessed on 16 January 2023).
  8. United Nations Human Settlements Programme (UN-Habitat). World Cities Report 2020—The Value of Sustainable Urbanization; UN-Habitat: Nairobi, Kenya, 2020; p. 418. ISBN 978-92-1-132872-1. Available online: https://unhabitat.org/World%20Cities%20Report%202020 (accessed on 18 January 2023).
  9. European Commission (EC). Urban Data Platform Plus—Trends and Drivers. 2022. Available online: https://urban.jrc.ec.europa.eu/thefutureofcities/urbanisation#the-chapte (accessed on 18 January 2023).
  10. European Commission (EC). In Focus: Energy Efficiency in Buildings. European Commission Website, NEWS, 17 February 2020, Brussels. Available online: https://ec.europa.eu/info/news/focus-energy-efficiency-buildings-2020-lut-17_en (accessed on 12 December 2022).
  11. Magaudda, S.; D’Ascanio, R.; Muccitelli, S.; Palazzo, A.L. ‘Greening’ Green Infrastructure. Good Italian Practices for Enhancing Green Infrastructure through the Common Agricultural Policy. Sustainability 2020, 12, 2301. [Google Scholar] [CrossRef] [Green Version]
  12. Kondratyeva, A.; Knapp, S.; Durka, W.; Kühn, I.; Vallet, J.; Machon, N.; Martin, G.; Motard, E.; Grandcolas, P.; Pavoine, S. Urbanization Effects on Biodiversity Revealed by a Two-Scale Analysis of Species Functional Uniqueness vs. Redundancy. Front. Ecol. Evol. 2020, 8, 73. [Google Scholar] [CrossRef] [Green Version]
  13. Battisti, C. Habitat fragmentation, fauna and ecological network planning: Toward a theoretical conceptual framework. Ital. J. Zool. 2003, 70, 241–247. [Google Scholar] [CrossRef]
  14. European Commission (EC). Communication from the Commission to the European Parliament, the Council, the European Economic and Social Committee and the Committee of the Regions. In Our Life Insurance, Our Natural Capital: An EU Biodiversity Strategy to 2020; European Commission: Brussels, Belgium, 2011; Available online: https://eur-lex.europa.eu/legal-content/EN/TXT/?uri=CELEX%3A52011DC0244 (accessed on 3 November 2022).
  15. Becchio, C.; Delmastro, C.; Fabi, V.; Lombardi, P. The role of nearly-zero energy buildings in the transition towards Post-Carbon Cities. SCS 2016, 27, 324–337. [Google Scholar] [CrossRef]
  16. European Commission (EC). Communication from the Commission to the European Parliament, the European Council, the Council, the European Economic and Social Committee, the Committee of the Regions and the European Investment Bank. In A Clean Planet for All: A European Strategic Long-Term Vision for a Prosperous, Modern, Competitive and Climate Neutral Economy; European Commission: Brussels, Belgium, 2018. [Google Scholar]
  17. Bottero, M.; Dell’Anna, F.; Morgese, V. Evaluating the Transition towards Post-Carbon Cities: A Literature Review. Sustainability 2021, 13, 567. [Google Scholar] [CrossRef]
  18. Federation of Canadian Municipalities (FCM). Green Municipal Fund—Sustainable Neighbourhood Development: Practical Solutions to Common Challenges; Federation of Canadian Municipalities: Ottawa, Ontario, 2016; Available online: https://fcm.ca/sites/default/files/documents/resources/guide/sustainable-neighbourhood-development-av-gmf.pdf (accessed on 11 December 2022).
  19. United Nations (UN). Transforming Our World: The 2030 Agenda for Sustainable Development; United Nations: New York, NY, USA, 2015; Available online: https://sustainabledevelopment.un.org/post2015/transformingourworld (accessed on 18 November 2022).
  20. Clergeau, P.; Blanc, N. (Eds.) Trames Vertes Urbaines. De la Recherche Scientifique au Projet Urbain; Le Moniteur ed.: Paris, France, 2013; p. 339. ISBN 978-2281129212. [Google Scholar]
  21. Andreucci, M.B. Progettare Green Infrastructure; Wolters Kluwer Italia: Milano, Italiy, 2017; pp. 103–105. [Google Scholar]
  22. Sachs, J.D.; Schmidt-Traub, G.; Mazzucato, M.; Messner, D.; Nakicenovic, N.; Rockström, J. Six Transformations to achieve the Sustainable Development Goals. Nat. Sustain. 2019, 2, 805–814. [Google Scholar] [CrossRef]
  23. United Nations Development Programme (UNDP). Climate Action from the Ground Up—Supporting Cities and Local and Regional Governments to Achieve the Paris Agreement; United Nations Development Programme: New York, NY, USA, 2022. [Google Scholar]
  24. Hamdan, H.A.M.; Andersen, P.H.; de Boer, L. Stakeholder collaboration in sustainable neighborhood projects—A review and research agenda. Sustain. Cities Soc. 2021, 68, 102776. [Google Scholar] [CrossRef]
  25. European Commission (EC). Directorate-General for Research and Innovation. Climate Action, Environment, Resource Efficiency and Raw Materials. In Towards an EU Research and Innovation Policy Agenda for Nature-Based Solutions & Re-Naturing Cities. Final Report of the Horizon 2020 Expert Group on ‘Nature-Based Solutions and Re-Naturing Cities’; European Commission: Brussels, Belgium, 2015; ISBN 978-92-79-46051-7. [Google Scholar] [CrossRef]
  26. United Nations—Economic and Social Council (UN-ESC). San Marino Declaration. In Proceedings of the Economic Commission for Europe Committee on Urban Development, Housing and Land Management. Eighty-Third Session, Geneva, Switzerland, 4–5 April 2022, (Part I); San Marino, Italiy, 3–6 October 2022, (Part II). Available online: https://unece.org/sites/default/files/2022-12/ECE_HBP_2022_2_REV-E.pdf (accessed on 24 January 2023).
  27. Li, N.; Chanb, D.; Mao, Q.; Hsu, K.; Fu, Z. Urban sustainability education: Challenges and pedagogical experiments. Habitat Int. 2018, 71, 70–80. [Google Scholar] [CrossRef]
  28. Neuman, M. Teaching collaborative and interdisciplinary service-based urban design and planning studios. J. Urban Des. 2016, 21, 596–615. [Google Scholar] [CrossRef]
  29. van den Dobbelsteen, A.; Martin, C.L.; Keeffe, G.; Pulselli, R.M.; Vandevyvere, H. From Problems to Potentials—The Urban Energy Transition of Gruž, Dubrovnik. Energies 2018, 11, 922. [Google Scholar] [CrossRef] [Green Version]
  30. Pulselli, R.M.; Broersma, S.; Martin, C.L.; Keeffe, G.; Bastianoni, S.; van den Dobbelsteen, A. Future City Visions. The Energy Transition Towards Carbon-Neutrality: Lessons learned from the case of Roeselare, Belgium. Renew. Sustain. Energy Rev. 2021, 137, 110612. [Google Scholar] [CrossRef]
  31. Schneekloth, L. Placemaking: The Art and Practice of Building Communities; John Wiley & Sons: Hoboken, NJ, USA, 1995; pp. 58–63. ISBN 978-0-471-11026-2. [Google Scholar]
  32. Hall, P. Good Cities, Better Lives: How Europe Discovered the Lost Art of Urbanism; Routledge: Abingdon, UK, 2013; pp. 278–280. [Google Scholar]
  33. Palazzo, A.L.; Barbieri, L.; D’Ascanio, R.; Di Pietrantonio, F.; Mondelli, F.P. (Eds.) In CLIMATE. Integrating Climate Resilience in EU Higher Education. Book of Proceedings. 2022. Available online: https://inclimate.eu/wp-content/uploads/2022/11/InCLIMATE_O6.pdf (accessed on 16 December 2022).
  34. Kleyer, M.; Kaule, G.; Settele, J. Landscape fragmentation and landscape planning, with a focus on Germany. In Species Survival in Fragmented Landscapes; Settele, J., Margules, C., Poschlod, P., Henle, K., Eds.; Kluwer Academic Publishers: Dordrecht, The Netherlands, 1996; pp. 138–151. [Google Scholar]
  35. Benedict, M.A.; McMahon, E.T. Green infrastructure: Smart conservation for the 21st century. Renew. Resour. J. 2002, 20, 12–17. [Google Scholar]
  36. Benedict, M.A.; McMahon, E.T. Green Infrastructure: Linking Landscapes and Communities; Island Press: Washington, DC, USA, 2006; ISBN 978-1-55963-558-5. [Google Scholar]
  37. Hansen, R.; Pauleit, S. From multifunctionality to multiple ecosystem services? A conceptual framework for multifunctionality in green infrastructure planning for urban areas. Ambio 2014, 43, 516–529. [Google Scholar] [CrossRef] [PubMed] [Green Version]
  38. Grădinaru, S.R.; Hersperger, A.M. Green infrastructure in strategic spatial plans: Evidence from European urban regions. Urban For. Urban Green. 2019, 40, 17–28. [Google Scholar] [CrossRef]
  39. Bartman, D.; Lydon, M.; Woudstra, R.; Khawarzad, A. Tactical Urbanism: Short-Term Action Long-Term Change; The Street Plans Collaborative: New York, NY, USA, 2011; Volume 1, Available online: https://issuu.com/streetplanscollaborative/docs/tactical_urbanism_vol.1 (accessed on 12 January 2023).
  40. Moreno, C.; Allam, Z.; Chabaud, D.; Gall, C.; Pratlong, F. Introducing the “15-Minute City”: Sustainability, Resilience and Place Identity in Future Post-Pandemic Cities. Smart Cities 2021, 4, 93–111. Available online: https://doi.org/10.3390/smartcities4010006 (accessed on 15 November 2022). [CrossRef]
  41. Council of Europe. European Landscape Convention; Signed at Florence on 20 October 2000; Council of Europe: Strasbourg, France, 2000; Available online: https://rm.coe.int/16807b6bc7 (accessed on 3 November 2022).
  42. Intergovernmental Panel on Climate Change (IPCC). Managing the risks of extreme events and disasters to advance climate change adaptation. In A Special Report of Working Groups I and II of the Intergovernmental Panel on Climate Change; Field, C.B., Barros, V., Stocker, T.F., Qin, D., Dokken, D.J., Ebi, K.L., Mastrandrea, M.D., Mach, K.J., Plattner, G.-K., Allen, S.K., et al., Eds.; Cambridge University Press: Cambridge, UK; New York, NY, USA, 2012; p. 582. Available online: https://www.ipcc.ch/report/managing-the-risks-of-extreme-events-and-disasters-to-advance-climate-change-adaptation/ (accessed on 12 October 2022).
  43. Intergovernmental Panel on Climate Change (IPCC). Summary for policymakers. In Climate Change 2014: Impacts, Adaptation, and Vulnerability; Part A: Global and Sectoral Aspects. Contribution of Working Group II to the Fifth Assessment Report of the Intergovernmental Panel on Climate Change; Field, C.B., Barros, V.R., Dokken, D.J., Mach, K.J., Mastrandrea, M.D., Bilir, T.E., Chatterjee, M., Ebi, K.L., Estrada, Y.O., Genova, R.C., et al., Eds.; Cambridge University Press: Cambridge, UK; New York, NY, USA, 2014; pp. 1–32. Available online: https://www.ipcc.ch/pdf/assessment-report/ar5/wg2/ar5_wgII_spm_en.pdf (accessed on 12 October 2022).
  44. Vargas, J.; Paneque, P. Methodology for the analysis of causes of drought vulnerability on the River Basin scale. Nat. Hazards 2017, 89, 609–621. [Google Scholar] [CrossRef]
  45. Vargas, J.; Paneque, P. Challenges for the integration between water resource management and drought risk management in Spain. Sustainability 2019, 11, 308. [Google Scholar] [CrossRef] [Green Version]
  46. Vargas, J.; Olcina, J.; Paneque, P. Cartografía de riesgo de inundación en la planificación territorial para la gestión del riesgo de desastre. Escalas de trabajo y estudios de casos en España. EURE Rev. Estud. Urbano Reg. 2022, 48, 144. [Google Scholar] [CrossRef]
  47. Martín, Y.; Paneque, P. Moving from adaptation capacities to implementing adaptation to extreme heat events in urban areas of the European Union: Introducing the U-ADAPT! research approach. J. Environ. Manag. 2022, 310, 114773. [Google Scholar] [CrossRef]
  48. Liu, X.; Wang, Y.; Peng, J.; Braimoh, A.; Yin, H. Assessing vulnerability to drought based on exposure, sensitivity and adaptive capacity: A case study in middle Inner Mongolia of China. Chin. Geogr. Sci. 2013, 23, 13–25. [Google Scholar] [CrossRef]
  49. Intergovernmental Panel on Climate Change (IPCC). 2006 IPCC Guidelines for National Greenhouse Gas Inventories, Prepared by the National Greenhouse Gas Inventories Programme; Eggleston, H.S., Buendia, L., Miwa, K., Ngara, T., Tanabe, K., Eds.; IGES: Hayama, Japan, 2006; Available online: https://www.ipcc-nggip.iges.or.jp/public/2006gl/ (accessed on 25 January 2023).
  50. Intergovernmental Panel on Climate Change (IPCC). 2019 Refinement to the 2006 IPCC Guidelines for National Greenhouse Gas Inventories; Calvo Buendia, E., Tanabe, K., Kranjc, A., Baasansuren, J., Fukuda, M., Ngarize, S., Osako, A., Pyrozhenko, Y., Shermanau, P., Federici, S., Eds.; IPCC: Geneva, Switzerland, 2019; Available online: https://www.ipcc-nggip.iges.or.jp/public/2019rf/index.html (accessed on 25 January 2023).
  51. Intergovernmental Panel on Climate Change (IPCC). Climate Change 2021: The Physical Science Basis. Contribution of Working Group I to the Sixth Assessment Report of the Intergovernmental Panel on Climate Change; Masson-Delmotte, V., Zhai, P., Pirani, A., Connors, S.L., Péan, C., Berger, S., Caud, N., Chen, Y., Goldfarb, L., Gomis, M.I., et al., Eds.; Cambridge University Press: Cambridge, UK; New York, NY, USA, 2021; p. 2391. [Google Scholar]
  52. Bastianoni, S.; Marchi, M.; Caro, D.; Casprini, P.; Pulselli, F.M. The connection between 2006 IPCC GHG inventory methodology and ISO 14064-1 certification standard—A reference point for the environmental policies at sub-national scale. Environ. Sci. Policy 2014, 44, 97–107. [Google Scholar] [CrossRef]
  53. Vaccari, F.P.; Gioli, B.; Toscano, P.; Perrone, C. Carbon dioxide balance assessment of the city of Florence (Italy), and implications for urban planning. Landsc. Urban Plan. 2013, 120, 138–146. [Google Scholar] [CrossRef]
  54. Marchi, M.; Pulselli, F.M.; Mangiavacchi, S.; Menghetti, F.; Marchettini, N.; Bastianoni, S. The greenhouse gas inventory as a tool for planning integrated waste management systems: A case study in central Italy. J. Clean. Prod. 2017, 142, 351–359. [Google Scholar] [CrossRef]
  55. Kusuma, M.N.; Handriyono, R.E.; Hafizah, N.E.; Damayanti, T.V. Absorption of Carbon Dioxide Emissions from Industrial and Residential Sources by Green Open Space in Sukorejo Village, Gresik. J. Ecol. Eng. 2023, 24, 135–145. [Google Scholar] [CrossRef]
  56. Marchi, M.; Niccolucci, V.; Pulselli, R.M.; Marchettini, N. Environmental policies for GHG emissions reduction and energy transition in the medieval historic centre of Siena (Italy): The role of solar energy. J. Clean. Prod. 2018, 185, 829–840. [Google Scholar] [CrossRef]
  57. Lai, S.; Lu, J.; Luo, X.; Ge, J. Carbon emission evaluation model and carbon reduction strategies for newly urbanized areas. Sustain. Prod. Consum. 2022, 31, 13–25. [Google Scholar] [CrossRef]
  58. Martin, C.L.; van den Dobbelsteen, A.; Keeffe, G. The Societal Impact Methodology—Connecting Citizens, Sustainability Awareness, Technological Interventions & Co-creative City Visions. In Proceedings of the International Conference on Passive and Low Energy, Edinburgh, UK, 3–5 July 2017; Volume II, pp. 2791–2798. [Google Scholar]
  59. Hannan, M.A.; Begun, R.A.; Al-Shetwi, A.Q.; Ker, P.J.; Al Mamun, M.A.; Hussain, A.; Basri, H.; Mahlia, T.M.I. Waste collection route optimisation model for linking cost saving and emission reduction to achieve sustainable development goals. Sustain. Cities Soc. 2020, 62, 102393. [Google Scholar] [CrossRef]
  60. Pulselli, R.M.; Marchi, M.; Neri, E.; Marchettini, N.; Bastianoni, S. Carbon accounting framework for decarbonisation of European city neighbourhoods. J. Clean. Prod. 2019, 208, 850–868. [Google Scholar] [CrossRef]
  61. Panagiotis, C.; Theodosiou, T.; Bikas, D. Embodied energy in residential buildings-towards the nearly zero energy building: A literature review. Build. Environ. 2016, 105, 267–282. [Google Scholar] [CrossRef]
  62. National Statistics Office (NSO). Malta GeoPortal—MALTA Classification at Local Administrative Unit (LAU), Level 1. Available online: https://msdi.data.gov.mt/geonetwork/srv/api/records/3609662c-41ef-4795-8394-7ff560563faa (accessed on 14 November 2022).
  63. Buccaro, A.; Robotti, C. Segni, Immagini e Storia dei Centri Costieri Euro-Mediterranei—Varianti Strategiche e Paesistiche; Federico II University Press: Naples, Italy, 2019; p. 208. ISBN 978-88-99930-04-2. Available online: https://core.ac.uk/download/pdf/286379207.pdf#page=69 (accessed on 8 November 2022).
  64. Jäger, T. The Art of Orthogonal Planning: Laparelli’s Trigonometric Design of Valletta. J. Soc. Archit. Historians. 2004, 63, 4–31. [Google Scholar] [CrossRef]
  65. United Nations Educational, Scientific and Cultural Organization (UNESCO). World Heritage List. UNESCO—World Heritage Convention. 2022. Available online: https://whc.unesco.org/en/list/ (accessed on 8 November 2022).
  66. Valletta Cultural Agency (VCA). About the Valletta Design Cluster. Available online: https://www.vca.gov.mt/en/valletta-design-cluster/ (accessed on 16 November 2022).
  67. Pulselli, R.M.; Maccanti, M.; Bruno, M.; Sabbetta, A.; Neri, E.; Patrizi, N.; Bastianoni, S. Benchmarking marine energy technologies through LCA: Offshore floating wind farms in the Mediterranean. Front. Energy Res. 2022, 10, 902021. [Google Scholar] [CrossRef]
  68. Franzitta, V.; Curto, D.; Milone, D.; Rao, D. Assessment of Renewable Sources for the Energy Consumption in Malta in the Mediterranean Sea. Energies 2016, 9, 1034. [Google Scholar] [CrossRef] [Green Version]
  69. Sibilla, M. A meaningful mapping approach for the complex design. Int. J. Des. Sci. Technol. 2016, 23, 41–78. [Google Scholar]
  70. Sibilla, M.; Kurul, E. Exploring transformative pedagogies for built environment disciplines: The case of interdisciplinarity in low carbon transition. Build. Res. Inf. 2021, 49, 234–247. [Google Scholar] [CrossRef]
Figure 1. Structure of the CITY MINDED workshops.
Sustainability 15 05807 g001
Figure 2. Methodological framework. Authors’ elaboration.
Sustainability 15 05807 g002
Figure 3. The map shows the City of Valletta, the Southern Harbour District, and the Northern Harbour District. Authors’ elaboration.
Sustainability 15 05807 g003
Figure 4. (a) Map of the analysis conducted by Group 1; (b) Map of the strategy planned by Group 1. Authors’ elaboration based on students’ sketches.
Sustainability 15 05807 g004
Figure 5. Map of the analysis conducted by Group 2. Authors’ elaboration based on students’ sketches.
Sustainability 15 05807 g005
Figure 6. Map of the strategy planned by Group 2. Authors’ elaboration based on students’ sketches.
Sustainability 15 05807 g006
Figure 7. Group 1 results, referred to District 1 (i.e., Southern Harbour District).
Sustainability 15 05807 g007
Figure 8. Group 2 results, referred to District 2 (i.e., Northern Harbour District).
Sustainability 15 05807 g008
Figure 9. The Vulnerability Structure Triangle with results for Group 1 and Group 2.
Sustainability 15 05807 g009
Figure 10. Scaled representation of the EVF that would be required to absorb gas emissions from the City of Valletta. Each colour in the legend represents an emission source. The icons on the left summarise and allow an immediate understanding of the sector to which the coloured squares refer.
Sustainability 15 05807 g010
Figure 11. Carbon Footprint mitigation scenario for City of Valletta.
Sustainability 15 05807 g011
Figure 12. The Valletta Design Cluster, chosen as a case study by Group 1.
Sustainability 15 05807 g012
Figure 13. Buildings block in Triq San Duminku, chosen as a case study by Group 2.
Sustainability 15 05807 g013
Table 1. Areas of study considered for the application of the four modules of the methodology by the two working groups.
ModuleGroup 1
Area of study
Group 2
Area of study
Placemaking Framework
(UNIROMA3)
City of VallettaCity of Valletta
Vulnerability Assessment (UPO)Southern Harbour District
(District 1)
Northern Harbour District
(District 2)
Carbon Accounting (UNISI)City of VallettaCity of Valletta
Energy Efficiency (IRENA and MIEMA)Valletta Design Cluster (VDC)Building stock near the VDC
Table 2. List of strengths and weaknesses of Valletta, highlighted by Group 1 and Group 2.
Results of the Analysis
Group 1Group 2
Strengths
Presence of seaside and sea resources;
Involvement of locals in activities;
No extreme weather;
Employment opportunities.
Valletta:
Ventilated place;
Walkable city due to its small extension;
Presence of the shadow along the streets in the morning and in the afternoon;
Easy orientation for pedestrians;
Presence of many heritage buildings;
Surroundings:
Presence of many green spaces;
Good connection between neighbourhoods and towards airport;
Not isolated place.
Weaknesses
Lack of green areas;
No speed limit respected for cars by drivers;
City centre crowded with cars and occupied sidewalks;
Less amount of green public transport;
Tourism damage;
Lack of proper waste management system;
Not well-maintained buildings.
Valletta:
Presence of only one access to the city centre;
Lack of green areas;
Small shared places between cars and pedestrians;
Space dedicated to cars larger than to pedestrians;
Inhomogeneous solar exposure;
Lack of shadow in central hours of the day;
Few groceries for local people;
Lack of bicycle use;
Presence of steep streets and stairways without any adaptation for people with reduced mobility;
Scarce presence of waste bins and bins for separate collection;
Poor integration between heritage buildings and green spaces;
Presence of misused spaces;
Lack of public fountains;
Gentrification phenomena.
Surroundings:
Unconnected green spaces;
Lack of spaces dedicated for pedestrians;
Presence of buildings with heights that are too different from each other;
Presence of visual and air pollution due to large cruise ships.
Table 3. Objectives and activities defined by the two working groups.
Definition of the Strategy
Group 1Group 2
Objectives
Improvement of the accessibility of the streets;
Improvement of sustainable tourism practices;
Improvement of healthy living and a good environment;
Improvement of sustainable waste management system.
Improvement of green infrastructure within the city;
Definition of pedestrian safe corridors;
Creation of landmarks, for example, using a different type of tree to better identify roads, make them more recognisable, and immediately identifiable, based on the type of tree used for street trees.
Activities
Design of rooftop gardens, vertical gardens and parks;
Implementation of recycling station and encouragement of reuse and recycle;
Limitation of access to the centre by cars, except
for emergencies and deliveries to shops;
Decentralisation of points of interest;
Energy efficiency of buildings (e.g., photovoltaic panels).
Subdivision of Valletta city centre into pedestrianised sectors in order to remove cars from the city centre and allowing cars to only use outer roads;
Increased planting of trees along roads that may also act as reference points;
Improved accessibility to the sea and beaches;
Fostering the accessibility of the city to at least three entrances;
Definition of speed limitation in the city centre;
Creation of a mobility ring for cars that runs along the shores of the Valletta peninsula, keeping the central area of the city for pedestrians or traffic-restricted;
Installation of water fountains;
Use of parking places as PV surfaces (building in existing areas).
Table 4. Carbon Footprint and Equivalent Virtual Forestland (EVF) for the City of Valletta. The CF for an average Valletta household and for a single Beltin are also shown.
Emission SourcesCF
Valletta
%EVFCF Valletta HouseholdCF
Beltin
t CO2eqhat CO2eq·unit−1t CO2eq·unit−1
1—ELECTRICITY868329%6434.251.48
Industrial sector22397%1661.100.38
Residential sector353512%2621.730.60
Transport850.3%60.040.01
Tertiary sector25188%1871.230.43
Agriculture sector3051%230.150.05
2—FUELS CONSUMPTION10,13733%7514.971.73
Industry sector312310%2311.530.53
Commercial and public services653522%4843.201.12
Households 4792%350.230.08
of which Water heating123/90.060.02
of which Cooking72/50.040.01
of which Air conditioning59/40.030.01
of which Electrical appliances and lighting133/100.070.02
of which Space heating per dwelling92/70.050.02
3—MOBILITY685023%5083.361.17
of which Cars4165/3092.040.71
of which Bus651/480.320.11
of which Motorcycles62/50.030.01
of which Trucks and light vehicles1582/1170.780.27
of which Water (ships and ferries)370/270.180.06
of which Local airport (private airplanes)21/20.010.004
4—WASTE442315%3282.170.75
5—WATER2770.9%210.140.05
SUBTOTAL (sum 1 + 2 + 3 + 4 + 5)30,370100%225014.885.18
FOOD protein diet11,273/8355.521.92
FOOD balanced diet7312/5423.581.25
FOOD balanced diet + local food4265/3162.090.73
TOTAL (sum 1 + 2 + 3 + 4 + 5) + Food protein diet41,643/308520.417.11
CURRENT UPTAKE−40.01%///
Table 5. Mitigation measures selected by the two working groups.
Mitigation Measures Selected
Group 1Group 2
Set of Measures: Energy Saving in Buildings
Implementation of LED lights and improvement of appliance efficiency (residential and tertiary sector);
Maintenance and periodic checks of boilers to reduce energy waste;
Implementation of nature-based solutions (such as tree planting, green areas, urban gardens, etc.) to reduce the Urban Heat Island Effect (UHIE);
Improvement of thermal insulation to prevent heat loss in residential buildings;
Application of Life Cycle Assessment and a circular economy to mitigate the use of electricity and fuel in the industry sector;
Restoration of buildings downtown.
Installation of LED systems and efficiency enhancement of cooling and heating systems;
Improvement of boiler efficiency;
Implementation of nature-based solutions to reduce the Urban Heat Island Effect (UHIE);
Fostering the thermal insulation.
Set of Measures: Energy Generation from Renewable Sources
Installation of PV panels on parking lots and rooftops of public buildings (Triq il-Mall Floriana area) Estimated area: 35,517 m2;
Implementation of onshore wind turbine in the industrial areas close to the City of Valletta;
Installation of heat pump to reduce residential consumption of gas for heating and boiling water;
Implementation of floating wind turbines to completely cover the energy need in the residential and tertiary sectors;
Implementation of Wave Energy Converters (WECs) to provide an alternative energy source.
Implementation of PV panels on 30% of the rooftop of every building (south-facing roof). Estimated area: 44,315.4 m2;
Implementation of small wind turbines on the rooftop of the building. Estimated that at least 2541 small turbines are required;
Installation of 32 floating wind turbines (raft–buoy model). The location of the wind farm has been assumed to be in an area northwest of the island of Gozo.
Set of Measures: Sustainable Mobility
Implementation of public spaces and new green paths;
Use of bikes to contain car circulation;
Creation of soft mobility connections;
Encouragement of the use of Public Transport (PT) and electric vehicles;
Fostering smart working to avoid the use of cars or PT (creation of co-working hubs).
Creation of green paths to connect heritage buildings and the neighbourhoods surrounding the downtown;
Improvement of the walkability of the city centre;
Limitation of city access by car only for inhabitants;
Creation of a mobility ring for cars that runs along the shores of the Valletta peninsula, keeping the central area of the city pedestrian or traffic-restricted;
Imposition of a car speed limitation on the ring, also using the help of elevated streets;
Reduction of car lanes and implementation of a pedestrian street;
Implementation of bikes, public transport, smart working, and electric mobility.
Set of Measures: Waste Management
Encouragement of less waste production to reduce waste storage in landfill;
Encouragement of recycling (today, only 10% of total waste is recycled) in four steps to be implemented in the short-to-medium-term. First step: 20%; second step: 40%; third step: 60%; final step: 80%.
Improvement of waste management system (less waste production, more recycling).
Set of Measures: Sustainable Food
Promotion of a balanced diet to limit meat consumption;
Promote local food consumption to reduce pollution related to imports and exports;
Gradual introduction of edible insects or insect products in the diet (e.g., flours, pasta, bread, snacks, fitness bar, etc.).
Implementation of a more balanced diet with the purchase of more local products.
Table 6. CF reduction based on the mitigation measures hypothesised by the two working groups.
nMitigation MeasureCF ReductionCF Residual
t CO2eqt CO2eq
0 Current status-41,643
1 Reduction of energy consumption (LED lamps and more efficient appliances)−85440,788
2 Life Cycle Assessment and circular economy in industrial sector−105039,739
3 Increased use of bicycles and less waste production−216637,572
4 Adoption of balanced diet−394533,627
5 Nature-based solutions and thermal insulation−103032,597
6 Smart working−82231,775
7 More waste recycling and composting and less water consumption and grid losses−163730,138
8 Use of local food−366426,474
9 PV panels (south-exposed roofs)−122925,246
10 Onshore wind turbines−547119,775
11 Public transport−93218,844
12 More waste recycling −174117,103
13 PV panels (north-facing roofs)−61516,488
14 Heat pumps and electric mobility−72599229
15 Floating wind turbines and Wave Energy Converters−8723506
16 Creation of new forests—carbon uptake−5060
Table 7. Energy efficiency measures proposed by the two working groups.
Energy Efficiency Measures
Group 1Group 2
Current situation of the building/area (including measures already implemented for energy efficiency and renewable energy)
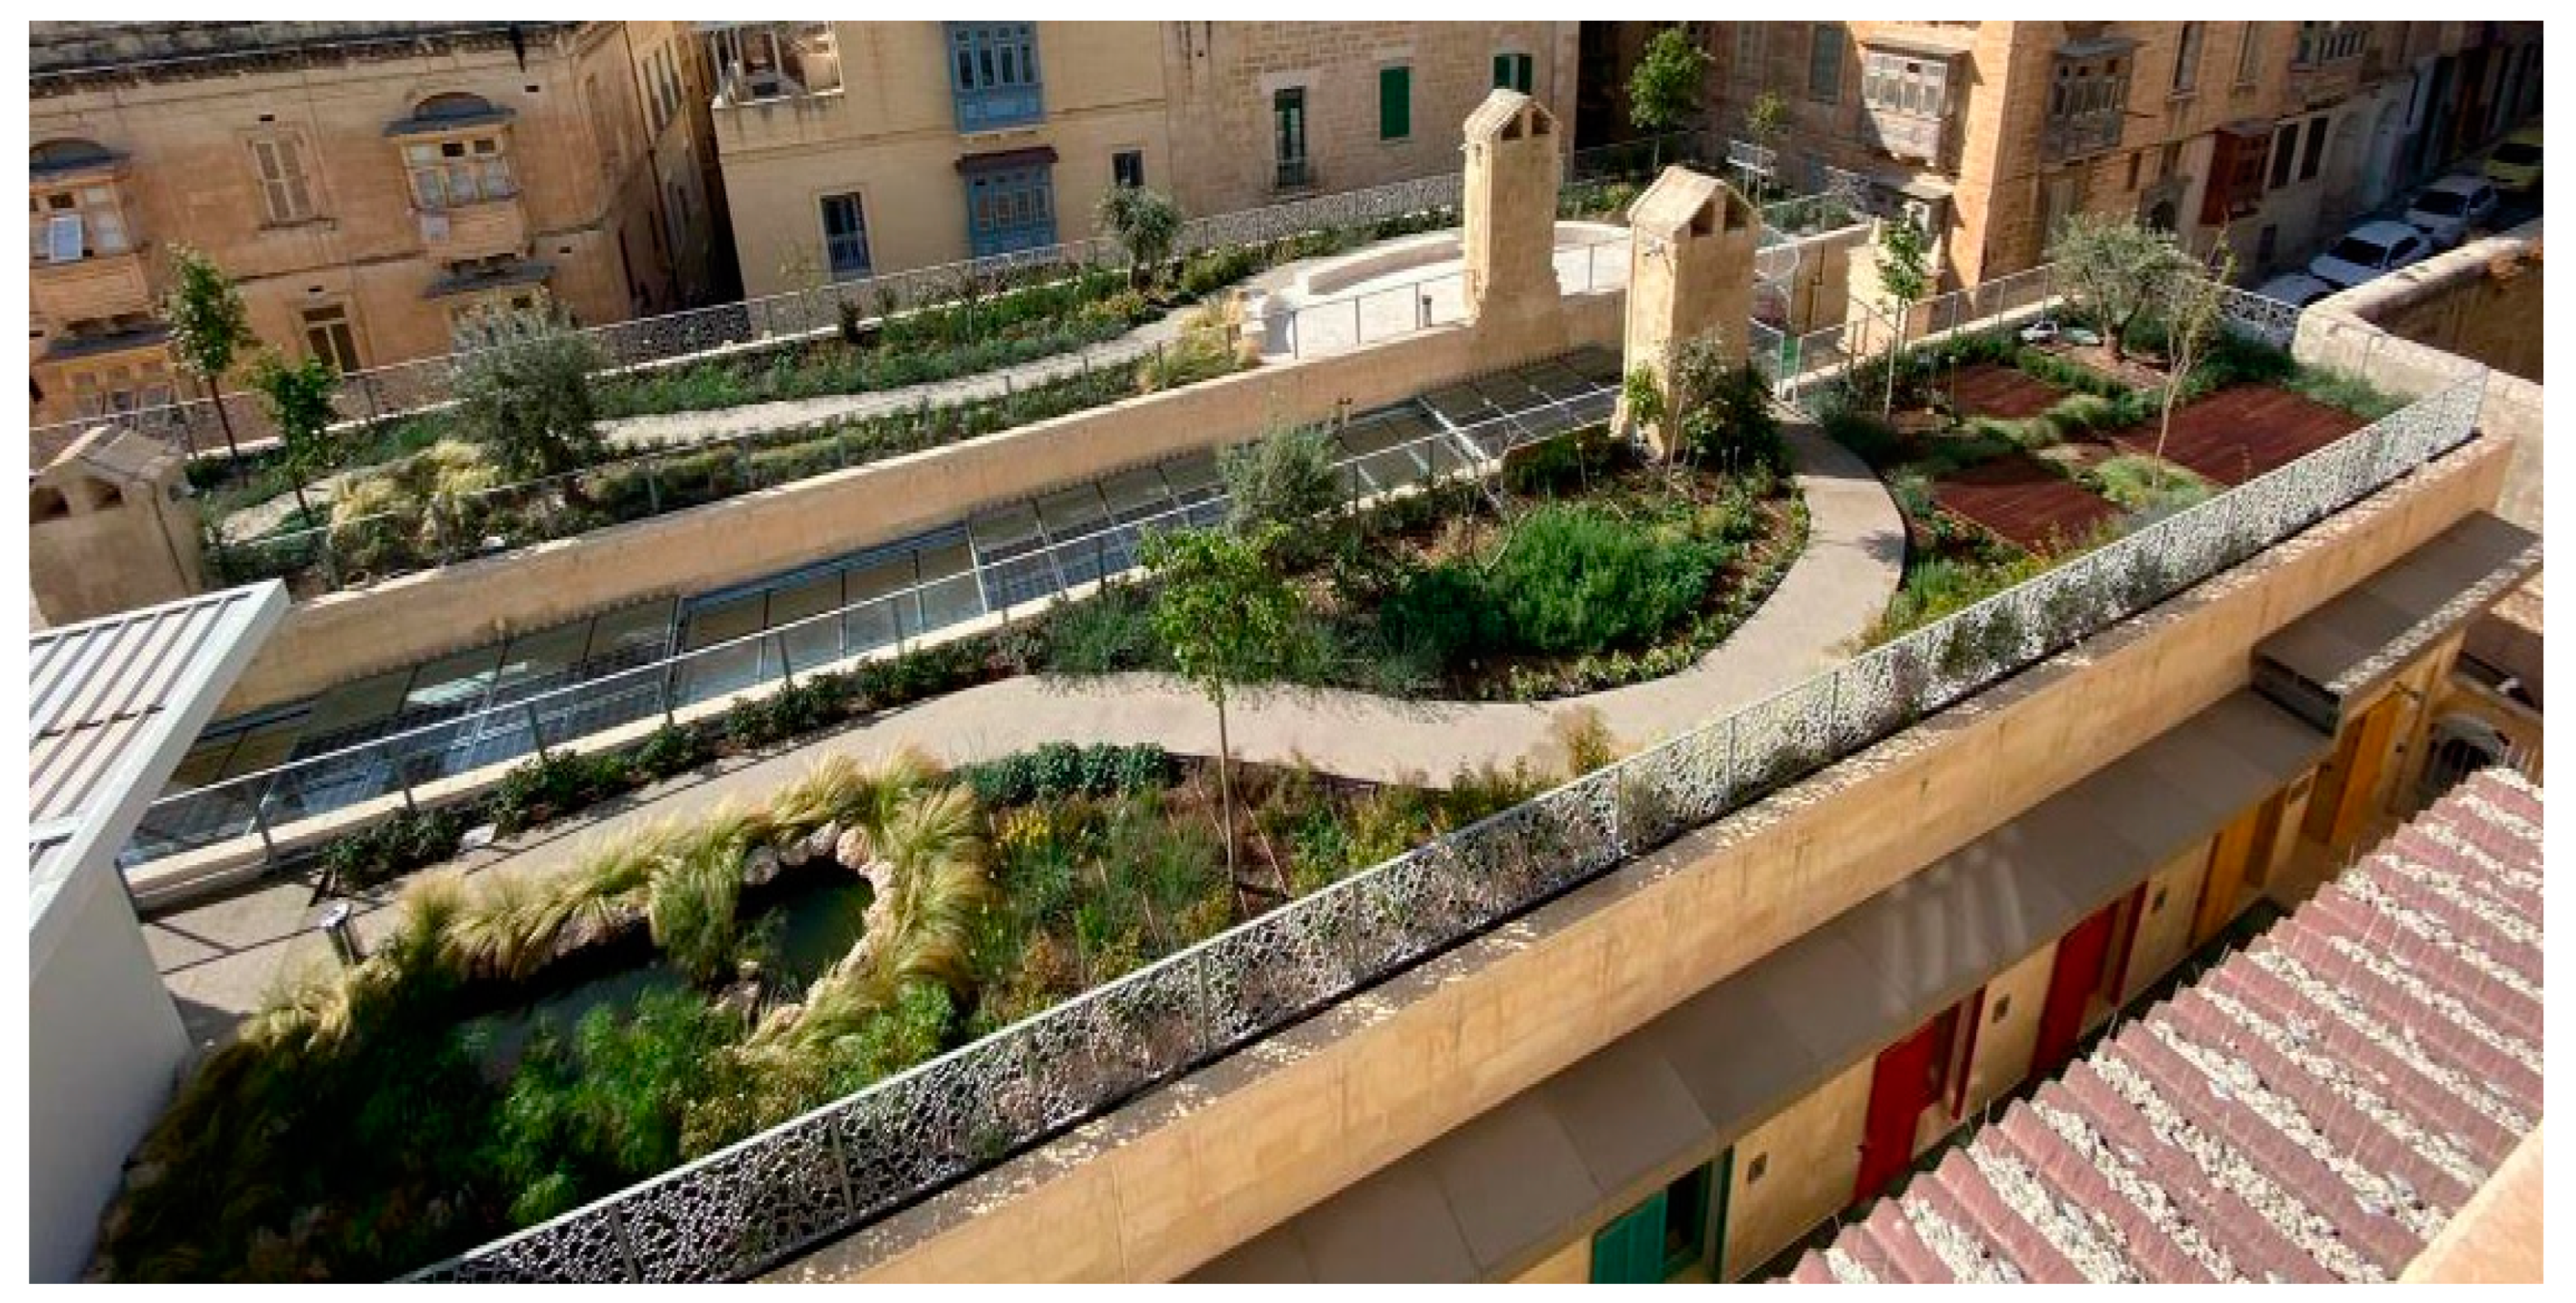
The building was recently renovated;
Presence of a rooftop garden;
Presence of a green wall within the main courtyard;
Presence of glass PV panels;
External utility equipment for easier maintenance;
Optimal use of natural light (glass walkways);
Efficient use of space (modular rooms + external corridor);
Use of sustainable materials (wood and steel);
Use of LED lighting;
Restoration of the existing cisterns.
Non-renovated residential block with low energy performance;
No insulation (walls, roof);
Presence of single-glazed windows;
Insufficient water flow and pressure for domestic users;
No cross ventilation;
Low protection from sun on southeast façade;
Motion detectors for lighting in common areas work during the day when daylight is sufficient.
Energy Efficiency and RES Proposals
Increase in the number of PV panels;
Installation of movable PV canopy to increase the efficiency of solar retention;
Installation of sensors for lighting and water taps in the building;
Decrease of the air-conditioning temperature;
Installation of shading devices on roof garden to improve usability during summer;
Improvement of air circulation/ventilation to reduce greenhouse effect;
Improvement of accessibility for persons with reduced mobility;
Provision of a key map of the building.
Replacement of small electric appliances with more efficient models;
Installation of shared washing machines + common roof area with clothing lines;
Implementation of a new waterproof roof;
Installation of shutters on the southeast façade to provide shading;
Installation of new glass and doors insulation;
Implementation of insulation of the façade;
Installation of a water pump;
Restoration of the cistern to use water for irrigation and secondary class water use.
Barriers and Mitigation Measures
Lack of maintenance schedules: establish preventive maintenance plans and regular checks for PV, rooftop garden and service, HVAC equipment and lighting;
Conservation rules for historical buildings: allow more flexibility for energy interventions and restoration;
Energy-intensive proposals risk requiring more energy than is currently produced and used: apply a Life Cycle Assessment approach.
Setting up a building community and create a common chill-out area covered with glass PV for recreational activities;
Lack of common space: renovate rooftop common areas to create a shared laundry and a space for air drying clothes; Provide a space and tools for a communal urban garden and use compost;
Strict heritage regulations: use a concealed area on the roof to install equipment that has a negative visual impact from street level and from other buildings;
Accessibility: install a common wooden ramp to avoid steps leading to the entrance of the block; adapt stairs and access from street to the roof for people with reduced mobility.
Disclaimer/Publisher’s Note: The statements, opinions and data contained in all publications are solely those of the individual author(s) and contributor(s) and not of MDPI and/or the editor(s). MDPI and/or the editor(s) disclaim responsibility for any injury to people or property resulting from any ideas, methods, instructions or products referred to in the content.

