1. Introduction
Within cities, the development of mass transit is key to driving decarbonization. Bus transits are the main form of urban mass transportation, with buses as the means of transportation and urban road networks as the operating space. Compared with urban rail transit, bus transit is widely used in almost all large, medium, and small cities. Specifically, the development of bus transit has the following significance in promoting the realization of goals such as “carbon neutrality” and “emission peaks”: (1) Reducing urban ground traffic congestion. Due to the rapid increase in car ownership, urban traffic congestion has become a common problem that is faced by almost all major cities in China. Compared with car traffic, bus transis have the advantage of a higher single-vehicle capacity. Therefore, under the premise of fully utilizing its transport capacity, bus transits have the advantage of low road resource occupancy. Improving the function of bus transit is an effective way to alleviate the pressure of motor vehicle traffic [
1,
2]. (2) Improving the energy utilization efficiency of urban transportation. Bus transits have obvious advantages in reducing energy consumption and improving energy efficiency. According to the research of Lin Boqiang et al. (2018) on the road bus operation data of 36 cities in China from 2010 to 2015, the improvement in urban bus efficiency could effectively restrain the growth of vehicle energy consumption [
3]. (3) Improving the utilization efficiency of urban space resources. Asian cities, including Chinese cities, generally have the characteristics of high population concentration and high-density development of land resource development and utilization. Urban transportation is an important basis for the smooth development of commuting, business exchanges, leisure, and entertainment activities between different areas of the city. Due to their characteristics and advantages, bus transit can not only improve the utilization efficiency of space resources in traffic behavior but also improve the utilization efficiency of space resources in urban residences, as well as areas of employment, commerce, leisure, and other functions. (4) Increasing the population coverage of green transportation services. The cost of bus transit is low, and it is a mass transportation service that can be generally afforded by most urban residents. Bus transits have the advantages of high station density, flexible route arrangement, and high adaptability to operating methods. The physical built space on which its operation depends only requires urban roads, so it can be used inside residential, commercial, leisure and other areas. It is an important mode of transportation to solve the “last mile” service of travel. (5) Promoting the development of green and low-carbon communities. Some cities, including cities in Europe, North America, East Asia, and other regions, have already started the construction practice of a “zero carbon community.” The organic synergy between energy, the environment, and the economy is the key to promoting carbon reduction [
4,
5,
6]. At present, Chinese cities are vigorously promoting the replacement of bus transit vehicles from fuel vehicles to new energy vehicles. At the same time, combined with the intelligent transformation of bus transit facilities, the matching accuracy between the supply of bus transit services and community demand can be improved; this cloud effectively reduces energy waste and promotes the development of low-carbon communities.
In this article, the term ‘bus transits’ refers to buses that operate on the urban road network but do not include bus rapid transit (BRT) systems with an exclusive right-of-way or tramways that are restricted to the tracks. As the physical space supporting the operation of bus transits, the structural characteristics of the urban road network play a decisive role in its development. The route network and station layout of conventional bus transits must rely on the urban road network for layout planning, and vehicles can only drive on urban road spaces. Therefore, the conditions for establishing a suitable road network are the prerequisites for the effective operating of bus transit lines [
7]. In the field of urban road network research, the academic community of urban and transportation planning has paid more and more attention to the key influence of urban road network structures on bus transits that have been operation in recent years. The urban road network structure affects the layout and operation of bus transits from the aspects of road grade, road network density, and road network topology [
7,
8,
9,
10]. Chen Xiaohong et al. (2007) summarized the general methods of road network planning on the basis of reviewing foreign bus-oriented road network planning methods and introduced the case of bus-oriented road network planning in the Shanghai Lingang New Town area [
11]. Gong Fu et al. (2010) analyzed in detail the impact and constraints of bus networks on the form of the urban road network with an example of a city [
12]. Li Xing et al. (2010) analyzed the relationship between bus line classification and urban road classification [
13]. Shi Fei (2015) discussed the correlation between road width, road network density, and travel mode choice behavior, and provided a relevant basis for transit-oriented road network planning [
14]. In the field of practice, the technical standards in the field of urban road traffic in China have also provided guidance on the relationship between road conditions and bus lines. Urban master planning also pays special attention to the important supporting function of road network construction conditions for bus transits. The “Shanghai Master Plan (2017–2035)” proposes an improvement in the service function of arterial roads to enhance the service capacity of inter-regional bus transits; gradually optimize the allocation of road rights to establish bus-only lanes; increase the density of the road network; strengthen the use of public passage spaces to improve the accessibility of slow traffic; and the flexibility of road network organizations [
15].
Based on the above discussion, this paper conducted research on the evaluation and application of low-carbon-oriented urban road network structures. On the basis of the existing research, the evaluation method of low-carbon friendliness based on the quantitative research of the topological structure of road networks is discussed, and the urban road network structure in the central urban area of Shanghai was selected as an actual case for analysis and research, while corresponding optimization suggestions are put forward.
2. Evaluation Method Based on Quantitative Research of Road Network Topological Structures
2.1. Basis of the Proposed Method
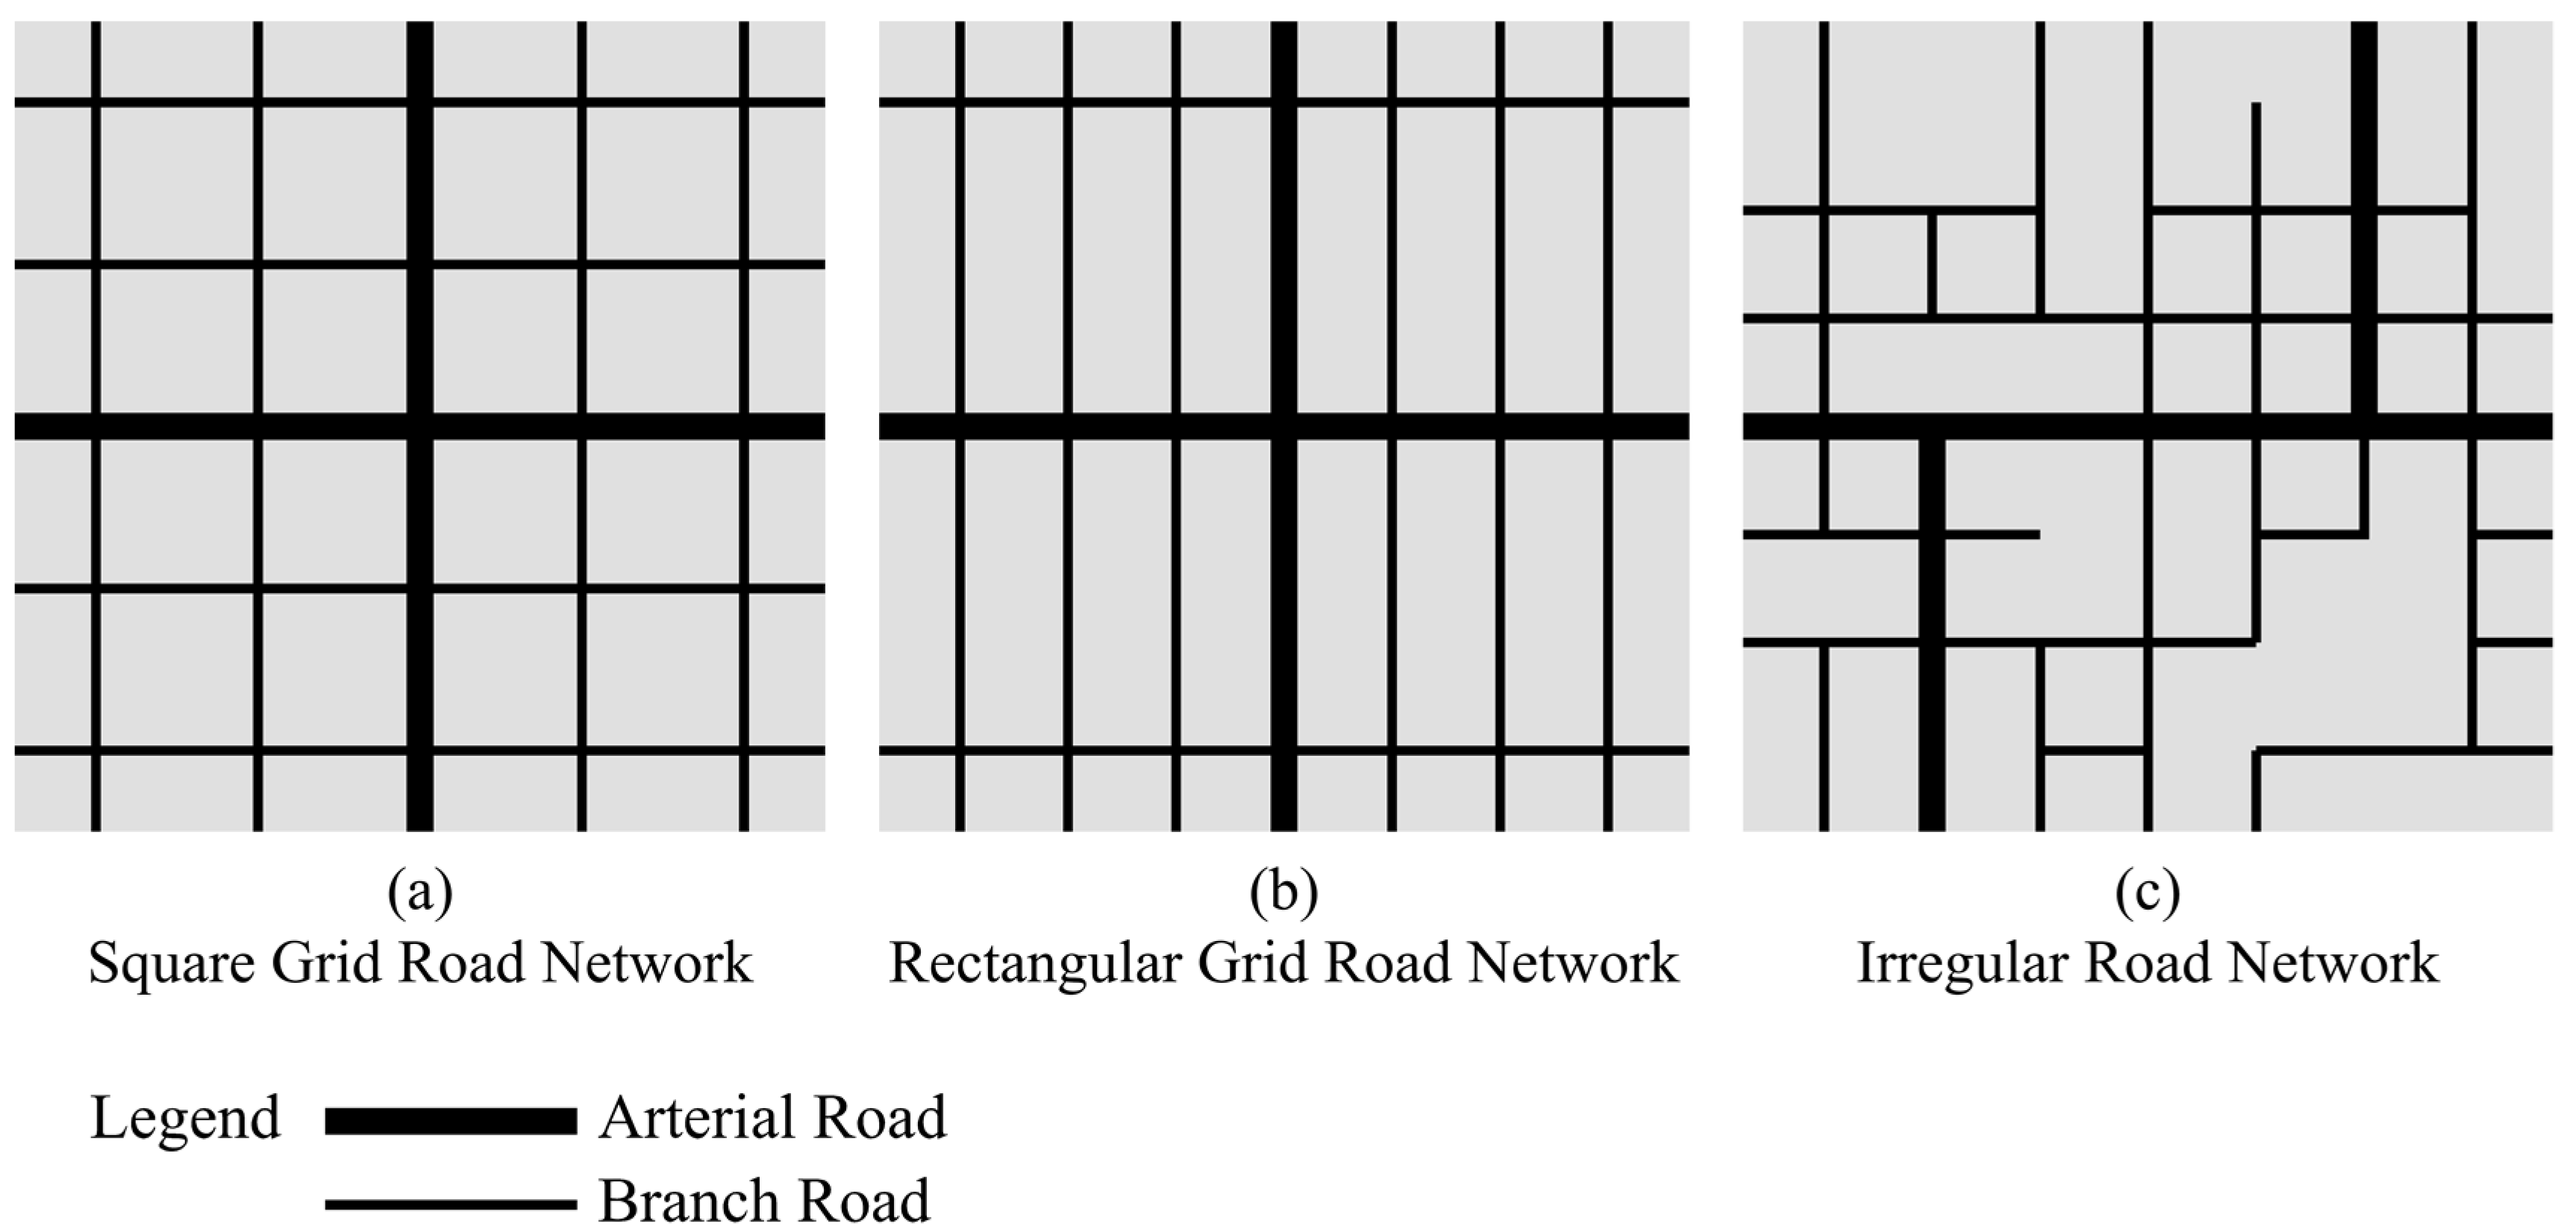
The quantitative research on urban road networks mainly includes the attributes of three aspects of road networks: road grade, road network density, and road network topology [
7,
16,
17]. Among them, the topological structure feature is an important attribute that affects the morphological characteristics of the road network and is also a key attribute that affects the use effect of the urban road network structure. For an area of the same scale, even if the length ratio of road sections for each grade is the same and the overall road network density is the same, the difference in road network topology has an important impact on the function of the road network (
Figure 1).
Many scholars have realized the importance of road network topological structure characteristics for the development of green transportation, including bus transits, in related research, and have tried to evaluate these characteristics in a quantitative way. Zhang (2004) analyzed the survey data in Boston and Hong Kong and believed that improving the connectivity of road network topology would help increase green traffic behavior [
18]. Through data analysis, Cervero et al. (2008) believed that improving the connectivity of the road network in residential areas would help increase the proportion of bus transits [
19]. Ewing et al. (2010) believed that increasing the connectivity of the road network would be conducive to increasing the route choices of bus transit users [
20]. Based on the statistical analysis of the road network and bus data, Xiong Peng (2015) found that the length of a single direct route in the road network structure had a direct impact on the suitability of bus transits [
21]. Ye Pengyao et al. (2012) proposed an index for the structural agglomeration of the road network to evaluate the overall characteristics of the topological shape of the road network and found that there was a positive correlation between this index and the density of the bus network through empirical analysis in the Shanghai Pudong New Area [
10].
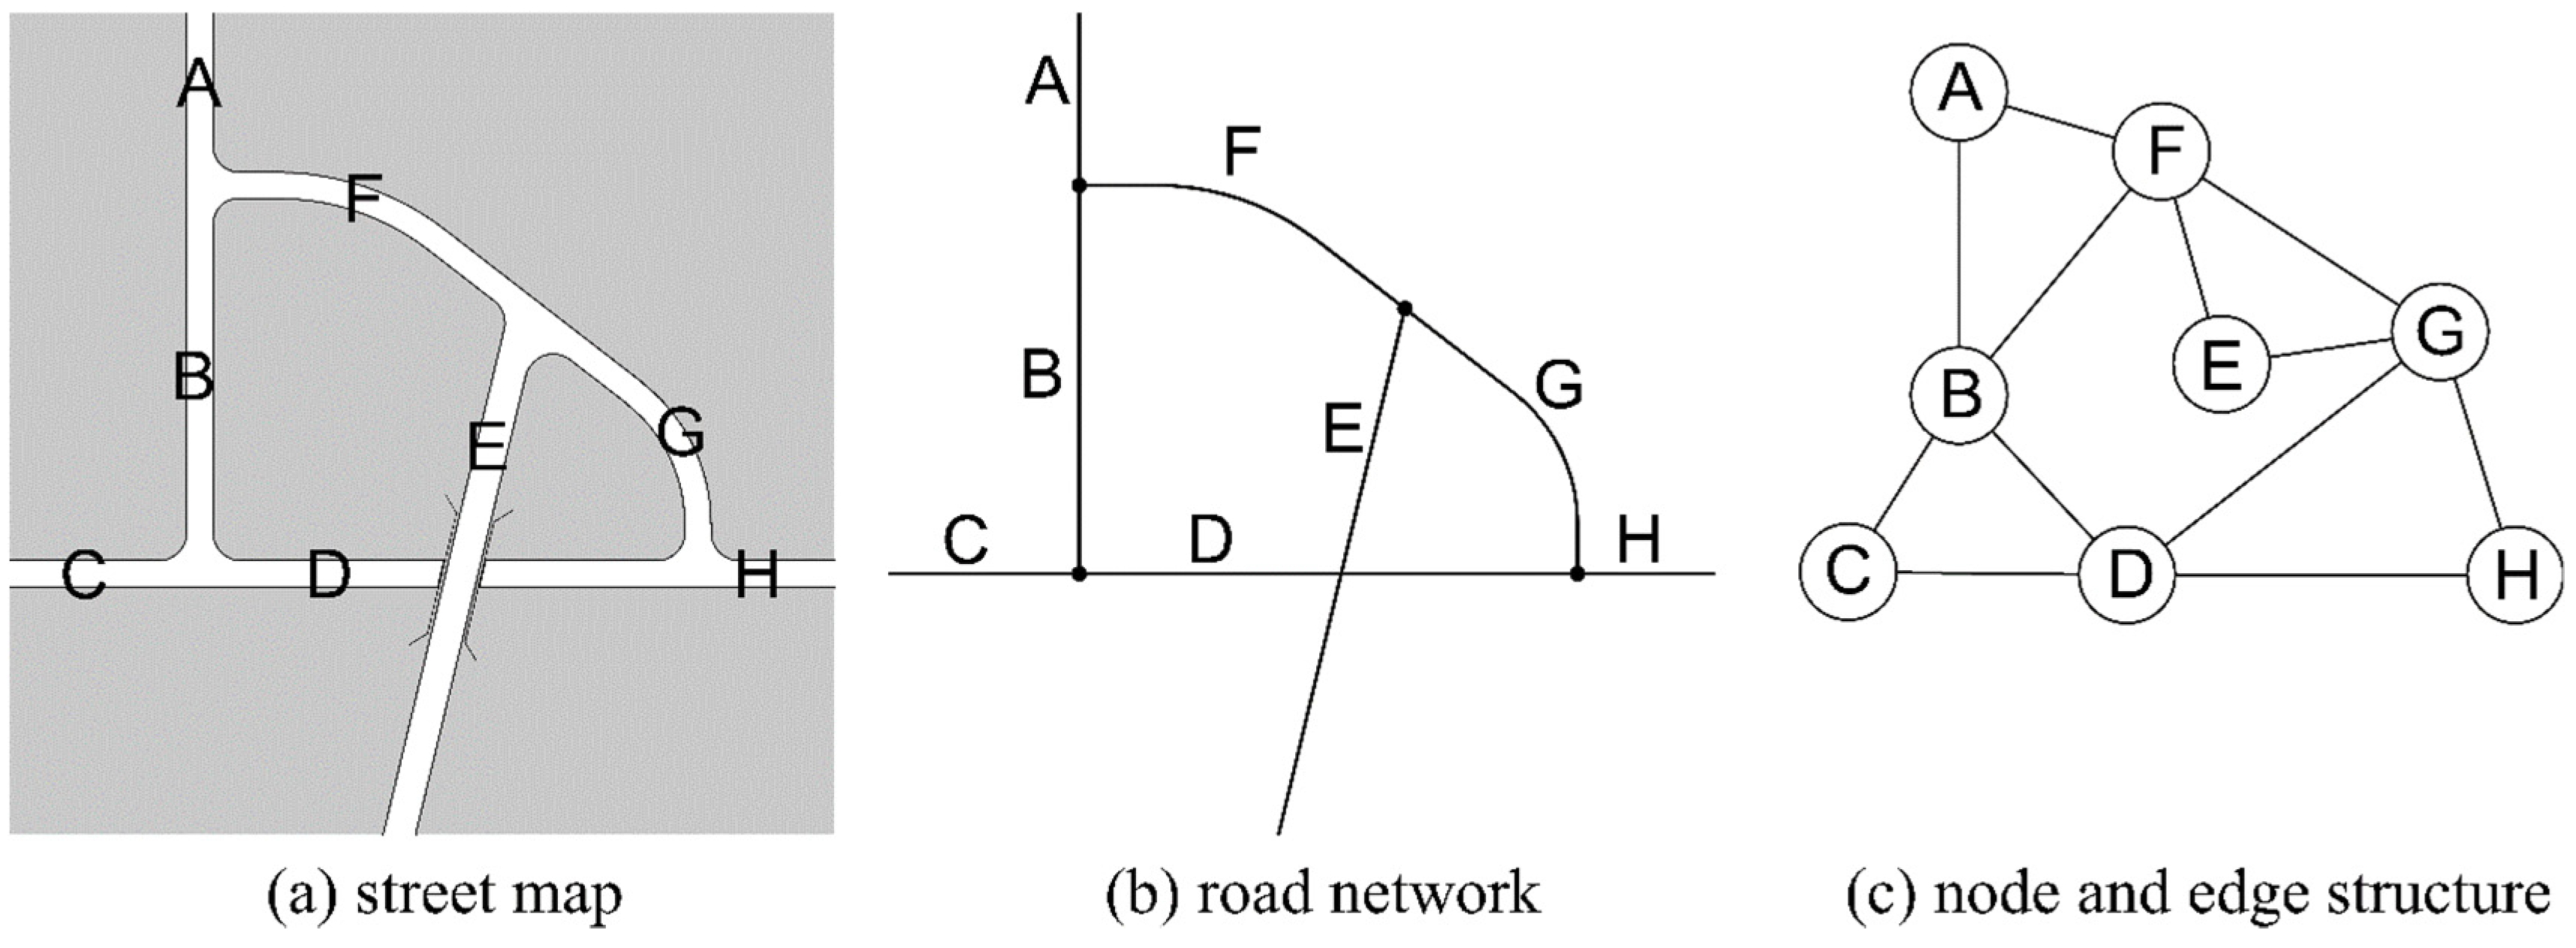
Chen Chen (2022) abstracted the topology of the urban road network structure based on the idea of social network analysis, abstracting the road sections as “nodes” and abstracted the connection methods (intersections) between the road sections as “edges” (
Figure 2); the betweenness index was chosen to evaluate the centrality of the road section in this work and a strong linear was observed between the betweenness index and the layout of the bus line under a certain search distance [
7]. That is, the higher the betweenness index of the road section, the more bus lines there were on the section.
The betweenness index calculation mentioned above is based on the method proposed by Freeman, which means that the shortest path between any two nodes within a certain range can pass through a certain node [
22,
23,
24]. The higher the value, the higher the importance of the node in the network. The calculation method of the betweenness index
is shown below [
22].
is the betweenness of node k; n is the total number of nodes; is the possibility of node k on the shortest path between node i and node j; is the number of shortest paths between node i and node j; is the number of times that node k passes the shortest path between node i and node j.
is the absolute value of the betweenness index, which usually increases exponentially with the increase in the network node size. Freeman also proposed the concept of the relative value of the betweenness index, which is convenient for comparing the relative importance of nodes in the entire network in different scale networks and avoids the numerical exponential growth that is caused by the growth of network node scale [
22].
By limiting the search radius, the betweenness index can be calculated within a specified range in the road network. A search radius value of about 8 km can be used as a recommended parameter for the suitability analysis of the road network topology in megacities [
7,
16].
On the basis of the existing research, an evaluation method for the low-carbon friendliness of the road network structure was further proposed. It has been explained above that the higher the betweenness index, the more bus lines there are on the road section. Then, it can be considered that the betweenness index has a significant impact on the development of the bus transits. Improving the betweenness index of road sections in the road network is conducive to improving the low-carbon friendliness of the region. Therefore, how to propose a quantitative evaluation method on the basis of the existing research in order to identify the low-carbon friendliness of road network structures in different areas of the city is the focus of method research.
2.2. Process and Steps
Prior to data calculation, it is necessary to verify the accuracy of the road network data topology. Using the ArcGIS platform, particular attention should be paid to rectifying the following topological structure errors: (1) dangle-nodes caused by incomplete connections between road segments; (2) pseudo-nodes resulting from the division of a road segment into multiple polylines; (3) redundant polylines arising from the erroneous extension of road segment data at intersections; and (4) redundant intersections generated by the improper interruption and intersection of two non-contiguous road segments (
Table 1).
2.2.1. Calculating the Betweenness Value of Each Road Section in the Road Network
The sDNA tool proposed by Chiaradia et al. (2015) was used for calculation. The betweenness calculation method is based on the method of Freeman (1977) and has some detailed adjustments [
22,
25,
26]. The calculation methods of the betweenness index
and the relative value index
are shown in the following formulas [
25,
26].
N is the set of all road sections in the space; Ry is the set of road sections within a specified radius with the road section y as the center in space, and a radius of 8 km was selected for subsequent empirical analysis; P(z) is the proportion of road section z within the above radius range; refers to the number of road sections within the radius of any road section y as the center.
The calculation method proposed by Chiaradia et al. (2015) can introduce the weight of OD road sections, and the calculation method of
with length-weight is as follows [
25,
26]:
is the length of the road section z; is the sum of the lengths of road sections within the radius of any y road section as the center.
2.2.2. Calculating the Spatial Density Value of the Index
Further, for any point p in space, based on the relative betweenness index
introduced with the length-weight, the density value
of the betweenness index of the link in the walkable area can be calculated.
refers to the set of road sections involved in the space with point p as the center and radius r, where the radius r is 500 m for analysis; is the relative betweenness index value of the i-th road section; is the length of the i-th road section; is the ratio of the length of the i-th road segment in the area with p as the center and r as the radius to the total length.
2.2.3. Calculating the Value of Sub-District Area Based on the Index
The third step is to map the
data to the inner-city spatial unit, and calculate the average value
of
inside the regional unit
P. Generally speaking, it is necessary to calculate the
results of the sampling points when uniformly distributed in the total range of the study area in the previous step. The higher the
in an area, the higher the suitability for bus transits.
is the set of all sampling points in the area unit P; n is the amount of all sampling points in the area unit P.
is the per capita value considering the resident and employed population.
m is the area within the regional unit P; is the number of permanent residents in unit P; is the number of jobs in unit P.
The higher the
, the higher the low-carbon friendliness of the road network in unit
P area. It should be noted that the calculation results of
are not used in the subsequent step
Section 2.2.4.
2.2.4. Construct Value Comparison Analysis Matrix
A matrix table (
Table 2) was constructed based on the
value and the population density
value of each spatial unit. According to the relationship between the value of a single spatial unit and the median of the overall value, four kinds of analysis conclusions could be formed, respectively.
When the value and value were both higher than the median, it could be considered that the low-carbon friendliness of the area was average, and a high-capacity transit needed to be supplemented. When the value of was higher than the median and the value of was lower than the median, it could be considered that the low-carbon friendliness of the area was high, and the development of bus transits could be optimized. When the value was lower than the median and the value was higher than the median, it could be considered that the low-carbon friendliness of the region was low, and it was urgent to optimize the road network construction conditions. When the values of and were both lower than the median, it could be considered that the low-carbon friendliness of the region was average, and car traffic could be supplemented appropriately.
3. Evaluation of Low-Carbon Friendliness of Road Network Structure in Shanghai Central Urban Area
The urban road network in the central urban area of Shanghai (inside the outer ring road) was selected for the empirical analysis and evaluation of low-carbon friendliness, which provides support for the follow-up research on optimization. The low-carbon friendliness of the urban road network structure was calculated in the sub-district with the scale of the regional unit P.
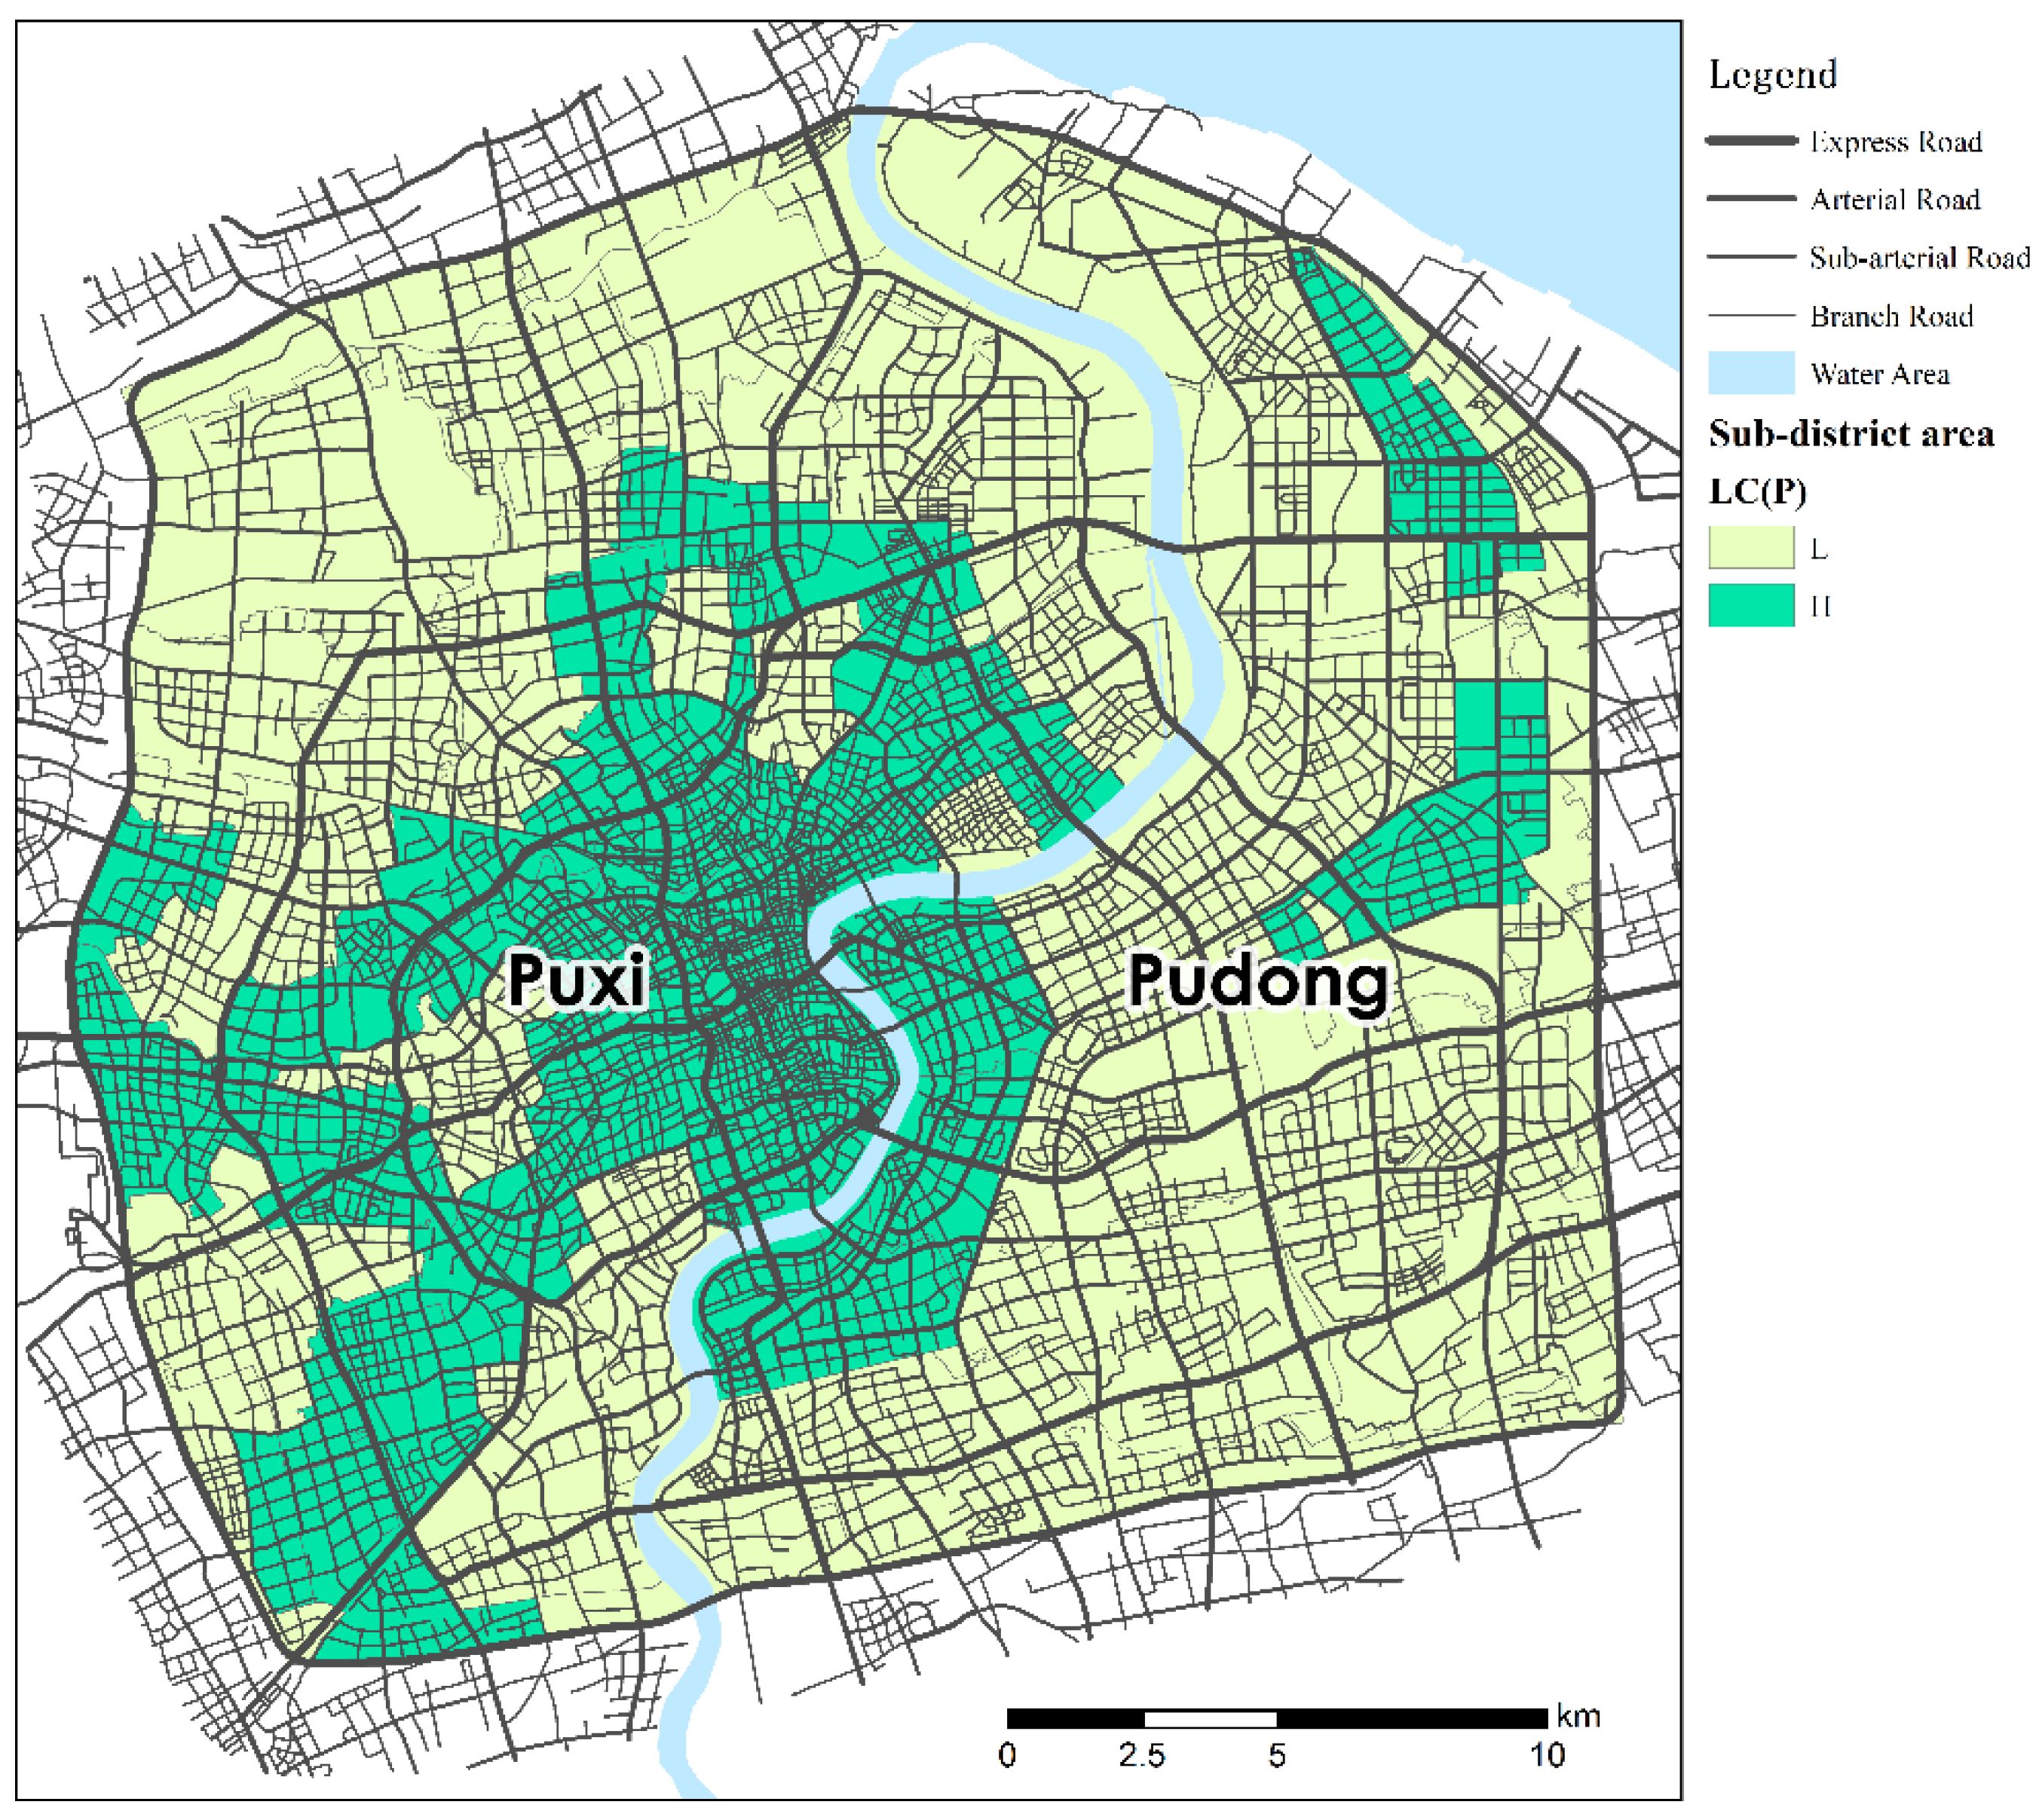
3.1. Overall Evaluation Results
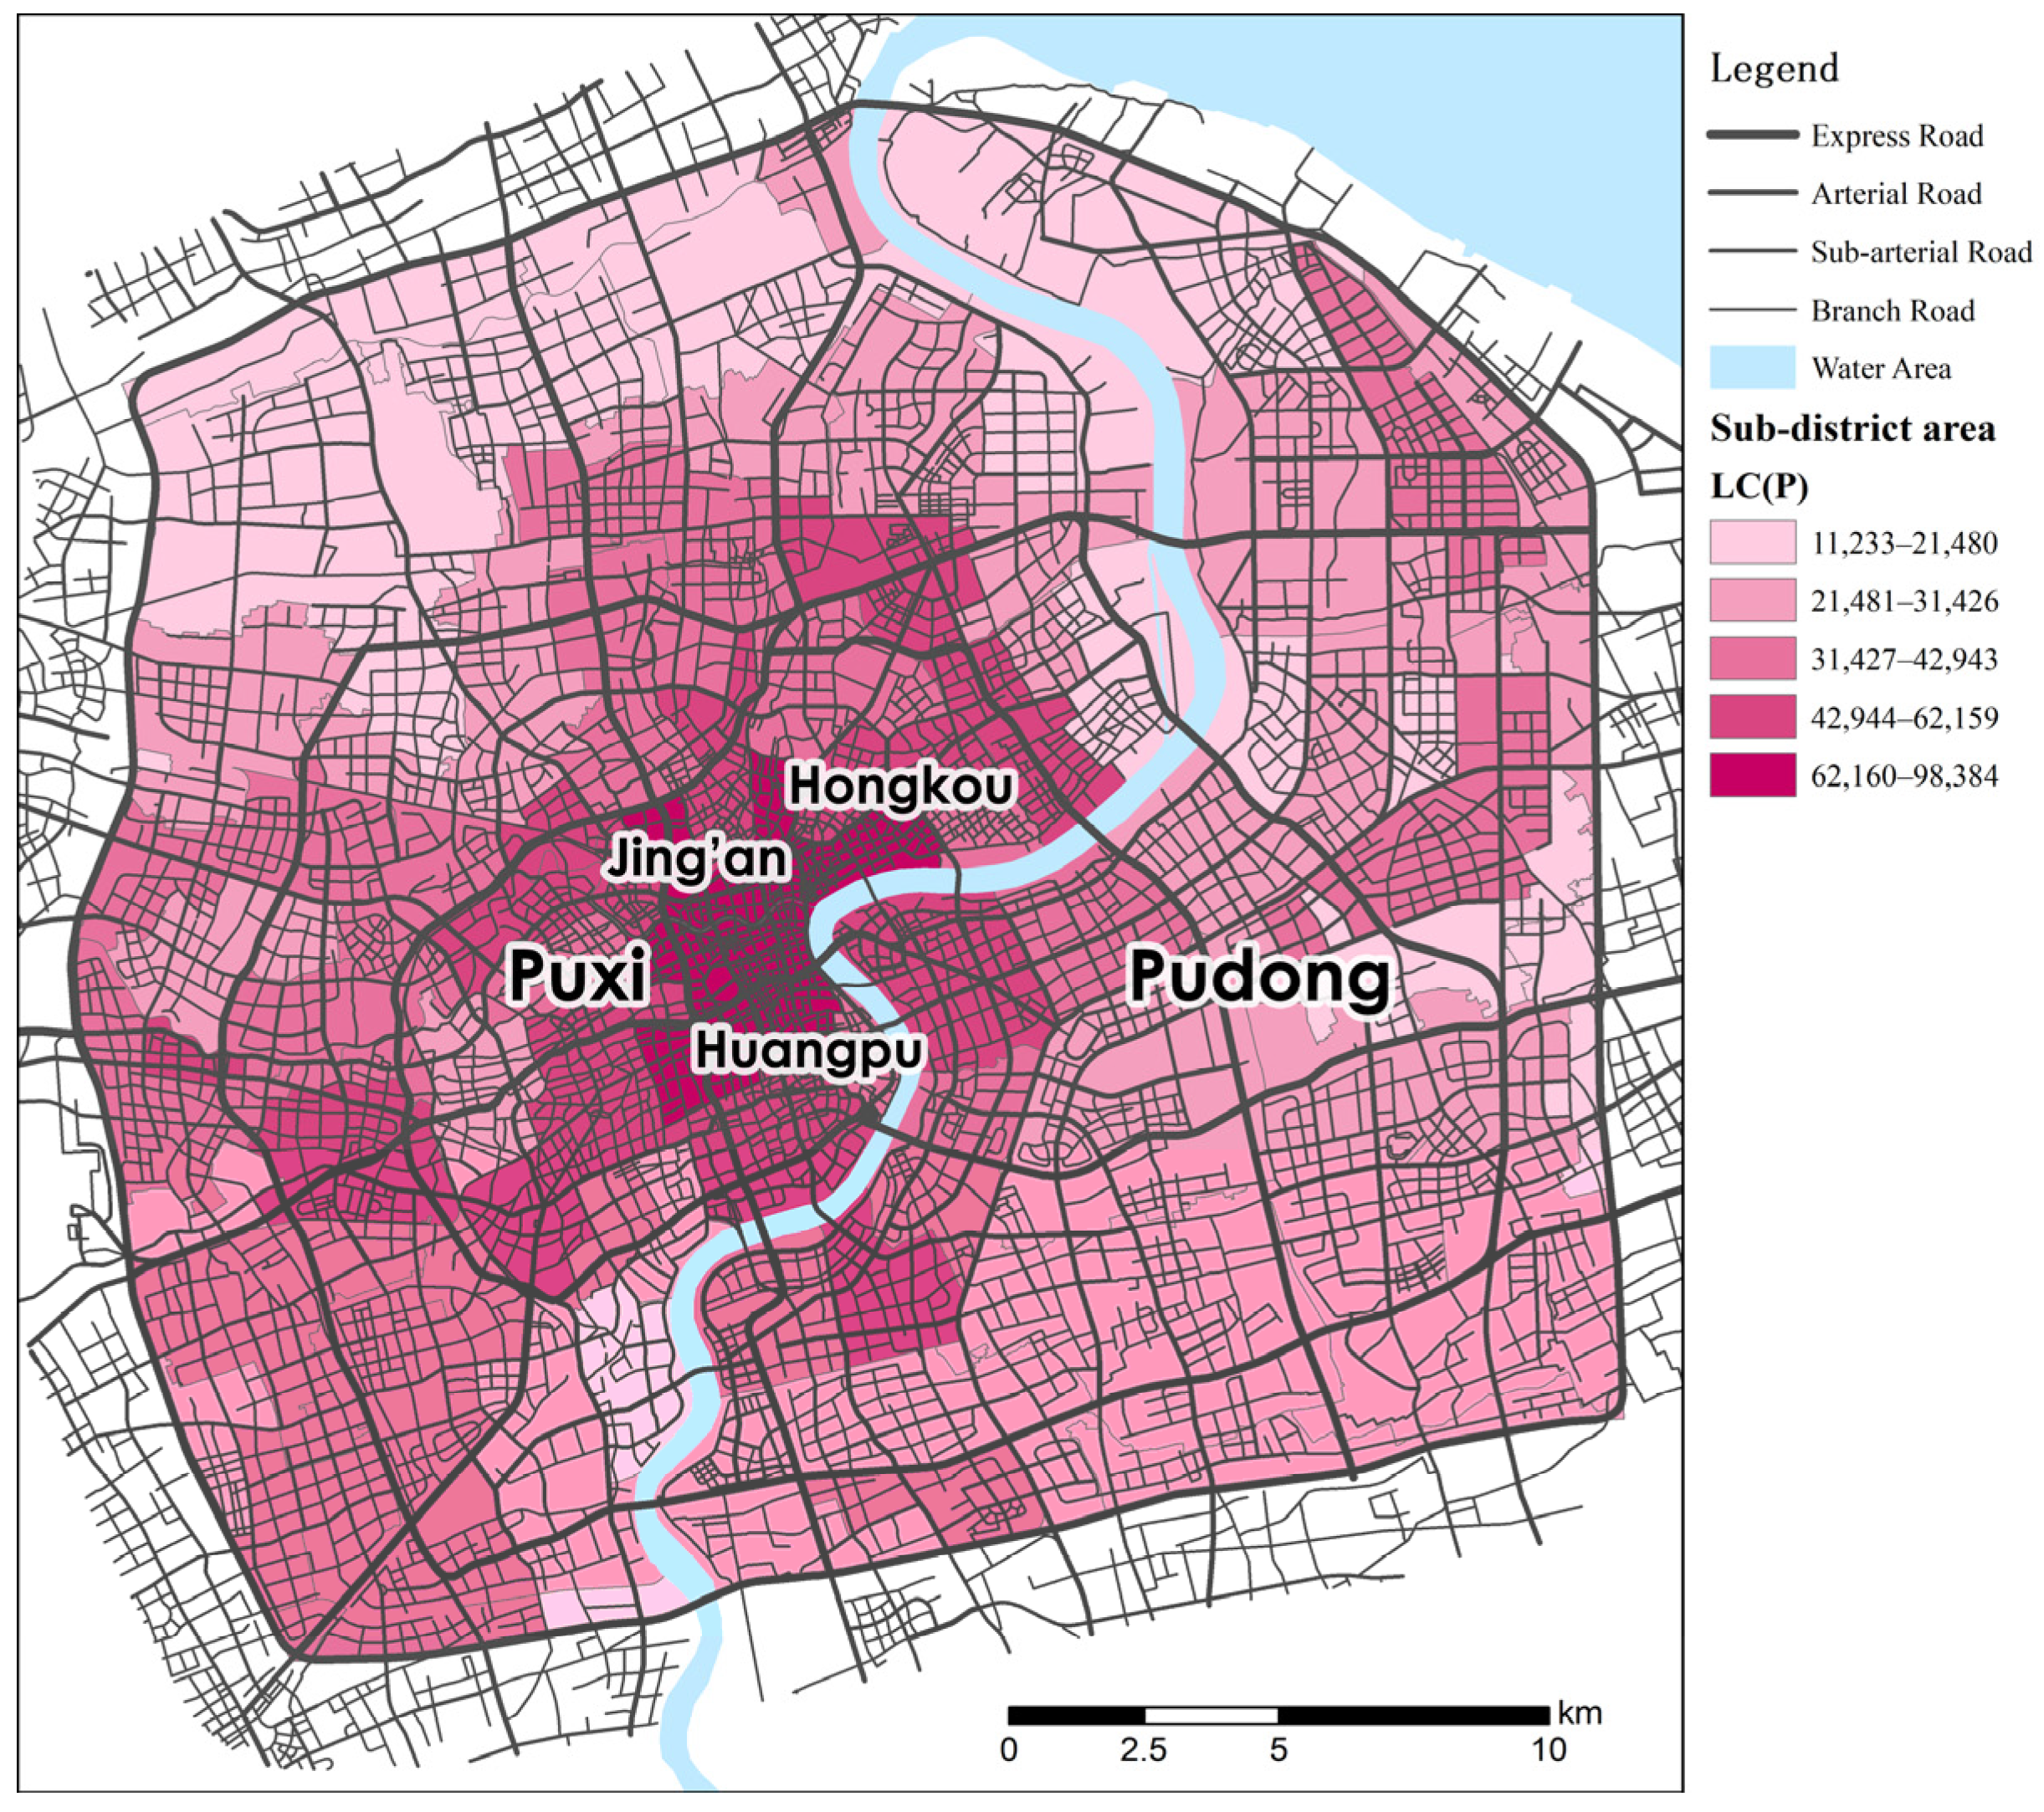
Figure 3 shows the
value for the sub-district scale in central Shanghai. In general, the value in the Puxi area is higher than that in the Pudong area, indicating that the road network structure in Puxi is more suitable for bus transits and more low-carbon friendly, regardless of the employment and residential population density in the region. Areas that perform particularly well in Puxi include the north-central Huangpu District, the southeast Jing’an District, and the south Hongkou District.
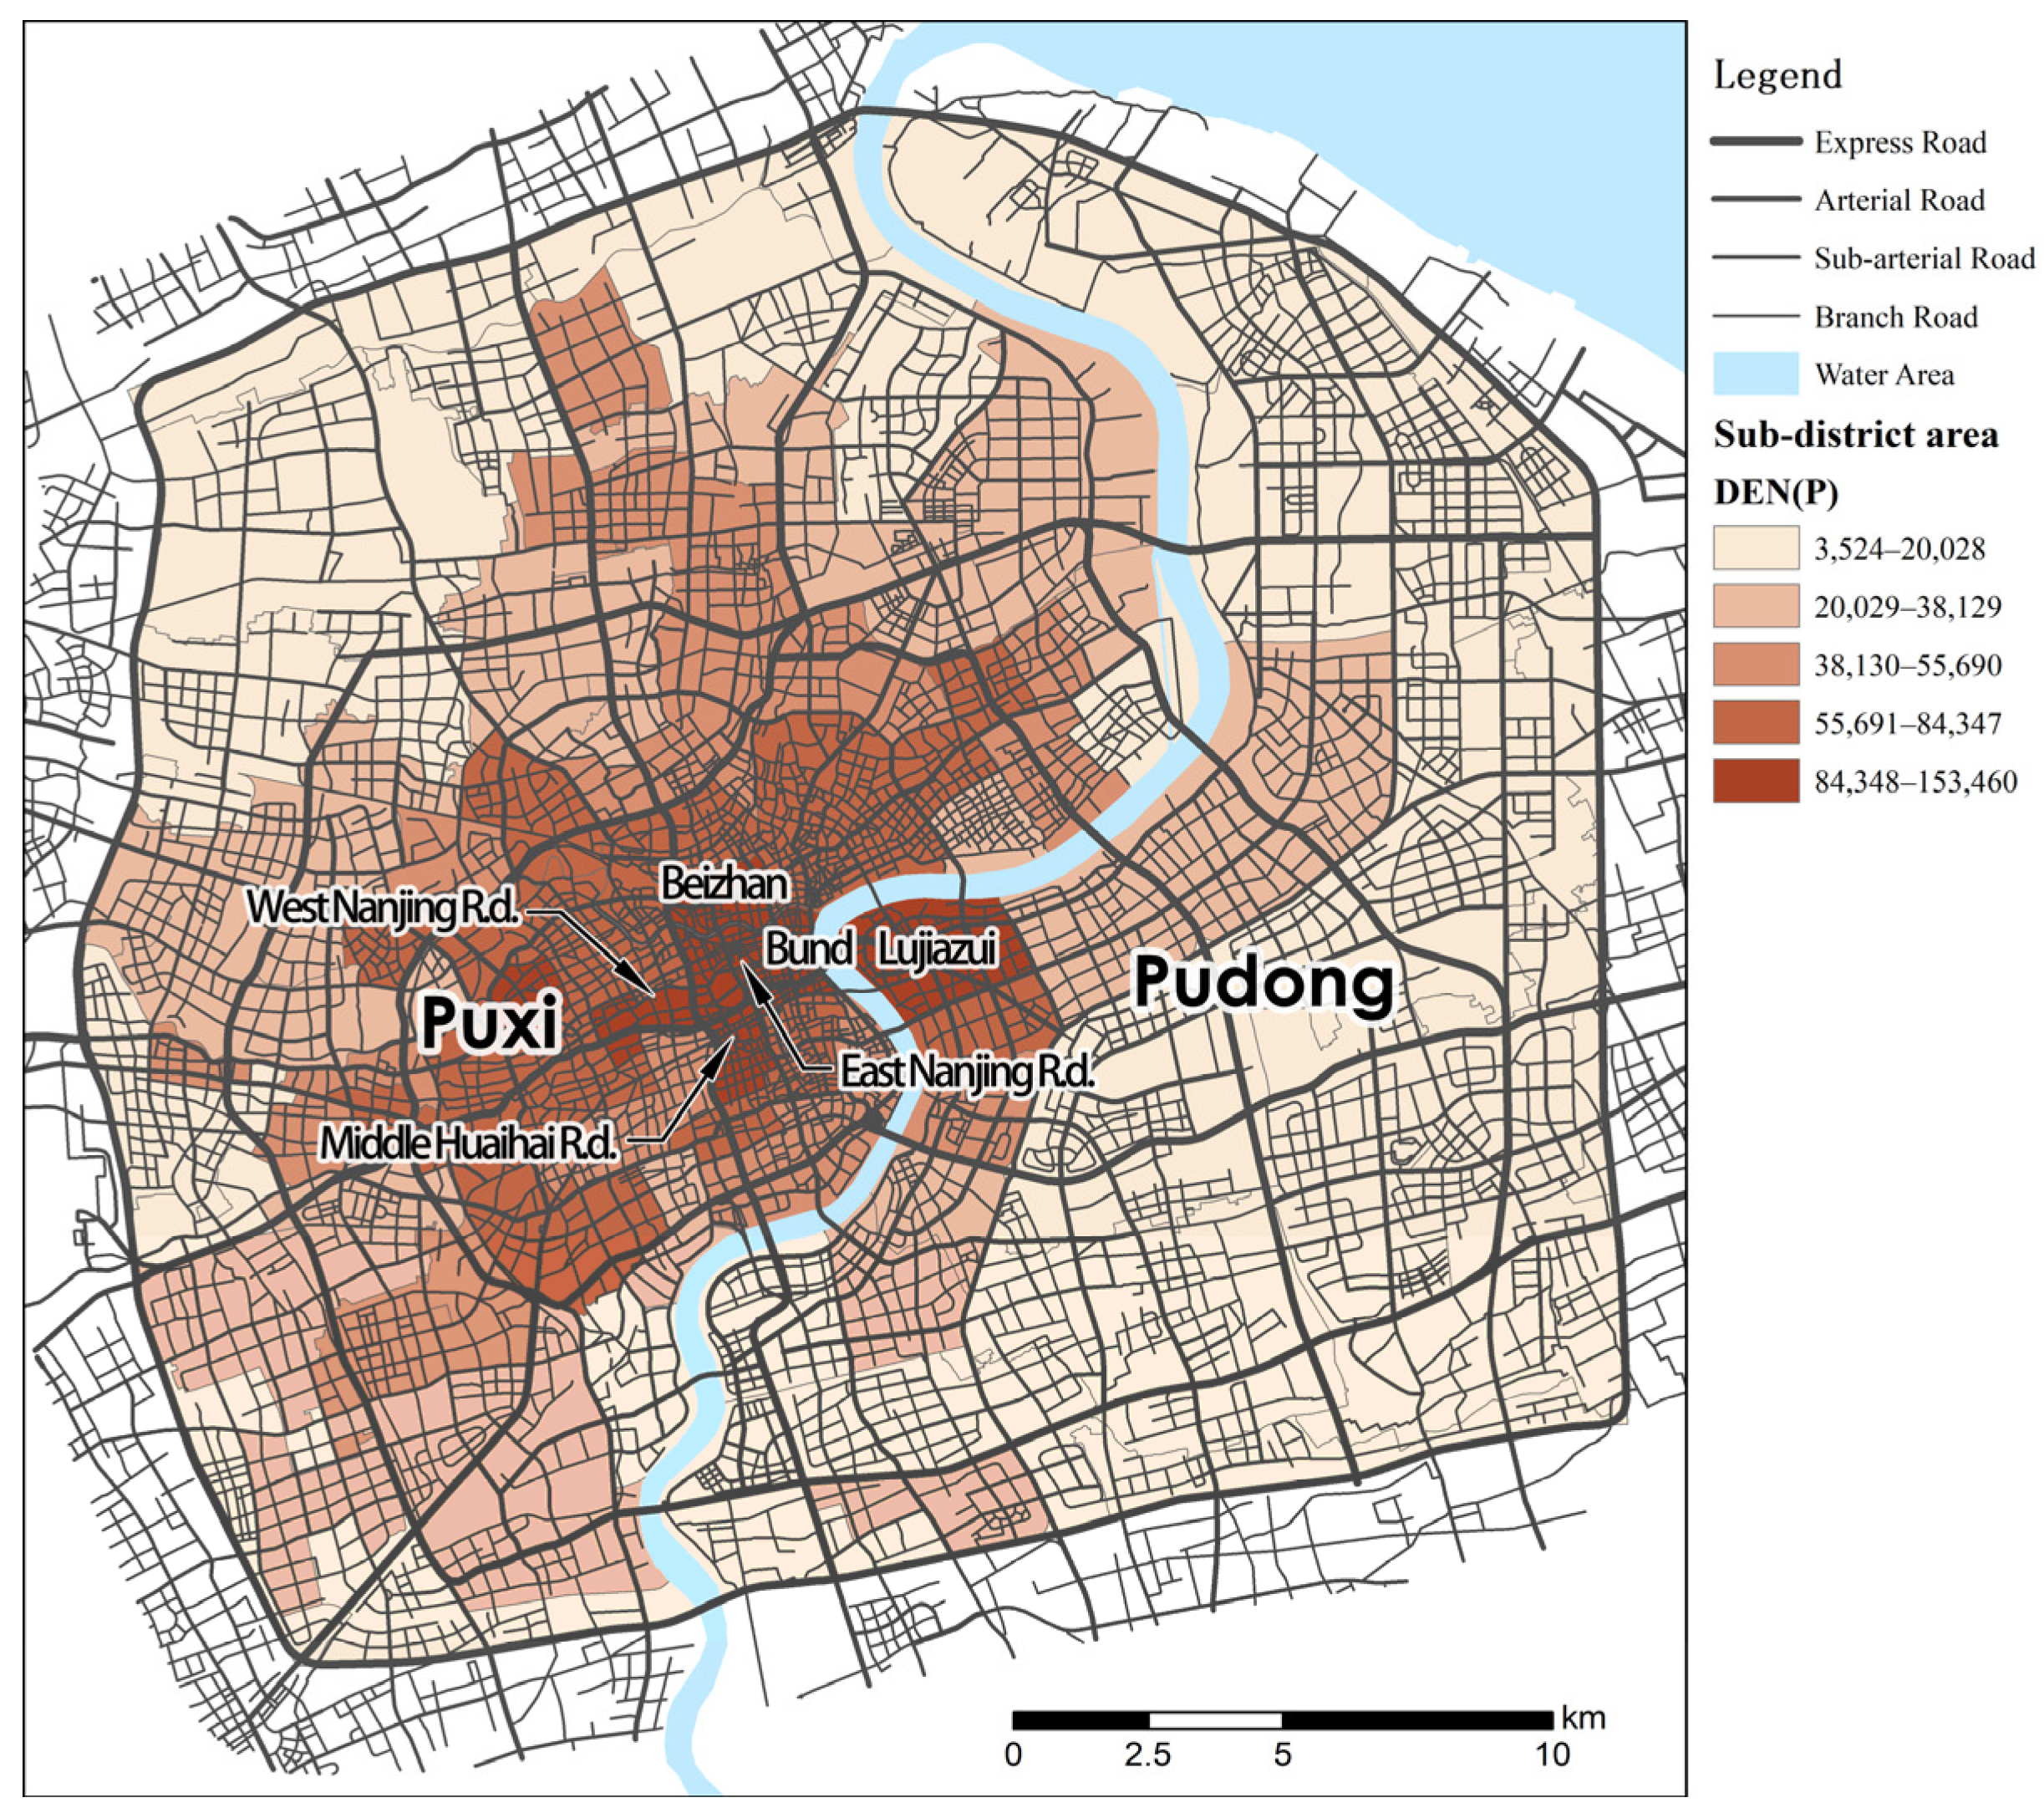
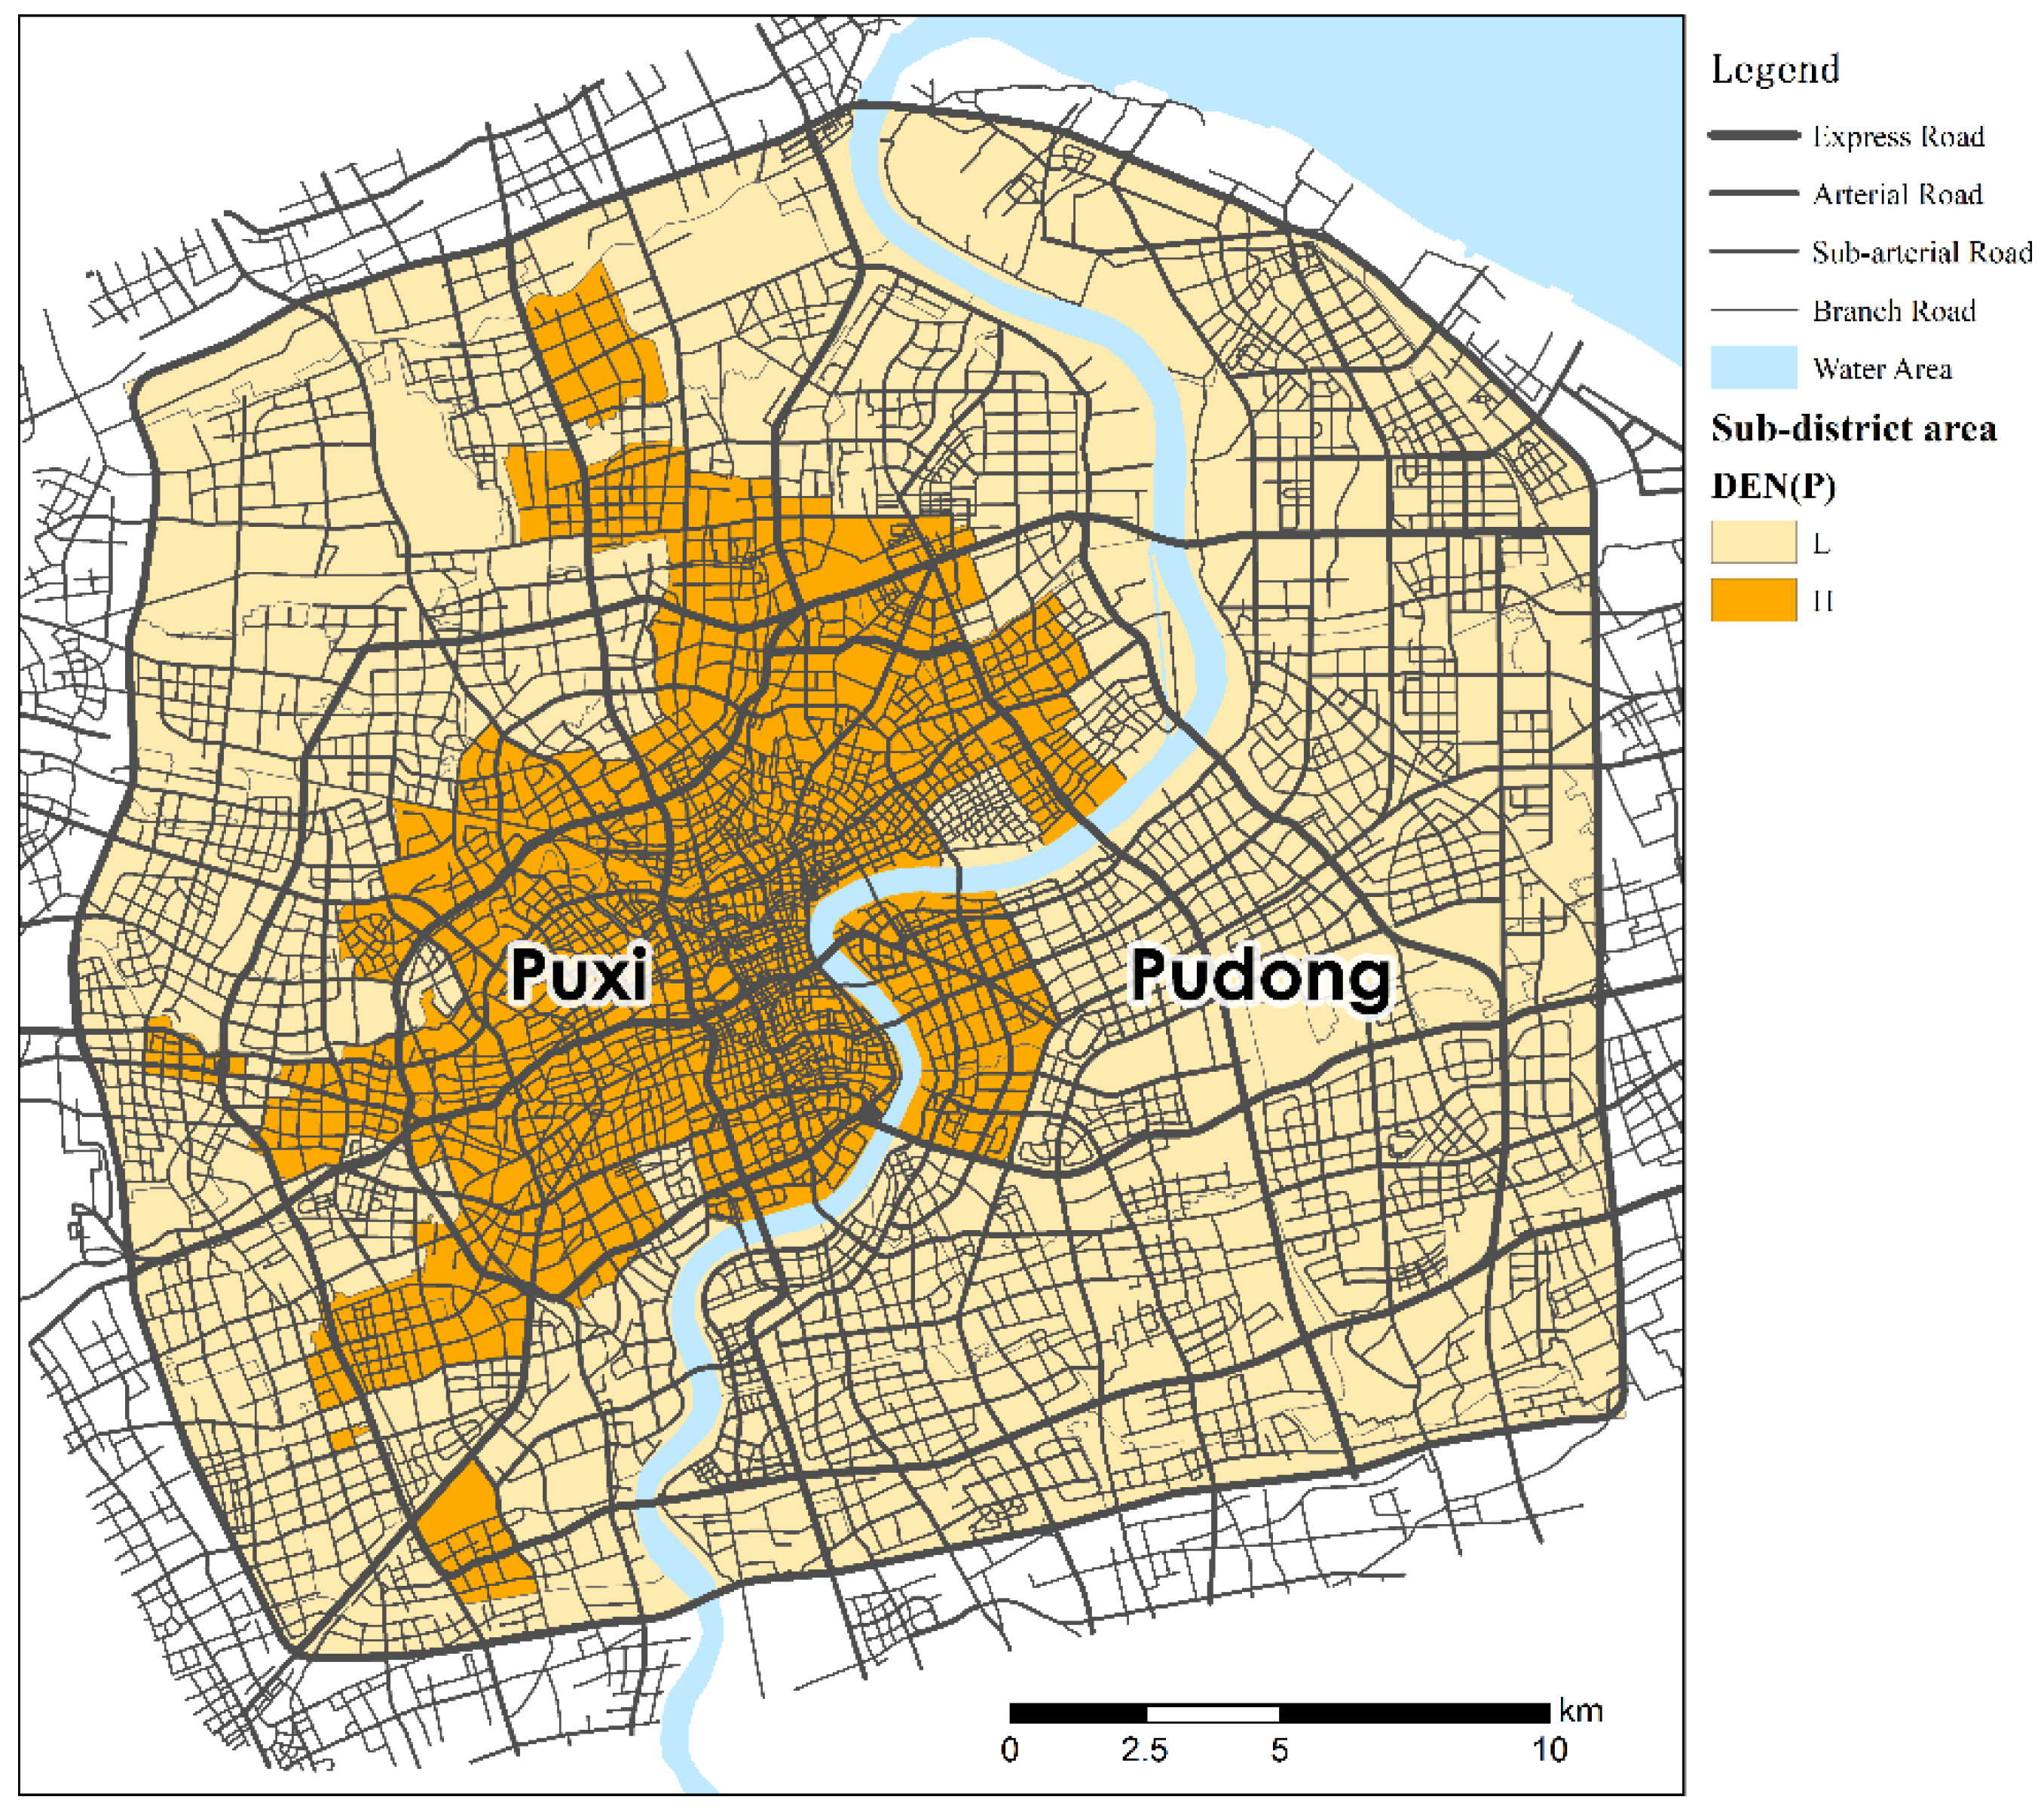
Figure 4 shows the
value for the sub-district scale in central Shanghai. In general, the high-value contiguous areas in Puxi are relatively high, but extremely high-value areas are distributed in both Pudong and Puxi. Judging from the sum of the residential and employed population density, the sub-district with more than 50,000/square kilometers includes Lujiazui, Bund, Beizhan, East Nanjing Road, Middle Huaihai Road, and West Nanjing Road.
Figure 5 shows the
value for the sub-district scale in central Shanghai. In general, the values in the peripheral areas of Pudong are relatively high, indicating that considering the employment and resident population density in the area, the road network resources in Pudong are relatively abundant. However, due to the complexity of the
value, the absolute value of its ratio to the
value is relatively limited, so further analysis is required using the matrix comparison method.
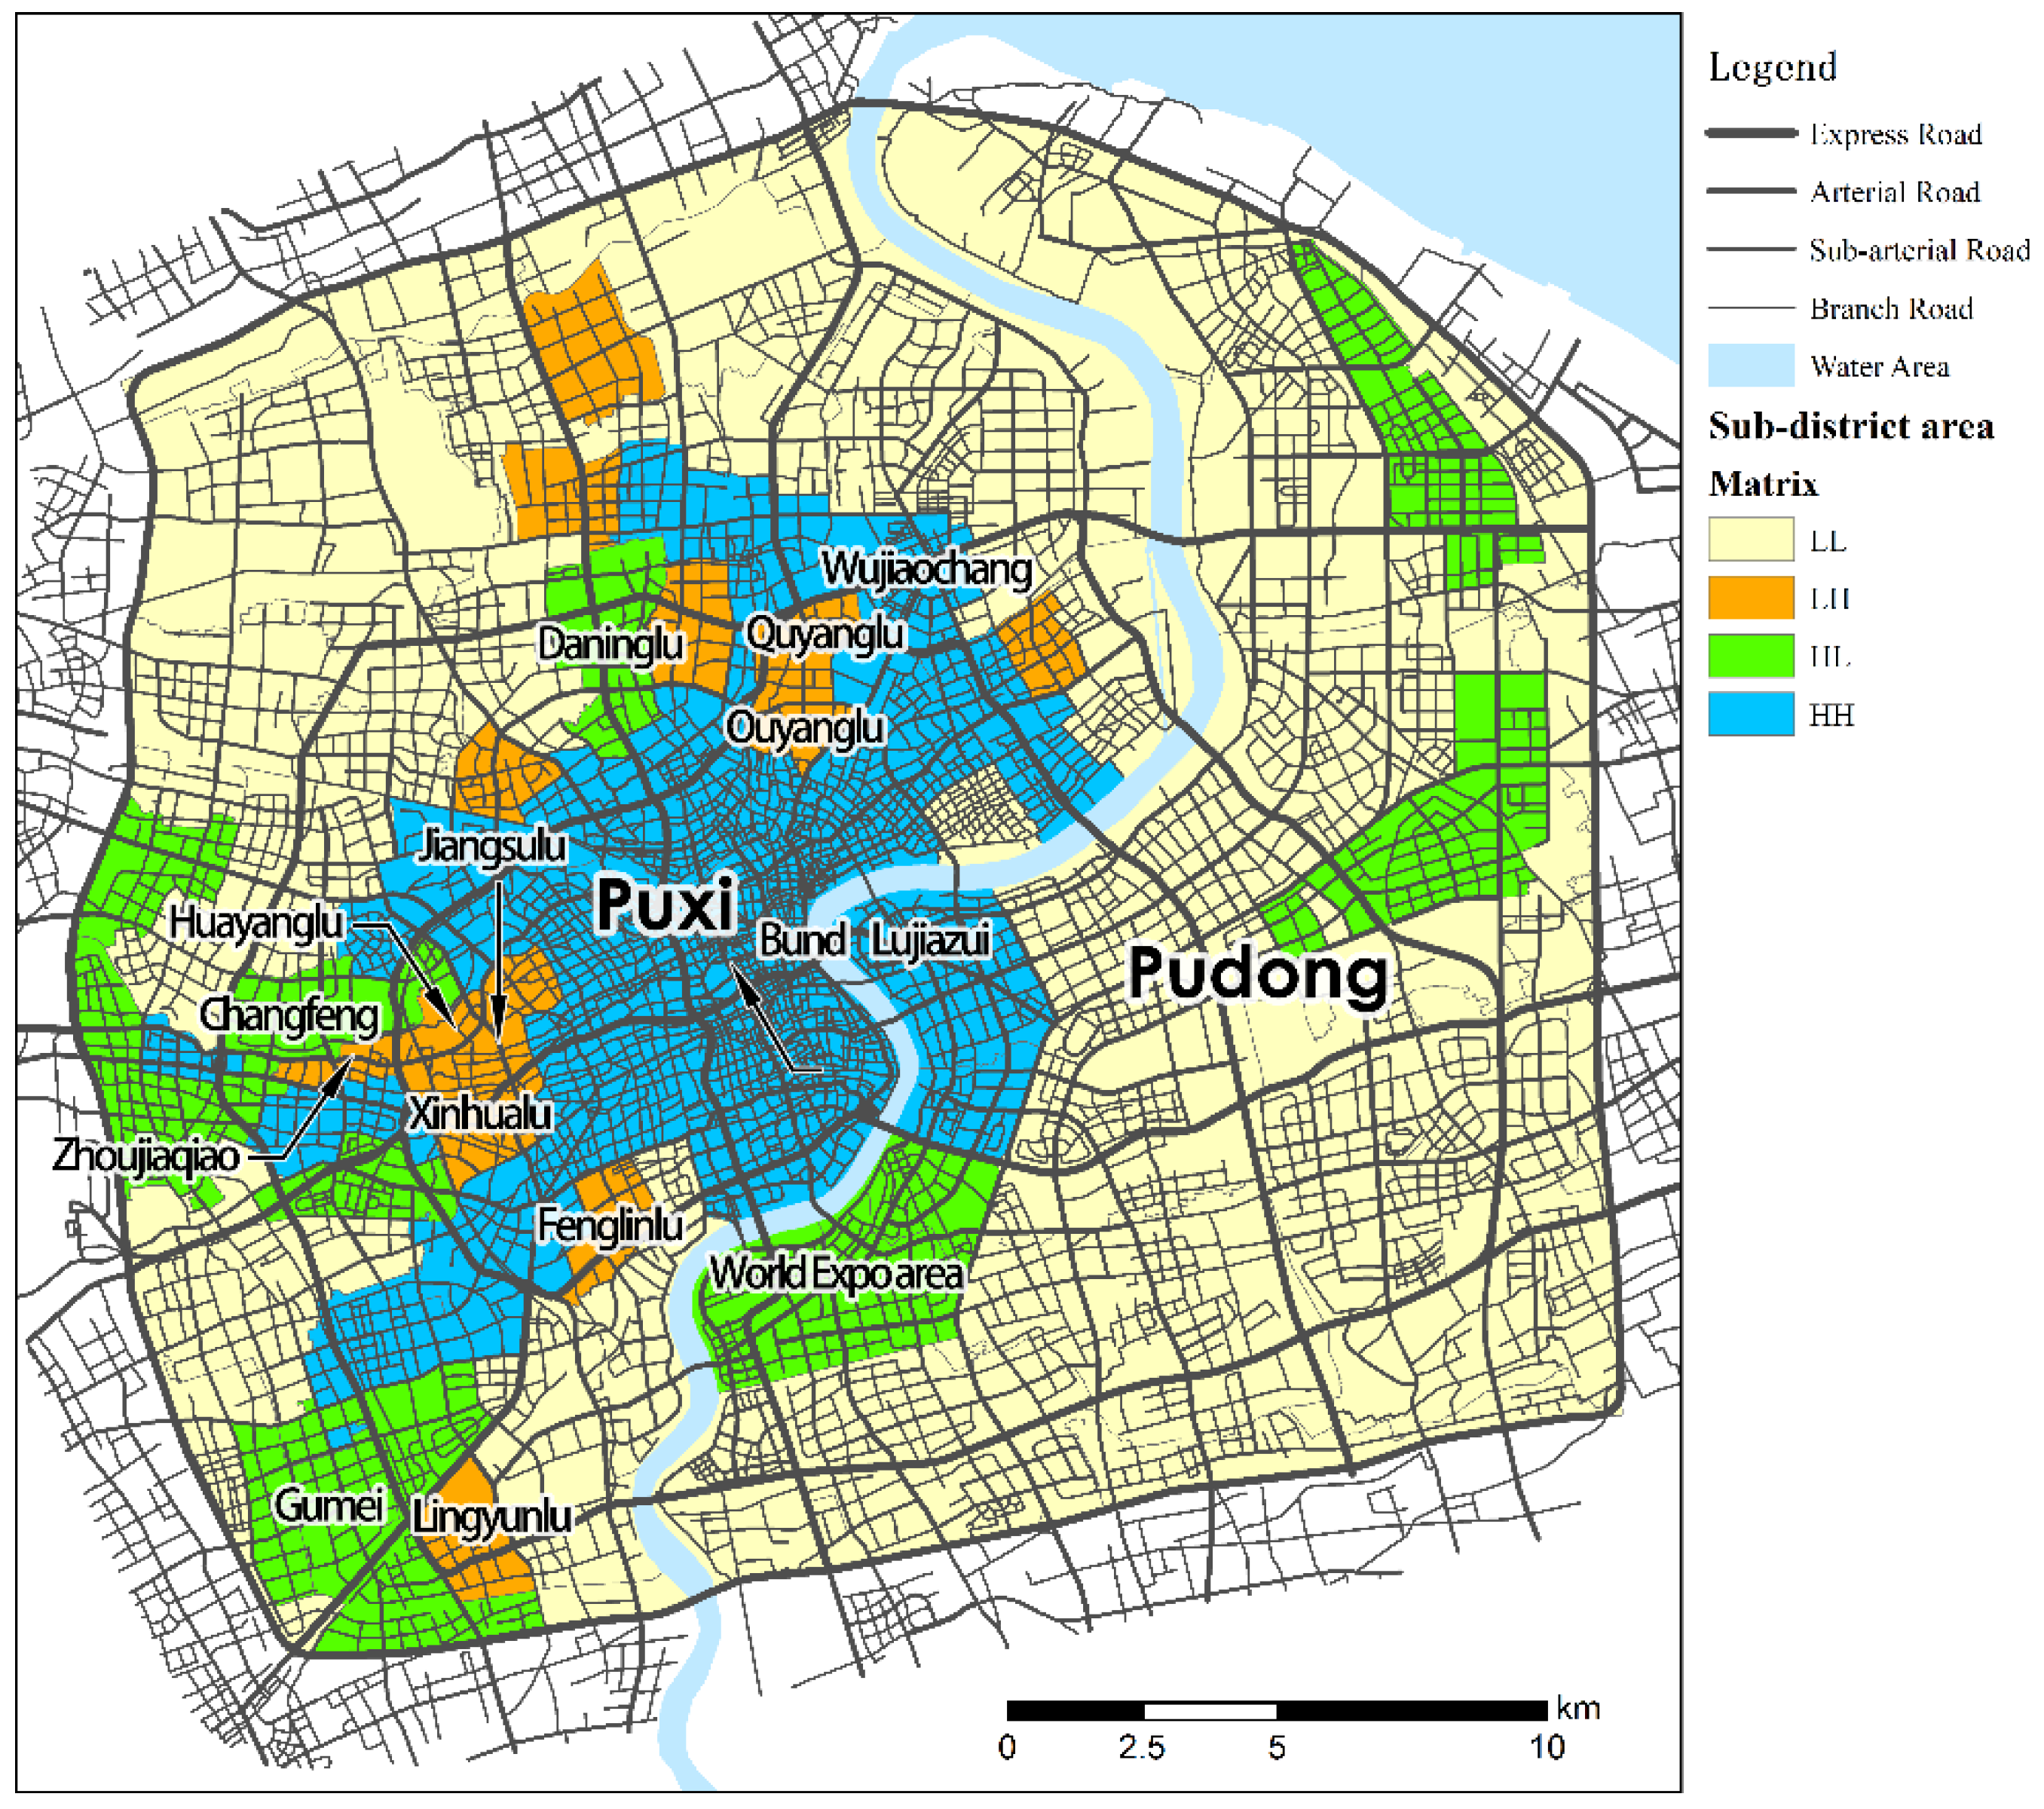
Figure 6 shows the relationship between the
value and median value for the sub-district scale in central Shanghai, and
Figure 7 shows the relationship between the
value and median value for the sub-district scale in central Shanghai. On this basis, the matrix analysis results of
and
for the sub-district scale in central Shanghai are calculated, as shown in
Figure 8.
The blue area in
Figure 8 is the “HH” area; that is, the road network conditions are suitable for bus transits, and the residential and employed population densities are also relatively high. They are mainly concentrated in the sub-district of Bund, Lujiazui, and Wujiaochang. In these areas, it is necessary to strengthen the construction of high-capacity forms of transit, such as rail transit, while strengthening the construction of ground road network.
The green area in
Figure 8 is the “HL” area; that is, the road network conditions are suitable for bus transits, but the residential and employed population densities are relatively low. Representative areas include the World Expo area of Pudong, Gumei of Minhang, Daninglu of Jing’an, and Changfeng of Putuo. These areas should focus on optimizing the layout of bus transits.
The orange area in
Figure 8 is the “LH” area; that is, the road network conditions are relatively unsuitable for bus transits, but the residential and employed population densities are relatively high. Representative areas include the eastern area of Changning (Jiangsulu, Huayanglu, Xinhualu Zhoujiaqiao), Fenglinlu and Lingyunlu of Xuhui, Quyanglu, and Ouyanglu of Hongkou. These areas need to further improve the construction conditions of the road network.
The light-yellow area in
Figure 8 is the “LL” area; that is, the road network conditions are relatively unsuitable for bus transits, and the residential and employed population densities are relatively low. These areas are relatively more widely distributed in Pudong, which can properly supplement car traffic.
3.2. Typical Area Analysis
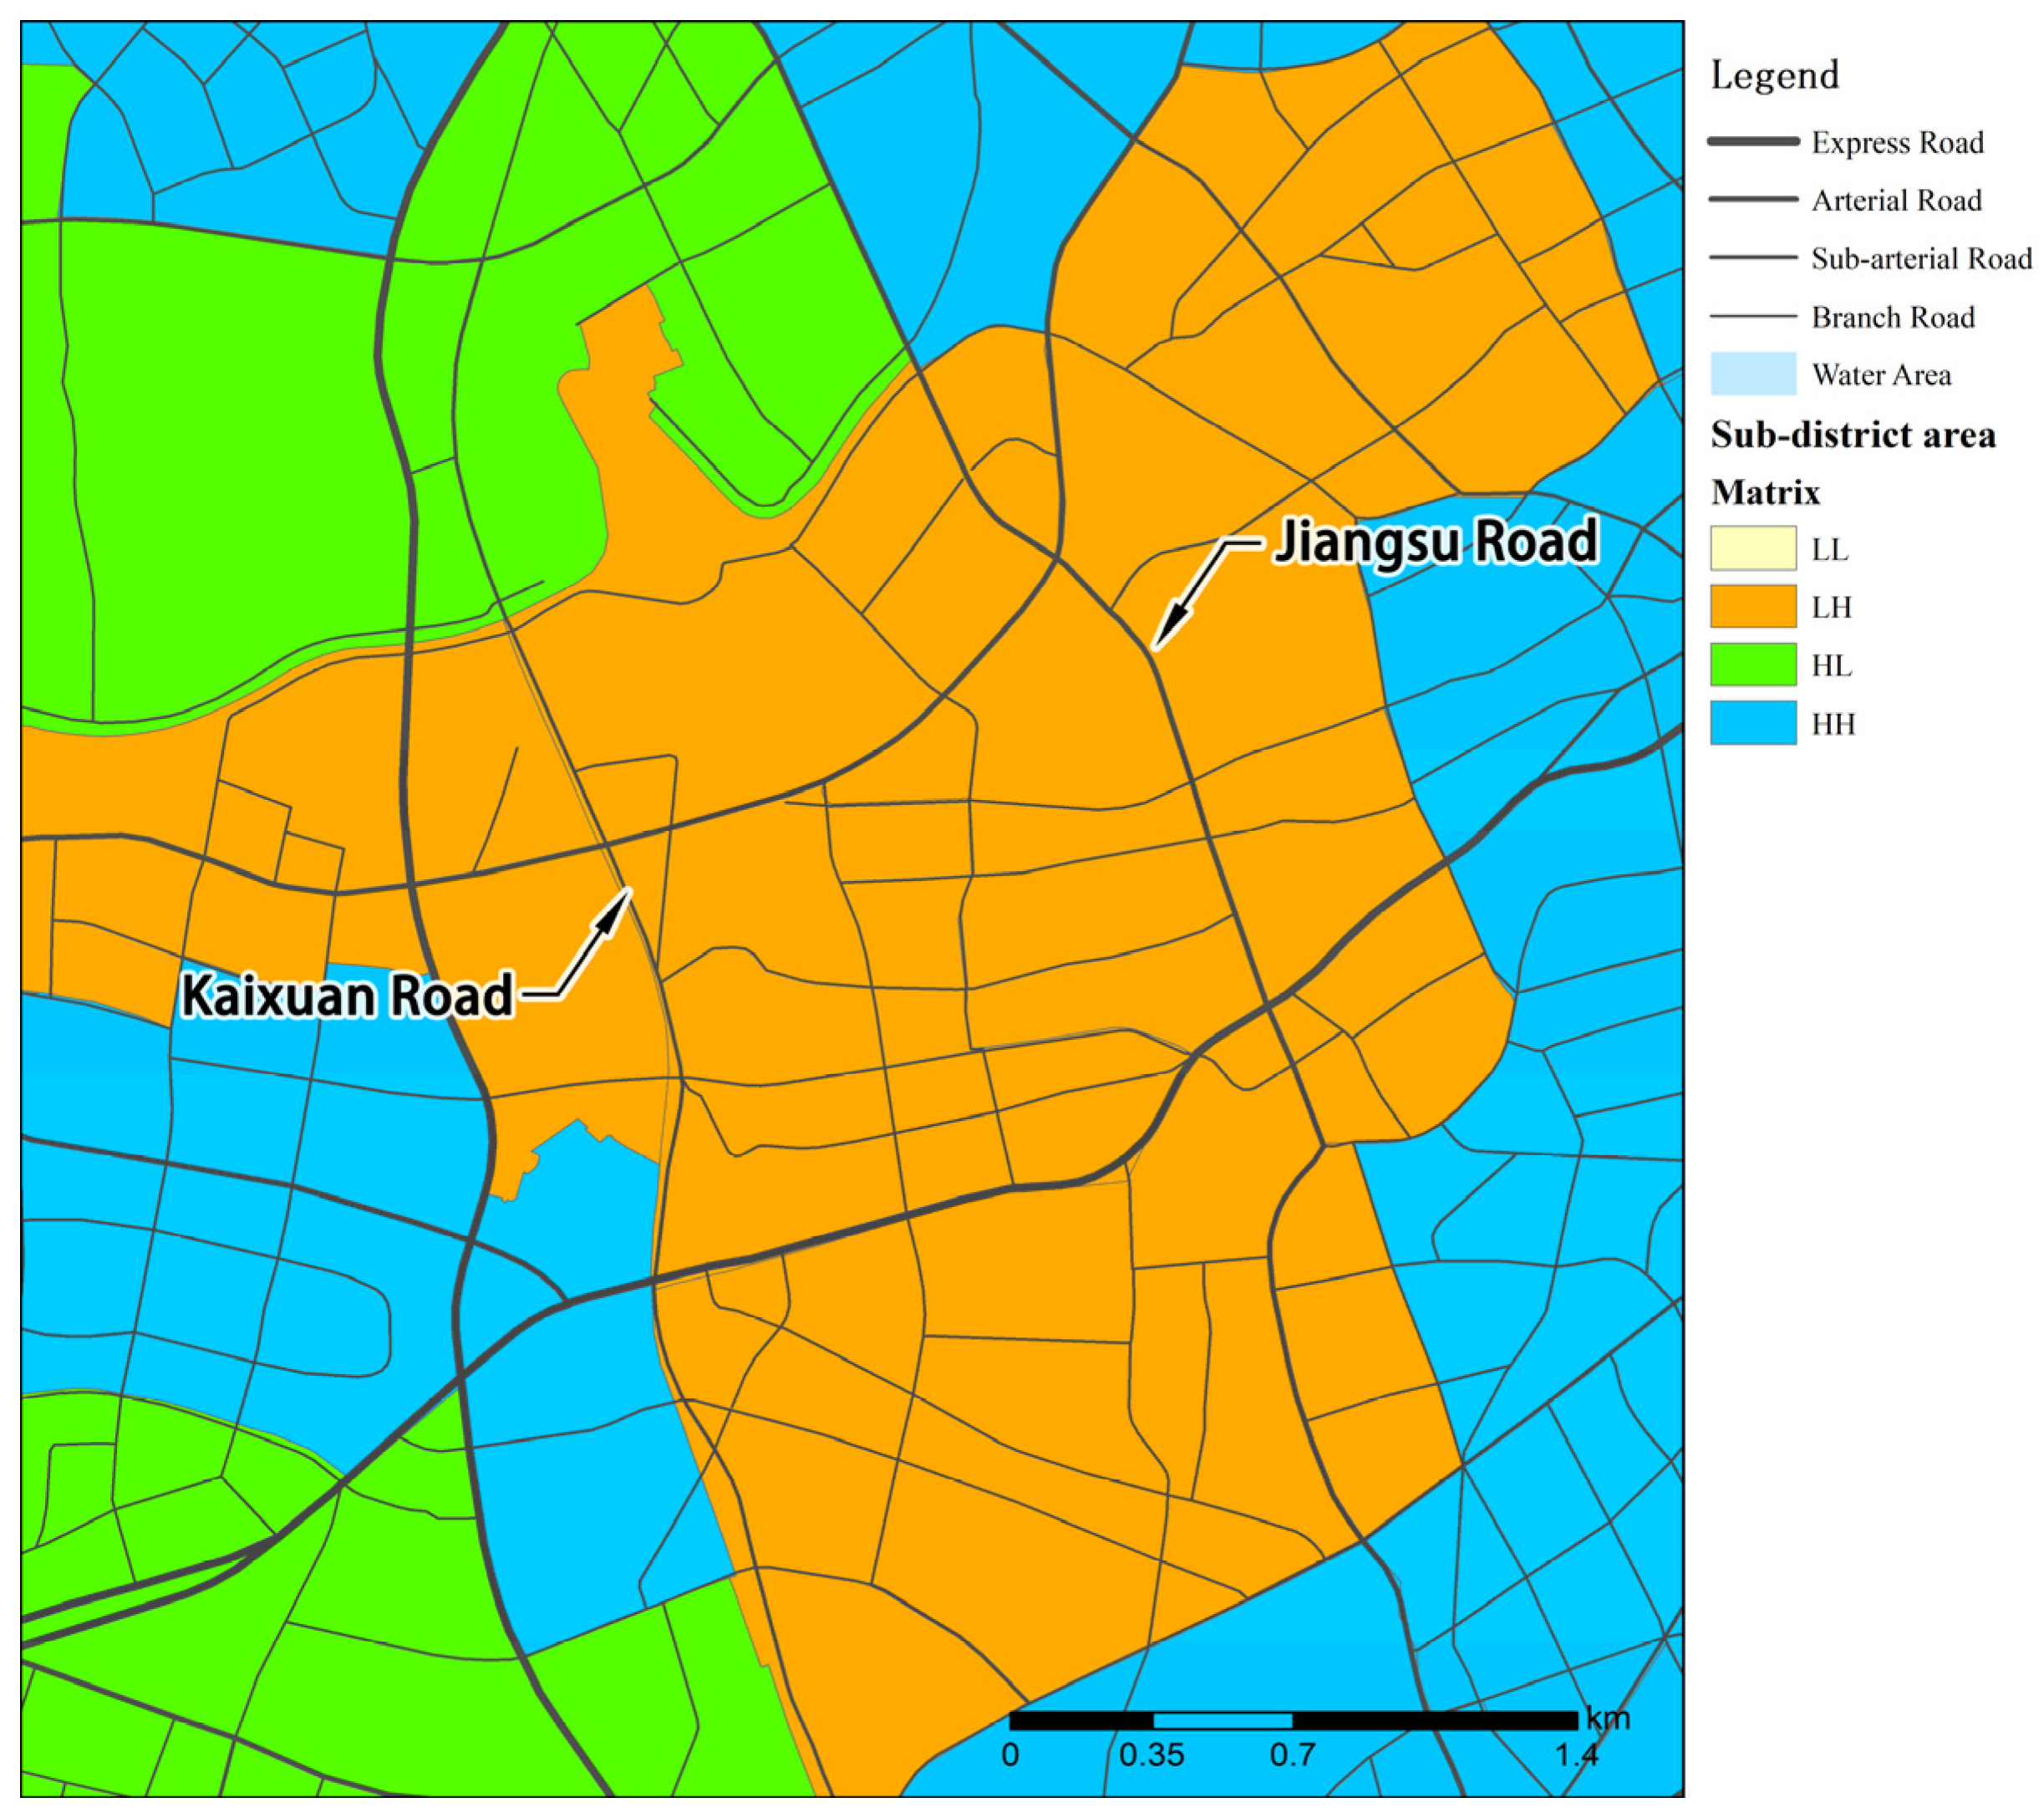
3.2.1. East Changning District
The eastern part of Changning District is a typical “LH” area; that is, the road network conditions are relatively unsuitable for bus transits, but the residential and employed population density is relatively high, and the construction conditions of the ground road network need to be further optimized. When analyzing the characteristics of the road network structure in this area in detail, it can be found that there are some notable features that are different from those in the surrounding areas. Firstly, the shape of the road network is relatively free. There are many T-junctions and dead-end roads, and many branch roads and trunk roads are relatively tortuous. Secondly, the density of the road network is relatively low. The distance between the north-south roads in this area is about 500 m, which is obviously higher than average in Puxi. Thirdly, there is a shortage of high-grade roads in the area. The area between the north-south Jiangsu Road and Kaixuan Road, with an interval of about 1.4 km, is dominated by branch roads, which lack arterial roads with good connectivity.
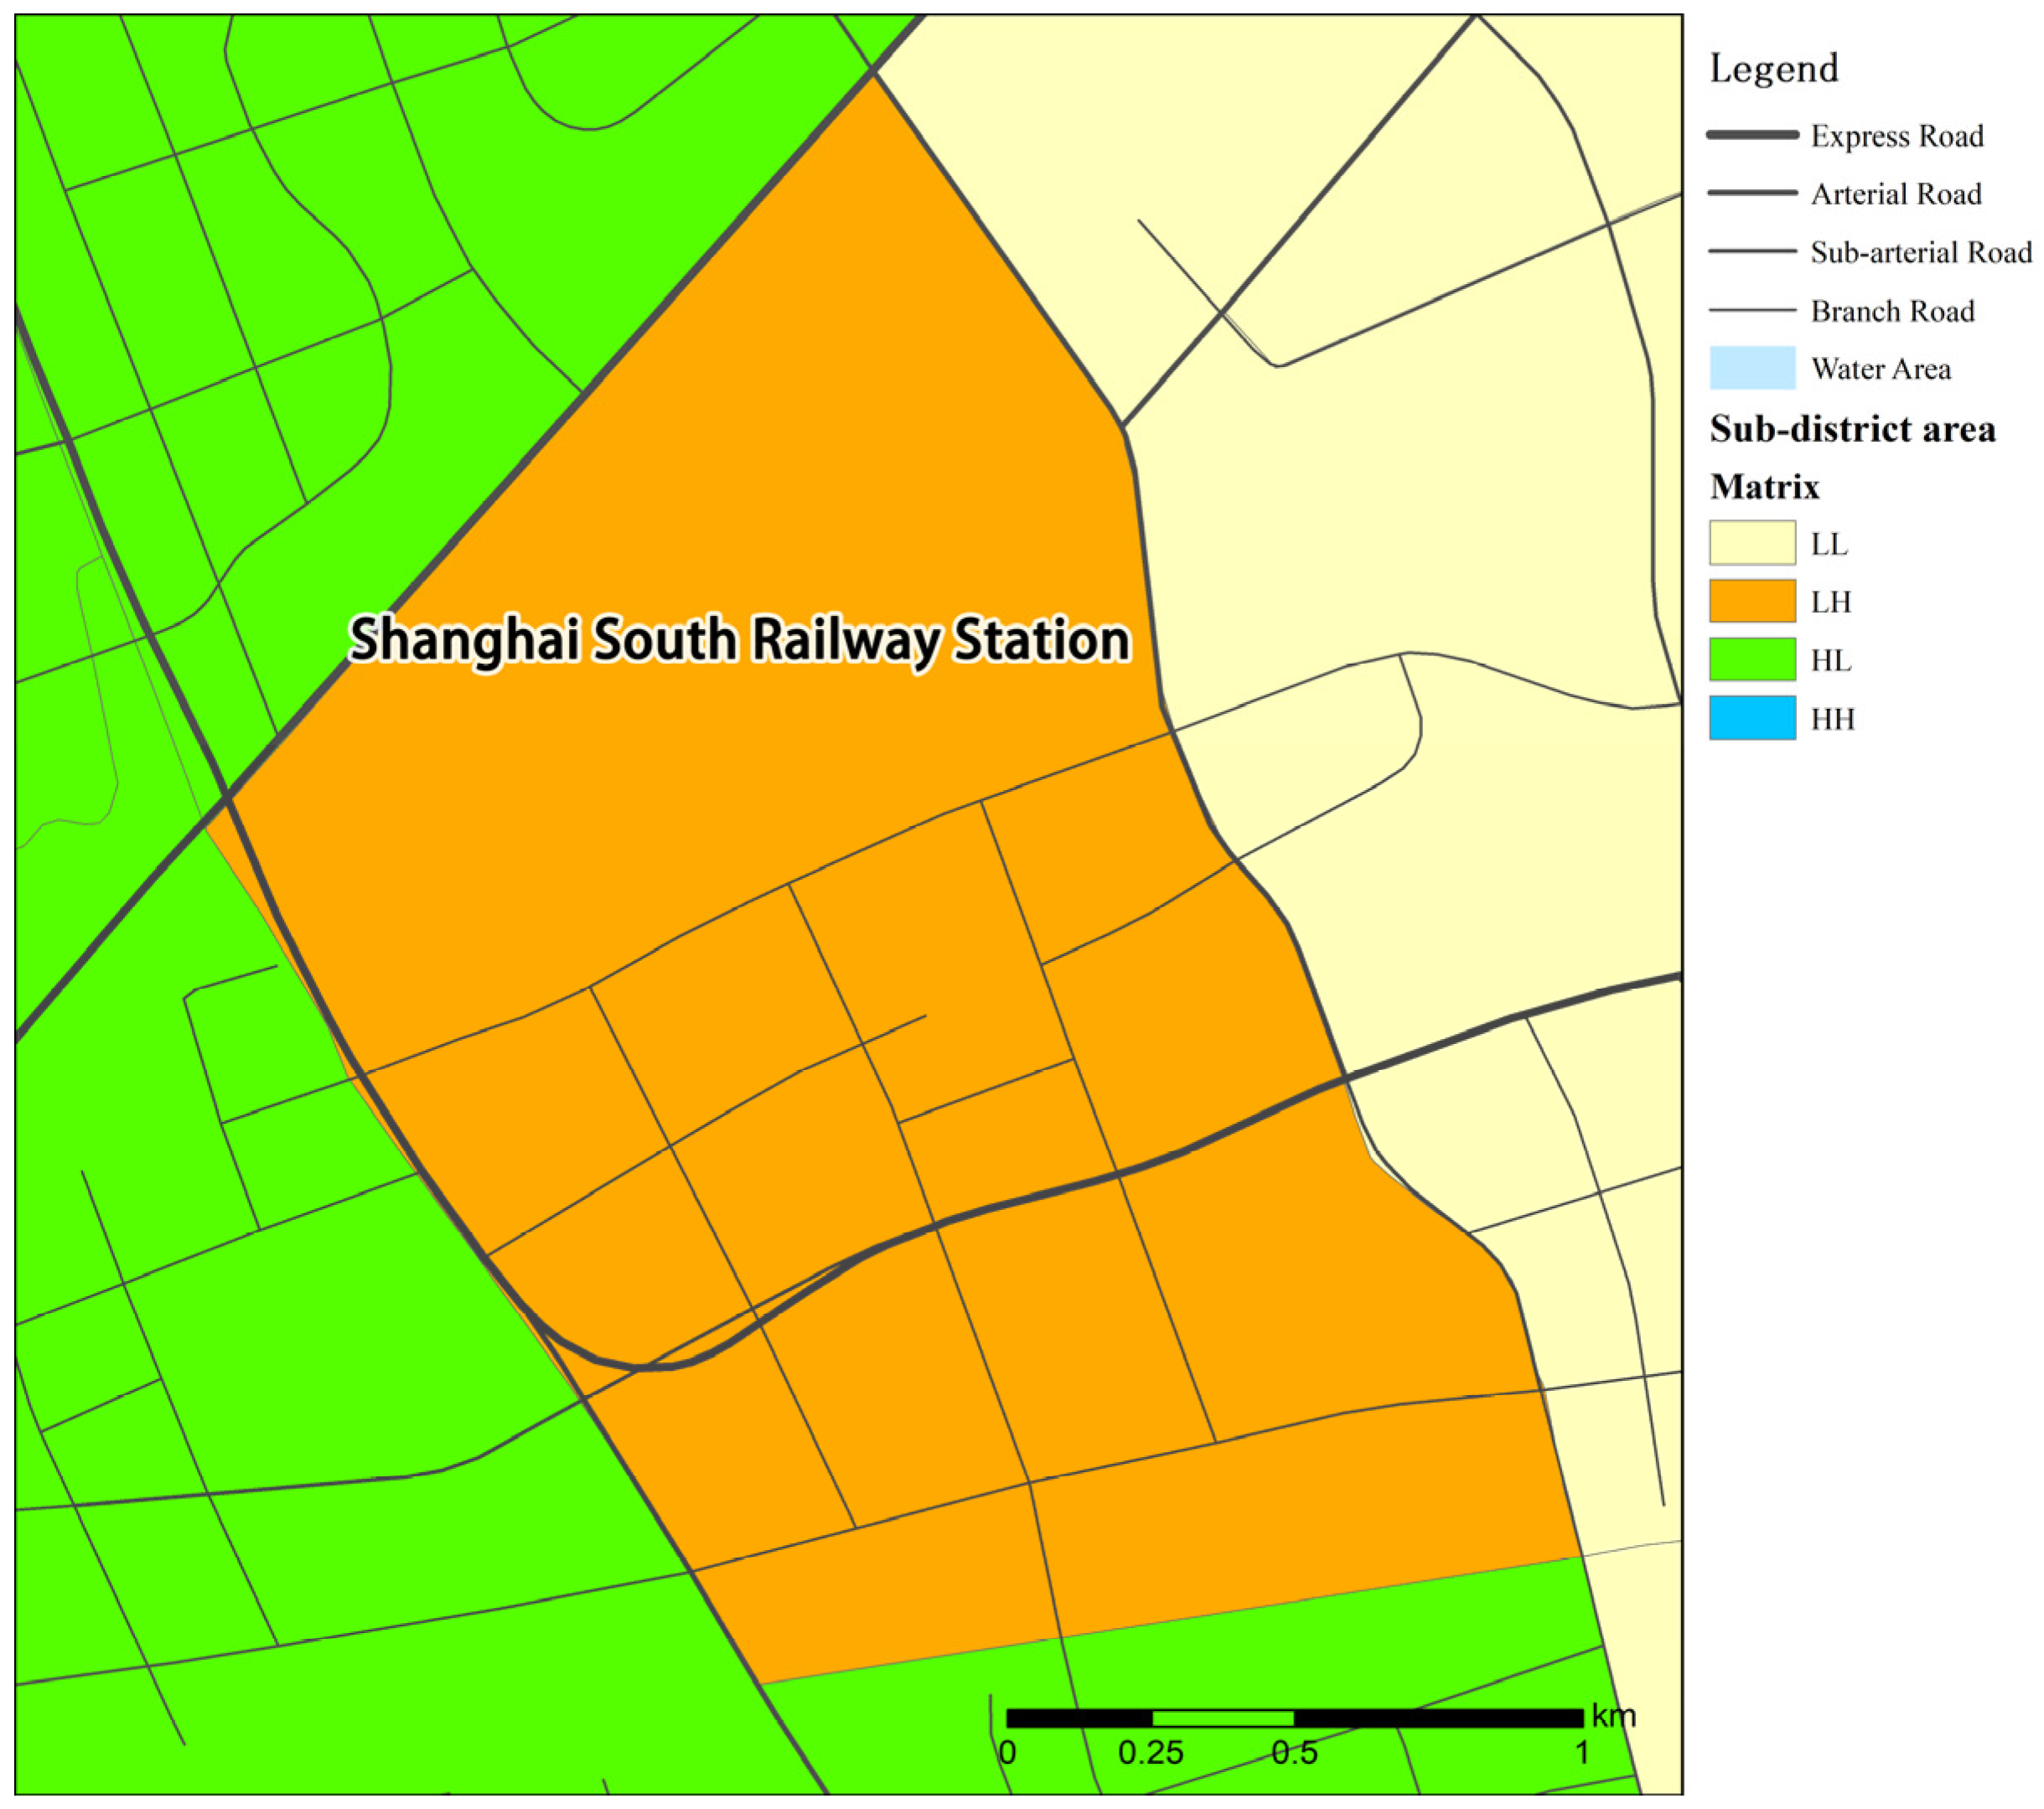
3.2.2. Lingyunlu Sub-District of Xuhui District
The Lingyunlu sub-district in Xuhui District is also a typical “LH” area. However, the characteristics of the road network structures in this area are different from those in the eastern part of Changning District. The road network density in the northern part of the area is significantly lower. The east-west width of the northern neighborhood reaches about 1.7 km, and the north-south direction reaches about 1.0 km, which is far beyond the suitable spatial scale for walking. This block is the neighborhood where the Shanghai South Railway Station is located. Due to the layout of large transportation stations and the division of railway lines, the road network structure in the northern part of the Lingyunlu sub-district is not low-carbon friendly. In addition, due to the existence of the large-scale block, the road network in the surrounding area formed more T-shaped intersections around the South Railway Station, which is not conducive to bus transits. The road network structure in the southern area of the Lingyunlu sub-district is relatively suitable, and the distance between intersections reaches about 400 m.
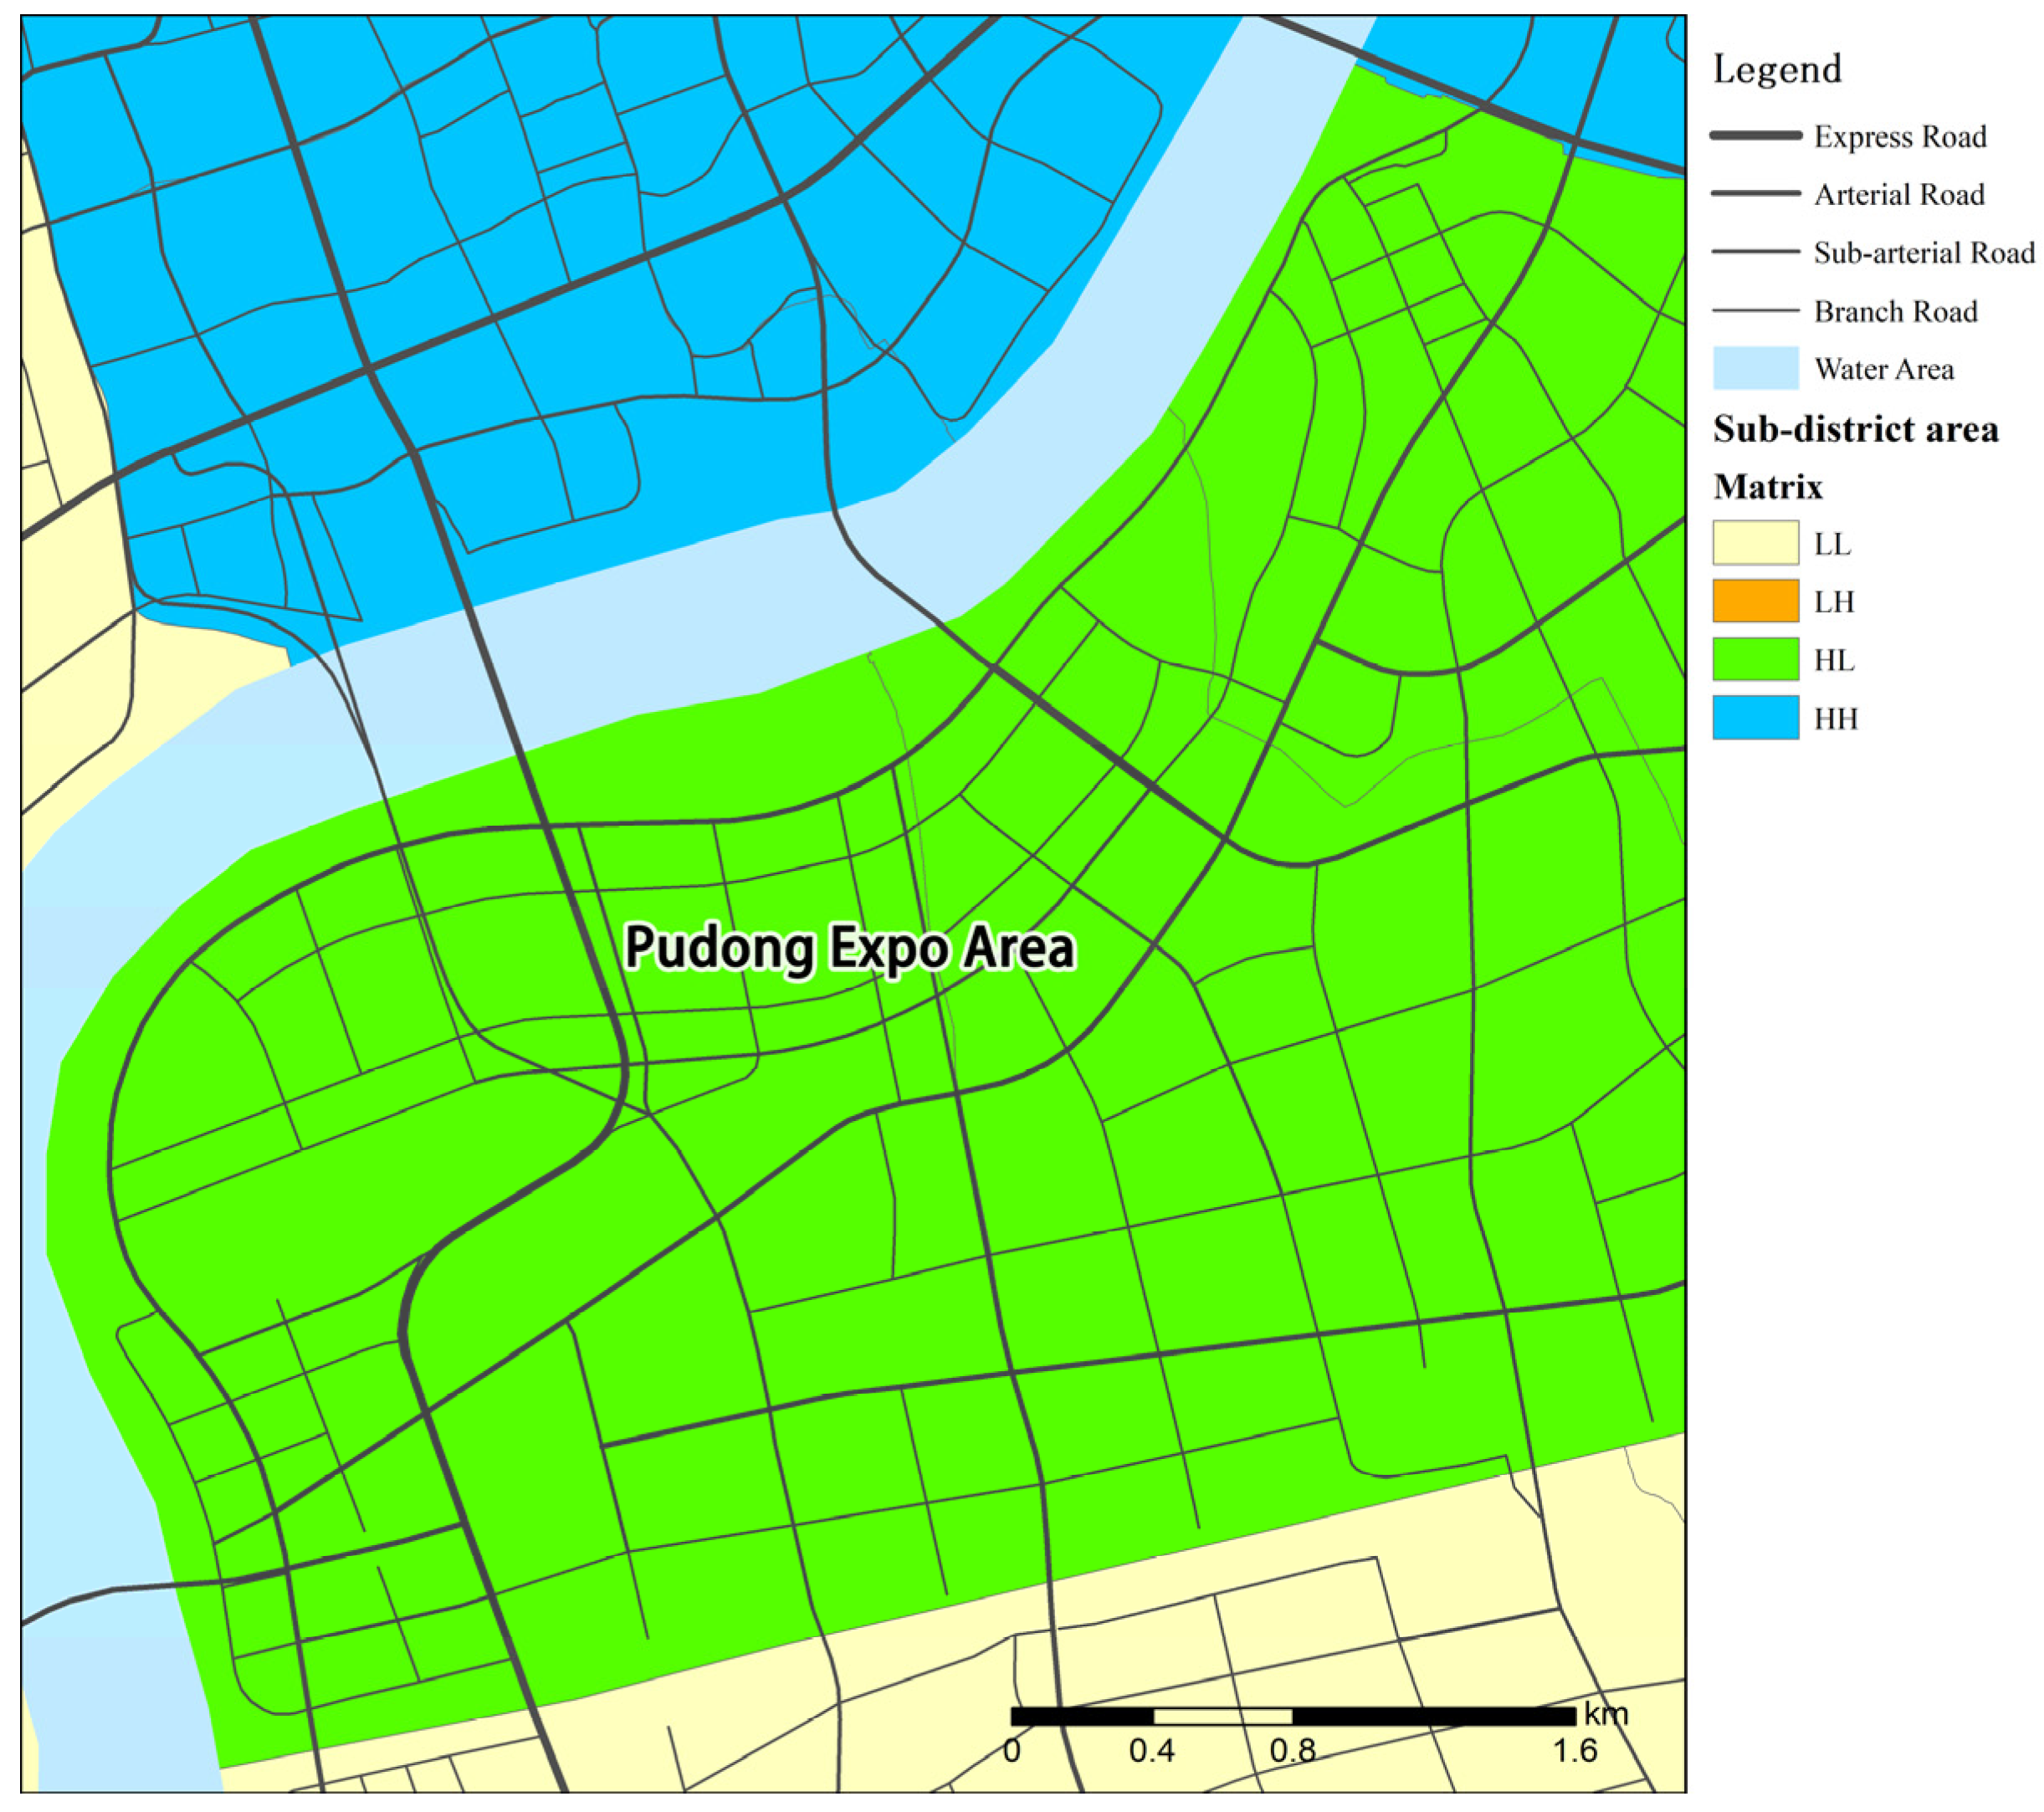
3.2.3. Pudong Expo Area
Pudong Expo is a typical “HL” area; that is, the road network conditions are suitable for bus transits, but the residential and employed population density are relatively low, and the layout of bus lines should be further optimized. Since the planning and construction of the road network structure in this area is relatively recent, the demand for low-carbon green transportation has been considered during the design stage, so the basic conditions of the road network structure are relatively suitable for low-carbon development. However, because this area is relatively new, there are many large public buildings and large parks and green spaces, and the density of permanent residents and employment is relatively low. Therefore, the potential of the road network structure in this area have not yet been fully released. More consideration can be given to the optimization of bus line layout and operation mode.
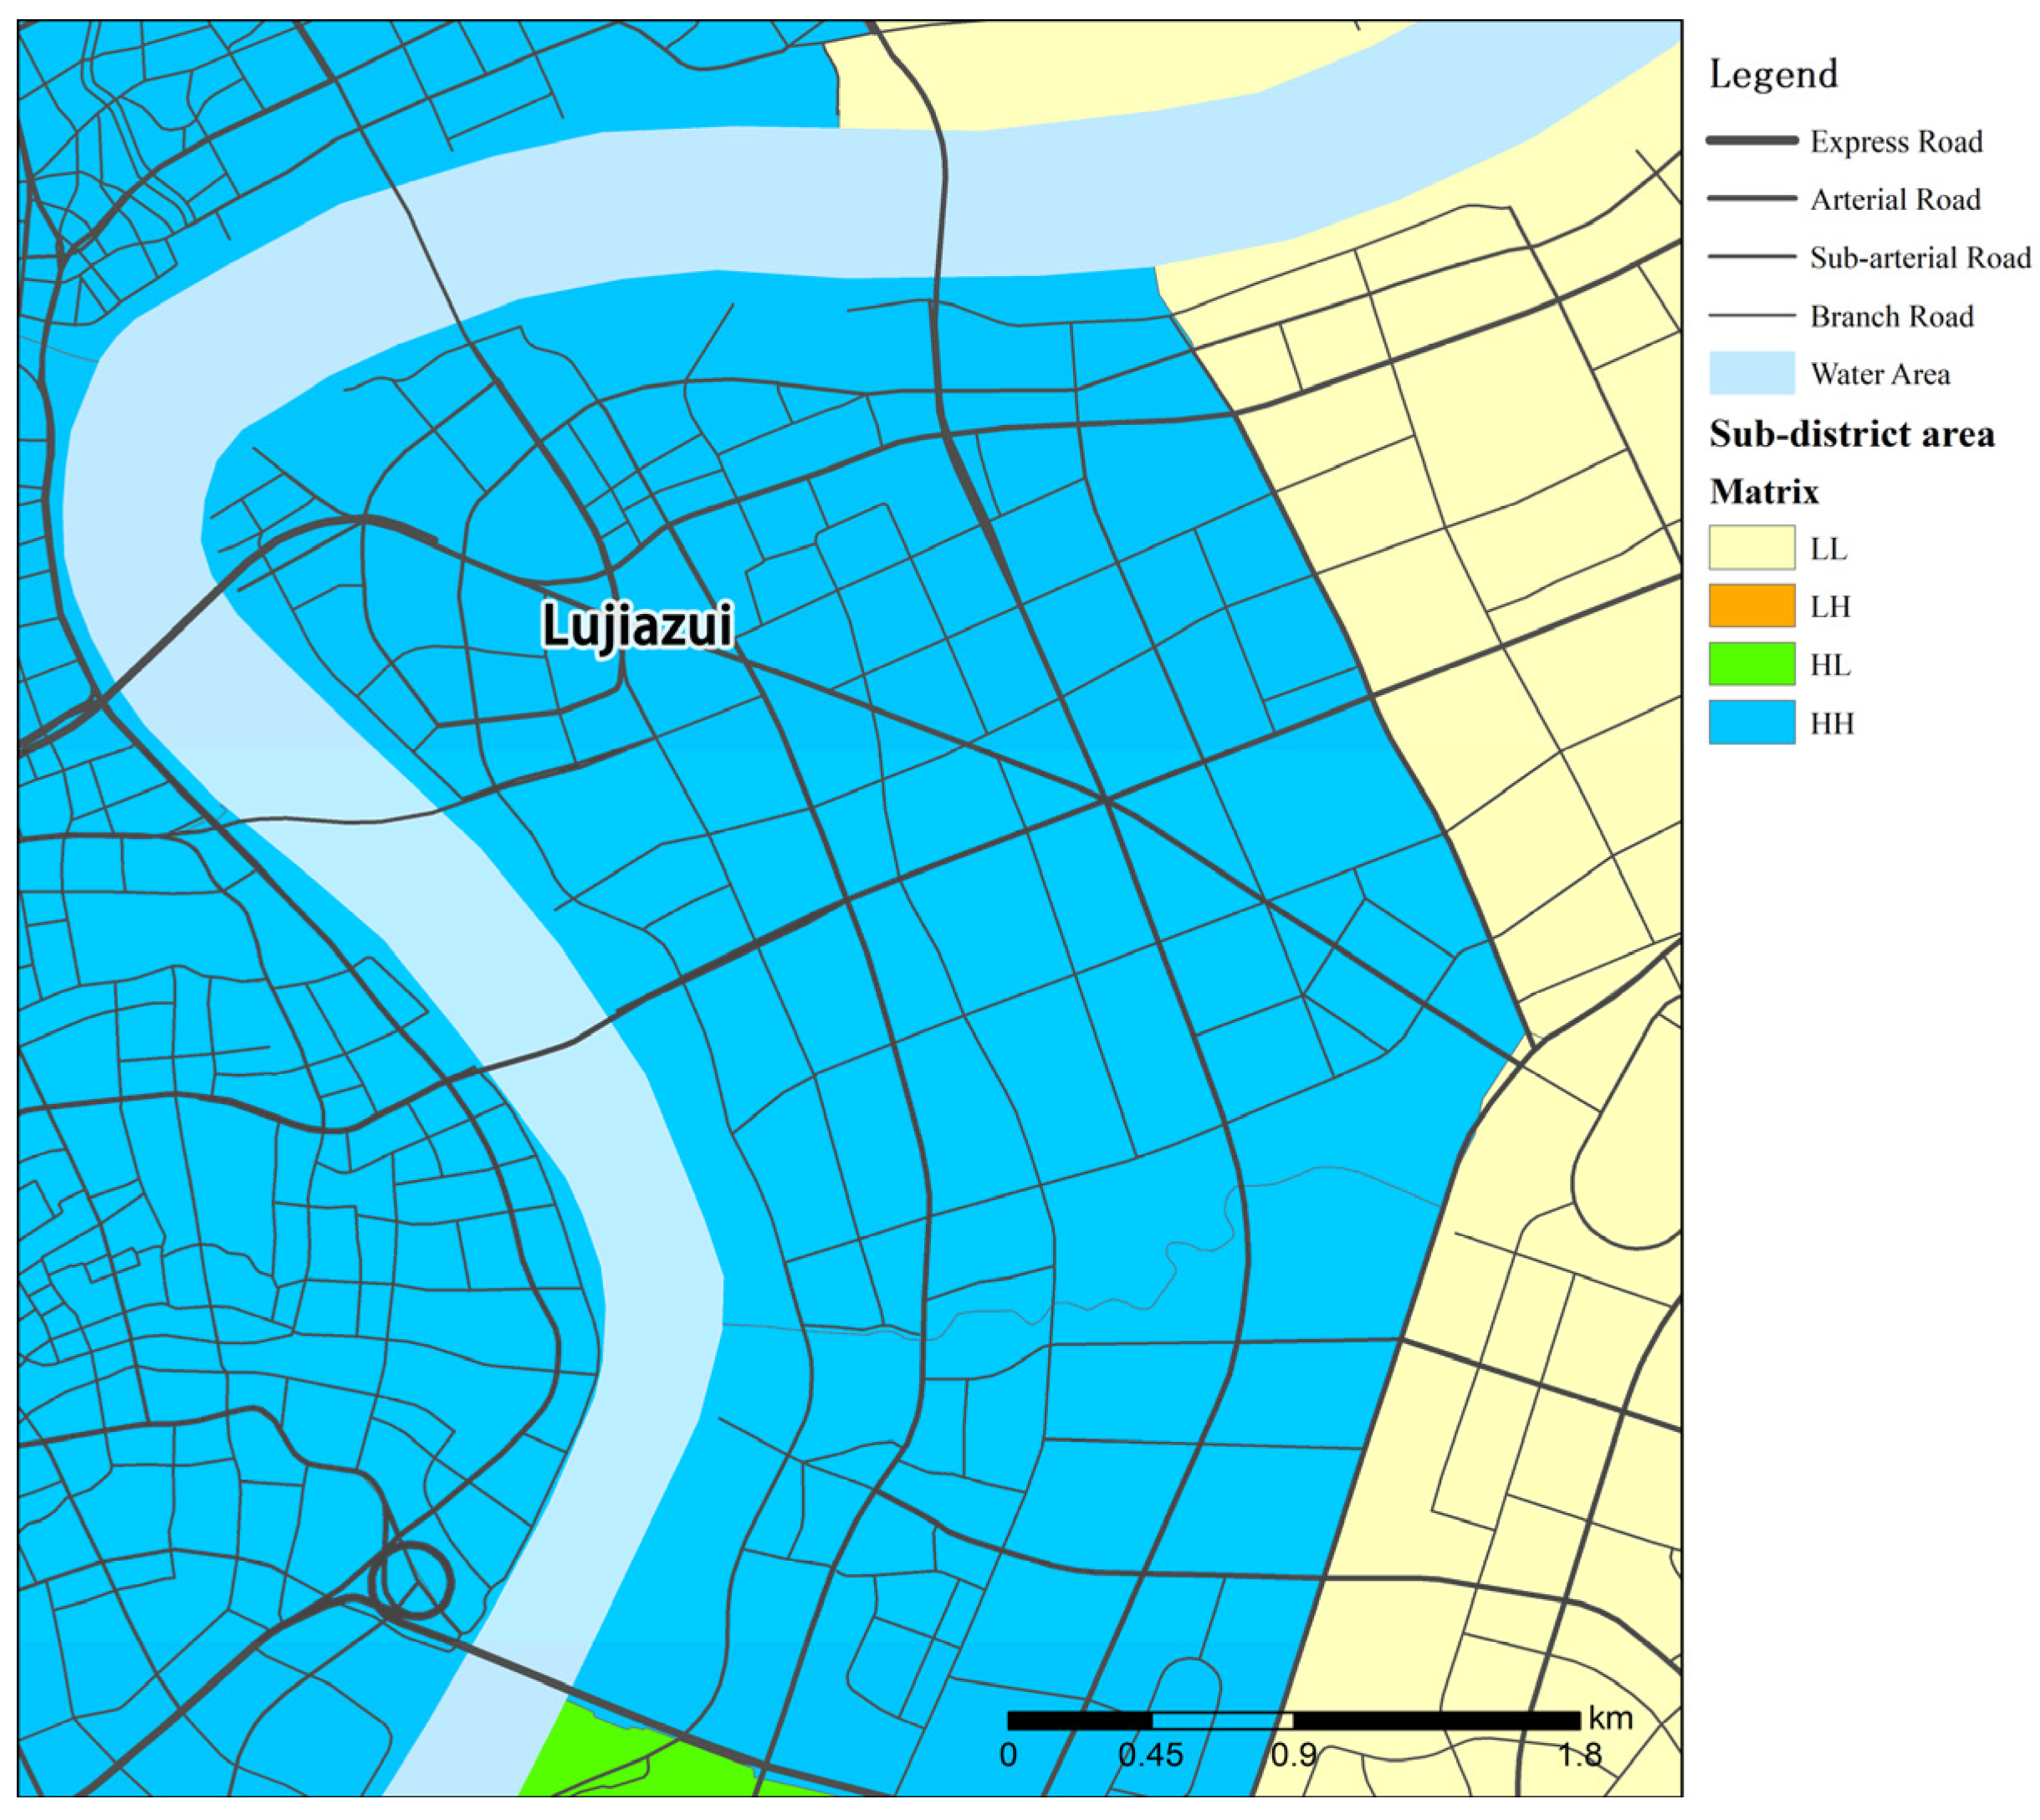
3.2.4. Lujiazui Area in Pudong
The Lujiazui area in Pudong is a typical “HH” area; that is, the road network conditions are suitable for bus transits, and the residential and employed population density is also high. The bus transits operating on ground roads cannot fully meet the needs of green transportation in this area. It is necessary to supplement high-capacity transit (urban rail transit) in this area, optimize the space friendliness for cycling and walking, and promote the coordinated development of various types of green transportation.
4. Discussion on the Optimization Strategy of Low-Carbon-Oriented Urban Road Network Structures
4.1. Formulating Strategies for Low-Carbon Development of Transportation According to Local Conditions
It is necessary to formulate strategies for the development of low-carbon transportation according to the characteristics of road network construction conditions, location, residential and employed population density, and leading functions in different regions of the central city. A useful attempt has been made through the matrix analysis method above. By comparing the relationship between LC(P) and DEN(P), suitable development strategies for different regions can be proposed, including supplementing high-capacity transit systems, optimizing the development of bus transits, optimizing road network construction conditions, appropriately encouraging car traffic, and other strategies. For some relatively complex areas, various measures can also be taken to promote the development of low-carbon transportation in this area.
4.2. Focusing on the Key Role of Intersection Form in Optimizing Topology
Topological structure characteristics are important factors that influence the performance of urban road networks. The layout and form of intersections are key factors that affect these characteristics. During the planning and construction of road networks, it is necessary to avoid the formation of T-shaped intersections on sub-arterial roads and above-level roads and to try to set up intersections where conditions permit. When comparing the road network structures of the “LH” region (
Figure 9 and
Figure 10) with the “HL” region (
Figure 11) and the “HH” region (
Figure 12), it can be observed that the proportion of T-junctions is significantly higher in the “LH” areas, making them relatively unsuitable for green traffic. Moreover, unless there are specific circumstances that require them, the construction of five-fork intersections and intersections with multiple road sections should be avoided. To optimize the construction conditions of roads, it is essential to supplement traffic management measures that can improve the traffic capacity of intersections, enhance the straightness and length of paths, and increase the suitability of road network structures for bus transits.
4.3. Improving the Accessibility Level of Road Sections with High Demand of Bus Transits
From the perspective of the topological network structure, centrality is a key indicator affecting the importance of nodes. For road sections, improving the betweenness index is often conducive to improving the accessibility of various traffic modes on the road section. Generally speaking, the road section with higher accessibility has a relatively high betweenness index. A road segment with higher accessibility means that more traffic trips may pass through it. Since bus transits are a mode of transportation that serves a group, improving the accessibility of road sections is more beneficial to promoting bus transit trips. Therefore, for some road sections that undertake multiple bus line layouts, their connectivity level should be improved as much as possible to become a hub node connecting other road sections in the road network. Conversely, for some road sections with relatively small bus transits demands, there is no need to place too much emphasis on improving connectivity.
4.4. Appropriately Increasing the Road Network Density in High-Density Areas
The density of the urban road network is also an important attribute that affects the development of green transportation. Relevant studies have proved that the low density of the road network is obviously not conducive to the development of various types of green transportation, including a bus transit, cycling, and walking. According to the existing research results, the road network density that is suitable for the development of green transportation should generally not be lower than 5 km per square kilometer, and for the corresponding homogeneous grid network, the average distance between intersections should be less than 400 m. For areas with a high density, such as public service agglomeration areas, commercial areas, and business office areas, it is especially necessary to ensure that the density of the road network is within a reasonable range.
4.5. Combining with Other Green Transportation Development Strategies
The urban road network is only a part of the comprehensive urban transportation network. Under the trend of low-carbon transportation development, it is also necessary to consider coordinated development with the urban rail transit network, the national railway transportation network, and the pedestrian transportation network to jointly promote an improvement in low-carbon transportation levels. For example, in the surrounding areas of complex hub stations, the density, shape, and hierarchical structure of urban road networks must fully respond to the needs of integrated transportation development. In the layout of bus stations and other facilities, the connection with the pedestrian traffic network must be considered so that the operational efficiency of the bus network can be better utilized.
5. Conclusions
The development of this research is based on the following general logic: (1) The characteristics of the urban road network structure affect the development of bus transit systems in the region. (2) Encouraging the development of bus transit systems is conducive to reducing carbon emissions. (3) Based on the orientation of bus transits, an evaluation of the urban road network structure, combined with the analysis of the development characteristics of the area where the road network is located, along with specific optimization countermeasures and suggestions, is provided to promote a reduction in carbon emissions.
Regarding the evaluation method for quantitative research on urban road network topology, this paper proposes an evaluation method for the low-carbon friendliness of an urban road network structure based on the value and value two-dimensional matrix. On this basis, the actual case of the central urban area of Shanghai was selected to conduct an empirical analysis on the evaluation of low-carbon friendliness in the road network structure, and the evaluation and analysis results were formed with the street (township) as the regional unit scale. The analysis results show that the low-carbon friendliness of the road network structure in different regions is significantly different due to the influence of road network structure characteristics, location, population distribution, and other factors. This paper asserts that, to a certain extent, it can support the proposal of low-carbon-oriented road network structure optimization countermeasures and suggestions. This study suggests that it is necessary to formulate low-carbon development countermeasures in the field of road transportation according to local conditions and, at the same time, pay more attention to the low-carbon orientation of structural characteristics in road network during the planning and design stage.
The applicable objects of this study were mainly the high-density urban areas of large cities. This is because the development of a bus transit in high-density urban areas has great economic and social benefits, and has a significant effect on reducing carbon emissions. For suburbs or small cities, the density of population and employment is low, and people rely more on individual transportation such as cars for travel, and the comprehensive benefits of bus transit are not obvious.
This study has limitations. The research focused on the bus-oriented road network structure and guided the optimization of the road network structure from the bus-priority route. The discussion of other green transportation methods has not yet been considered. In fact, the structural characteristics of the road network will also affect traffic behaviors such as cycling and walking. A slow traffic network is also an important part of the network space on urban roads. Therefore, this study’s consideration of the low-carbon orientation of the road network structure is not comprehensive enough.
Future research could explore the following aspects. First of all, the low-carbon friendliness of a bus transit should be expanded to all kinds of green transportation, including walking and bicycles. Secondly, urban rail transit is an important component of green transportation in big cities. The coordination between the rail transit station setting and urban road network is an important factor affecting low-carbon friendliness, which needs to be properly considered in future research. Thirdly, on the basis of identifying the distribution characteristics of residence and employment, the influence of the network structure of work, residencies, and commuting should be incorporated into the analysis and evaluation model.


