Article

The Effect of Service Quality of Green Restaurants on Green Restaurant Image and Revisit Intention: The Case of Istanbul

1
Department of Tourism Management, Manavgat Tourism Faculty, Akdeniz University, 07600 Antalya, Turkey
2
Department of Gastronomy and Culinary Arts, Faculty of Fine Arts, Tokat Gaziosmanpaşa University, 60100 Tokat, Turkey
*
Author to whom correspondence should be addressed.
Sustainability 2023, 15(7), 5798; https://doi.org/10.3390/su15075798
Submission received: 11 February 2023 / Revised: 14 March 2023 / Accepted: 22 March 2023 / Published: 27 March 2023

Abstract

:
With the rise of environmental awareness, trends of avoiding food waste and reducing carbon emissions trends have generated green business opportunities for the food and beverage industry. In this industry, the competitive advantage provided by high service quality is an important factor. In this context, the effects of perceived service quality on green restaurants’ image and customers’ revisit intentions were investigated. Moreover, the effects of green restaurants’ image on revisit intention were discussed. The GRSERV scale was used to measure the service quality of green restaurants in İstanbul; a total of 356 questionnaires were collected. Partial least squares (PLS) path analysis showed that the perceived service quality by customers visiting green restaurant businesses has a positive impact on both green restaurant image and revisit intention. It has also been determined that green restaurant image has significant effects on revisit intention.

1. Introduction

The last few decades have witnessed significant innovation in the food and beverage industry, both in terms of businesses and products. Many factors, such as the increase in the number of businesses and variety of products, the effect of new marketing skills, and changes in customer expectations, have also enabled the diversification of businesses. Restaurants may establish a positive green brand image by incorporating sustainable practices into their operations [1,2]. Within this context, it can be stated that green practices are of great importance for the restaurant industry, because such activities increase both economic and environmental sustainability [3], providing a great competitive advantage in this sector [4]. Thus, restaurant owners can use sustainability to improve the image of their businesses [5], and increase customer demand by creating differences between their products and those of their main competitors [6].
Accordingly, the purpose of study is to specify both consumers’ perceptions of the images of green restaurants in İstanbul, and the service quality. The study also aims to explore both the effects of these variables on revisit intention, and how quality of service effects a restaurant’s green image. In addition, the study discusses sustainable gastronomy practices in restaurants, looking at them from different perspectives.
It Is known that customers’ perceptions of image and brand influence both their trust of a business and their revisit intention [7,8,9]. However, it is observed that there are limited previous studies on the images of green restaurants, and how image formation takes place [10,11]. For example, Shapoval et al. (2018) explain how restaurants use photographs of regional products and farmers, as well as regional furniture and regional products [11], to develop green images Similarly, Chen et al. (2015) have incorporated landscape gardening into the physical dimension of the Green Restaurant Service Quality scale [10]. Even though previous researchers have studied consumers’ behavioral intentions and preferences for restaurants [12], limited research has been devoted to the effect of service quality on green restaurants’ popularity within the scope of the current literature.
Recent research indicates that customers often tolerate lower quality when it comes to products with sustainable properties [13]. Hence, it is important to carry out studies that explore how the perceived service quality effects green image and customers’ revisit intentions; this study will apply previous literature regarding service quality within the context of green restaurants.
To structure and discuss the literature correctly, we created five areas of study: sustainable gastronomy, green restaurants, perceived service quality, green restaurant image, and revisit intention. Under the title of ‘sustainable gastronomy’, the concept of sustainability was discussed, and the question of why sustainability is important in the food and beverage industry was emphasized. In this context, information was given about green menus, green food, and sustainable diets. Under the title of ‘green restaurant’, green restaurants and practices were mentioned. Finally, based on the hypotheses of the research, information was given about variables of perceived service quality, image of green restaurant, and intention to revisit. In this context, under the title of ‘perceived service quality’, research and findings in the literature related to the hypothesis of the effect of perceived service quality on revisit intention are mentioned. In the image of green restaurant section, the relationship between the quality of service perceived by customer, and image of green restaurant, is discussed in the context of the relevant literature; its effects on quality of service perceived by customer, image of green restaurant, and green behavior intention are also discussed.
The contributions of the current study will be listed below. Firstly, we predict and test a new model consisting of perceived service quality, green restaurant image and revisit intention variables; this model goes further than early findings on customers’ revisit intention, green image, and service quality [1,14,15,16,17]. Secondly, the study focuses on the moderating effect of perceived service quality on the proposed relationships in the context of the research. Finally, this study will = examine innovative constructs with new variables. Though other studies of green restaurants also focus on the visible and recognizable aspects of green practices, including other dimensions, such as perceived quality, green restaurant image, and revisit intention, can help develop different perspectives related to customer perceptions of green restaurant practices.

2. Literature Review

2.1. Sustainable Gastronomy

Sustainability has been adopted globally as an important principle in the formulation and management of institutional policies regarding global warming and climate change since the publication of the 2005 Kyoto Protocol [18]. The increasing consumer desire for healthy and ecologically sustainable products [19] means that sustainability has become an important component of practices carried out in all areas of the industry [2,20]. The World Commission on Environment and Development has published a report highlighting tourism as a problematic sector in terms of over use of resources; the concept of sustainability has since become an issue to be considered in several related sectors [21]. One of these sectors is the food and beverage sector. Sustainable gastronomy is defined by Scarpato (2002) [22] as “food production activities that support environmentalist practices by providing individuals, their minds and bodies with beneficial nutritional opportunities”.
Chou et al. (2012) [18] base environmentalist practices in the tourism and food and beverage sectors around the concept of sustainability. In the literature, sustainable food is defined as food produced by contributing to the sustainable development of ecology, and giving priority to the welfare of animals [23]. As for sustainable menus, they include organic foods grown using non-toxic pesticides and fertilizers, and produced without genetic engineering [24]. In this regard, it can be expressed that green restaurants that include environmentally friendly goods and services, such as sustainable foods, sustainable diets and sustainable menus, are also considered to be sustainable [25].

2.2. Green Restaurants

Corporate social responsibility (CSR) and sustainability trends are driving many businesses to implement green marketing methods, such as developing goods and services to fulfill the needs of environmentally concerned consumers [26]. Environmental problems that arise with industrialization in developed and developing countries require that management professionals in many sectors adopt green practices that will cause the least harm to the environment, and practice the most appropriate strategic methods accordingly. In this context, green practices have become significant components of sustainability and profitability for restaurants, as the service industries are considered to be among the highest energy users [2].
Since 1990, the American Green Restaurant Association (GRA), by providing a certification for green restaurants, has promoted the implementation of green practices in restaurants [27]. These applications can be classed in the following dimensions: reuse and recycle applications, sustainability in food, energy efficient practices, buying green products, prevention of pollution, environment conservation, environmental health, using green goods, and designing buildings as green. According to Gilg et al. (2005) [28], restaurants should also focus on three Rs (reduce, reuse, recycle) and two Es (energy and efficiency) after implementing green practices. These applications minimize the social and environmental problems generated by the effects of restaurant operations, both directly and indirectly. In this sense, green restaurants have been defined by the industry as “food establishments committed to minimizing negative environmental impacts throughout their operation” [29]. However, Jang et al. (2011) [30] defined green restaurants as restaurants that prefer green practices, and use local and certified organic products in their menus.

2.3. Perceived Service Quality

Perceived service quality can be defined as the combination of customers’ evaluations of a business based on a comparison of customers’ requests or expectations with actual service received [31]. Therefore, perceived service quality can be defined as a function of the interaction between normative expectations, predictive expectations, and actual service quality [32]. Correlatively, restaurant customers’ perception of service quality is shaped as by their dining experiences and expected service evaluations [33]. Generally, restaurant customers rate the entire dining experience based on perceived quality [34].
Since the operational structures of green restaurants are different from other restaurant types, Chen et al. (2015) [10] developed the GRSERV scale. The GRSERV scale consists of the following 28 items and seven dimensions: assurance (three items), food quality (five items), tangible (six items), empathy (three items), reliability (three items), environmental-oriented services (five items), and responsiveness (three items). The seven dimensions used in the GRSERV scale are defined by researchers as follows [10]: ‘tangible’, whichcovers energy-saving facilities, appliances, and the building’s landscape architecture in restaurants; ‘reliability’, which refers to the reliable and accurate performance of the promised service in restaurants; ‘responsiveness’, which refers to the high effort required to assist customers in restaurants and to provide fast service; ‘assurance’, a method of food certification that refers to the ability and reliability of employees to communicate knowledge and skills; ‘empathy’, which expresses attentive, sensitive, and personalized relevancy in the restaurant; ’environmental-oriented services’, which covers the applications developed to protect the environment in relation to the services offered in the restaurant, and; ‘food quality’, which includes the design and presentation of the dishes on the menu [10].
Findings of different research indicate that customer satisfaction is highly influenced by perceived service quality [35,36,37]. Satisfaction is an important factor affecting customers’ revisit intentions [1]. Hussain (2016) [7] similarly tested the relationship between service quality, image, value, loyalty, and satisfaction in their research, finding that service quality is an important factor in creating positive behavioral intentions through satisfaction. On the other hand, while customers’ awareness of environmental problems makes them more conscious, the differences that have arisen with climate change in recent times allow customers to recognize more environmentally friendly restaurants, and have a strong perception, positive image, and attitude towards the greenness of the restaurants [1]. According to Riva et al. (2022) [15], when consumers perceive the food and service in a restaurant to be of high quality, they will want to visit that restaurant again. In the light of what has been expressed so far, the following hypothesis has been developed.
H2. 
Perceived service quality influences revisit intention.

2.4. Green Restaurant Image

Chen (2010) [38] defines green image as a set of consumer perceptions of a brand associated with its environmental commitment and concern within the framework of brand equity management. Likewise, green restaurant image consists of mental definitions that customers form in relation to their environmental commitment and concern for a particular restaurant. The brand’s name, as well as its commercials and whether it possesses a green certificate (which can be considered as tangible features of the image), are considered as the determining factors in the formation of green restaurant image [1].
Image is an important quality dimension that influences customer perception, as it operates as an indicator of good or bad service in the mind of the customer [39]. For example, Lai et al. (2009) [40] discovered that improved service quality promotes a positive corporate image, which in turn positively affects behavioral intention. In the context of the service industry, a positive corporate image was discovered to have a considerable beneficial influence on consumers’ behavioral intentions at Taiwan’s quick service restaurants [41]. As a result, it is argued in a number of studies [42,43] that green image has a significant effect on customers’ decision making processes and purchase intentions. However, the green features and practices of the restaurant may not be the only reason affecting customers’ decision making processes of a customer; the restaurant’s service factors, such as food quality, service quality and atmosphere, also have an active role in the decision making process of the customer [1]. In this context, the corporate image of a business is also considered as a mediator variable between service quality and revisit intention [44]. Moreover, a restaurant’s green image has a positive effect on consumers’ behavioral intentions [45]. Customers’ perceptions of green practices in terms of both environmental awareness and food, on the other hand, have a favorable influence on green restaurant image and green behavior intentions [1]. Therefore, based on the above literature review, the following hypothesis has been formulated.
H1. 
Perceived service quality influences green restaurant image.

2.5. Revisit Intention

The revisit intention of a restaurant is defined as a customer’s desire or decision to eat at the same restaurant again [46]. In this context, defining the underlying factors that affect the customer’s revisit intention is important to understanding the customer’s wishes and needs [8]. Robinot and Giannelloni (2010) [47] found that green practices are accepted as a “basic practice”, rather than a “plus” practice, by the guests. The research findings indicated that green practices contribute little to the increase in satisfaction when perceived positively by the guests; however, negative perceptions of these practices may result in serious dissatisfaction, which reduce the customer’s incentive to revisit.
The findings proposed by the study of Szuchnicki (2009) [8], on the other hand, show that customers expect certain environmentally friendly service practices when it comes to the ‘dining experience’. In this sense, within the scope of the research, it has been determined that the presence of environmentally friendly practices in restaurants positively influence customers’ revisit intention. According to many researchers in the field [37,48], perceived service quality and customer satisfaction are positively related concepts. At this point, it can be stated that high service quality will create satisfaction in customers, and this satisfaction influences their revisit intention.
Therefore, the following hypothesis has been formulated based on the discussed literature review.
H3. 
Green restaurant image influences revisit intention.

3. Materials and Methods
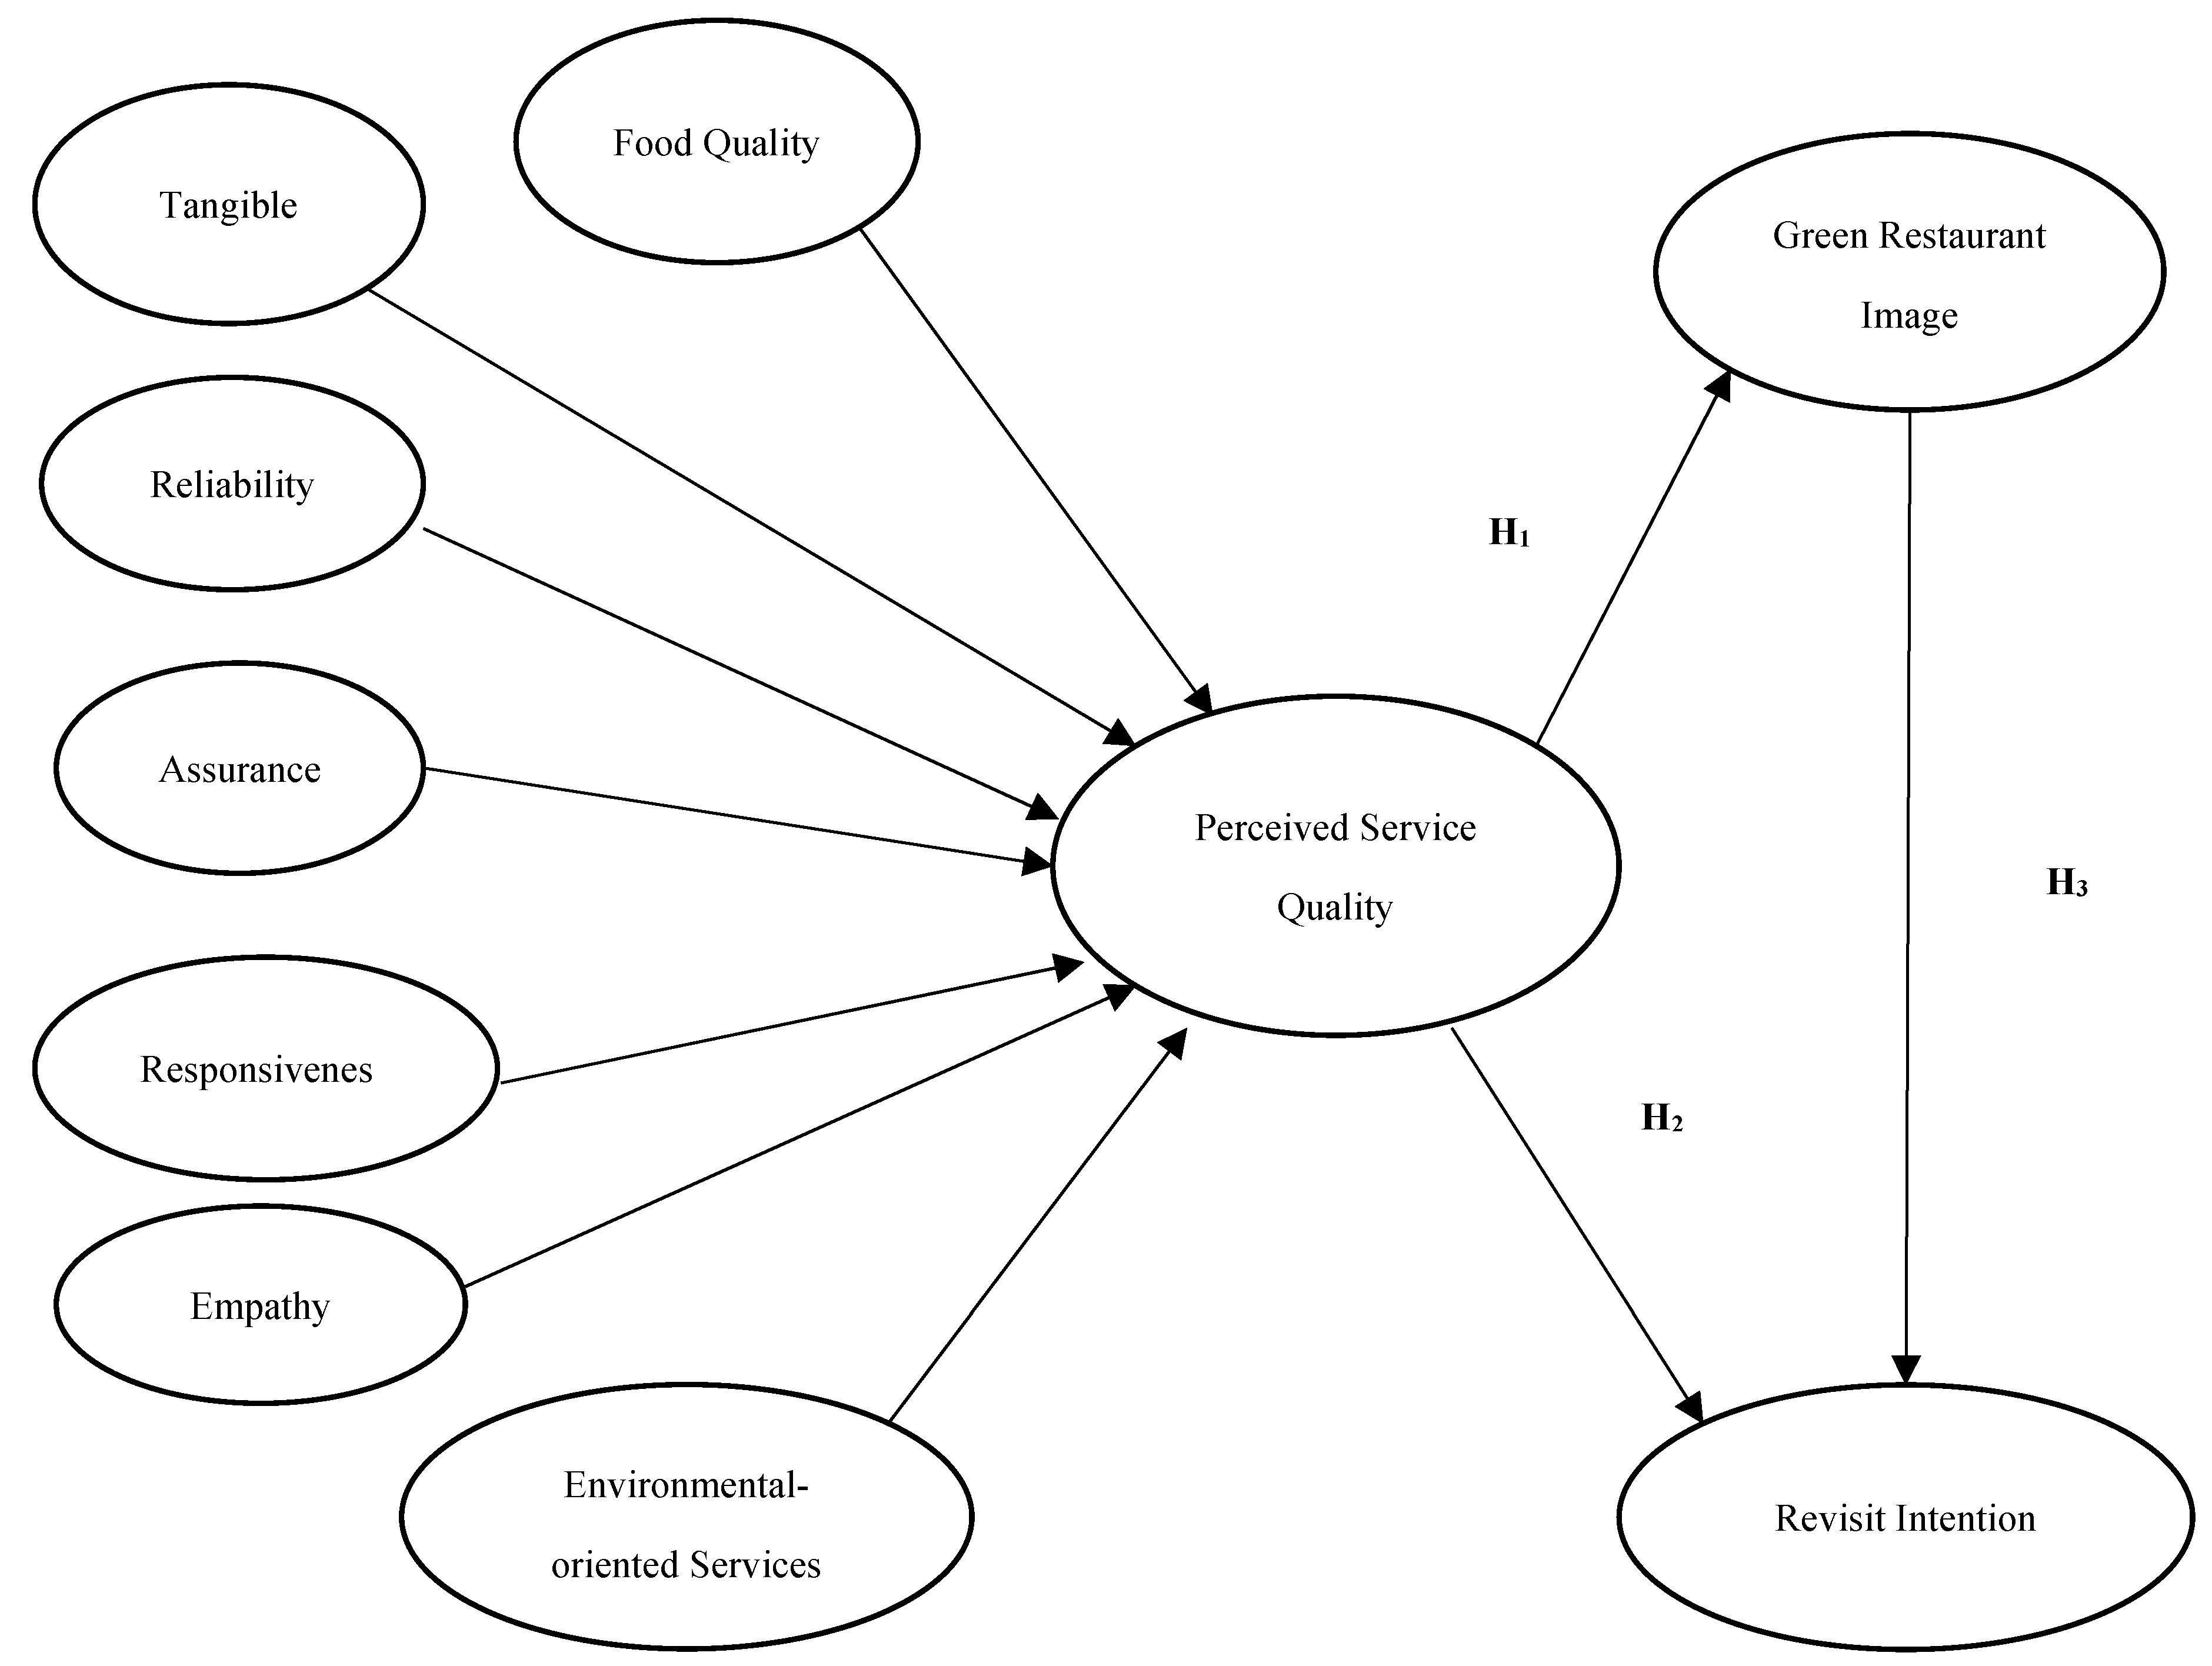
3.1. Research Model

The design of this applied field research study was causally structured. In line with the hypotheses in the literature section, the model of the research was developed as in Figure 1.

3.2. The Purpose of the Research and Research Variables

The businesses that include green practices in their processes have differentiated the service they offer; resultantly, GRSERV scale was developed with the assumption that a different scale was needed to measure the quality of the service provided by these businesses. The service quality of green restaurants affects customer satisfaction, customer loyalty, and brand awareness; it is possible to come across different studies in this area. The green image of restaurants is not only influenced by green practices, but also by various other factors. Hereby, the main purpose of this research was to examine the effects of the perceived service quality by the customers visiting the green restaurants in Istanbul on the green restaurant image and revisit intention. In addition, this research aims to examine the effects of green restaurant image on revisit intention.
Therefore, the studies in the related literature have been examined, with the scale used to determine the service quality offered by green restaurants in the context of sustainable gastronomy consisting of 7 dimensions: assurance, environmental-oriented services, tangible, empathy, reliability, responsiveness, and food quality; it also consisted of 28 items [10,36]. These items were adapted from the study conducted by Chen [10]. The five items used to measure the green restaurant image have been adapted from the studies of Low and Lamb (2000) [49] and Jeong et al. (2014) [1]; three items about the revisit intention dimension were taken from the scale used in the studies of Kim and Moon, and Ryu and Han [50,51].

3.3. Study Location, the Universe and Sample of the Study

The concept of sustainable gastronomy rose to prominence in tandem with the increased importance placed by consumers on consuming healthy food since the outbreak of COVID-19 pandemic. Istanbul, with a population of more than 15 million, has internalized the concept of sustainable gastronomy, and has a strong gastronomic culture for hosting green restaurant businesses. The green generation restaurant movement was put into practice through the cooperation of Boğaziçi University, the World Wildlife Fund (WWF), and the Tourism Restaurant Investors-Operators Association, as well as the support of Unilever Food Solutions. The green restaurant movement has aimed to be sustainable and raise awareness in customers by introducing environmentally friendly approaches. The motivation underlying this movement is to avoid excessive consumption and deterioration of natural balance. In green restaurants, waste rates are reduced, the resulting wastes are recycled, and energy efficiency is increased to the maximum level. There are presently six green restaurants in Istanbul.
The reason why the research specifically covered Istanbul restaurants is that Istanbul is one of the most important destinations in Turkey, in terms of both touristic and gastronomic aspects. Moreover, with its 15.8 million population, Istanbul is Turkey’s largest city [52]. According to the Istanbul Directorate of Culture and Tourism’s 2021 tourism statistics, 9 million foreign tourists visited Istanbul in 2021 [53].
The focus of research is the customers of green restaurant businesses in Turkey. The customers coming to green restaurant businesses in Istanbul were selected as a sample, as Istanbul is home to the highest number of green restaurant businesses in Turkey. According to data from 2020, İstanbul was home to 151 first-class restaurants that have ’the Ministry of Culture and Tourism Operation Certificate’, and four first class restaurants that have the ’the Ministry of Culture and Tourism Investment Certificate’ [54].
The survey was conducted face-to-face by one of the authors and an interviewer, who was informed in detail about the purpose of the research; interviews took place between the dates of 1 April-1 July, 2021 and by included people visiting the restaurants in İstanbul. In addition to this, to reach more participants, the questionnaire was also made available online, taking into account the concepts of time and cost. We included the consumers who purchased services from green restaurants in the research by either sending them the QR-code links to the questionnaires via the internet, or giving the QR codes directly to them. A survey link was sent to the customers who stated that they purchased service from green restaurants and shared this on social media platforms. As a result, 390 questionnaires were collected within the scope of the research; 34 incomplete and incorrectly filled questionnaires were not evaluated, while the remaining 356 questionnaires were evaluated. A sample size of at least 300 respondents was targeted in line with the requirements of structural equation modeling, which is the main data analysis technique used in this study [55]. Therefore, it can be stated that the 356 questionnaires collected for this research were considered sufficient for the sample.

3.4. Data Collection and Analysis Method

The questionnaire used to collect data in the research consisted of two sections. In the first section, customers who received a service from green restaurants were asked to respond to 36 items with a 5-point Likert scale. In the second section, five questions are asked regarding the customers’ gender, age, occupational status, marital status, and educational status.
In the study, a validity, reliability, and measurement model (CFA-Confirmatory Factor Analysis), and path analyzes, were carried out using PLS-SEM (Partial Least Squares Structural Equation Modeling). We used these techniques to examine the effects between the variables of perceived service quality of green restaurants, green restaurant image, and revisit intention.

4. Results

4.1. The Demographic Characteristics of Participants

56.2% of the participants are male and 43.8% are female. More than half of the participants (59.6%) are undergraduates, 27.2% of them are pre-high school graduates and 13.2% of them have a master’s degree. It has also been determined that 61.2% of the participants are married and 38.8% are single. 47.8% of the participants are in the 18–24 age range, 31.7% are in the 25–34 age range, and 20.5% are at least 35 years old. When the occupational status of the participants is analyzed, it is observed that almost half of them (44.7%) are private sector workers. The distribution of the other occupations is as follows: managers are 5.9%, business owners are 12.1%, white collar workers are 20.8%, not working/retired people are 14.0%, and other employment statuses are 2.5%. In the light of these findings, it is understood that the people who participated in the research are mostly young, female, undergraduate students, and private sector workers.

4.2. Validity and Reliability Analysis

PLS-SEM consists of two elements: the measurement models of structures that show the relationships between structures and indicator variables, and; a structural model that represents structures [56]. The measurement model is used to test the accuracy of the measurement. The measurement model can also be referred to as CFA analysis. The basic criteria used while testing the measurement model are convergent validity, internal consistency reliability, and discriminant validity.
To evaluate the overall reliability of the study, composite reliability (CR) values were examined for Cronbach’s alpha values and internal consistency reliability. Standardized factor loading and average variance extracted (AVE) scores were used to determine the convergent validity. Standardized factor loads should be above 0.60, Cronbach’s Alpha values and CR value should be above 0.70, and AVE value should be both above 0.50 and greater than CR > AVE [56]. Table 2 contains the necessary information about Cronbach’s Alpha, internal consistency reliability, and the convergent validity of the structures used in the research.
In the measurement model, after providing internal validity, the suitability of convergent and discriminant validity is analyzed. For convergent validity, standardized factor loads, t-values, and significance of t-values and AVE scores are checked. As seen in Table 1, there are standardized factor loadings, t-values, and AVE scores. Accordingly, it is observed that standardized factor loadings are above 0.70 and, as for the t-values, they are well above 2.56 [56]. At the same time, t-values are significant at the level of α = 0.001, and all dimensions in the measurement model have AVE scores above 0.50. Given these results, it can be expressed that convergent validity has been achieved.
The measurement model consists of nine latent variables and 36 observed variables. As a second-order latent structure, the perceived service quality variable has been turned into a latent structure by combining seven latent variables (assurance, empathy, tangible, responsiveness, food quality, reliability and environmental-oriented services). Explaining the second-order latent structure through an example is considered to be important to understanding the subject as a whole. To create a second-order latent construct, there must be at least three latent variables (first-order factor) and two propositions for each latent variable [56].
By viewing Table 2, it can be understood that the variable with the highest arithmetic average is the reliability variable as X ¯ = 3.72, while the variable with the lowest arithmetic average is the green restaurant image variable as X ¯ = 3.40. On the other hand, when the arithmetic averages are examined in detail, it is possible to state that the arithmetic averages of all variables are high. Nevertheless, it is clear that the participants paid closer attention to the reliability dimension than the other variables, and considered the green restaurant image less frequently.
Criteria designed by Fornell and Larcker were used to evaluate discriminant validity [57]. According to the [57] criteria presented in Table 2, the square root of the AVE scores in the study should be higher than the correlations between the other variables in the study [58]. The results found according to the Fornell and Larcker criteria in Table 2 prove that the discriminant validity has been provided.
After the discriminant validity was provided, the research model was examined in terms of multicollinearity problems. In this direction, VIF (variance inflation factor) values have been taken into account regarding whether there is a multicollinearity problem for the variables. Having considered all VIF values, it was revealed that the study did not have a multicollinearity problem, as all of the variables (except two items belonging to the food quality variable) were observed within the recommended threshold value range (2 < VIF < 5) [56]. On the other hand, VIF values for the two items belonging to the food quality variable were kept in the model because they were slightly above the recommended value of five in some studies and below VIF < 10 [59].
Through the results obtained, the validity and reliability, along with the structural validity of the model, have been ensured. After determining that the model is compatible with all these values, the research hypotheses formed within the context of the research model have been tested.

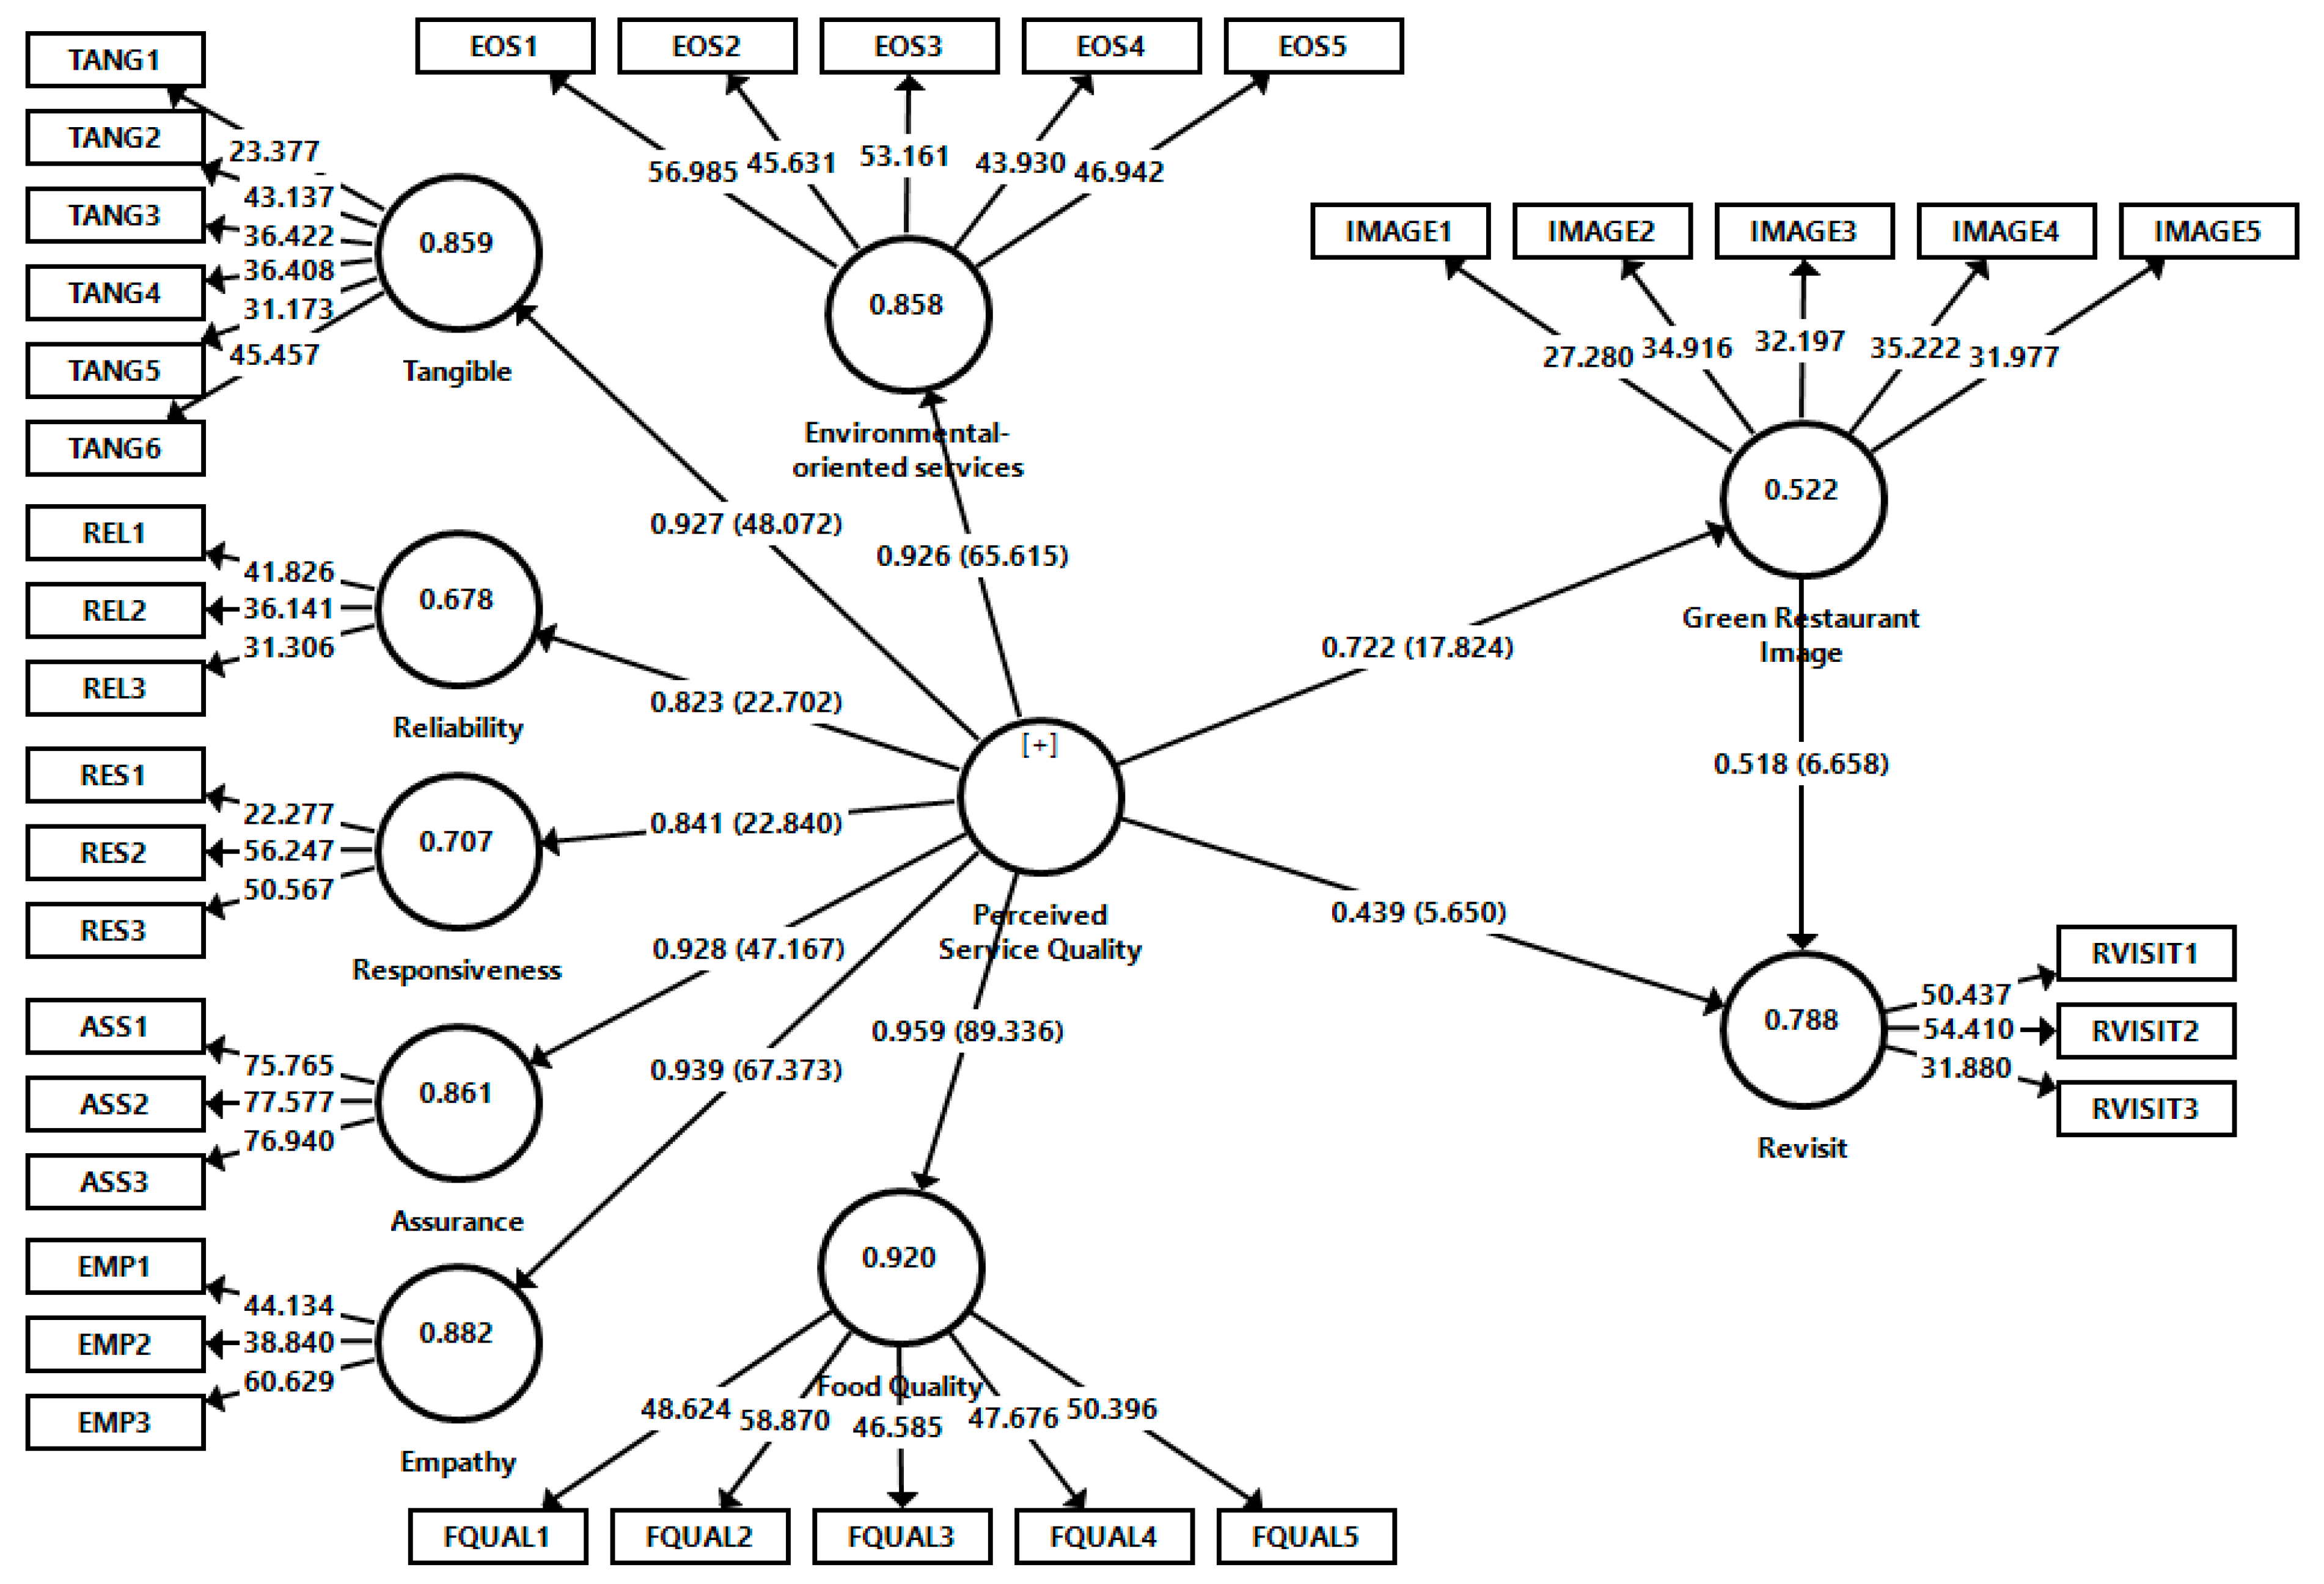
4.3. The Analysis of the Structural Model

To test the research hypotheses, the model formed in Figure 2 has been analyzed using PLS-SEM. PLS-SEM estimates the latent variables in the model, and the relationships between explanatory variables and latent variables, using simple and multiple regression methods [60]. With the purpose of calculating the t-values that were used to evaluate the significance of the PLS path coefficients, 5000 sub-samples were taken from the sample; bootstrapping analysis was performed.
Table 3 contains the results of the hypotheses formed through the research model. This model shows whether or not the established relationships are supported by the model. It has been determined that perceived service quality significantly affects green restaurant image (β = 0.722; t = 18.301; p < 0.001) and revisit intention (β = 0.439; t = 5.682; p < 0.001). It has also been determined that green restaurant image has a significant influence on revisit intention (β = 0.439; t = 5.682; p < 0.001). In this context, H1, H2, and H3 have been accepted. It is observed that the t-values of the standardized (β) coefficients of all these accepted hypotheses are at 95% confidence level and greater than 1.96. Besides the direct influences of perceived service quality and green restaurant image on revisit intention, perceived service quality and green restaurant image also have indirect effects on revisit intention (β = 0.374; t = 6.654; p < 0.01).
As a result of the structural model analyzes carried out within the scope of PLS-SEM, R2 values have revealed the in-sample explanatory power of the model [61]. While these R2 values are between zero and one, high values that are close to one indicated that the model has a high explanatory power. The 0.75, 0.50 and 0.25 threshold values of the R2 value have accepted as indicators of strong, medium, and weak explanatory power, respectively [62]. When the R2 values expressing the explanatory power of the antecedent variables on each structure are analyzed, it became clear that green restaurant image is explained at a moderate level with a value of 0.522, while revisit intention is explained at a high level with a value of 0.788.

5. Discussion

A healthy life cycle can only be achieved through the efficient and appropriate use of natural resources. The destruction of forests, as well as the damage caused by greenhouse gases in the atmosphere and climate change that subsequently emerges, have threatened humans’ chances of living in a sustainable cycle. The concept of sustainability, which is believed to have many economic and ecological benefits, has become a priority in many countries. In recent years, as this emphasis on alternative, innovative and sustainable practices become apparent, green restaurant businesses have started to emerge.
The services offered by green restaurant businesses have satisfied customers’ sustainability concerns, and encouraged increased revisit intention. This study operated under the assumption that the image of green restaurants impacts the perceived service quality and revisit intentions of customers. The study focused on both the relationships between perceived service quality and sub-dimensions of green restaurant businesses, and the relationships between a green restaurant image’s and revisit intention.
According to our results, perceived service quality has a positive effect on green restaurant image and revisit intention. The findings of this research are consistent with the conclusions of previous studies that investigated the effect of perceived service quality on green restaurant image and revisit intention [15,16]. For example, Yu et al. (2018) [16] determined how the food-, service-, and ambience-related features of green restaurants influenced whether they met customers’ expectations regarding restaurant quality; these researchers also studied the kind of impact service quality in green restaurants had on the revisit intentions of customers. The research results have indicated that meeting customers’ expectations regarding the food quality, service, and ambiance has a positive effect on customer continuity for green restaurants. Similarly, Riva et al. (2022) [15], by introducing the concept of green perceived quality, tried to determine how green consumerism and green perceived quality effected customers’ revisit intention. In the study, green perceived quality was defined as the evaluation of the quality and excellence of a product by customers with regard to environmentalist practices. The results of the research have suggested that green consumption and perceived green quality have a positive effect on revisit intention.
Current research results have also demonstrated that perceived service quality positively affects green restaurant image. In this sense, it has been observed that the findings of this study disagree with the research results of Han and Kim [17]. The researchers evaluated the factors, such as service quality, green image, and customer satisfaction, in their study to determine customers’ intention to revisit an environmentally friendly hotel. The findings proposed by Han and Kim (2010) [17] reveal a positive relationship between service quality, green image, customer satisfaction, and revisit intention.
In various aspects, the results of our study mirror the research findings of Park et al. (2021) [63]. In their research, Park et al. [63] determined that, as a measurement of service quality, the green restaurants with green certificates should have high certification and green certification periods of longer duration. Accordingly, as the results of this study indicate, the perceived service quality positively affects green restaurant image. On the other hand, it is observed that the findings of this study disagree with the research findings of Namkung and Jang (2013) [2]. In that study, Namkung and Jang [2] examine the relationship between three different elements of brand equity (perceived quality, green brand image and behavioral intentions). According to the results of the research, while green practices are an important determinant of restaurant quality, they are less important than food, service, and atmosphere; the latter three factors constitute the key elements of perceived quality in terms of restaurant quality.
Another important result obtained from the study is that green restaurant image has increased the revisit intention of customers. As a result of this reality, green restaurants with positive image increase customers’ revisit intention and their customers become more loyal. This finding is in line with the research findings of Jeong and Jang (2010) and Nguyen et al. (2001) [1,9]. Both researchers investigate whether green practices in the hospitality industry have a strong effect on business image and the behavioral intentions of customers. The research results suggest that customers’ perceptions regarding green practices have a positive effect on the restaurant’s green image and the behavioral intentions of customers concerning the restaurant. Similarly, Jeong et al. (2014) [1] analyzed the relationships between customers’ perceived green practices, a restaurant brand’s perceived green image, and attitudes towards restaurant brands in their research; they then tried to identify the main factors affecting customers’ green image perceptions. It is observed that the results of the research overlap with the findings of both Jeong and Jang (2010) [14] and this research. As the findings suggest, although customers’ perceptions regarding green practices do not have a direct effect on their attitudes about the restaurant, they do have an indirect effect on a green’s restaurant image. In this sense, the results of the research indicate that positive customer perceptions of green practices in turn positively affect the green image of a restaurant; they also and indirectly affect customers’ attitude to the restaurant in a positive way.
In another study [8], Szuchnicki presents similar findings to those of the current research; both studies discuss the relationship between the revisit intention of customers and green practices in the restaurant sector. The results of the research show that certain green practices increase customers’ desire to revisit. In addition, it is observed that the research findings of Robinot and Giannelloni (2010) [47] are similar to the results of this study in one aspect, but diverge from the research in another aspect. Unlike our research findings, the findings of Robinot and Giannelloni [47] suggest that green practices contribute little to the increase in satisfaction when perceived positively by guests. However, the finding that negative perceptions of these practices by customers may result in serious dissatisfaction, and this dissatisfaction will deter customers from revisiting, is in line with the current research results.

6. Conclusions, Implications, Limitations and Future Research

Research findings indicate that a restaurant’s green image, as perceived by its customers, may be greatly influenced by the perceived service quality received by customers. In this context, managers must take into account the company’s resources and maximize the quality of attainable green practices, as these factors give customers the greatest positive behavioral intention towards the company. For this reason, while developing a green image, managers should consider green practices with environmentalist dimensions. Green plants should be grown around the green restaurant, while menus, napkins, and packaging materials must be made of environmental protection materials. In addition, the toilet, taps, and sink of a restaurant must be used sustainably to save water. To creating a green image and apply green practices correctly, the green restaurant must not only be interested in profit, but also in consumers’ wellbeing and the environment. For this reason, green restaurants should use more organic food than general restaurants, and green restaurant employees should take care to protect the environment. Additionally, our findings show that green restaurants’ food and service should follow environmental protection practices. For examples, natural foods should be offered by the green restaurant. The calories, nutritional value, and origin of food should usually be presented on the menu.
The results also indicate that perceived service quality, green restaurant image, and willingness to revisit the restaurant, have positive effects on consumers’ evaluation of green restaurant practices. This finding shows that customers’ evaluation of the green restaurant’ image is an important determinant of their intention to become regular customers of green restaurants. Based on these research findings, restaurant management teams should generate more influential green strategies and images, as ever-increasing numbers of people feel concerned about a restaurant’s sustainability.
Despite its contributions to theoretical and managerial implications of operating green restaurants, the research has certain limitations that need to be addressed. The findings obtained in this research are limited to the customers who visited the green restaurant in Istanbul over a certain period. For this reason, in future studies, comparisons could be made by ensuring the participation of green restaurant customers located in different cities and countries. The research topic can also be expanded to include various concepts related to the quality of service offered by green restaurant businesses, such as customer satisfaction, customer loyalty, sustainable technology, and service innovation. Lastly, future researchers could further investigate sustainable gastronomy and the service quality of restaurant businesses with other scales through PLS-SEM.

Author Contributions

Conceptualization, R.E., A.U. and A.A.; methodology, A.U.; software, A.U.; validation, R.E. and A.A.; formal analysis, R.E. and A.U.; investigation, R.E., A.U. and A.A.; resources R.E., A.U. and A.A.; data curation, R.E., A.U. and A.A.; writing—original draft preparation, R.E. and A.A.; visualization, R.E. and A.U.; writing—review and editing, R.E., A.U. and A.A.; supervision, A.U. and A.A. All authors have read and agreed to the published version of the manuscript.

Funding

This research received no external funding.

Institutional Review Board Statement

Not applicable.

Informed Consent Statement

Not applicable.

Data Availability Statement

Not applicable.

Conflicts of Interest

The authors declare no conflict of interest.

References

  1. Jeong, E.; Jang, S.; Day, J.; Ha, S. The Impact of Eco-Friendly Practices on Green Image and Customer Attitudes: An Investigation in a Café Setting. Int. J. Hosp. Manag. 2014, 41, 10–20. [Google Scholar] [CrossRef]
  2. Namkung, Y.; Jang, S.C.S. Effects of Restaurant Green Practices on Brand Equity Formation: Do Green Practices Really Matter? Int. J. Hosp. Manag. 2013, 33, 85–95. [Google Scholar] [CrossRef]
  3. Han, H. Theory of Green Purchase Behavior (TGPB): A New Theory for Sustainable Consumption of Green Hotel and Green Restaurant Products. Bus. Strategy Environ. 2020, 29, 2815–2828. [Google Scholar] [CrossRef]
  4. Hussain, I.; Mu, S.; Mohiuddin, M.; Danish, R.Q.; Sair, S.A. Effects of Sustainable Brand Equity and Marketing Innovation on Market Performance in Hospitality Industry: Mediating Effects of Sustainable Competitive Advantage. Sustainability 2020, 12, 2939. [Google Scholar] [CrossRef] [Green Version]
  5. Dhir, A.; Talwar, S.; Sadiq, M.; Sakashita, M.; Kaur, P. Green Apparel Buying Behaviour: A Stimulus–Organism–Behaviour–Consequence (SOBC) Perspective on Sustainability-oriented Consumption in Japan. Bus. Strategy Environ. 2021, 30, 3589–3605. [Google Scholar] [CrossRef]
  6. Assaker, G. The Effects of Hotel Green Business Practices on Consumers’ Loyalty Intentions: An Expanded Multidimensional Service Model in the Upscale Segment. Int. J. Contemp. Hosp. Manag. 2020, 32, 3787–3807. [Google Scholar] [CrossRef]
  7. Hussain, R. The Mediating Role of Customer Satisfaction: Evidence from the Airline Industry. Asia Pac. J. Mark. Logist. 2016, 28, 2. [Google Scholar] [CrossRef]
  8. Szuchnicki, A.L. Examining the Influence of Restaurant Green Practices on Customer Return Intention. UNLV 2009, 155. [Google Scholar] [CrossRef]
  9. Nguyen, N.; Leblanc, G. Corporate Image and Corporate Reputation In Customers’ Retention Decisions in Services. J. Retail. Consum. Serv. 2001, 8, 227–236. [Google Scholar] [CrossRef]
  10. Chen, C.-T.; Cheng, C.-C.; Hsu, F.-S. GRSERV Scale: An Effective Tool for Measuring Consumer Perceptions of Service Quality in Green Restaurants. Total Qual. Manag. Bus. Excell. 2015, 26, 355–367. [Google Scholar] [CrossRef]
  11. Shapoval, V.; Murhpy, K.S.; Severt, D. Does service quality really matter at Green restaurants for Millennial consumers? The moderating effects of gender between loyalty and satisfaction. J. Foodserv. Bus. Res. 2018, 21, 591–609. [Google Scholar] [CrossRef]
  12. Lavuri, R. Extending the Theory of Planned Behavior: Factors Fostering Millennials’ Intention to Purchase Eco-Sustainable Products in an Emerging Market. J. Environ. Plan. Manag. 2022, 65, 1507–1529. [Google Scholar] [CrossRef]
  13. Skard, S.; Jørgensen, S.; Pedersen, L.J.T. When Is Sustainability a Liability, and When Is It an Asset? Quality Inferences for Core and Peripheral Attributes. J. Bus. Ethics 2021, 173, 109–132. [Google Scholar] [CrossRef] [Green Version]
  14. Jeong, E.; Jang, S. Effects of Restaurant Green Practices: Which Practices Are Effects of Restaurant Green Practices: Which Practices Are Important and Effective? Caesars Hospitality: Las Vegas, NV, USA, 2010. [Google Scholar]
  15. Riva, F.; Magrizos, S.; Rubel, M.R.B.; Rizomyliotis, I. Green Consumerism, Green Perceived Value, and Restaurant Revisit Intention: Millennials’ Sustainable Consumption with Moderating Effect of Green Perceived Quality. Bus. Strategy Environ. 2022, 31, 2807–2819. [Google Scholar] [CrossRef]
  16. Yu, Y.; Luo, M.; Zhu, D. The Effect of Quality Attributes on Visiting Consumers’ Patronage Intentions of Green Restaurants. Sustainability 2018, 10, 1187. [Google Scholar] [CrossRef] [Green Version]
  17. Han, H.; Kim, Y. An Investigation of Green Hotel Customers’ Decision Formation: Developing an Extended Model of the Theory of Planned Behavior. Int. J. Hosp. Manag. 2010, 29, 659–668. [Google Scholar] [CrossRef]
  18. Chou, C.-J.; Chen, K.-S.; Wang, Y.-Y. Green Practices in the Restaurant Industry from an Innovation Adoption Perspective: Evidence from Taiwan. Int. J. Hosp. Manag. 2012, 31, 703–711. [Google Scholar] [CrossRef]
  19. Ashaolu, T.J.; Ashaolu, J.O. Perspectives on the Trends, Challenges and Benefits of Green, Smart and Organic (GSO) Foods. Int. J. Gastron. Food Sci. 2020, 22, 100273. [Google Scholar] [CrossRef] [PubMed]
  20. Chiang, C.-I.; Sheu, R.-S. How the Sustainability of Your Recipes? Int. J. Gastron. Food Sci. 2020, 22, 100244. [Google Scholar] [CrossRef]
  21. UNWCED. Our Common Future, United Nations World Commision on Environment and Development; Uxford University Press: Oxford, UK, 1987. [Google Scholar]
  22. Scarpato, R. Sustainable Gastronomy as a Tourist Product. In Tourism and Gastronomy; Hjalager, A.-M., Richards, G., Eds.; Routledge: London, UK, 2002; pp. 146–166. [Google Scholar] [CrossRef]
  23. Legrand, W.; Sloan, P.; Chen, J.S. Sustainability in the Hospitality Industry: Principles of Sustainable Operations, 2nd ed.; Routledge: London, UK, 2013. [Google Scholar]
  24. Hu, H.-H.; Parsa, H.G.; Self, J. The Dynamics of Green Restaurant Patronage. Cornell Hosp. Q. 2010, 51, 344–362. [Google Scholar] [CrossRef]
  25. Wang, Y.-F.; Chen, S.-P.; Lee, Y.-C.; Tsai, C.-T. Developing Green Management Standards for Restaurants: An Application of Green Supply Chain Management. Int. J. Hosp. Manag. 2013, 34, 263–273. [Google Scholar] [CrossRef]
  26. Tan, B.-C.; Yeap, P.-F. What Drives Green Restaurant Patronage Intention? Int. J. Bus. Manag. 2012, 7, 215–223. [Google Scholar] [CrossRef] [Green Version]
  27. Post, J.E.; Altma, B.W. Managing the Environmental Change Process: Barriers and Opportunities. J. Organ. Change Manag. 1994, 7, 64–81. [Google Scholar] [CrossRef]
  28. Gilg, A.; Barr, S.; Ford, N. Green Consumption or Sustainable Lifestyles? Identifying the Sustainable Consumer. Futures 2005, 37, 481–504. [Google Scholar] [CrossRef]
  29. Nimri, R.; Dharmesti, M.; Arcodia, C.; Mahshi, R. UK Consumers’ Ethical Beliefs towards Dining at Green Restaurants: A Qualitative Evaluation. J. Hosp. Tour. Manag. 2021, 48, 572–581. [Google Scholar] [CrossRef]
  30. Jang, Y.J.; Kim, W.G.; Bonn, M.A. Generation Y Consumers’ Selection Attributes and Behavioral Intentions Concerning Green Restaurants. Int. J. Hosp. Manag. 2011, 30, 803–811. [Google Scholar] [CrossRef]
  31. Ratanavaraha, V.; Jomnonkwao, S.; Khampirat, B.; Watthanaklang, D.; Iamtrakul, P. The Complex Relationship between School Policy, Service Quality, Satisfaction, and Loyalty for Educational Tour Bus Services: A Multilevel Modeling Approach. Transp. Policy 2016, 45, 116–126. [Google Scholar] [CrossRef]
  32. Stevens, P.; Knutson, B.; Patton, M. Dineserv: A Tool for Measuring Service Quality in Restaurants. Cornell Hotel Restaur. Adm. Q. 1995, 36, 56–60. [Google Scholar] [CrossRef]
  33. Marković, S.; Raspor, S.; Šegarić, K. Does Restaurant Performance Meet Customers’ Expectations? An Assessment of Restaurant Service Quality Using a Modified DINESERV Approach. Tour. Hosp. Manag. 2010, 16, 181–195. [Google Scholar] [CrossRef]
  34. Agnihotri, D.; Chaturvedi, P. A Study on Impact of Servicescape Dimensions on Perceived Quality of Customer with Special Reference to Restaurant Services in Kanpur. Int. J. Manag. Stud. 2018, 3, 115. [Google Scholar] [CrossRef]
  35. Cronin, J.J.; Taylor, S. SERVPERF versus SERVQUAL: And Reconciling of Service Measurement Perceptions Quality. J. Mark 1994, 58, 125–131. [Google Scholar] [CrossRef]
  36. Uslu, A.; Eren, R. Critical Review of Service Quality Scales with a Focus on Customer Satisfaction and Loyalty in Restaurants. Deturope 2020, 12, 64–84. [Google Scholar] [CrossRef]
  37. Caruana, A. Service Loyalty. Eur. J. Mark 2002, 36, 811–828. [Google Scholar] [CrossRef] [Green Version]
  38. Chen, Y.-S. The Drivers of Green Brand Equity: Green Brand Image, Green Satisfaction, and Green Trust. J. Bus. Ethics 2010, 93, 307–319. [Google Scholar] [CrossRef]
  39. Kleisari, L.; Markaki, E.N. The Impact of the Perceived Service Quality on Revisit Intention in the Tourism Industry: A Conceptual Framework of Strategic Approach and Analysis. Eur. J. Interdiscip. Stud. 2019, 5, 30. [Google Scholar] [CrossRef] [Green Version]
  40. Lai, F.; Griffin, M.; Babin, B.J. How Quality, Value, Image, and Satisfaction Create Loyalty at a Chinese Telecom. J. Bus. Res. 2009, 62, 980–986. [Google Scholar] [CrossRef]
  41. Wu, H.-C. An Empirical Study of the Effects of Service Quality, Perceived Value, Corporate Image, and Customer Satisfaction on Behavioral Intentions in the Taiwan Quick Service Restaurant Industry. J. Qual. Assur. Hosp. Tour. 2013, 14, 364–390. [Google Scholar] [CrossRef]
  42. Prendergast, G.; Man, H.W. The Influence of Store Image on Store Loyalty in Hong Kong’s Quick Service Restaurant Industry. J. Foodserv. Bus. Res. 2002, 5, 45–59. [Google Scholar] [CrossRef]
  43. Han, H.; Hsu, L.-T.J.; Lee, J.-S.; Sheu, C. Are Lodging Customers Ready to Go Green? An Examination of Attitudes, Demographics, and Eco-Friendly Intentions. Int. J. Hosp. Manag. 2011, 30, 345–355. [Google Scholar] [CrossRef]
  44. Khoo, K.L. A Study of Service Quality, Corporate Image, Customer Satisfaction, Revisit Intention and Word-of-Mouth: Evidence from the KTV Industry. PSU Res. Rev. 2020, 6, 105–119. [Google Scholar] [CrossRef]
  45. Jiang, Y.; Wen, J. Effects of COVID-19 on Hotel Marketing and Management: A Perspective Article. Int. J. Contemp. Hosp. Manag. 2020, 32, 2563–2573. [Google Scholar] [CrossRef]
  46. Kim, S.-H.; Lee, K.; Fairhurst, A. The Review of “Green” Research in Hospitality, 2000–2014. Int. J. Contemp. Hosp. Manag. 2017, 29, 226–247. [Google Scholar] [CrossRef]
  47. Robinot, E.; Giannelloni, J.-L. Do Hotels’ “Green” Attributes Contribute to Customer Satisfaction? J. Serv. Mark. 2010, 24, 157–169. [Google Scholar] [CrossRef]
  48. Parasuraman, A.; Zeithaml, V.A.; Berry, L.L. SERVQUAL: A Multiple-Item Scale for Measuring Consumer Perceptions of Service Quality. J. Retail. 1988, 64, 12–40. [Google Scholar]
  49. Low, G.S.; Lamb, C.W. The Measurement and Dimensionality of Brand Associations. J. Prod. Brand Manag. 2000, 9, 350–370. [Google Scholar] [CrossRef] [Green Version]
  50. Kim, W.G.; Moon, Y.J. Customers’ Cognitive, Emotional, and Actionable Response to the Servicescape: A Test of the Moderating Effect of the Restaurant Type. Int. J. Hosp. Manag. 2009, 28, 144–156. [Google Scholar] [CrossRef]
  51. Ryu, K.; Han, H. New or Repeat Customers: How Does Physical Environment Influence Their Restaurant Experience? Int. J. Hosp. Manag. 2011, 30, 599–611. [Google Scholar] [CrossRef]
  52. TURKSTAT. The Results of Address Based Population Registration System; TURKSTAT: Ankara, Turkey, 2022.
  53. İstanbul Directorate of Culture and Tourism. Available online: https://istanbul.ktb.gov.tr/TR-276221/turizm-istatistik-raporlari.html (accessed on 15 April 2022).
  54. İstanbul Tourizm Istatistikleri Raporu. Available online: https://istanbul.ktb.gov.tr/Eklenti/73794,haziran-2020-istanbul-turizm-istatsitikleridoc.doc?0 (accessed on 15 April 2022).
  55. Kline, R.B. Convergence of Structural Equation Modeling and Multilevel Modeling. In The SAGE Handbook of Innovation in Social Research Methods; SAGE Publications Ltd.: London, UK, 2011; pp. 562–589. [Google Scholar] [CrossRef]
  56. Hair, J.F.; Hult, G.T.M.; Ringle, C.M.; Sarstedt, M. A Primer on Partial Least Squares Structural Equation Modeling (PLS-SEM); Sage Publications Inc.: Thousand Oaks, CA, USA, 2017. [Google Scholar]
  57. Fornell, C.; Larcker, D.F. Evaluating Structural Equation Models with Unobservable Variables and Measurement Error. J. Mark. Res. 1981, 18, 39. [Google Scholar] [CrossRef]
  58. Bagozzi, R.P.; Yi, Y. On the Evaluation of Structural Equation Models. J. Acad. Mark. Sci. 1988, 16, 74–94. [Google Scholar] [CrossRef]
  59. Hair, J.F., Jr.; Anderson, R.E.; Tatham, R.L.; Black, W.C. Multivariate Data Analysis, 3rd ed.; Macmillan: New York, NY, USA, 1995. [Google Scholar]
  60. Yılmaz, V.; Can, Y.; Aras, N. Investigation of Attitude About Nuclear and Renewable Energy by Using Partial Least Squares Structural Equatıon Modeling. Alphanumeric. J. 2019, 7, 87–102. [Google Scholar] [CrossRef]
  61. Shmueli, G.; Koppius, O.R. Predictive Analytics in Information Systems Research. MIS Q. 2011, 35, 553. [Google Scholar] [CrossRef] [Green Version]
  62. Henseler, J.; Ringle, C.M.; Sinkovics, R.R. The Use of Partial Least Squares Path Modeling in International Marketing; Emerald Group Publishing Ltd.: Bingley, UK, 2009; pp. 277–319. [Google Scholar] [CrossRef] [Green Version]
  63. Park, E.; Kim, W.-H.; Kwon, J. Understanding the Relationship between Green Restaurant Certification Programs and a Green Restaurant Image: The Case of TripAdvisor Reviews. Kybernetes 2021, 50, 1689–1703. [Google Scholar] [CrossRef]
Figure 1. The proposed research model.
Sustainability 15 05798 g001
Figure 2. Regression paths, t and R2 values results.
Sustainability 15 05798 g002
Table 1. Descriptive of the measurement models.
Measurement Items and Factors (n = 356)
First OrderStandardized Factor Loadingst-ValuesMeanSt. Dev.VIF
Tangible (Cronbach’s alpha = 0.939; CR = 0.94; AVE = 0.72) 3.68
Item 10.80423.0573.681.1132.528
Item 20.86742.1993.621.0824.388
Item 30.85335.8053.711.1023.289
Item 40.86535.5883.721.1513.490
Item 50.82731.1443.651.0892.827
Item 60.87444.2963.711.1003.716
Reliability (Cronbach’s alpha = 0.888; CR = 0.89; AVE = 0.73) 3.72
Item 10.89942.0993.831.0552.363
Item 20.83135.7903.681.0223.123
Item 30.82230.8343.641.0662.547
Responsiveness (Cronbach’s alpha = 0.890; CR = 0.89; AVE = 0.73) 3.57
Item 10.75722.2603.471.0572.491
Item 20.89856.7543.631.1303.667
Item 30.90651.2913.611.1042.529
Assurance (Cronbach’s alpha = 0.930; CR= 0.93; AVE= 0.82) 3.66
Item 10.89976.5113.631.0863.577
Item 20.90879.7483.691.0943.931
Item 30.90578.6573.671.1113.828
Empathy (Cronbach’s alpha = 0.903; CR = 0.90; AVE = 0.76) 3.53
Item 10.85343.3163.541.1392.759
Item 20.84838.1203.441.1183.150
Item 30.90759.5923.621.1482.798
Environmental-oriented services (Cronbach’s alpha = 0.947; CR = 0.95; AVE= 0.78) 3.69
Item 10.90157.9213.621.0953.349
Item 20.86544.8453.711.1474.137
Item 30.89652.4663.751.1754.412
Item 40.87544.6333.581.1513.346
Item 50.88446.8213.761.1704.345
Food quality (Cronbach’s alpha = 0.947; CR = 0.95; AVE = 0.78) 3.67
Item 10.86748.0063.661.1483.087
Item 20.89158.8423.701.1124.283
Item 30.88547.1873.691.1045.776
Item 40.88848.3153.661.1365.413
Item 50.89450.4503.631.1883.975
Green restaurant image (Cronbach’s alpha = 0.929; CR = 0.93; AVE = 0.72) 3.40
Item 10.79827.2333.421.0572.749
Item 20.87934.5313.391.0303.304
Item 30.83833.0683.371.0423.029
Item 40.88334.8893.411.0623.717
Item 50.85132.2303.421.0383.215
Revisit intention (Cronbach’s alpha = 0.919; CR = 0.92; AVE = 0.79) 3.48
Item 10.90250.8393.491.1493.807
Item 20.90954.7113.491.1203.882
Item 30.85731.5813.461.1702.761
Second Order
Perceived service quality (Cronbach’s alpha = 0.977; CR = 0.98; AVE = 0.61)
Tangible0.92746.864
Reliability0.82322.670
Responsiveness0.84122.606
Assurance0.92846.379
Empathy0.93967.741
Environmental-oriented services0.92664.102
Food quality0.95989.818
Note: The significance level of all factor loadings was p < 0.001, and bootstrapping was performed over 5000 samples.
Table 2. Discriminant validity of variables.
PSQ-AssurancePSQ-EmpathyPSQ-Environmental-Oriented ServicesPSQ-Food QualityGreen Restaurant ImagePSQ-ReliabilityPSQ-ResponsivenessRevisit IntentionPSQ-Tangible
PSQ-assurance0.904
PSQ-empathy0.8570.870
PSQ-environmental-oriented services0.8300.8220.884
PSQ-food quality0.8330.8690.8660.885
Green restaurant image0.6350.6500.6800.7150.850
PSQ-reliability0.7370.6990.6240.7050.5050.852
PSQ-responsiveness0.7390.7150.6730.7320.6210.6970.856
Revisit intention0.7030.7240.7460.7860.8340.5840.7000.889
PSQ-tangible0.7630.8030.7540.8050.6350.7580.7470.7550.849
PSQ = perceived service quality; bolded figures are the square root of average variance extracted; figures below the AVE line are the correlations between the factors.
Table 3. The results of the hypotheses.
Original Sample (O)Sample Mean (M)Standard Deviation (STDEV)T Statistics (|O/STDEV|)CI-BC
LB
(%2.5)
CI-BC
UB (%97.5)
p
Values
H1 supportedPerceived service quality-> Green restaurant image0.7220.7220.03918.3010.6410.7940.000 *
H2 supportedPerceived service quality->
Revisit intention
0.4390.4420.0775.6820.2940.5930.000 *
H3 supportedGreen restaurant image ->
Revisit intention
0.5180.5140.0776.7150.3620.6580.000 *
Indirect effectsPerceived service quality-> Green restaurant image-> Revisit intention0.3740.3720.0566.6540.2710.4860.000 *
* p < 0.001, CI = confidence interval, BC = bias corrected, LB = lower bound, UB = upper bound.
Disclaimer/Publisher’s Note: The statements, opinions and data contained in all publications are solely those of the individual author(s) and contributor(s) and not of MDPI and/or the editor(s). MDPI and/or the editor(s) disclaim responsibility for any injury to people or property resulting from any ideas, methods, instructions or products referred to in the content.

