


Assessment of the Future Changes in the Socio-Economic Vulnerability of China’s Coastal Areas
Abstract
:1. Introduction
2. Data and Methods
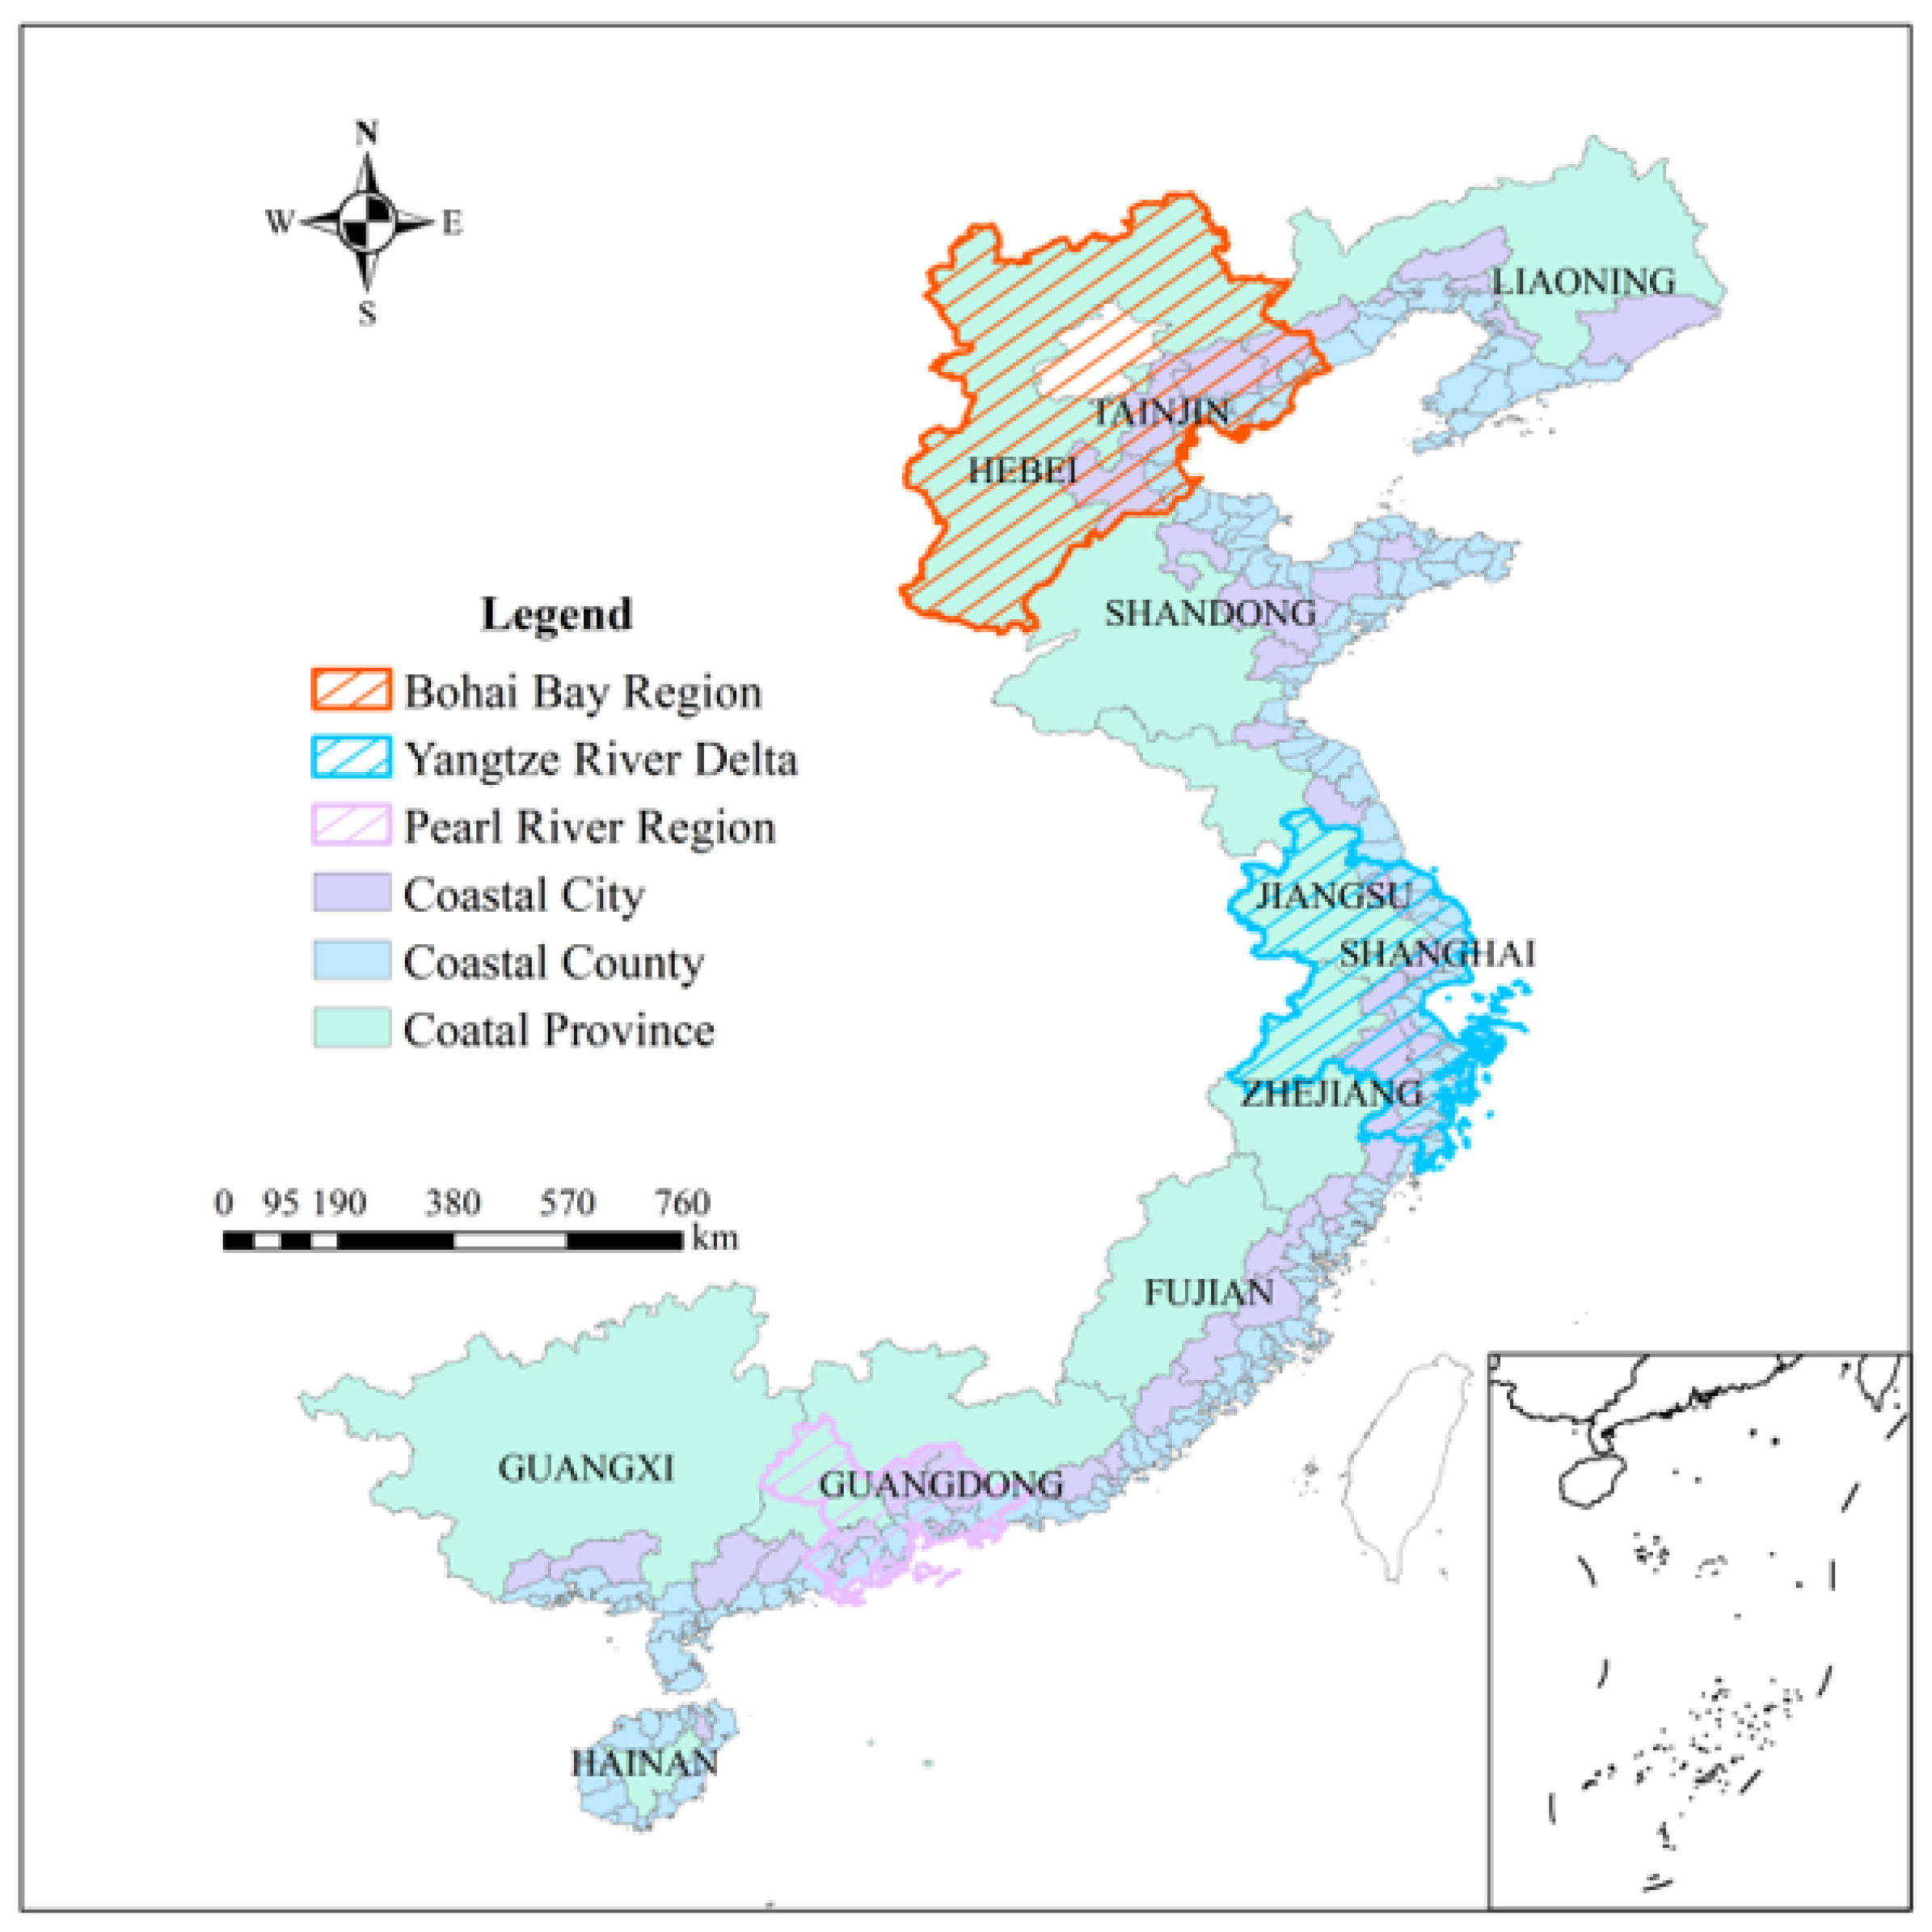
2.1. Study Area
2.2. Data Sources
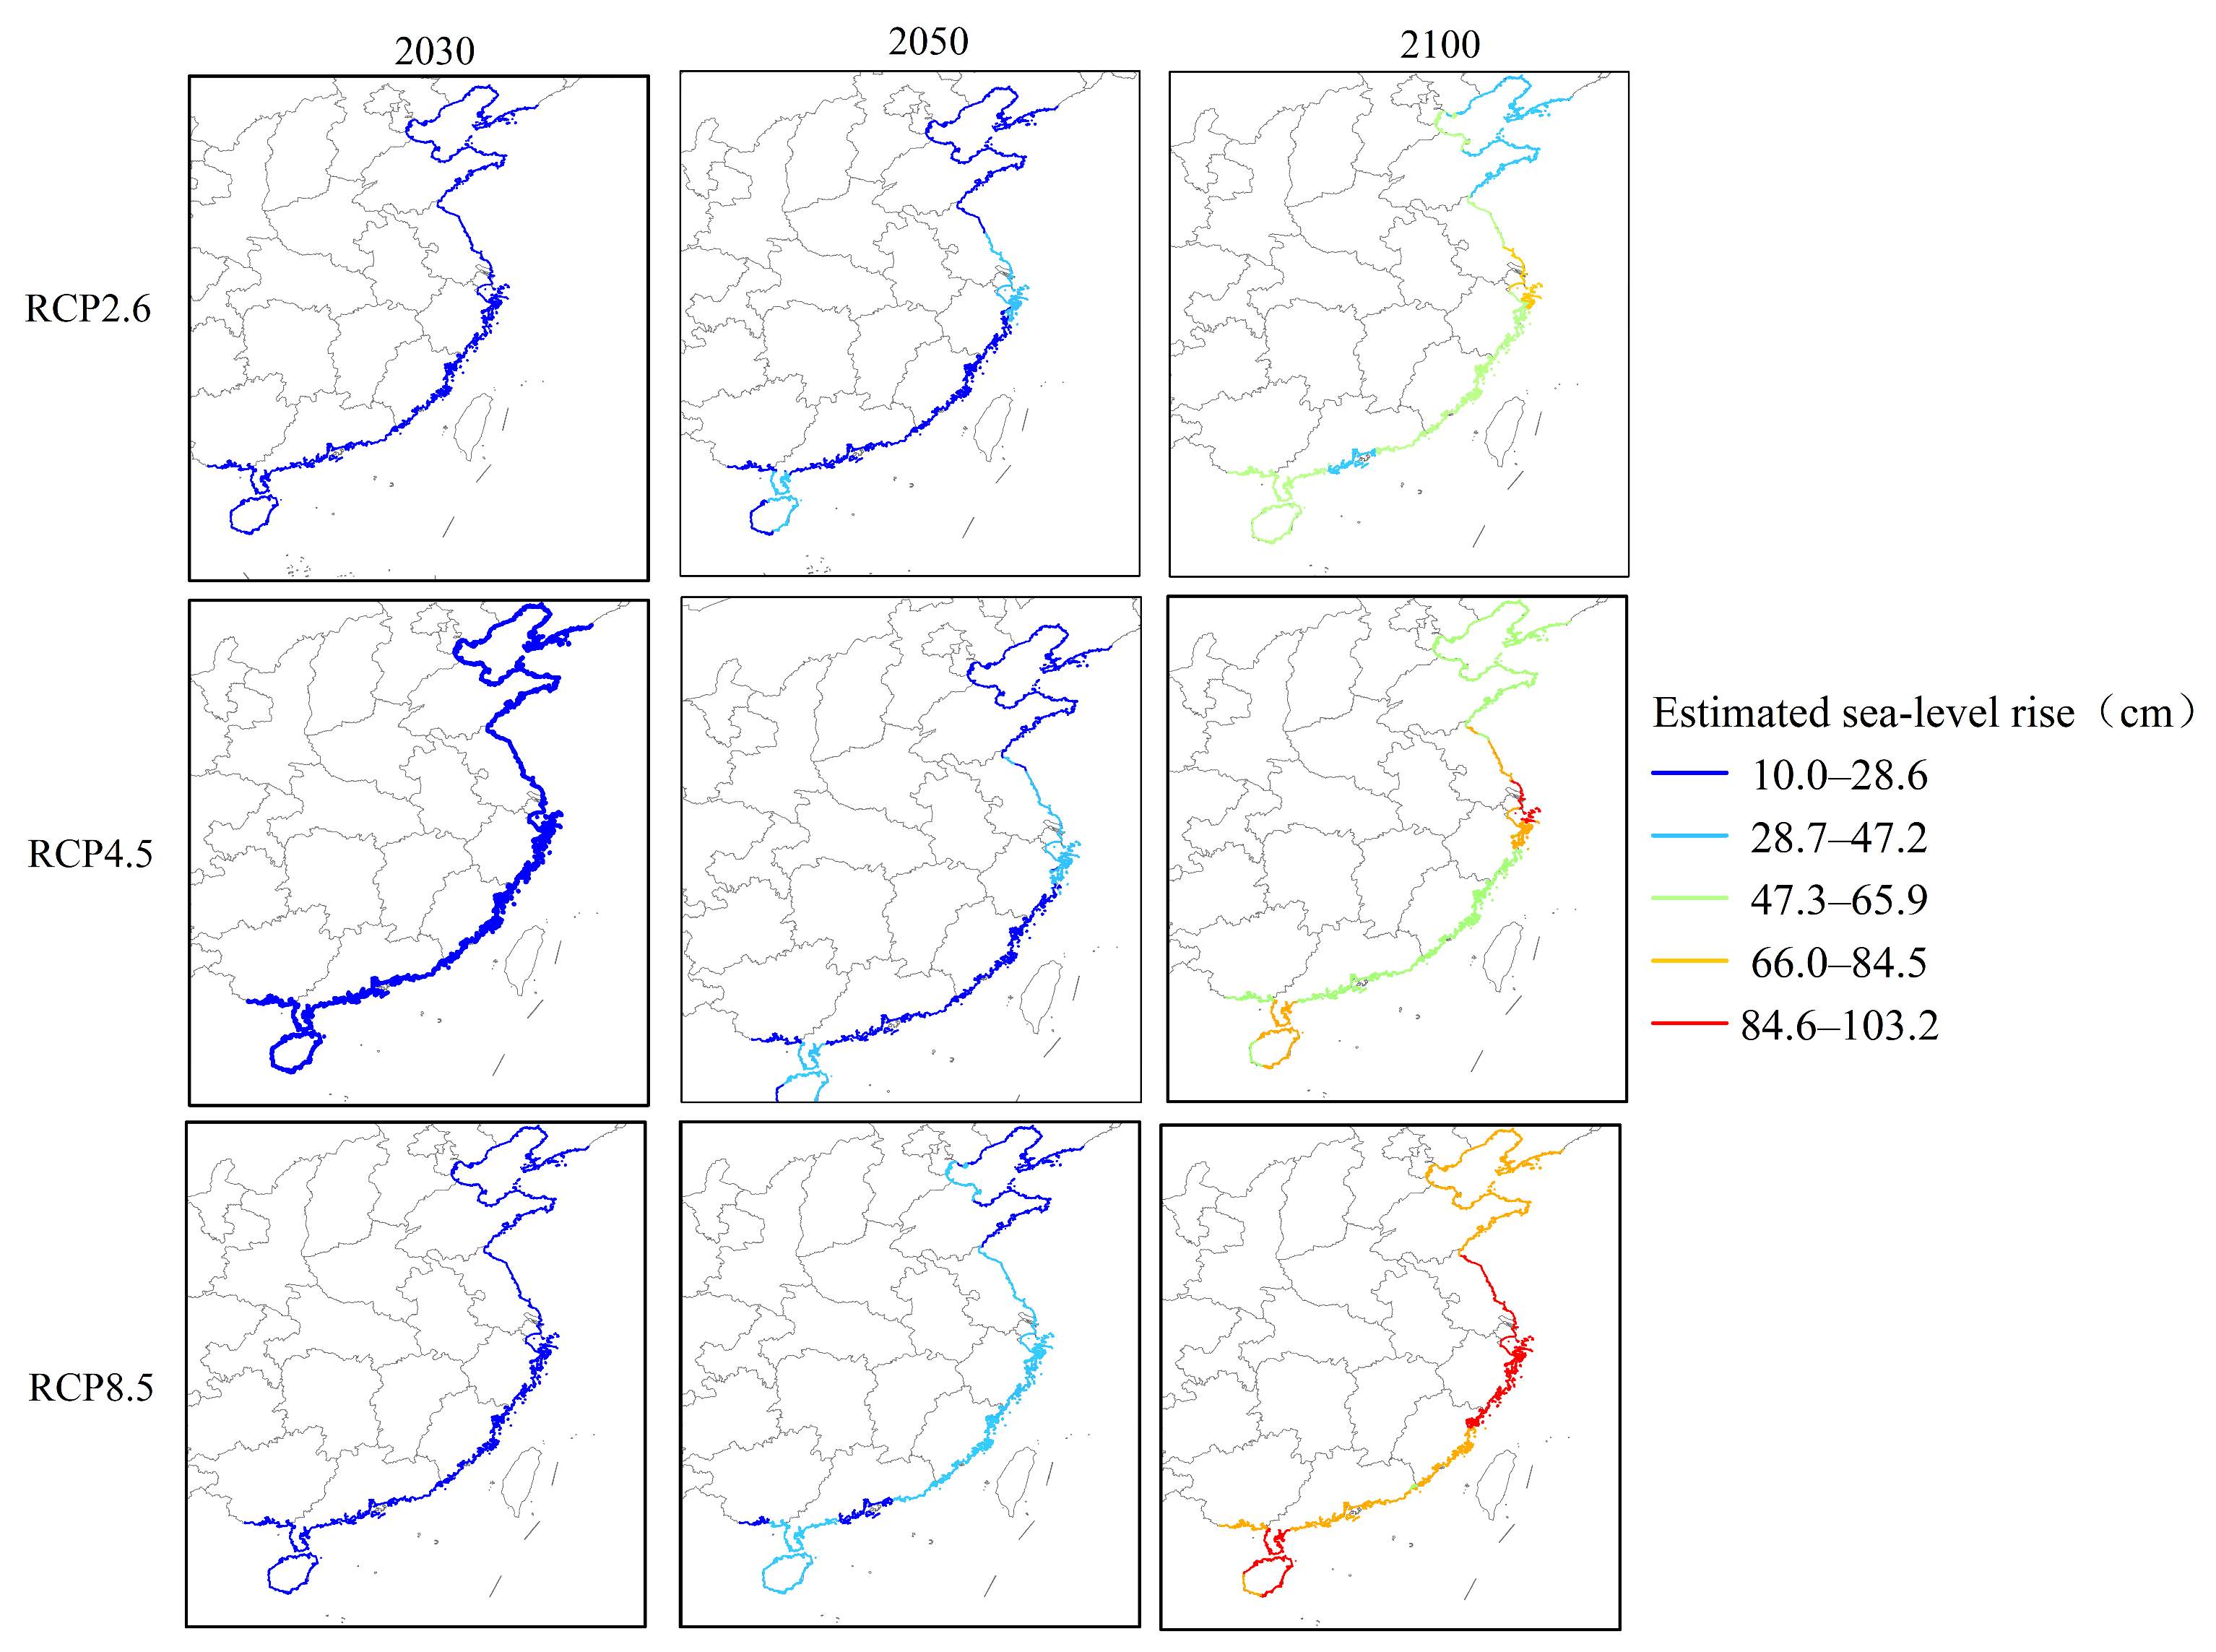
2.2.1. Environmental Data
2.2.2. Socio-Economic Data
2.3. Research Methods
2.3.1. Socio-Economic Vulnerability Index
2.3.2. Computing Methods
2.3.3. Evaluation Indicator Grading
3. Results and Discussion
3.1. Socio-Economic Vulnerability
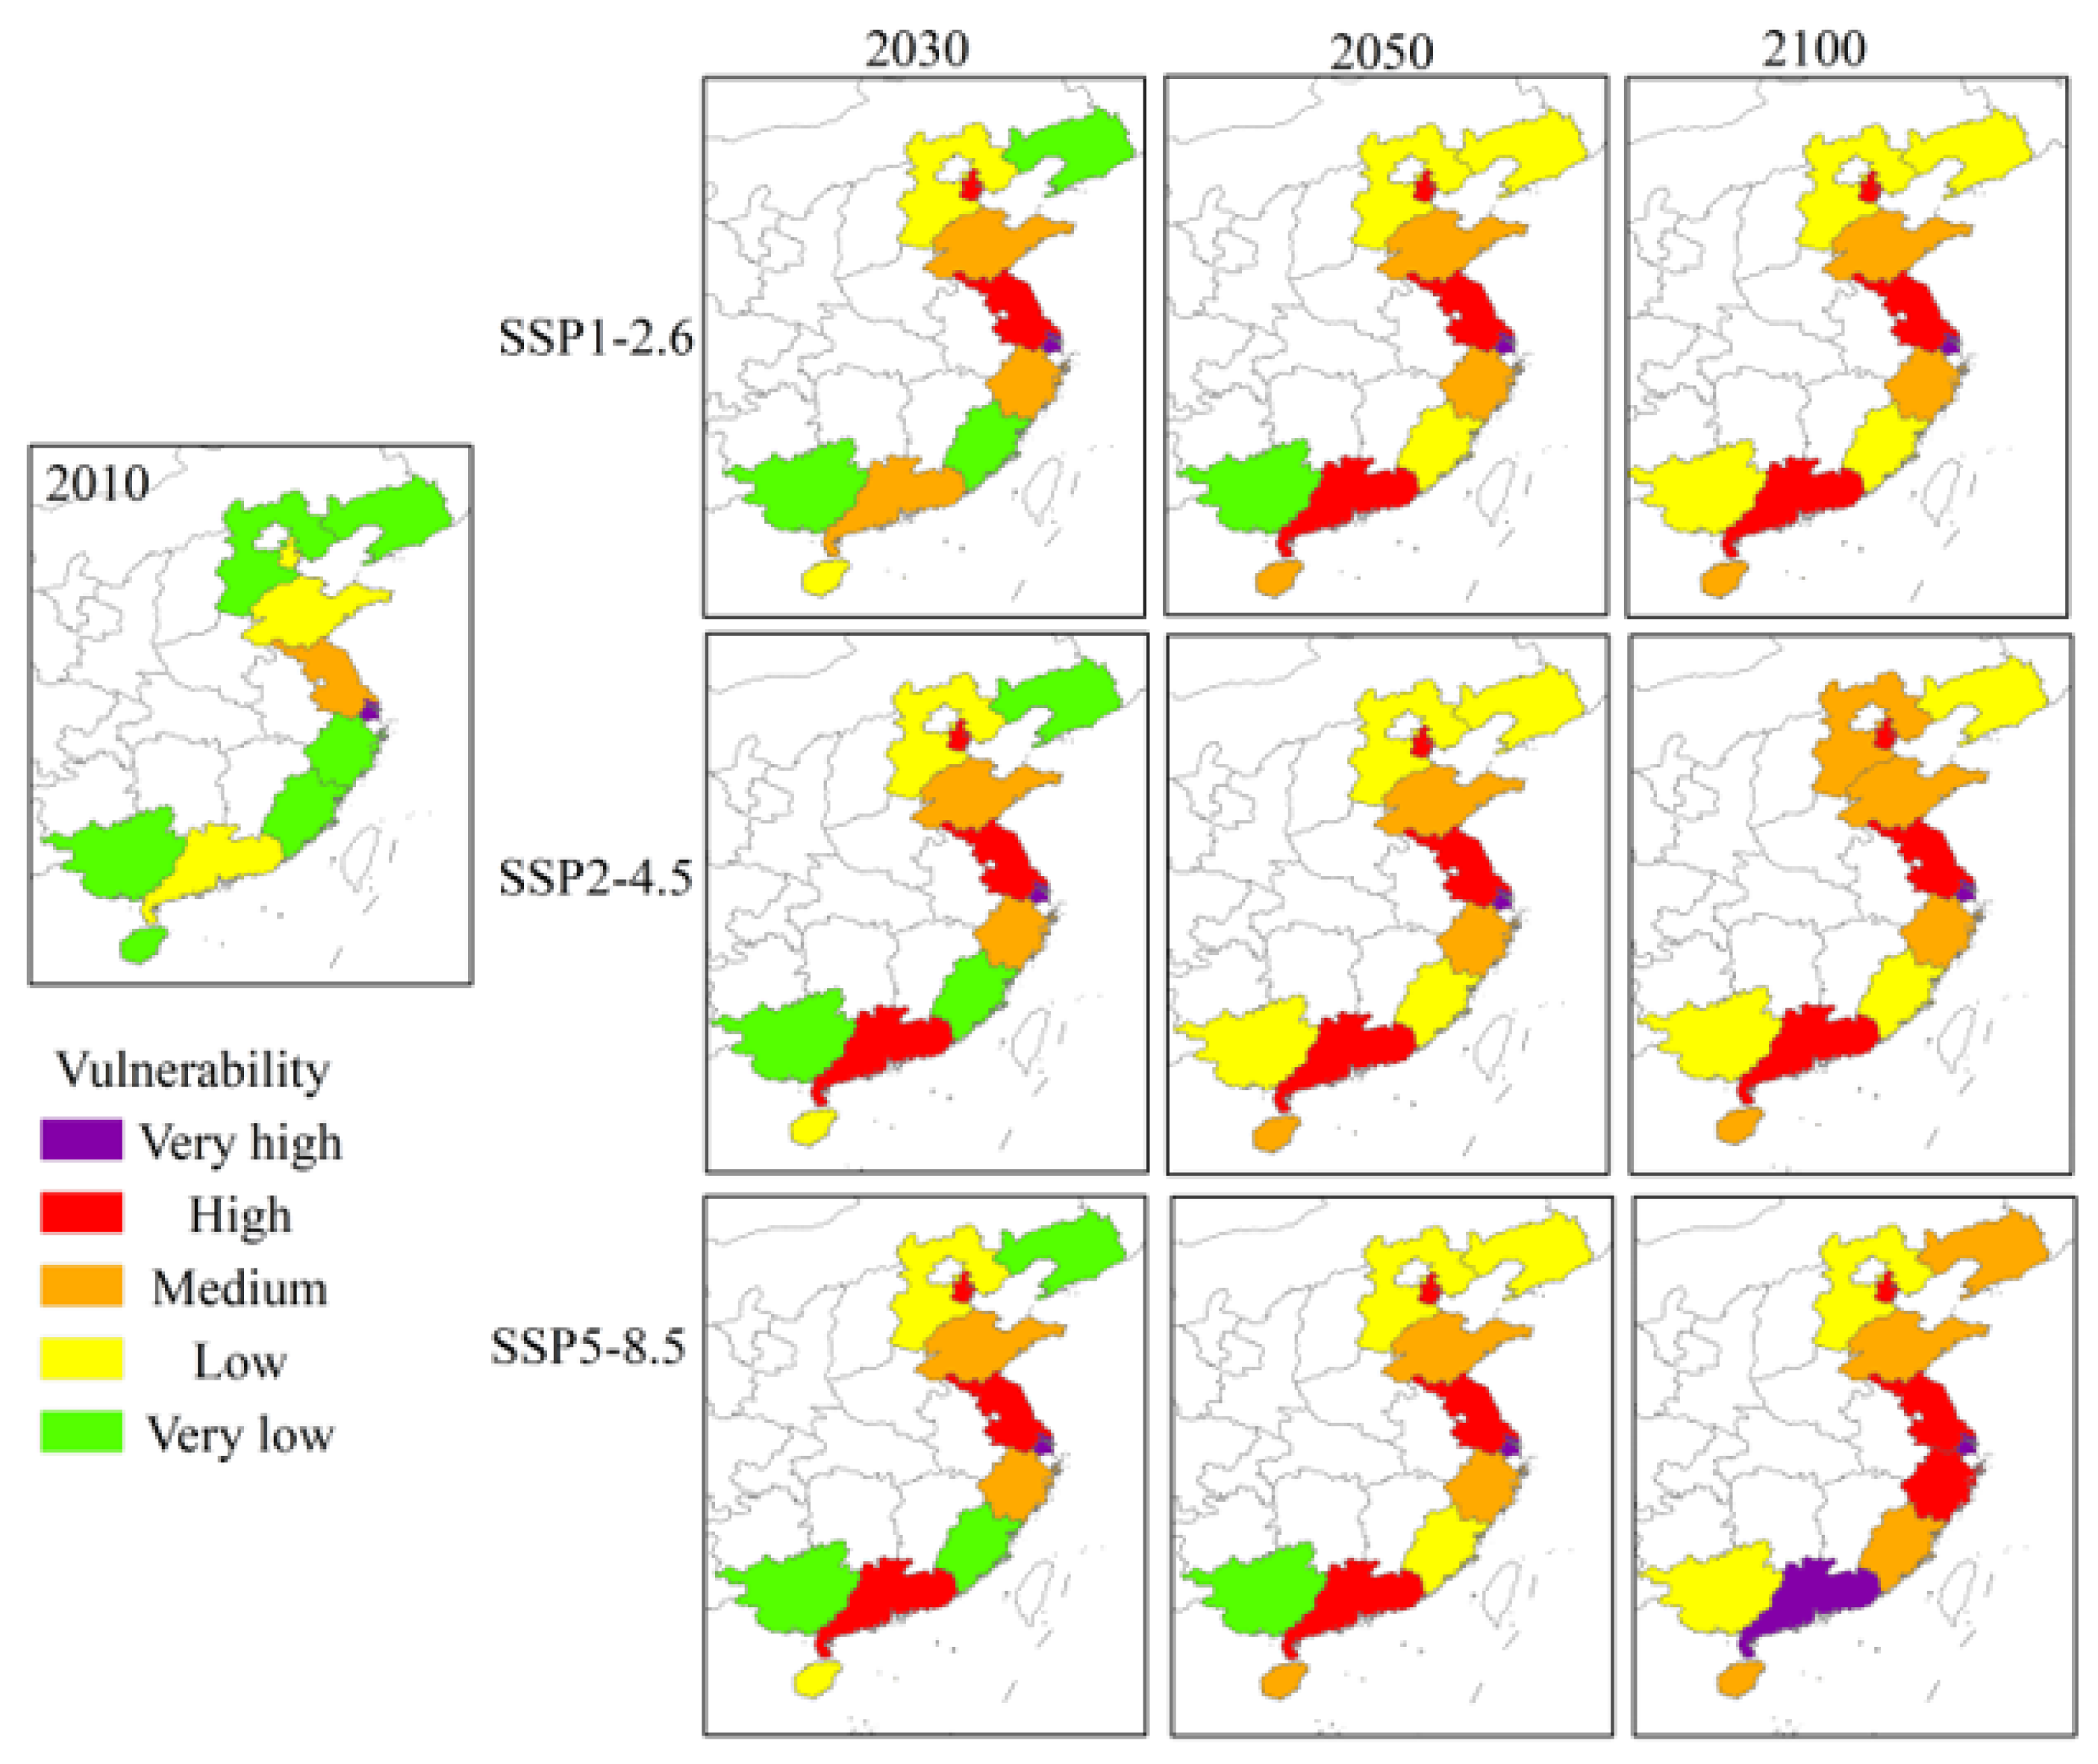
3.1.1. Coastal Provinces
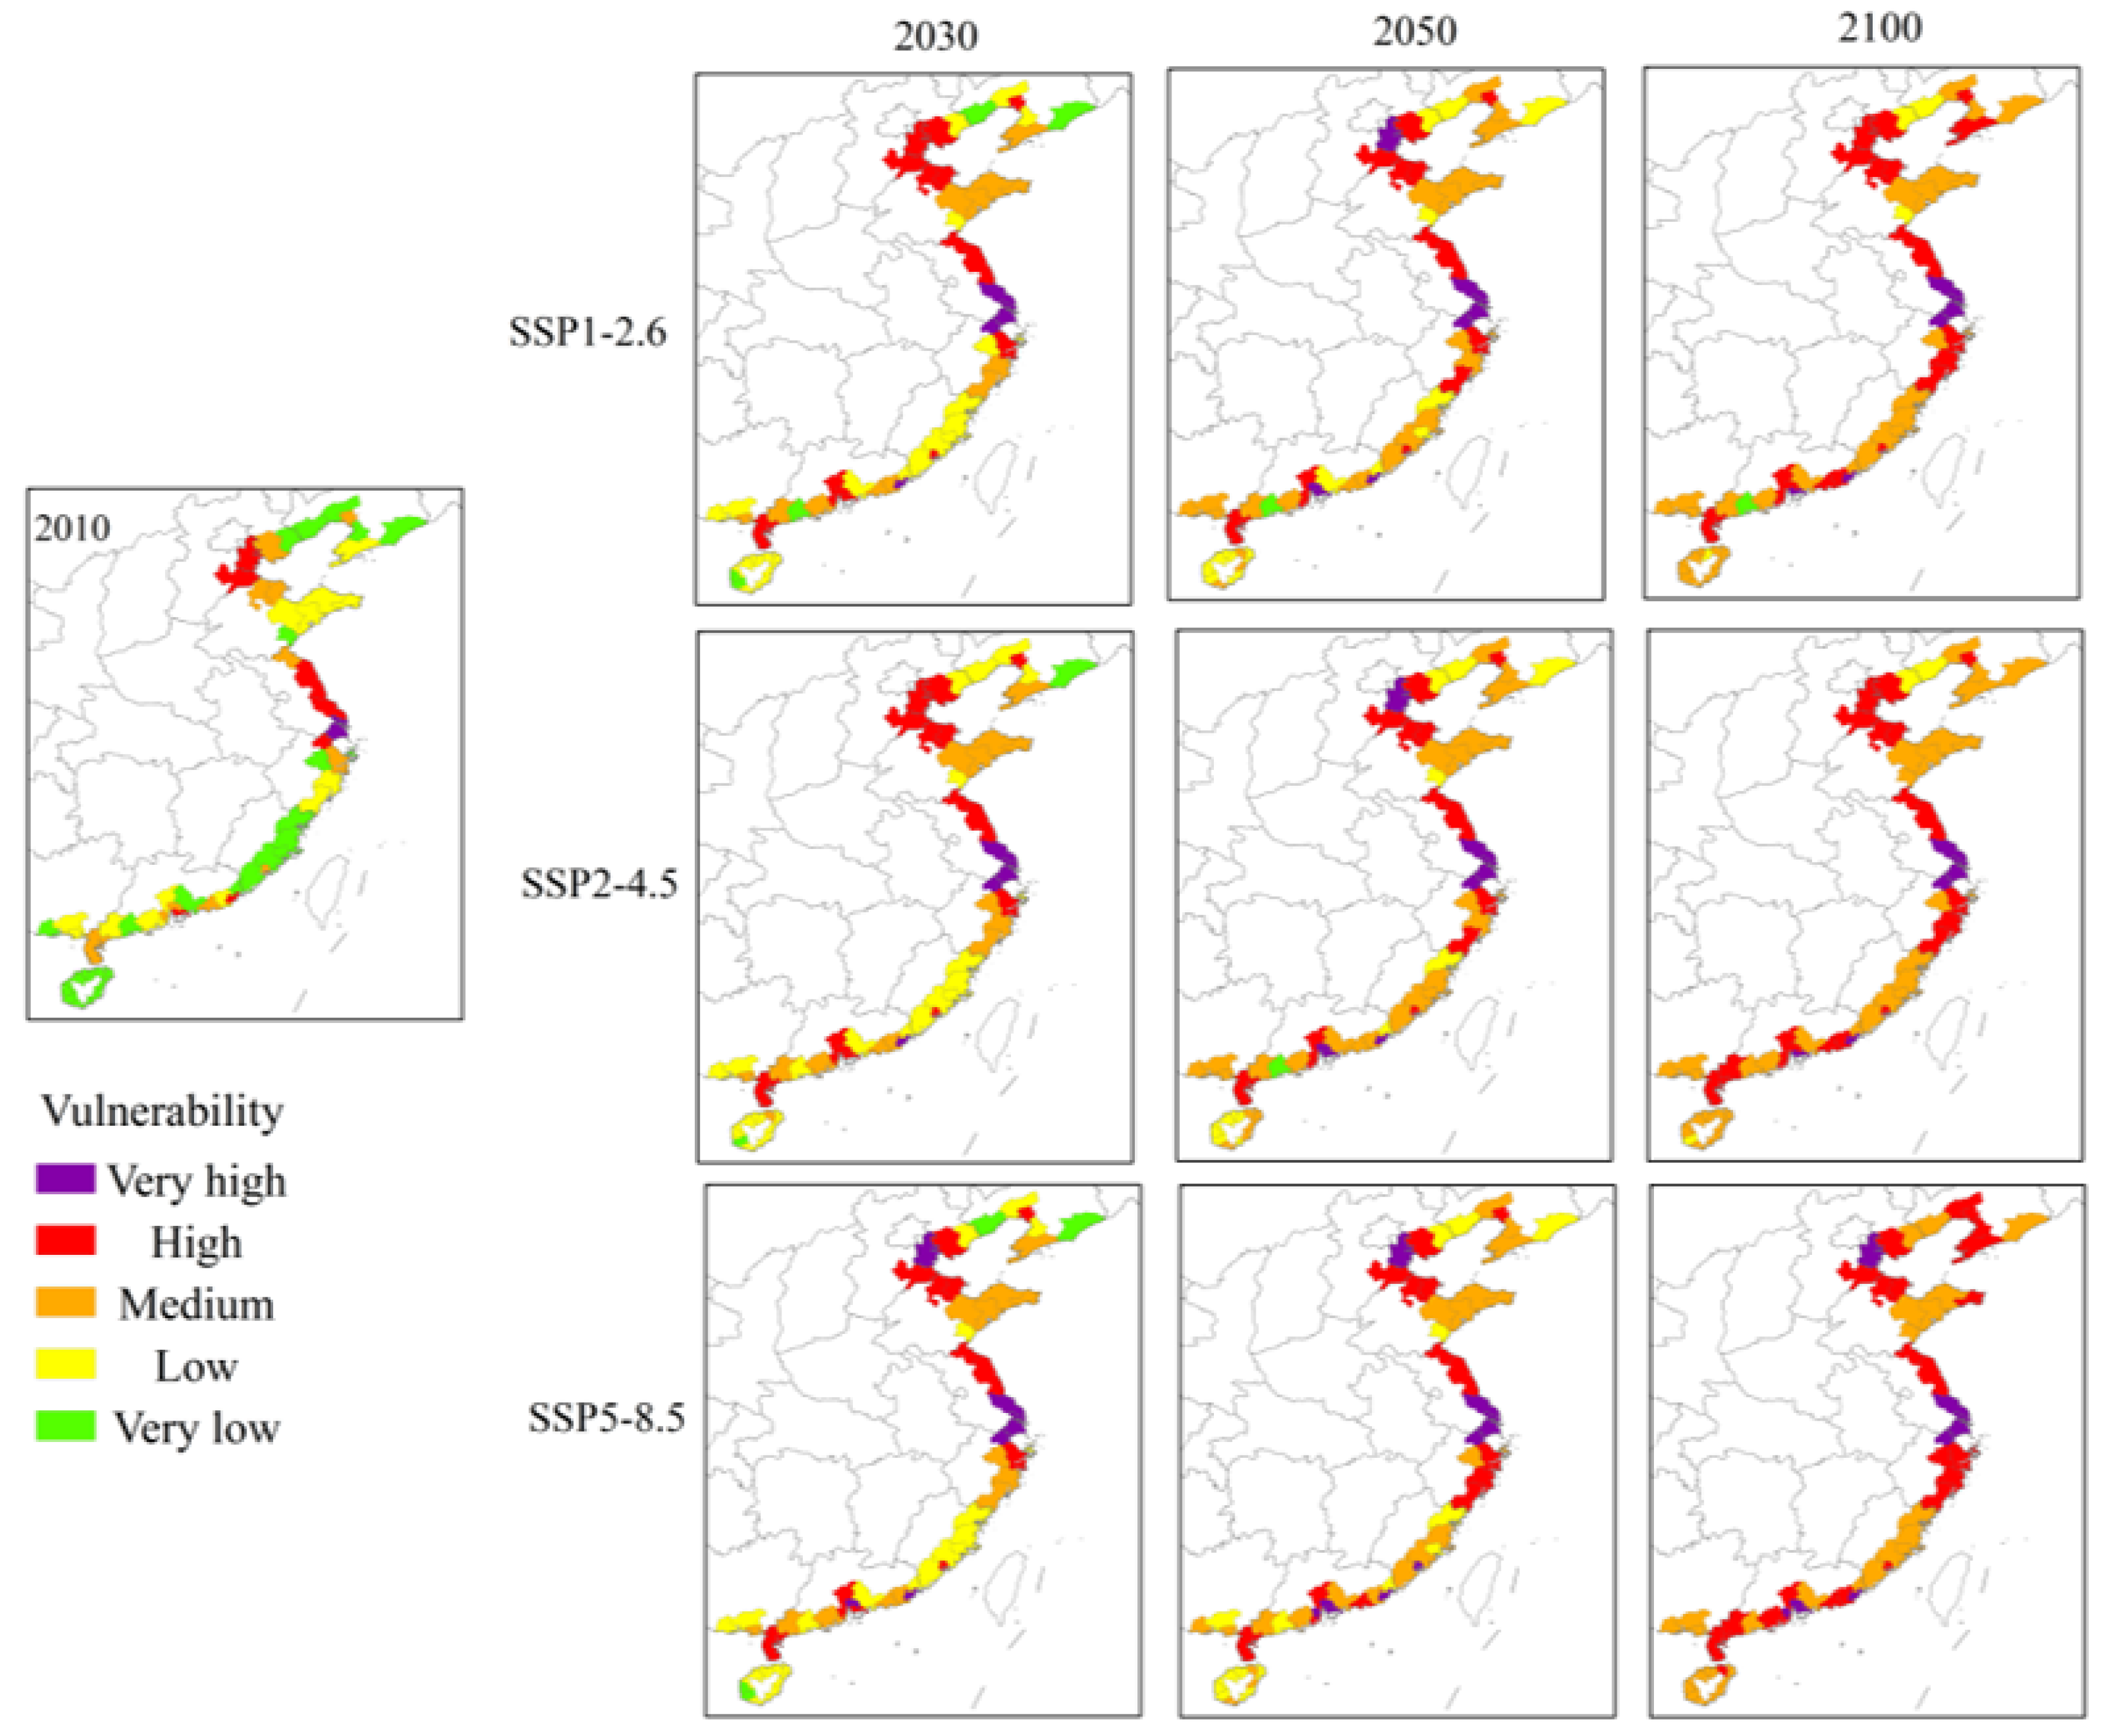
3.1.2. Coastal Municipalities
3.1.3. Coastal Counties
3.2. Socio-Economic Adaptation
3.2.1. Vulnerability Attribution
3.2.2. Potential Adaptation Strategies
- (1)
- Improve damp-proofing, flood control, and drainage practices to reduce the exposure risk in coastal areas
- (2)
- Strengthen industrial structures and the layout of low-lying areas to reduce the vulnerability of coastal areas
- (3)
- Control GHG emissions to limit climate disaster-causing factors
- (4)
- Improve observation, prediction, and early warning systems for sea-level rise to improve the adaptability of coastal areas
4. Conclusions
Author Contributions
Funding
Institutional Review Board Statement
Informed Consent Statement
Data Availability Statement
Acknowledgments
Conflicts of Interest
References
- IPCC. Climate Change 2021: The Physical Science Basis; Masson-Delmotte, V., Zhai, P., Pirani, A., Connors, S.L., Péan, C., Chen, Y., Goldfarb, L., Gomis, M.I., Matthews, J.B.R., Berger, S., et al., Eds.; Contribution of Working Group I to the Sixth Assessment Report of the Intergovernmental Panel on Climate Change; Cambridge University Press: Cambridge, UK; New York, NY, USA, 2021. [Google Scholar]
- Sung, H.M.; Kim, J.; Lee, J.-H.; Shim, S.; Boo, K.-O.; Ha, J.-C.; Kim, Y.-H. Future Changes in the Global and Regional Sea Level Rise and Sea Surface Temperature Based on CMIP6 Models. Atmosphere 2021, 12, 90. [Google Scholar] [CrossRef]
- Oppenheimer, M.; Glavovic, B.; Hinkel, J. Sea Level Rise and Implications for Low Lying Islands, Coasts and Communities [M/OL]//IPCC. An IPCC Special Report on the Ocean and Cryosphere in a Changing Climate. 2019. Available online: https://www.ipcc.ch/srocc/home (accessed on 24 September 2019).
- Cai, R.S.; Tan, H.J. Impacts and risks of accelerating sea level rise on low lying islands, coasts and communities. Clim. Chang. Res. 2020, 16, 163–171. [Google Scholar]
- Zhang, T.; Yu, Y.Q.; Xiao, C.D.; Hua, L.-J.; Yan, Z. Interpretation of IPCC AR6 report: Monitoring and projections of global and regional sea level change. Clim. Chang. Res. 2022, 18, 12–18. [Google Scholar]
- Marine Early Warning and Monitoring Department of the Ministry of Natural Resources. China Sea Level Bulletin; Ministry of Natural Resources of the People’s Republic of China. 2022. Available online: https://www.mnr.gov.cn/sj/sjfw/hy/gbgg/zghpmgb/ (accessed on 20 September 2021).
- Marine Early Warning and Monitoring Department of the Ministry of Natural Resources. Bulletin of China Marine Disasters; Ministry of Natural Resources of the People’s Republic of China. 2021. Available online: https://www.mnr.gov.cn/sj/sjfw/hy/gbgg/zghyzhgb/ (accessed on 20 September 2021).
- Hinkel, J.; Lincke, D.; Vafeidis, A.T.; Perrette, M.; Nicholls, R.J.; Tol, R.S.; Marzeion, B.; Fettweis, X.; Ionescu, C.; Levermann, A. Coastal flood damage and adaptation costs under 21st century sea-level rise. Proc. Natl. Acad. Sci. USA 2014, 111, 3292–3297. [Google Scholar] [CrossRef] [Green Version]
- Kossin, J.P.; Knapp, K.R.; Olander, T.L.; Velden, C.S. Global increase in major tropical cyclone exceedance probability over the past four decades. Proc. Natl. Acad. Sci. USA 2020, 117, 11975–11980. [Google Scholar] [CrossRef]
- Small, C.; Nieholls, R.J. A Global Analysis of Human Settlement in Coastal Zones. J. Coast. Resour. 2003, 19, 584–599. [Google Scholar]
- Adger, W.N.; Hughes, T.P.; Folke, C.; Carpenter, S.R.; Rockstrom, J. Social-Ecological Resilience to Coastal Disaster. Science 2005, 309, 1036–1039. [Google Scholar] [CrossRef] [Green Version]
- Ding, P. Evolution Process and Cause Analysis of Typical Coastal Zone in China during the Last 50 Years; Science Press: Beijing, China, 2013. [Google Scholar]
- Fang, J.; Liu, W.; Yang, S.; Brown, S.; Nicholls, R.J.; Hinkel, J.; Shi, X.; Shi, P. Spatial—Temporal changes of coastal and marine disasters risks and impacts in Mainland China. Ocean. Coast. Manag. 2017, 139, 125–140. [Google Scholar] [CrossRef]
- Xiao, R.; Guo, P.; Xie, X. Theoretical research of storm surge loss assessment. Trans. Oceanol. Limnol. 2021, 43, 68–73. [Google Scholar]
- Cai, R.; Xu, W. Risk of socio-economic losses from floods in China’s coastal cities. China Popul. Resour. Environ. 2022, 32, 174–184. [Google Scholar]
- IPCC. Climate Change 2014: Impacts, Adaptation, and Vulnerability: Contribution of Working Group II to the Fifth Assessment Report of the Intergovernmental Panel on Climate Change; Cambridge University Press: Cambridge, UK, 2014; pp. 1–32. [Google Scholar]
- IPCC. Summary for Policymakers. [R/OL]//Climate Change 2022: Impacts, Adaptation, and Vulnerability; Contribution of Working Group II to the Sixth Assessment Report of the Intergovernmental Panel on Climate Change; Cambridge University Press: Cambridge, UK, 2022; Available online: https://report.ipcc.ch/ar6wg2/pdf/IPCC_AR6_WGII_SummaryForPolicymakers.pdf (accessed on 5 May 2022).
- Ekstrom, J.A.; Suatoni, L.; Cooley, S.R.; Pendleton, L.H.; Waldbusser, G.G.; Cinner, J.E.; Ritter, J.; Langdon, C.; van Hooidonk, R.; Gledhill, D.; et al. Vulnerability and adaptation of US shellfisheries to ocean acidification. Nat. Clim. Chang. 2015, 5, 207–214. [Google Scholar] [CrossRef]
- Romieu, E.; Welle, T.; Schneiderbauer, S.; Pelling, M.; Vinchon, C. Vulnerability assessment within climate change and natural hazard contexts: Revealing gaps and synergies through coastal applications. Sustain. Sci. 2010, 5, 159–170. [Google Scholar] [CrossRef]
- Cutter, S.L.; Boruff, B.J.; Shirley, W.L. Social Vulnerability to Environmental Hazards. Soc. Sci. Q. 2003, 84, 242–261. [Google Scholar] [CrossRef]
- Yi, L.X.; Zhang, X.; Ge, L.L.; Dong, Z. Analysis of social vulnerability to hazards in China. Environ. Earth Sci. 2014, 71, 3109–3117. [Google Scholar]
- Tierney, K. Social Inequality, Hazards, and Disasters. In On Risk and Disaster Lessons from Hurricane Katrina; Daniels, R.J., Kettl, D.F., Kunreuther, H., Eds.; Philadephia University of Pennsylvania Press: Philadephia, PA, USA, 2006; pp. 109–128. [Google Scholar]
- Shi, J.G.; Yu, X.Y. Infrastructure Vulnerability Assessment and Spatial Analysis of the Yangtze River Delta Urban Agglomeration under Climate Change. J. Tongji Univ. (Nat. Sci. Ed.) 2020, 48, 1836–1844. [Google Scholar]
- Hahn, M.B.; Riederer, A.M.; Foster, S.O. The livelihood vulnerability index: A pragmatic approach to assessing risks from climate variability and change: A case study in Mozambique. Glob. Environ. Chang. 2009, 19, 74–88. [Google Scholar] [CrossRef]
- Fang, J.Y.; Chen, W.F.; Kong, F.; Sun, S.; Shi, P.J. Measuring social vulnerability to natural hazards of the coastal areas in China. J. Beijing Norm. Univ. (Nat. Sci.) 2015, 51, 280–286. [Google Scholar]
- Cheng, S.B.; Yue, Y.; Liu, Y.; Yang, X.L. Evaluation and Analysis of the Social Vulnerability of Flood Disasters in the Yellow River Basin. Yellow River 2022, 44, 45–50. [Google Scholar]
- Bjarnadottir, S.; Li, Y.; Stewart, M.G. Social vulnerability index for coastal communities at risk to hurricane hazard and a changing climate. Nat. Hazards 2011, 59, 1055–1075. [Google Scholar] [CrossRef] [Green Version]
- Pandey, R.; Jha, S. Climate vulnerability index-measure of climate change vulnerability to communities: A case of rural Lower Himalaya, India. Mitig. Adapt. Strateg. Glob. Chang. 2012, 17, 487–506. [Google Scholar] [CrossRef]
- Xu, T.; Xu, C.; Liu, Y. Research on Shanghai Comprehensive Vulnerability Assessment of Climate Change—Based on PSR Model. Resour. Dev. Mark. 2015, 31, 288–292. [Google Scholar]
- Zhang, D.; Jiao, M. Vulnerability Assessment of Coastal Areas Development Based on RBF Neural Network. J. Hebei Norm. Univ. (Nat. Sci. Ed.) 2019, 43, 446–452. [Google Scholar]
- Qin, X. Spatial Characteristics and Evaluation of Regional Vulnerability of Marine Meteorological Disasters in Coastal Cities of Guangxi. Pop. Sci. Technol. 2020, 22, 20–23. [Google Scholar]
- Cutter, S.L.; Finch, C. Temporal and spatial changes in social vulnerability to natural hazards. Proc. Natl. Acad. Sci. USA 2008, 105, 2301–2306. [Google Scholar] [CrossRef] [Green Version]
- Hizbaron, D.R.; Baiquni, M.; Sartohadi, J.; Rijanta, R.; Coy, M. Assessing social vulnerability to seismic hazard through spatial multi criteria evaluation in Bantul District, Indonesia. In Proceedings of the Conference of Development on the Margin, Bonn, Germany, 5–7 October 2011; Volume 10, pp. 5–7. [Google Scholar]
- Depietri, Y.; Welle, T.; Renaud, F.G. Social vulnerability assessment of the Cologne urban area to heat waves: Links to ecosystem services. Int. J. Disaster Risk Reduct. 2013, 6, 98–117. [Google Scholar] [CrossRef]
- Zheng, D.F.; Gao, M.; Li, Y.; Wu, R.N. Comprehensive risk assessment of rainstorm-flood disaster in Dalian City based on GIS. J. Hohai Univ. (Nat. Sci.) 2022, 50, 22. [Google Scholar]
- Huang, X.J.; Huang, X.; Cui, C.L.; Yang, X.J. Concept, analysis framework and evaluation method of social vulnerability. Prog. Geogr. 2014, 33, 1512–1525. [Google Scholar]
- Jiao, M.; Zhang, D.Y. The Vulnerability Assessment on the Development of the Coastal Area in the Context of Sea Level Rise. J. Cap. Norm. Univ. (Nat. Sci. Ed.) 2019, 40, 41–47. [Google Scholar]
- Wang, J.; Wang, W.A.; Wang, S.F. Climate Change and Coastal Vulnerability Assessment: A Case Study of China’s Yangtze River Delta Region. Geomat. Spat. Inf. Technol. 2017, 40, 81–89. [Google Scholar]
- Huang, J.; She, J.W. Vulnerability Assessment and Influencing Factors Analysis of Urban Flood Disaster in Yangtze River Delta City Cluster. J. Hohai Univ. (Philos. Soc. Sci.) 2020, 22, 39–45. [Google Scholar]
- China Statistical Yearbook. National Bureau of Statistics of the People’s Republic of China. Available online: http://www.stats.gov.cn/tjsj/ndsj/ (accessed on 20 October 2021).
- Kopp, R.E.; Horton, R.M.; Little, C.M.; Mitrovica, J.X.; Oppenheimer, M.; Rasmussen, D.J.; Strauss, B.H.; Tebaldi, C. Probabilistic 21st and 22nd century sea—Level projections at a global network of tide—Gauge sites. Earth’s Future 2014, 2, 383–406. [Google Scholar] [CrossRef]
- Zhang, H.; Li, X.M.; Li, W.L. Data Set of Coastal Population, Urban Expansion and Land Use under the Future Path of SSPs. Available online: https://nsem.bnu.edu.cn/gjgcs/120719.htm (accessed on 24 October 2021).
- Zhang, H.; Li, X.M.; Dong, L.J. GDP Data Set of Coastal Areas under the Future Path of SSPs. Available online: https://nsem.bnu.edu.cn/gjgcs/120719.htm (accessed on 24 October 2021).
- Chen, Q.; Hu, Q.G. The vulnerability evaluation and influencing factors of the socio-ecological system of China’s marine fisheries. Res. Agric. Mod. 2018, 39, 468–477. [Google Scholar]
- Yan, X.H.; Cai, R.; Guo, H.; Xu, W.; Tan, H. Vulnerability of Hainan Dongzhaigang mangrove ecosystem to the climate change. J. Appl. Oceanogr. 2019, 38, 338–349. [Google Scholar]
- Shi, M.Q. Study on the Population Spatial Distribution and Its Natural Disaster Vulnerability in China’s Low Elevation Coastal Zone. Master’s thesis, Shanghai Normal University, Shanghai, China, 2012. [Google Scholar]
- Li, X.; Duan, X.; Zhang, Z.; Wang, H.; Liu, K.X. The Vulnerability Zoning Research on the Sea Level Rise of Chinese Coastal. J. Catastrophology 2016, 31, 103–109. [Google Scholar]
- Yuan, S.; Zhao, X.; Li, L.L. Combination evaluation and case analysis of vulnerability of storm surge in coastal provinces of China. Acta Oceanol. Sin. 2016, 38, 16–24. [Google Scholar]
- Gao, C.; Wang, L.; Chen, C.; Luo, G.; Sun, Y. Population and economic risk exposure in coastal regionof China under sea level rise. Acta Geogr. Sin. 2019, 74, 1590–1604. [Google Scholar]
- Morzaria-Luna, H.N.; Turk-Boyer, P.; Moreno-Baez, M. Social indicators of vulnerability for fishing communities in the Northern Gulf of California, Mexico: Implications for climate change. Mar. Policy 2014, 45, 182–193. [Google Scholar] [CrossRef]
- Cinner, J.E.; McClanahan, T.R.; Graham, N.A.; Daw, T.M.; Maina, J.; Stead, S.M.; Wamukota, A.; Brown, K.; Bodin, Ö. Vulnerability of coastal communities to key impacts of climate change on coral reef fisheries. Glob. Environ. Chang. 2012, 22, 12–20. [Google Scholar] [CrossRef]
- Yu, L.P.; Pan, Y.T.; Wu, Y.S. Research on sensitivity analysis of science and technology evaluation—Single index and combined index. Soft Sci. 2009, 23, 1–4. [Google Scholar]
- Yang, Y.; Fang, G.H.; Huang, X.F.; Xu, S. Evaluation of the strictest regional water resources management based on improved fuzzy matter-element analysis. Water Resour. Prot. 2014, 30, 19–24. [Google Scholar]
- Yu, W.Y. Comprehensive evaluation of regional social economic system vulnerability in Hebei province. J. Yanshan Univ. (Philos. Soc. Sci. Ed.) 2012, 13, 64–66. [Google Scholar]
- Xu, W.H.; Cai, R.S. Estimating the return period of extreme water level in coastal cities of China under different climate scenarios. Mar. Sci. Bull. 2022, 41, 379–390. [Google Scholar]
- Zhu, F. Analysis on the trend of population aging in China’s coastal areas under the SSP scenario. Reg. Gov. 2021, 8, 63–64. [Google Scholar] [CrossRef]


| Level I Indicators | Secondary Indicators | Index Meaning | Description and Calculation | |
|---|---|---|---|---|
| Exposure (E) | Proportion of low-lying land area (E1) | Area of low-lying land/administrative area with elevation < 10 m | , | (1) |
| where i is the ith evaluation unit; D is the area of the assessment unit with an elevation < 10 m, and M is the area of the assessment unit. | ||||
| Coastline length/assessment unit (E2) | Ratio of coastline length to assessed area | , | (2) | |
| where i is the ith evaluation unit; L is the coastline length of the assessment unit, and M is the area of the assessment unit. | ||||
| Relative sea level height (E3) | Relative sea level height along the coast of the assessment unit | Statistical analysis using spatial analysis tools in ArcGIS. | ||
| Total population (E4) | Total population in the assessment unit | Statistical analysis using spatial analysis tools in ArcGIS. | ||
| Total GDP (E5) | Total GDP in the assessment unit | Statistical analysis using spatial analysis tools in ArcGIS. | ||
|
Sensibility (S) | Proportion of elderly population (S1) | Proportion of the elderly aged over 60 | , | (3) |
| where i is the ith evaluation unit, and j represents the year; C refers to the elderly population over 60 years old in the assessment unit, and P refers to the total population in the assessment unit. | ||||
| Proportion of adolescent population (S2) | Proportion of young people under 14 years old | , | (4) | |
| where i is the ith evaluation unit, and j represents the year; Q is the population of adolescents under 14 years old in the assessment unit, and P is the total population in the assessment unit. | ||||
| Population density (S3) | Population per unit area | Statistical analysis using spatial analysis tools in ArcGIS. | ||
| Adaptability (A) | Proportion of labor force population (A1) | Proportion of labor force aged 15–59 | , | (5) |
| where i is the ith evaluation unit, and j represents the year; N is the labor force population aged 15–59 in the assessment unit, and P is the total population in the assessment unit. | ||||
| Economic density (A2) | Unit area GDP | Statistical analysis using spatial analysis tools in ArcGIS. | ||
| Evaluation Indicators | Weight | Weight Change Threshold | Range | ||
|---|---|---|---|---|---|
| Proportion of low-lying land area | b1 | 0.37 | 0.241 | 0.463 | 0.222 |
| Coastline length/assessment unit | b2 | 0.16 | 0.088 | 0.336 | 0.248 |
| Relative sea level height | b3 | 0.14 | 0.063 | 0371 | 0.308 |
| Total population | b4 | 0.18 | 0 | 0252 | 0.252 |
| Total GDP | b5 | 0.15 | 0 | 0.345 | 0.345 |
| Proportion of elderly population | c1 | 0.15 | 0.113 | 0.225 | 0.112 |
| Proportion of adolescent population | c2 | 0.2 | 0.190 | 0.430 | 0.240 |
| Population density | c3 | 0.65 | 0.520 | 0.943 | 0.423 |
| Proportion of labor force population | d1 | 0.21 | 0 | 0.294 | 0.294 |
| Economic density | d2 | 0.79 | 0.672 | 0.988 | 0.316 |
| Evaluation Unit | Very High | High | Medium | Low | Very Low |
|---|---|---|---|---|---|
| Province | >0.61 | 0.43–0.61 | 0.30–0.43 | 0.21–0.30 | ≤0.21 |
| City | >0.52 | 0.29–0.52 | 0.19–0.29 | 0.07–0.16 | ≤0.07 |
| County | >0.55 | 0.33–0.55 | 0.18–0.33 | 0.09–0.18 | ≤0.09 |
| Vulnerability | SSP1-2.6 | SSP2-4.5 | SSP5-8.5 | |||||||
|---|---|---|---|---|---|---|---|---|---|---|
| 2010 | 2030 | 2050 | 2100 | 2030 | 2050 | 2100 | 2030 | 2050 | 2100 | |
| Very High | 1 | 1 | 1 | 1 | 1 | 1 | 1 | 1 | 1 | 2 |
| High | 0 | 2 | 3 | 3 | 3 | 3 | 3 | 3 | 3 | 3 |
| Medium | 1 | 3 | 3 | 3 | 2 | 3 | 4 | 2 | 3 | 4 |
| Low | 3 | 2 | 3 | 4 | 2 | 4 | 3 | 2 | 3 | 2 |
| Very low | 6 | 3 | 1 | 0 | 3 | 0 | 0 | 3 | 1 | 0 |
| Vulnerability | SSP1-2.6 | SSP2-4.5 | SSP5-8.5 | |||||||
|---|---|---|---|---|---|---|---|---|---|---|
| 2010 | 2030 | 2050 | 2100 | 2030 | 2050 | 2100 | 2030 | 2050 | 2100 | |
| Very High | 1 | 4 | 7 | 5 | 4 | 7 | 5 | 6 | 9 | 8 |
| High | 7 | 15 | 14 | 20 | 15 | 14 | 20 | 13 | 14 | 25 |
| Medium | 11 | 13 | 23 | 32 | 15 | 27 | 34 | 14 | 21 | 29 |
| Low | 14 | 25 | 17 | 5 | 26 | 13 | 3 | 25 | 18 | 0 |
| Very low | 29 | 5 | 1 | 0 | 2 | 1 | 0 | 4 | 0 | 0 |
| Vulnerability | SSP1-2.6 | SSP2-4.5 | SSP5-8.5 | |||||||
|---|---|---|---|---|---|---|---|---|---|---|
| 2010 | 2030 | 2050 | 2100 | 2030 | 2050 | 2100 | 2030 | 2050 | 2100 | |
| Very High | 1 | 3 | 9 | 12 | 4 | 17 | 18 | 7 | 19 | 33 |
| High | 17 | 55 | 53 | 73 | 57 | 67 | 70 | 56 | 55 | 74 |
| Medium | 58 | 70 | 63 | 80 | 70 | 67 | 85 | 66 | 69 | 99 |
| Low | 49 | 47 | 51 | 47 | 49 | 53 | 39 | 48 | 48 | 6 |
| Very low | 87 | 37 | 36 | 0 | 32 | 8 | 0 | 35 | 10 | 0 |
Disclaimer/Publisher’s Note: The statements, opinions and data contained in all publications are solely those of the individual author(s) and contributor(s) and not of MDPI and/or the editor(s). MDPI and/or the editor(s) disclaim responsibility for any injury to people or property resulting from any ideas, methods, instructions or products referred to in the content. |
© 2023 by the authors. Licensee MDPI, Basel, Switzerland. This article is an open access article distributed under the terms and conditions of the Creative Commons Attribution (CC BY) license (https://creativecommons.org/licenses/by/4.0/).
Share and Cite
Li, C.; Cai, R.; Yan, X. Assessment of the Future Changes in the Socio-Economic Vulnerability of China’s Coastal Areas. Sustainability 2023, 15, 5794. https://doi.org/10.3390/su15075794
Li C, Cai R, Yan X. Assessment of the Future Changes in the Socio-Economic Vulnerability of China’s Coastal Areas. Sustainability. 2023; 15(7):5794. https://doi.org/10.3390/su15075794
Chicago/Turabian StyleLi, Cuihua, Rongshuo Cai, and Xiuhua Yan. 2023. "Assessment of the Future Changes in the Socio-Economic Vulnerability of China’s Coastal Areas" Sustainability 15, no. 7: 5794. https://doi.org/10.3390/su15075794