Article

Estimation of Modulus of Deformation Using Rock Mass Rating—A Review and Validation Using 3D Numerical Modelling

by
Hema Vijay Sekar Bellapu
1,*,
Rabindra Kumar Sinha
1 and
Sripad Ramchandra Naik
2
1
Department of Mining Engineering, Indian Institute of Technology, Indian School of Mines, Dhanbad 826 004, India
2
National Institute of Rock Mechanics, Bengaluru 560 070, India
*
Author to whom correspondence should be addressed.
Sustainability 2023, 15(7), 5721; https://doi.org/10.3390/su15075721
Submission received: 23 January 2023 / Revised: 1 March 2023 / Accepted: 9 March 2023 / Published: 24 March 2023
(This article belongs to the Special Issue Advances in Rock Mechanics and Geotechnical Engineering)

Abstract

:
The Himalayan region has enormous potential for hydropower development. However, variations in geological and geotechnical conditions pose challenging tasks for the designers. If these variations are not tackled in a timely manner during underground excavations, especially for caverns, instabilities may occur, resulting in time and cost over-runs. For sustainable hydropower development, minimizing these over-runs is necessary. The modulus of deformation (Ed) of a rock mass is an essential input parameter required in the design of underground excavations. This study involves collecting the results of extensive in situ tested values for various hydroelectric projects in the Himalayan regions, along with the rock mass rating (RMR) values at 35 test sites. Ed is estimated empirically based on statistical analysis. Comparisons were made with the empirical equations already available in the literature, using RMR and the proposed equation for estimating Ed. Although different researchers have proposed many equations for estimating the value of Ed using RMR, a gap exists in validating such equations. In this regard, the proposed equation for Ed was verified by carrying out 3D numerical-modelling studies using FLAC3D, an explicit finite-difference software for an underground powerhouse cavern and comparing the displacement values with the field instrumentation data.

1. Introduction

There is a massive shift globally from nonrenewable to renewable energy, i.e., solar, hydropower and wind. Hydropower was ranked as the highest renewable energy in 2019 [1]. However, many hydropower electric projects under construction are delayed due to geological and geotechnical variations. This, in turn, will result in cost and time over-runs. An average of 182% over-run of time was observed in 29 hydroelectric projects located in the Himalayan states of India with an installed capacity of 9840 MW. Of these 29 projects, an average of 114% over-run of cost was observed in 23 projects with an installed capacity of 8138 MW [2]. The over-run of time and cost varied from 49% to 364% and from 14% to 254%, respectively [3]. Hence, the cost and time over-runs must be minimized to complete projects successfully. The completion of the Punatsangchhu II hydroelectric project in Bhutan was delayed due to the collapse of rock mass in the crown of one of the underground caverns [4].
The mountain chain of the Himalayas comprises a complicated fold-and-thrust belt. It can be divided into three units: Sub-Himalaya, Lesser Himalaya, and Higher Himalaya, from south to north [5]. The Sub-Himalayan range is the youngest of the three and has an elevation of about 1200 m. Intracrustal thrusts demarcate the Lesser Himalayan domain, i.e., main boundary thrust (MBT) in the north and main central thrust (MCT) in the south. The Lesser Himalayan range runs parallel to the Sub-Himalayan range and has an elevation of about 2000 m to 5000 m. The Higher Himalayas are the oldest formations out of the three and have an elevation of about 6000 m. The Lesser Himalayas comprises chert, argillaceous, arenaceous, and calcareous units. These complex formations and high tectonic activity in the Himalayas may yield uncertainty in estimating the rock mass parameters required for designing underground excavations.
Hence, underground excavations must be designed considering reliable geotechnical input parameters, such as rock mass strength (compressive, tensile, shear, cohesion, and friction angle), deformation properties, stress regimes, hydrological conditions, and joint characteristics. Out of all these input parameters, the deformation modulus was found to play an essential role in assessing the stability of large caverns in the Himalayas [6].
In designing underground excavations for tunnels and caverns, estimating the expected rock mass deformations around the openings is essential. The modulus of deformation (Ed) of a rock mass typically provides information about the deformation characteristics, i.e., elastic and plastic behavior when the rock mass is subjected to loading and unloading conditions. Joint friction parameters and rock strength play an essential role in the deformation mechanics of rock mass in addition to the Ed value [7]. In recent years, there has been an advancement in numerical tools for analyzing the support system for underground excavations. The output from these numerical tools, however, depends on the reliability of the input data. The Ed value is one of the critical design parameters required for numerical modelling [8] in the design of dam structures and underground excavations.
As per [9,10], Ed is defined as the ratio of stress to strain (elastic and plastic) during the loading of a rock mass, whereas the modulus of elasticity (Ee) is defined as the ratio of stress to strain (elastic) during the unloading of a rock mass. Hence, while carrying out any in situ testing, estimating the Ee value along with Ed is a general practice.
The most-preferred in situ tests for the estimation of Ed are the plate-jacking test (PJT) or uniaxial-jacking test, plate-loading test (PLT), and flat jack test (FJT) carried out in drifts or small tunnels. In contrast, the dilatometer test (DT) and goodman jack test (GJT) are conducted in boreholes of NX size [10]. The size of the drift or gallery required for carrying out the in situ testing needs to be as small as required for carrying out the test. During loading and unloading of the rock mass area, the deformations are measured using a multipoint borehole extensometer (MPBX) in boreholes and a linear variable differential transformer (LVDT) case for measuring surface displacements, which are used in determining the in situ value of Ed. However, in situ tests are complicated, expensive, and time-consuming [6]. In addition, each type of in situ test will result in different values due to differences in test procedures and rock mass damage due to blasting [11,12].
Due to these reasons, several empirical relations were proposed by different researchers for determining the value of Ed based on rock mass classification systems, such as rock mass rating (RMR), tunneling-quality index (Q), geological strength index (GSI); and intact rock properties, such as uniaxial compressive strength (UCS), Young’s modulus (Ei), disturbance factor (D), and weathering degree (WD). These empirical equations are developed based on the data collected for a particular location and rock type. Using these equations to estimate the deformation modulus value at other sites may not yield correct values.
Based on the studies carried out by [13], it is noticed that empirical relations proposed for Ed based on intact properties (UCS and Ei) gave less reliable results when compared with those of rock mass classification systems. Although many empirical relations are available in the literature for estimating Ed, only those equations with an RMR value as the input parameter are considered in this study [12,14,15,16,17,18,19,20,21,22,23,24,25,26,27,28,29,30,31], since this is the most widely accepted method of rock mass characterization. The RMR classification system was developed by Bieniawski (1974, 1989) [32], updating the charts and tables for the six parameters, i.e., intact rock UCS, rock quality designation (RQD), spacing of joint or discontinuity, joint condition, condition of groundwater, and orientation of joint set. The rock masses at the in situ test locations were classified based on the RMR. Drillability studies conducted on rocks also provided insight into the petrophysicomechanical properties that indicated the influence of various petrographic, physical, and mechanical properties of rock [33,34,35]. From the numerical modelling studies [36], it was observed that when the in situ tested value of Ed is in the range of 1 to 3 GPa, the predicted displacements were almost thrice the measured values. However, suppose the rock mass is too competent, as studied in [37], it can be noted that the in situ value of Ed is higher when compared with that of the back-calculated value from numerical modelling. Depth also was found to influence the Ed values in discontinuum models compared to that of continuum models. At shallow depths, the discontinuities deformed significantly in comparison with that of deeper depths [38]. In addition, studies were carried out for understanding the variations in joint set sizes and orientations on the directional deformation modulus for rock mass [39].
It is understood that Ed is the critical design parameter for the design of large underground excavations, which needs to be determined correctly, and which otherwise has the potential to result in time and cost over-runs. Determining Ed values by in situ testing will have huge financial implications for the project. Thus, this study aims to develop a predictor model for estimating the Ed value using the RMR, which can be useful to the designers or project authorities for design of underground excavations if there is a lack of in situ tested data for projects in the Himalayan region.

2. Methodology

The present study reviews the prediction of Ed values based on the existing empirical relations using the values of the rock mass rating. A new empirical equation is proposed to be developed considering the available in situ tested data from the projects constructed in the Himalayan region. A comparison is made for the value of Ed concerning the existing equations and the newly proposed equation. Finally, 3D numerical modelling studies are carried out considering the value of Ed determined in situ and the value obtained from the proposed equation and comparing the model displacement values with that of the measured values. The empirical equations considered in the study, along with their limitations, coefficient of regression (R2), number of data sets considered by worldwide researchers, range of RMR values, country of origin, and the lithology considered while developing the relations, are given in Table 1.
The datasets considered in this study involve collecting the in situ tested values of Ed and Ee for 35 test locations in the Himalayan region spanning over India, Bhutan, and Nepal from the published literature [40,41,42,43,44,45] and the National Institute of Rock Mechanics (NIRM) reports [46,47,48,49,50]. In situ tests conducted at the study locations are PLT (deformations measured at the surface), PJT (deformation measured inside the boreholes), carried out in drifts, and the Goodman jack test, carried out in boreholes. The in situ test locations from where data are collected are shown in Figure 1. The in situ tested values of Ed, Ee, and the corresponding RMR values for the identified 35 site locations are shown in Figure 2 (a) and (b), respectively.
Statistical analysis was performed to establish a relationship between the RMR and Ed, and an equation to predict Ed from the RMR was proposed. The reliability and predictability of the proposed and the available equations were compared using statistical tools, and the reliable equation for the Himalayan region was presented. The equation was validated using the tested and estimated values in the 3D numerical model developed for Tala Hydroelectric Project, Bhutan. The instrumentation data were utilized for making comparisons with those of the modelling results.

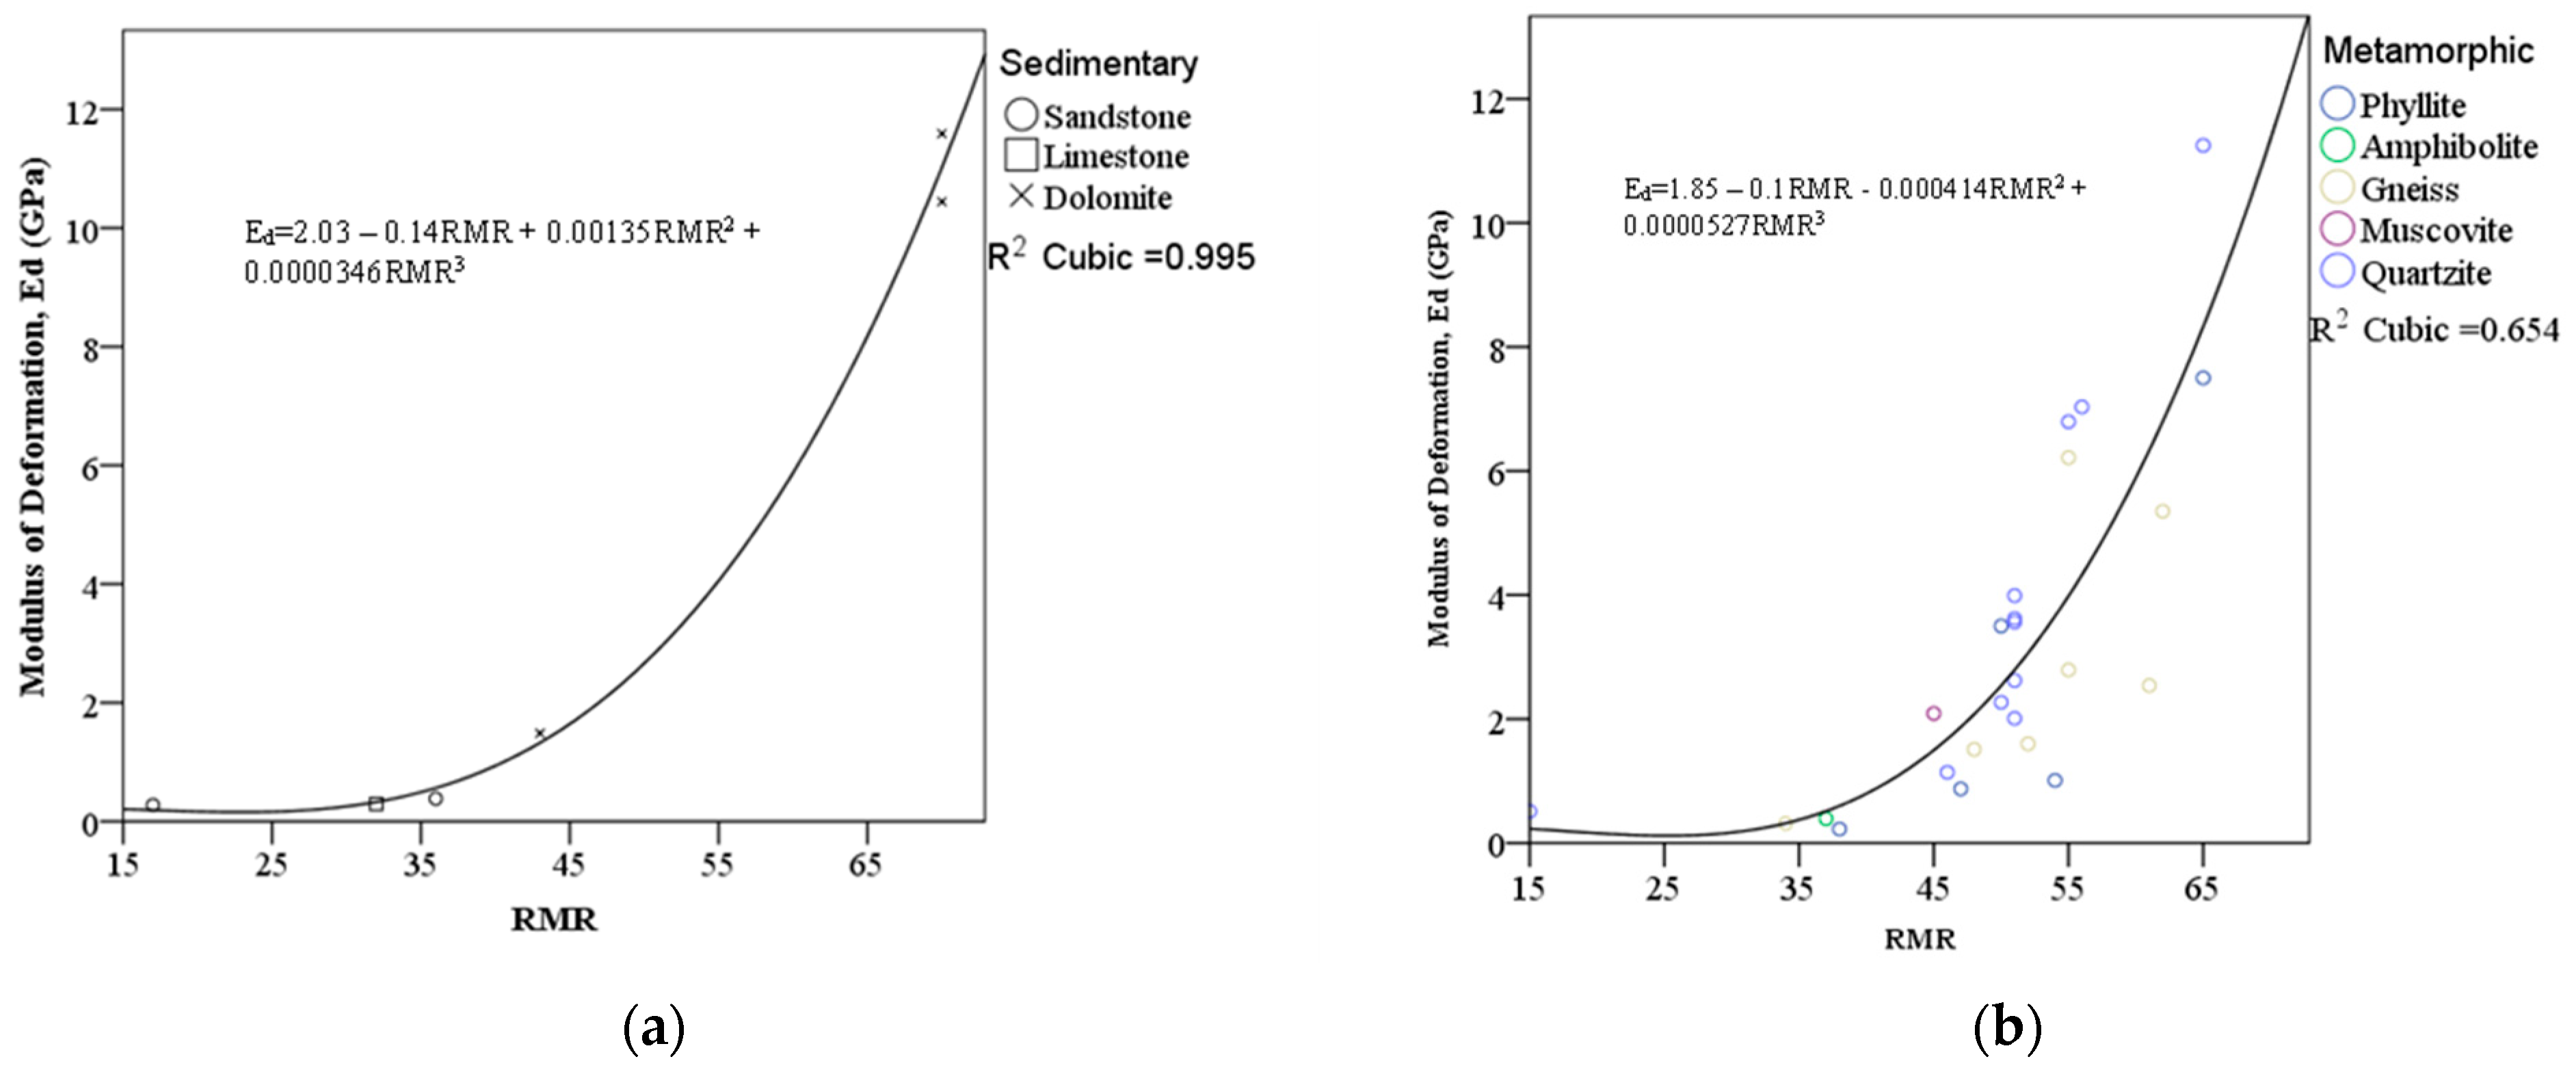
3. Statistical Analysis

Statistical analyses using linear, logarithmic, cubic, and exponential functions were evaluated using Statistical Package for the Social Sciences (SPSS) software for the collected data and are presented in Figure 3 and Table 2. Figure 2a shows that the range of RMR values are from 15 to 70, and the range of Ed values are from 0.118 to 11.591 GPa. It is also observed that the cubic function given in Equation (19) has the highest value of the coefficient of regression (R2), i.e., R2 = 0.75 when compared to other functions, as shown in Figure 3.
E d = 0.00011 R M R 3 0.0083 R M R 2 + 0.2 R M R 1.3
To understand the prediction capacity, the root–mean–square error (RMSE) and variance accounted for (VAF) were calculated using Equations (20) and (21) for all the empirical equations discussed in Table 1, along with that of Equation (19). Root–mean–square error is defined as the standard deviation of the residuals. Residual is defined as the difference between the predicted and the actual values for each data point. In other words, residuals are nothing but prediction error. The RMSE is generally used as a measure in evaluating the performance of predictions and to check the efficiency of the model. The model is said to be accepted in regression analysis if the values of the RMSE and VAF are close to 0 and 100, respectively.
R M S E = 1 n i = 1 n ( x x ) 2
V A F = 1 v a r ( x x ) v a r ( x ) 100
The calculated RMSE and VAF values for Equation (19) are 1.70 and 74.33, respectively. Equation (19) was found to have a good prediction capacity compared to the other empirical equations listed in Table 1. The collected data could be further categorized based on the rock type, such as sedimentary and metamorphic rocks. The correlation between Ed and RMR values was made for rock types and the cubical function is shown in Figure 4.
The Ed values were calculated for the RMR values at in situ tested locations based on the empirical relations proposed by different authors and are shown in Figure 5. It is noticeable from Figure 5 that Equation (19) closely matches with that of the in situ tested-values curve. The empirical equations proposed by [15,21,22,30] are also in good comparison with that of the in situ tested value. The empirical equations proposed by [12,24,26,28,29] overestimated, and the remaining equations underestimated the Ed values.

4. Case Study—Tala Powerhouse Complex

The Tala Hydroelectric Project (1020 MW) is located on river Wangchhu, Western Bhutan [51,52]. The project consists of an underground machine-hall cavern, housing six units, each with a capacity of 175 MW. The machine-hall cavern (MHC) and the transformer-hall cavern (THC) dimensions are 206.4 m × 20.4 m × 44.5 m and 191 m × 16 m × 24.5 m, respectively. The rock pillar between the caverns is 40 m. The overburden ranges from 400 m to 500 m at the MHC and THC.
Hydrofracturing tests were carried out in the powerhouse cavern’s exploratory drift to understand the stress field. The major principal stress is oriented in N50°W. The vertical stress of 10.865 MPa is calculated based on the overburden depth of 410 m. The ratio of maximum horizontal to vertical stress and minimum horizontal to vertical stress are 1.31 and 0.87, respectively [53,54]. The caverns are aligned in N37°W–S37°E direction across the strike of foliation [6].

4.1. Geology

The major lithology at the Tala Powerhouse complex consists of quartzite, phyllites, amphibolite schist, and phyllitic quartzite. The discontinuities were initially mapped in the exploratory drift (2 m × 2 m) driven in the machine-hall cavern along the crown level. The general foliation observed in the exploratory drift vary from N65° E–S65° W to N70° W–S70° E. The average foliation dip is 45.5°, and dip direction is N357°. Five sets of joints were observed in the exploratory drift in addition to the foliation. The rock quality index (Q) varied from 0.24 to 13.2 [53]. The representative value of RMR assessed in the caverns is 55.

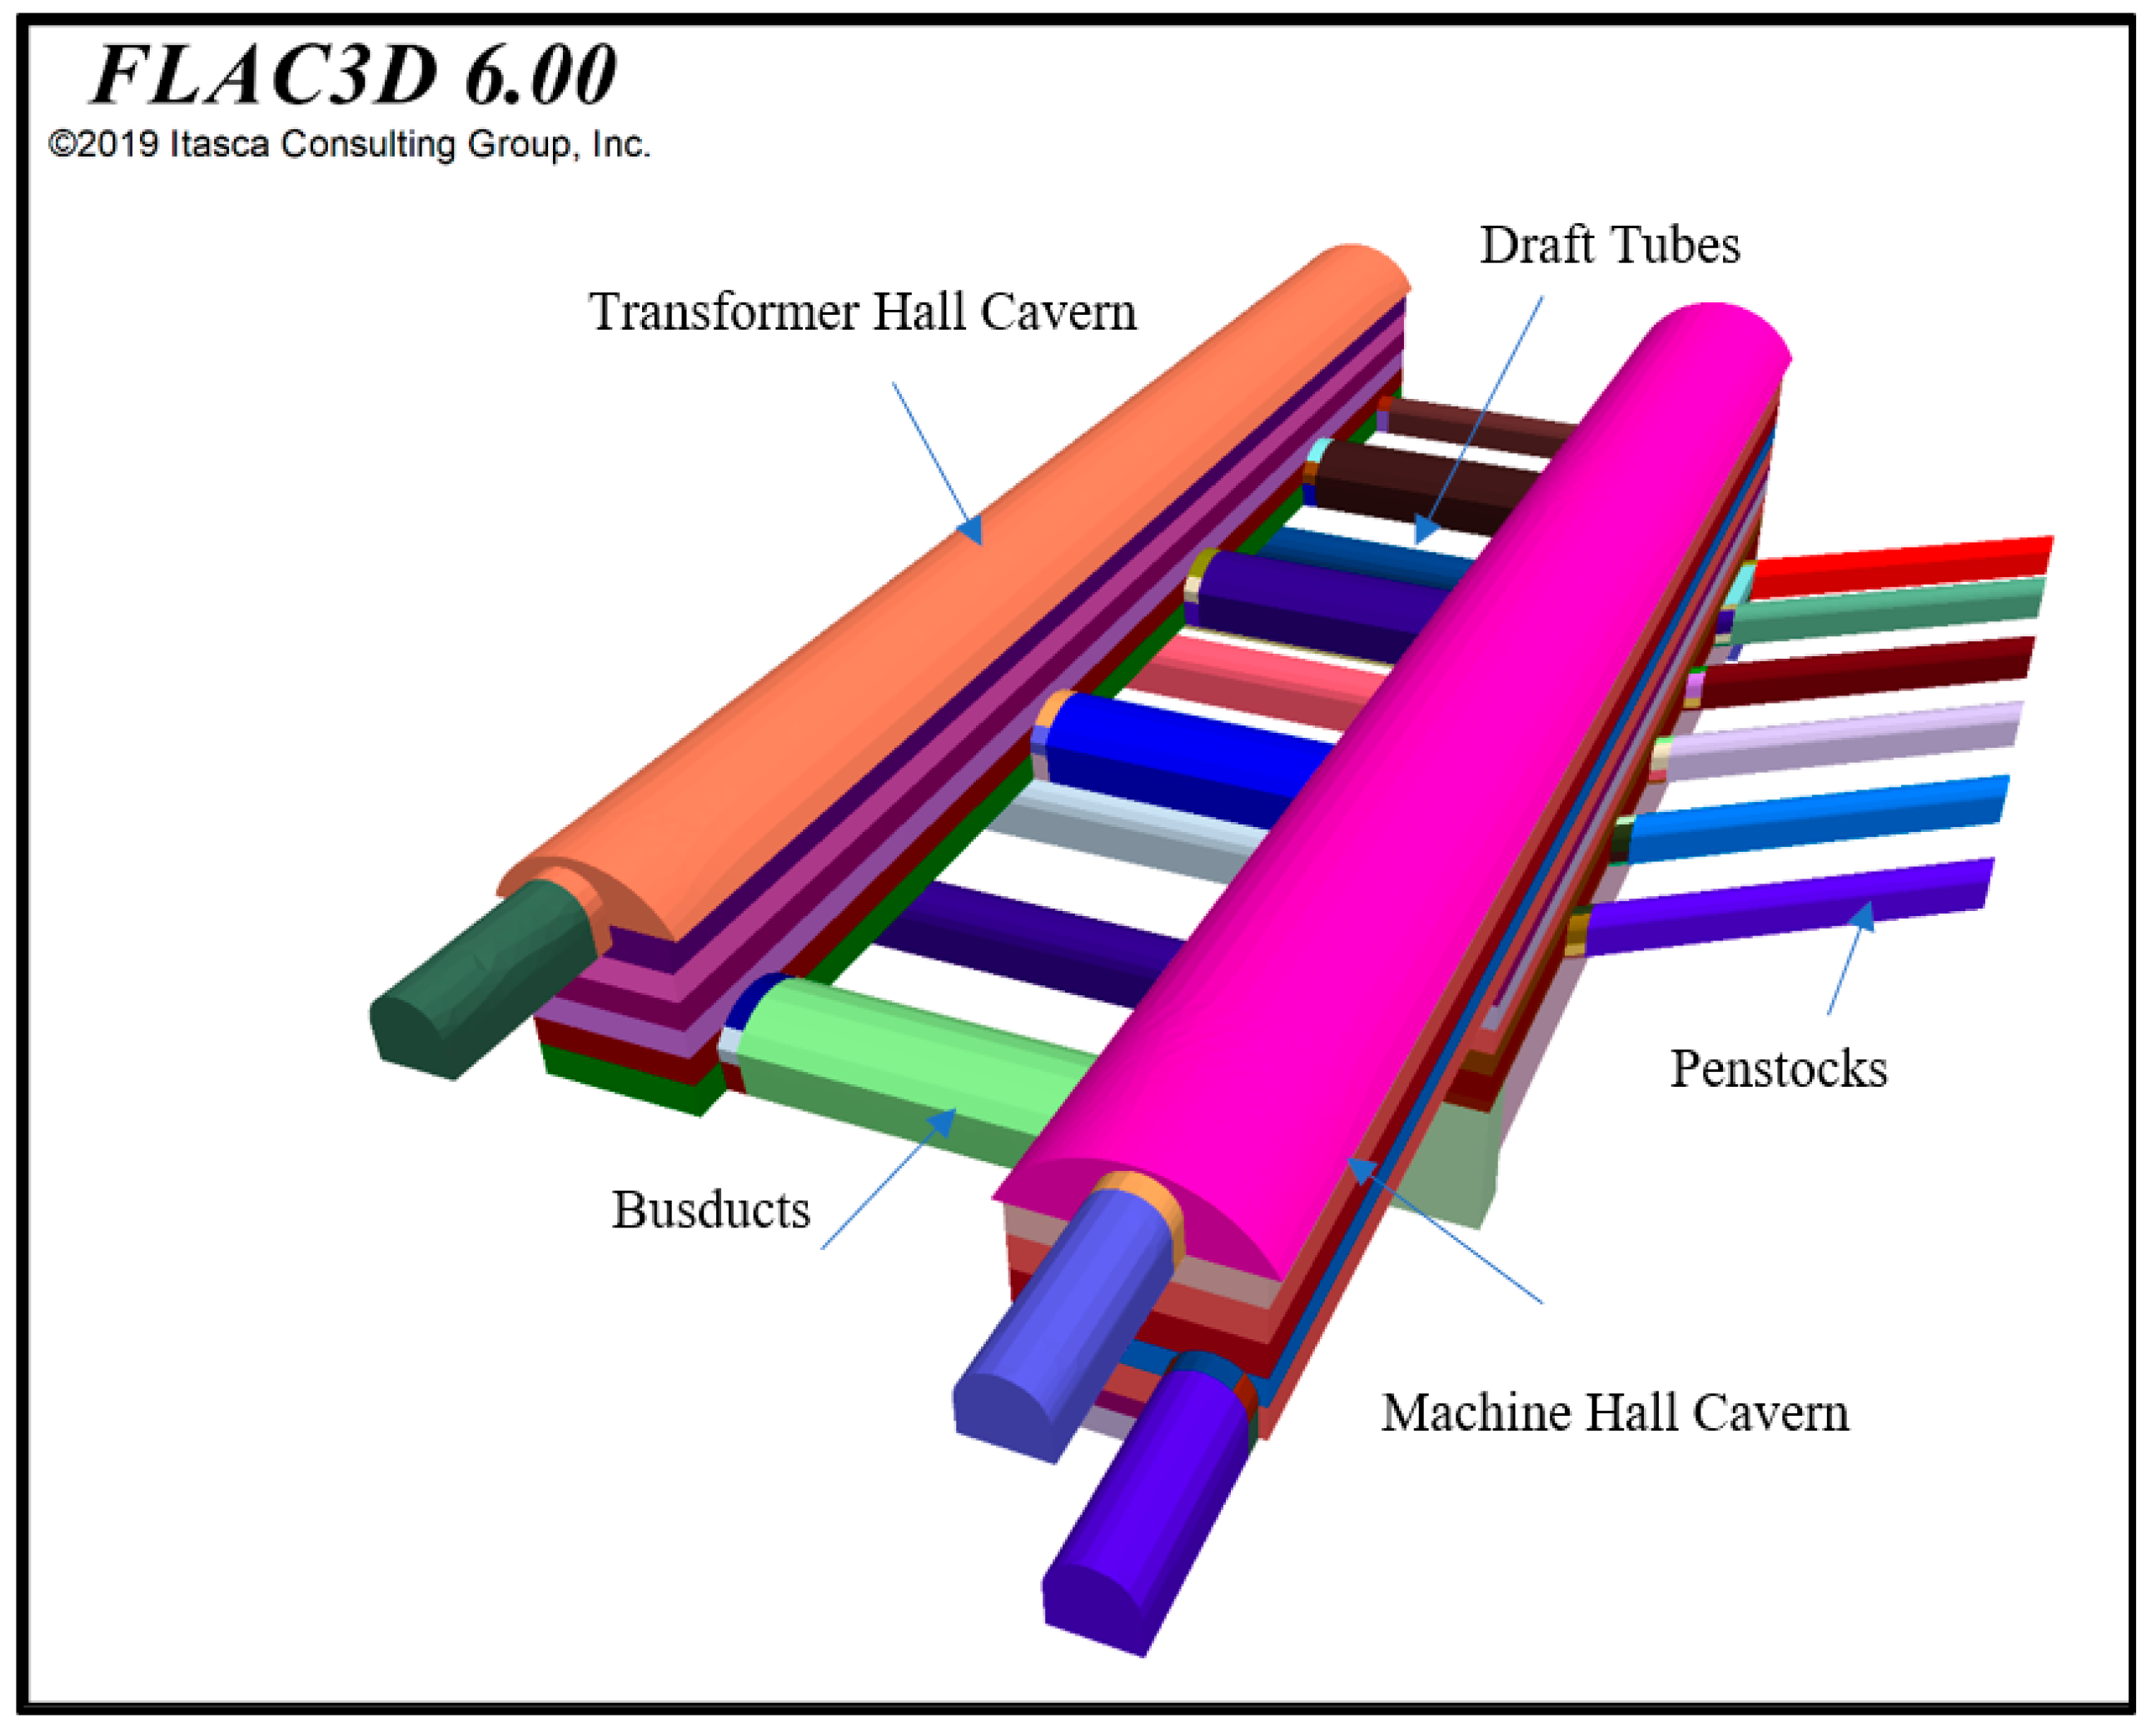
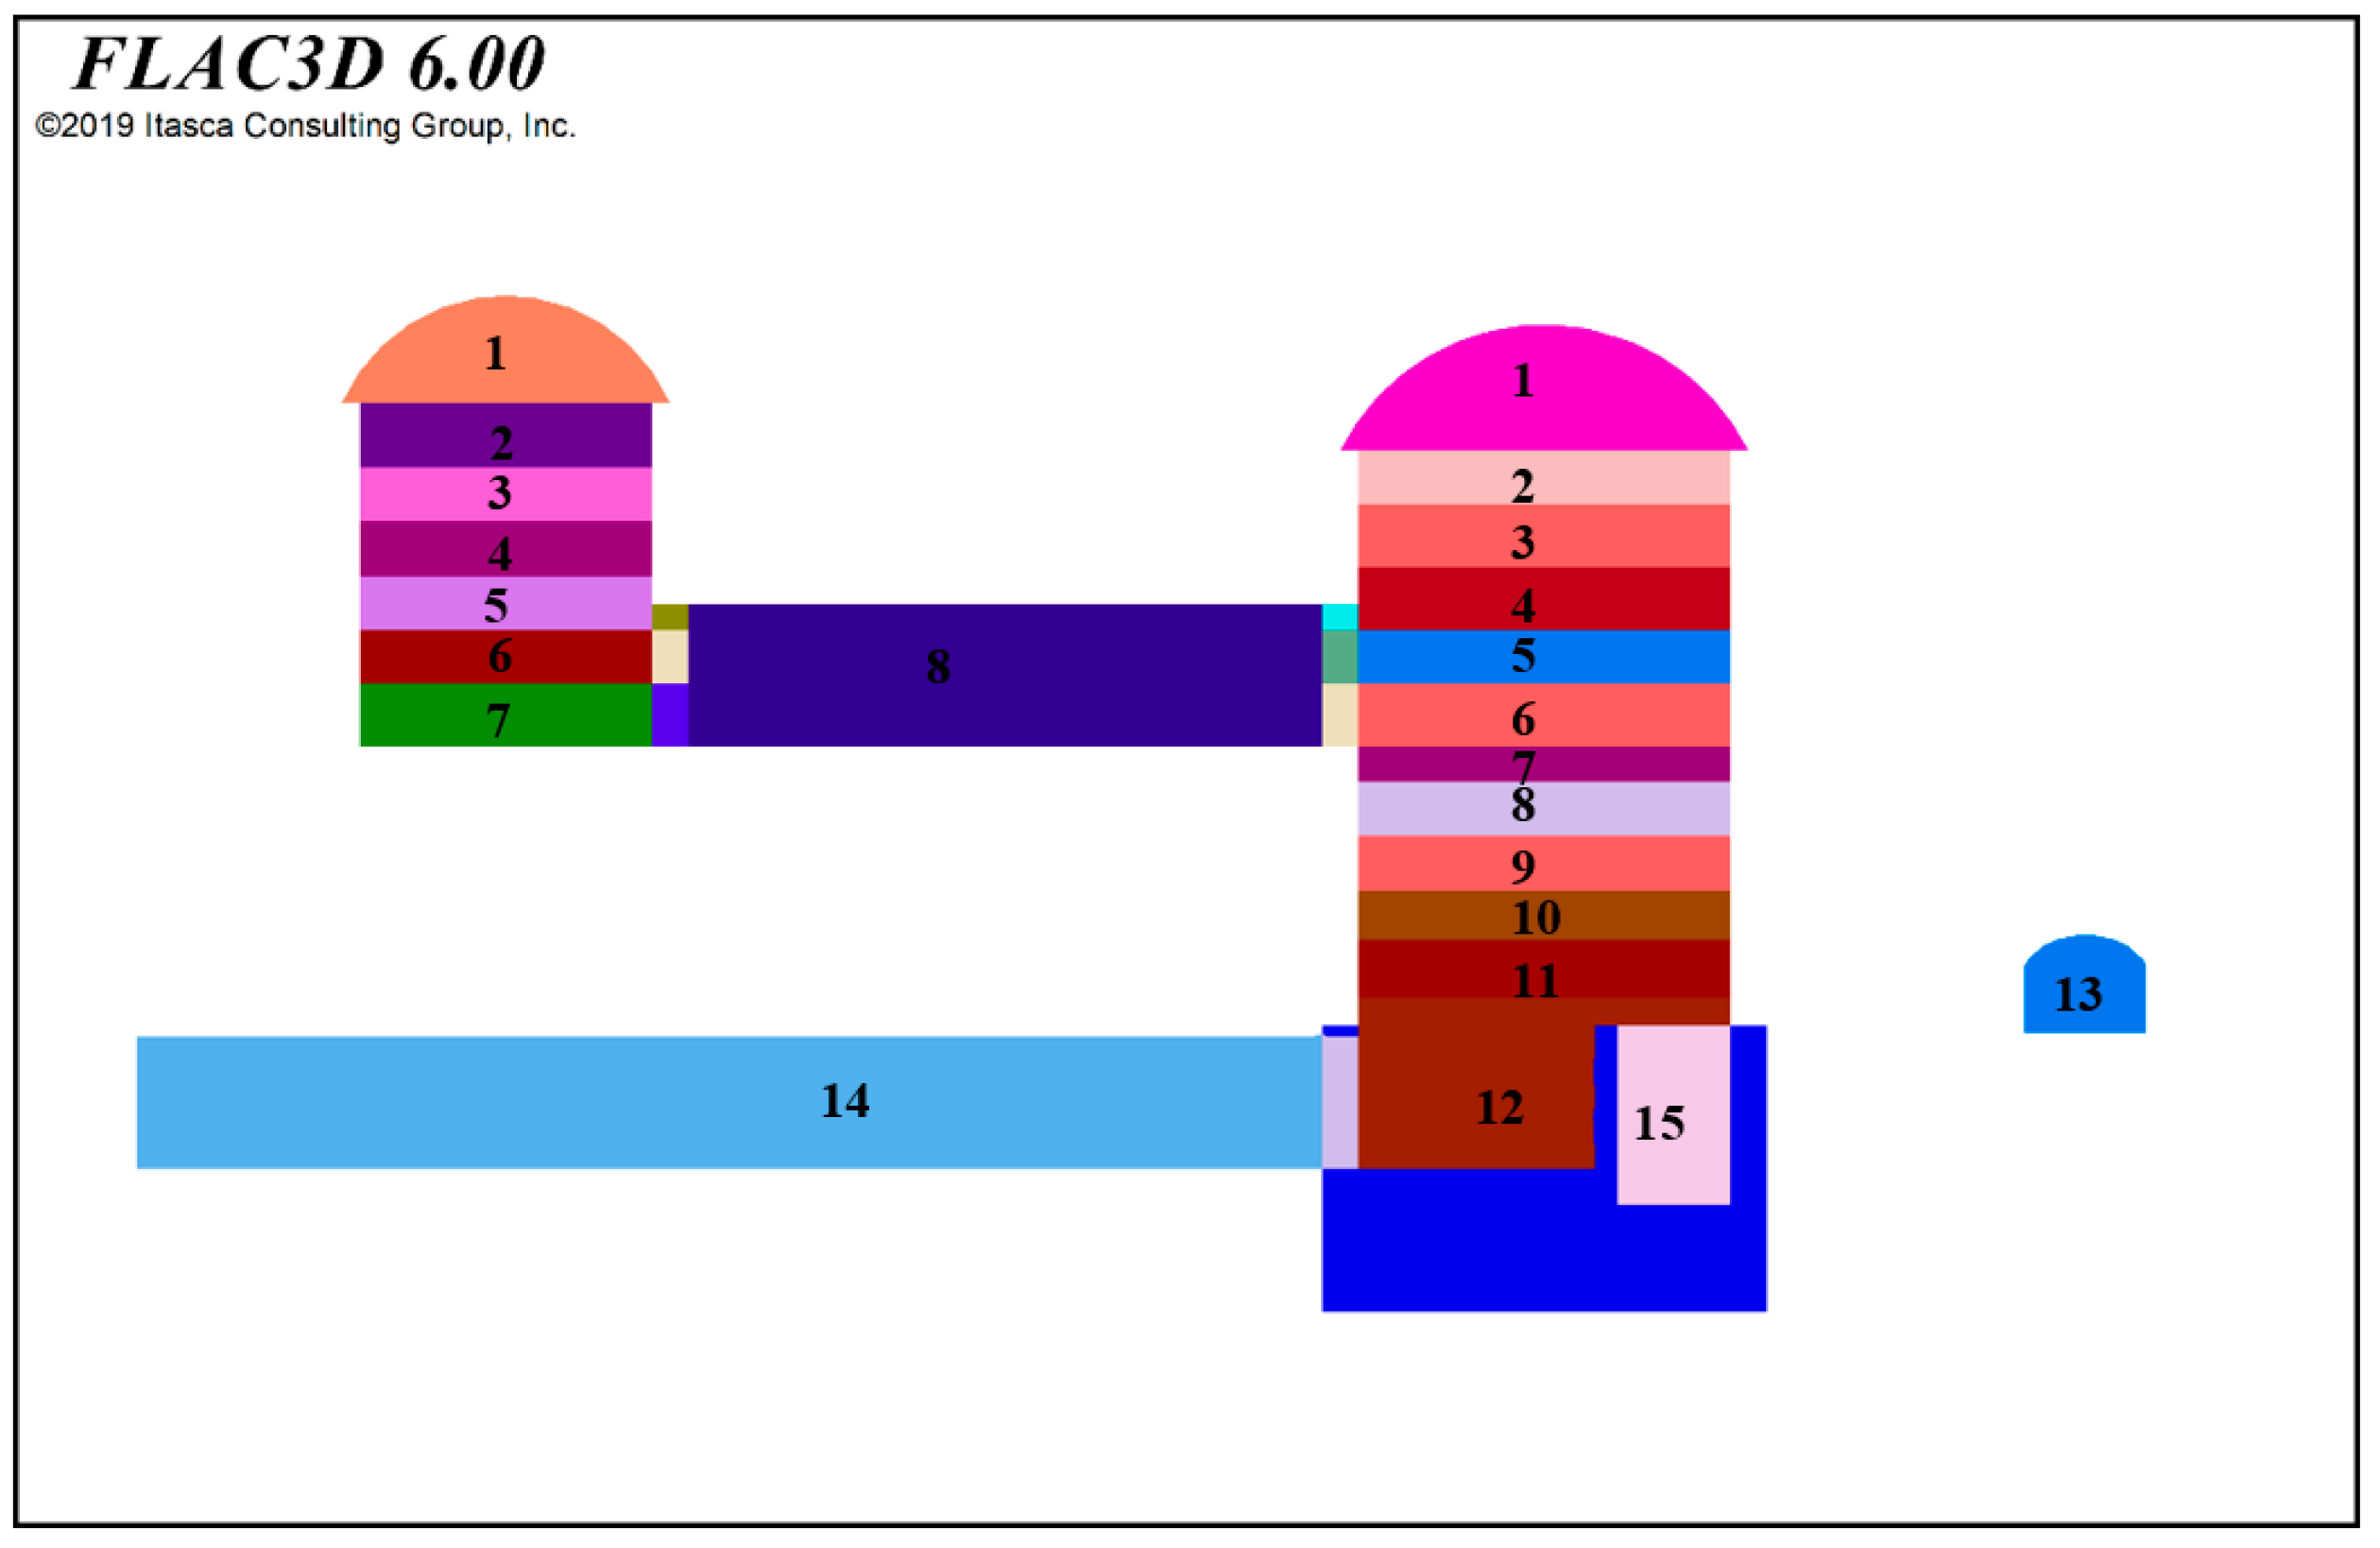
4.2. 3D Numerical Modelling

Three-dimensional numerical modelling was carried out in this study using FLAC3D (Fast Lagrangian Analysis of Continua—three-dimensional) software. It utilizes an explicit finite-volume formulation for capturing models with complex behavior. The FLAC3D model, consisting of complex excavations of the machine-hall cavern, transformer-hall cavern, penstocks, bus ducts, and draft tubes considered in this study, is given in Figure 6. The in situ stress values obtained from the hydrofracturing tests were incorporated into the model before the start of the model simulation works.

4.3. Excavation Sequence and Support System

Initially, the machine-hall cavern’s crown was excavated to the full width, followed by benching. The benching in the MHC and THC was taken up in 11 and 6 stages at the site. The bench heights in both caverns varied from 3 to 4 m. The excavation sequence adopted at the site was simulated in the 3D numerical model and is given in Figure 7. The support system installed at the site [55,56,57,58] and considered in the model in MHC and THC is shown in Table 3.

4.4. Material Properties

A linear, perfectly elastic–plastic constitutive model that follows the Mohr–Coulomb failure criterion was considered for the modelled rock mass [7] and postulated that the shear strengths of rocks comprise two parts—a constant cohesion and a normal stress-dependent frictional component. Two models were simulated in this study, considering the estimated Ed value of 2.89 GPa (Model A), based on the empirical Equation (19) for an RMR value of 55, and another model with an in situ tested (PLT), Ed value of 6.793 GPa [35,59] (Model B). Other material properties considered in the present analysis for both models are a density of 2650 kg/m3, cohesion of 2.28 MPa, and friction angle of 28.3° [53].

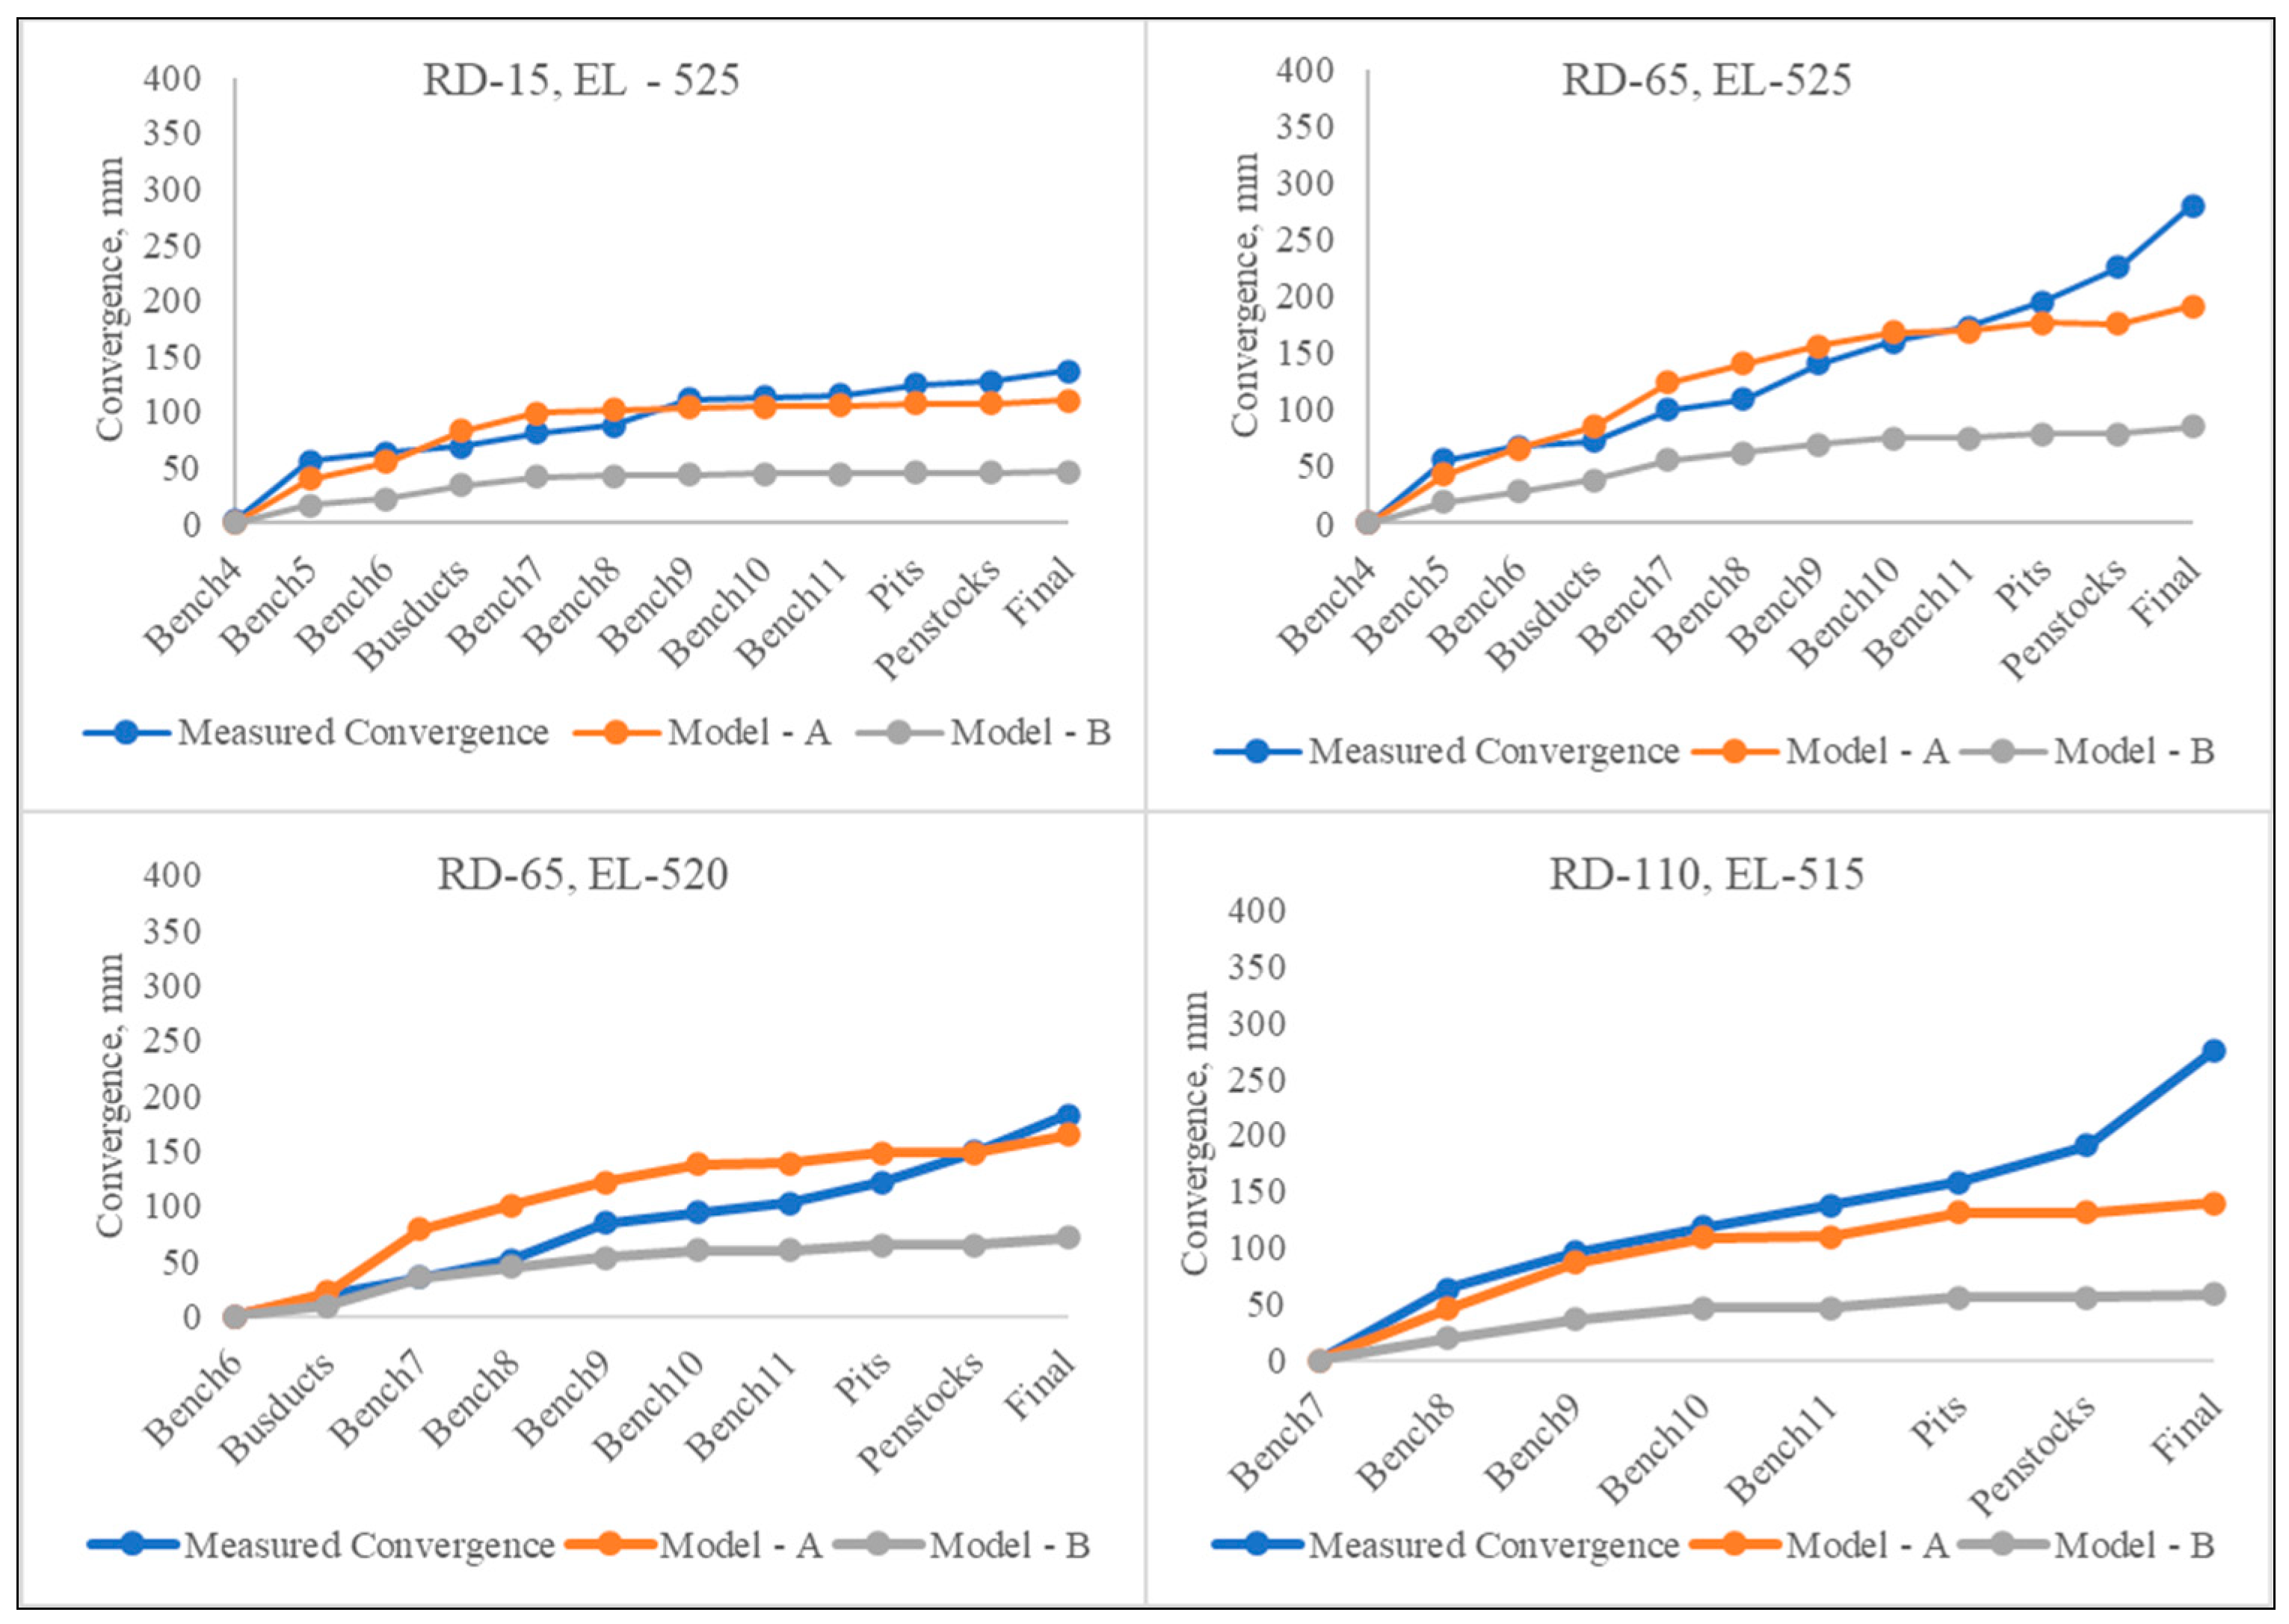
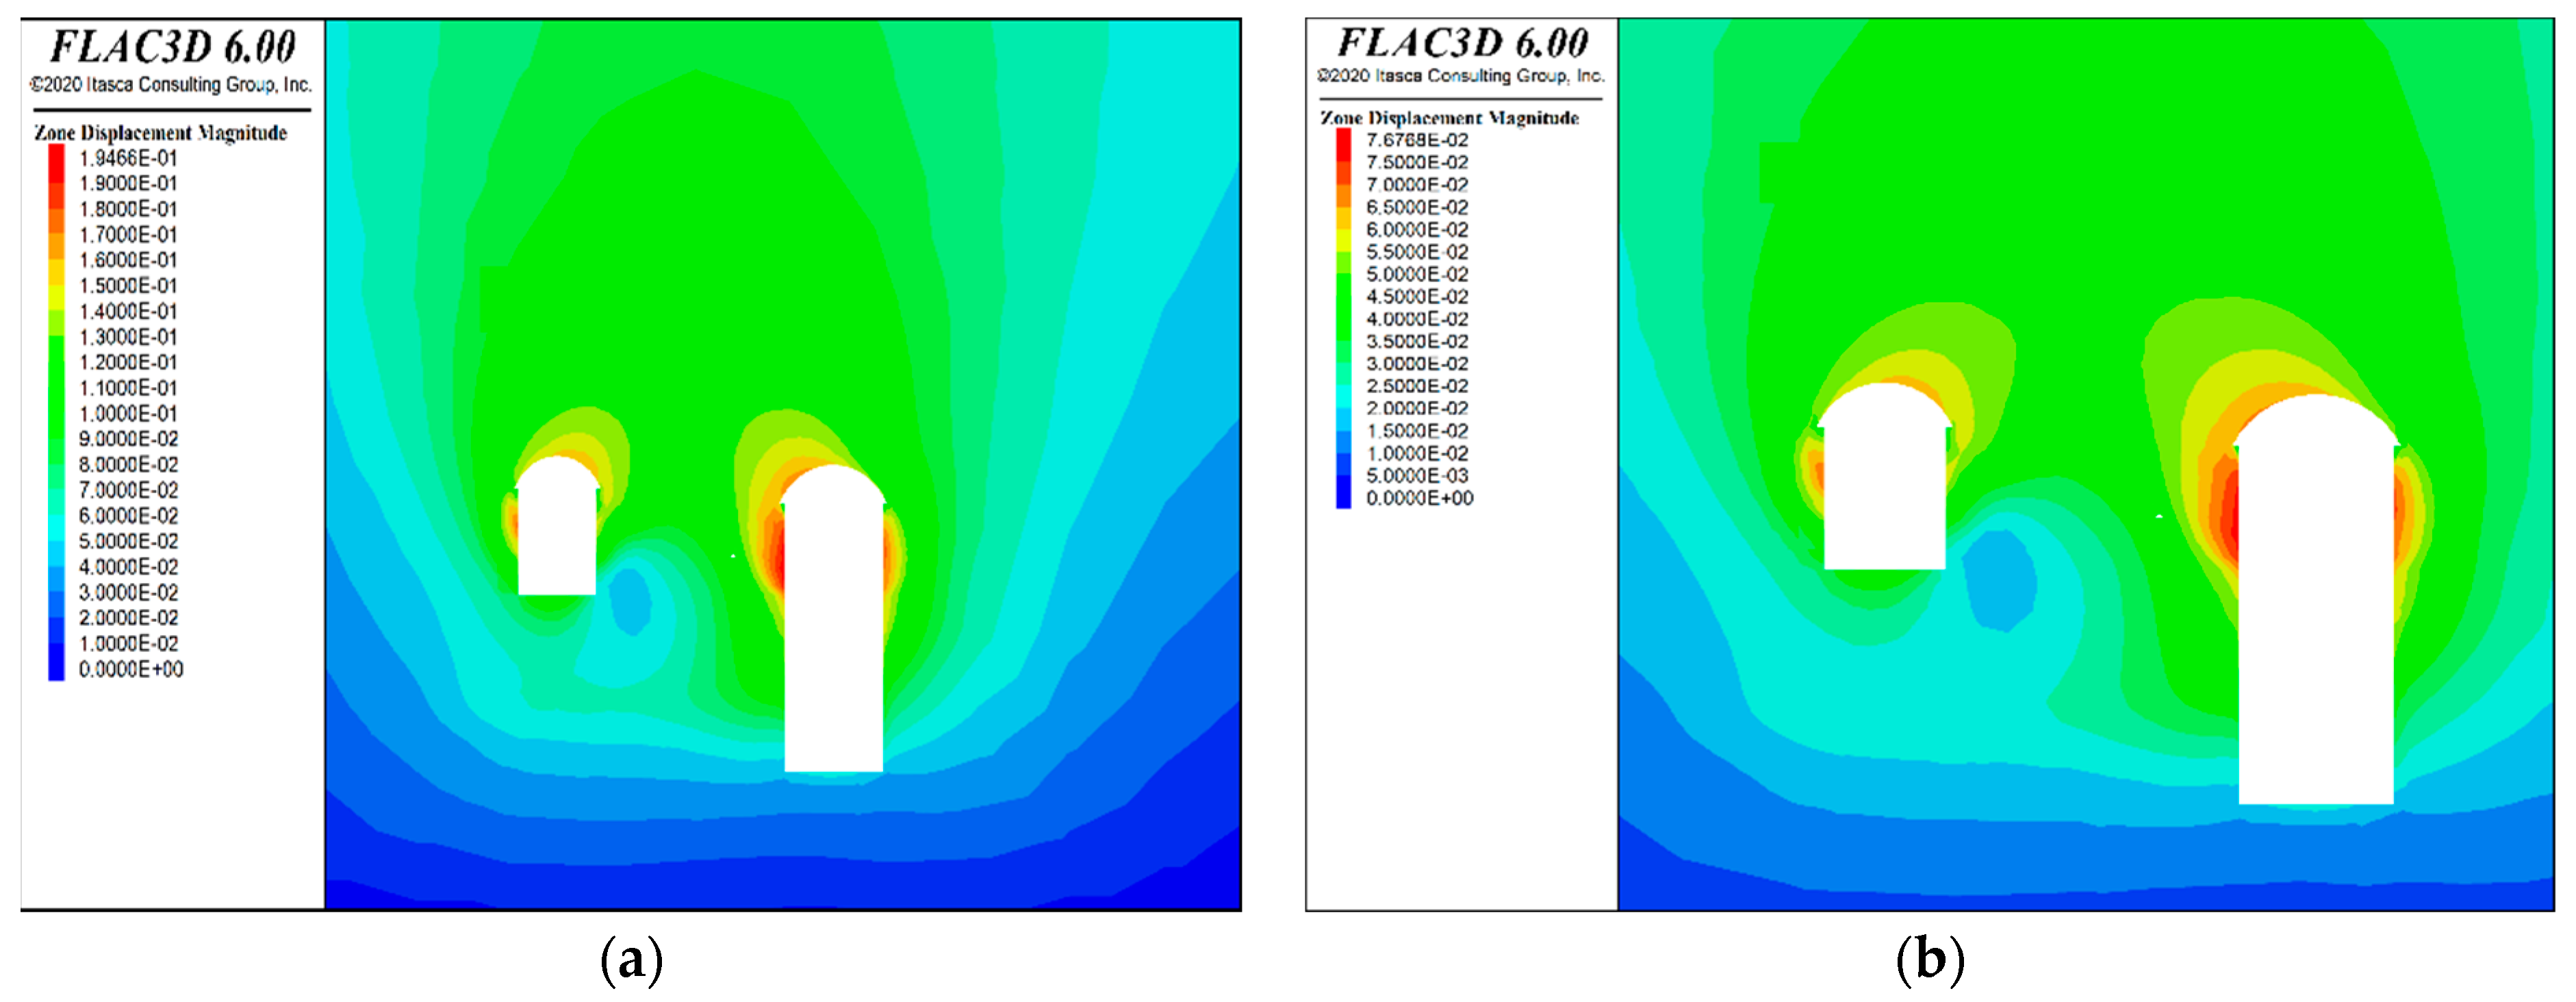
4.5. Comparison of Modelling Results with Instrumentation Data

Various instruments were installed during different stages of excavation of the machine-hall cavern at the Tala Hydroelectric project, Bhutan. Displacements were measured using multipoint borehole extensometers (MPBX), reflective targets were used to measure the convergence of side walls using total station, and loads were measured by anchor load cells [6,60]. Wall convergence was measured using a total station that had an accuracy of 0.5 s. Reflective targets were installed opposite to each other on the walls of the machine-hall cavern for convergence measurements using the tie-distance method. The cavern walls convergence measured in the field was compared with the numerical modelling results for both Models A and B, respectively. The convergence was measured at the site for RD 15 m, 65 m, 110 m, and 150 m at EL 525 m, EL 520 m, and EL 515 m. Different benches were considered as the reference for a particular elevation based on the availability of the instrumentation data [6]. Bench 4 was taken as a reference for EL 525 m, bench 6 was taken as a reference for EL 520 m, and bench 7 was taken as a reference for EL 515 m. The measured and modelled convergence plots at EL 525 m, EL 520 m, and EL 515 m for two models, i.e., Model A with an Ed value of 2.89 GPa and Model B with an Ed value of 6.793 GPa, are shown in Figure 8.
Figure 8 shows that Model B is underpredicting the deformations in the powerhouse complex at all the locations, indicating that the in situ tested Ed value is on the higher side, enhancing the rock mass properties. Measured convergence matched well in Model A compared to Model B. Hence, the relation proposed in Equation (19) can be utilized to estimate the value of Ed. The displacement contours (in m) at RD 65 m after the complete excavation of the powerhouse complex for Models A and B are shown in Figure 9 (a) and (b), respectively.

5. Conclusions

This research has provided insight into the method for estimating the modulus of deformation using rock mass rating values. The conclusions derived from the current study are presented below:
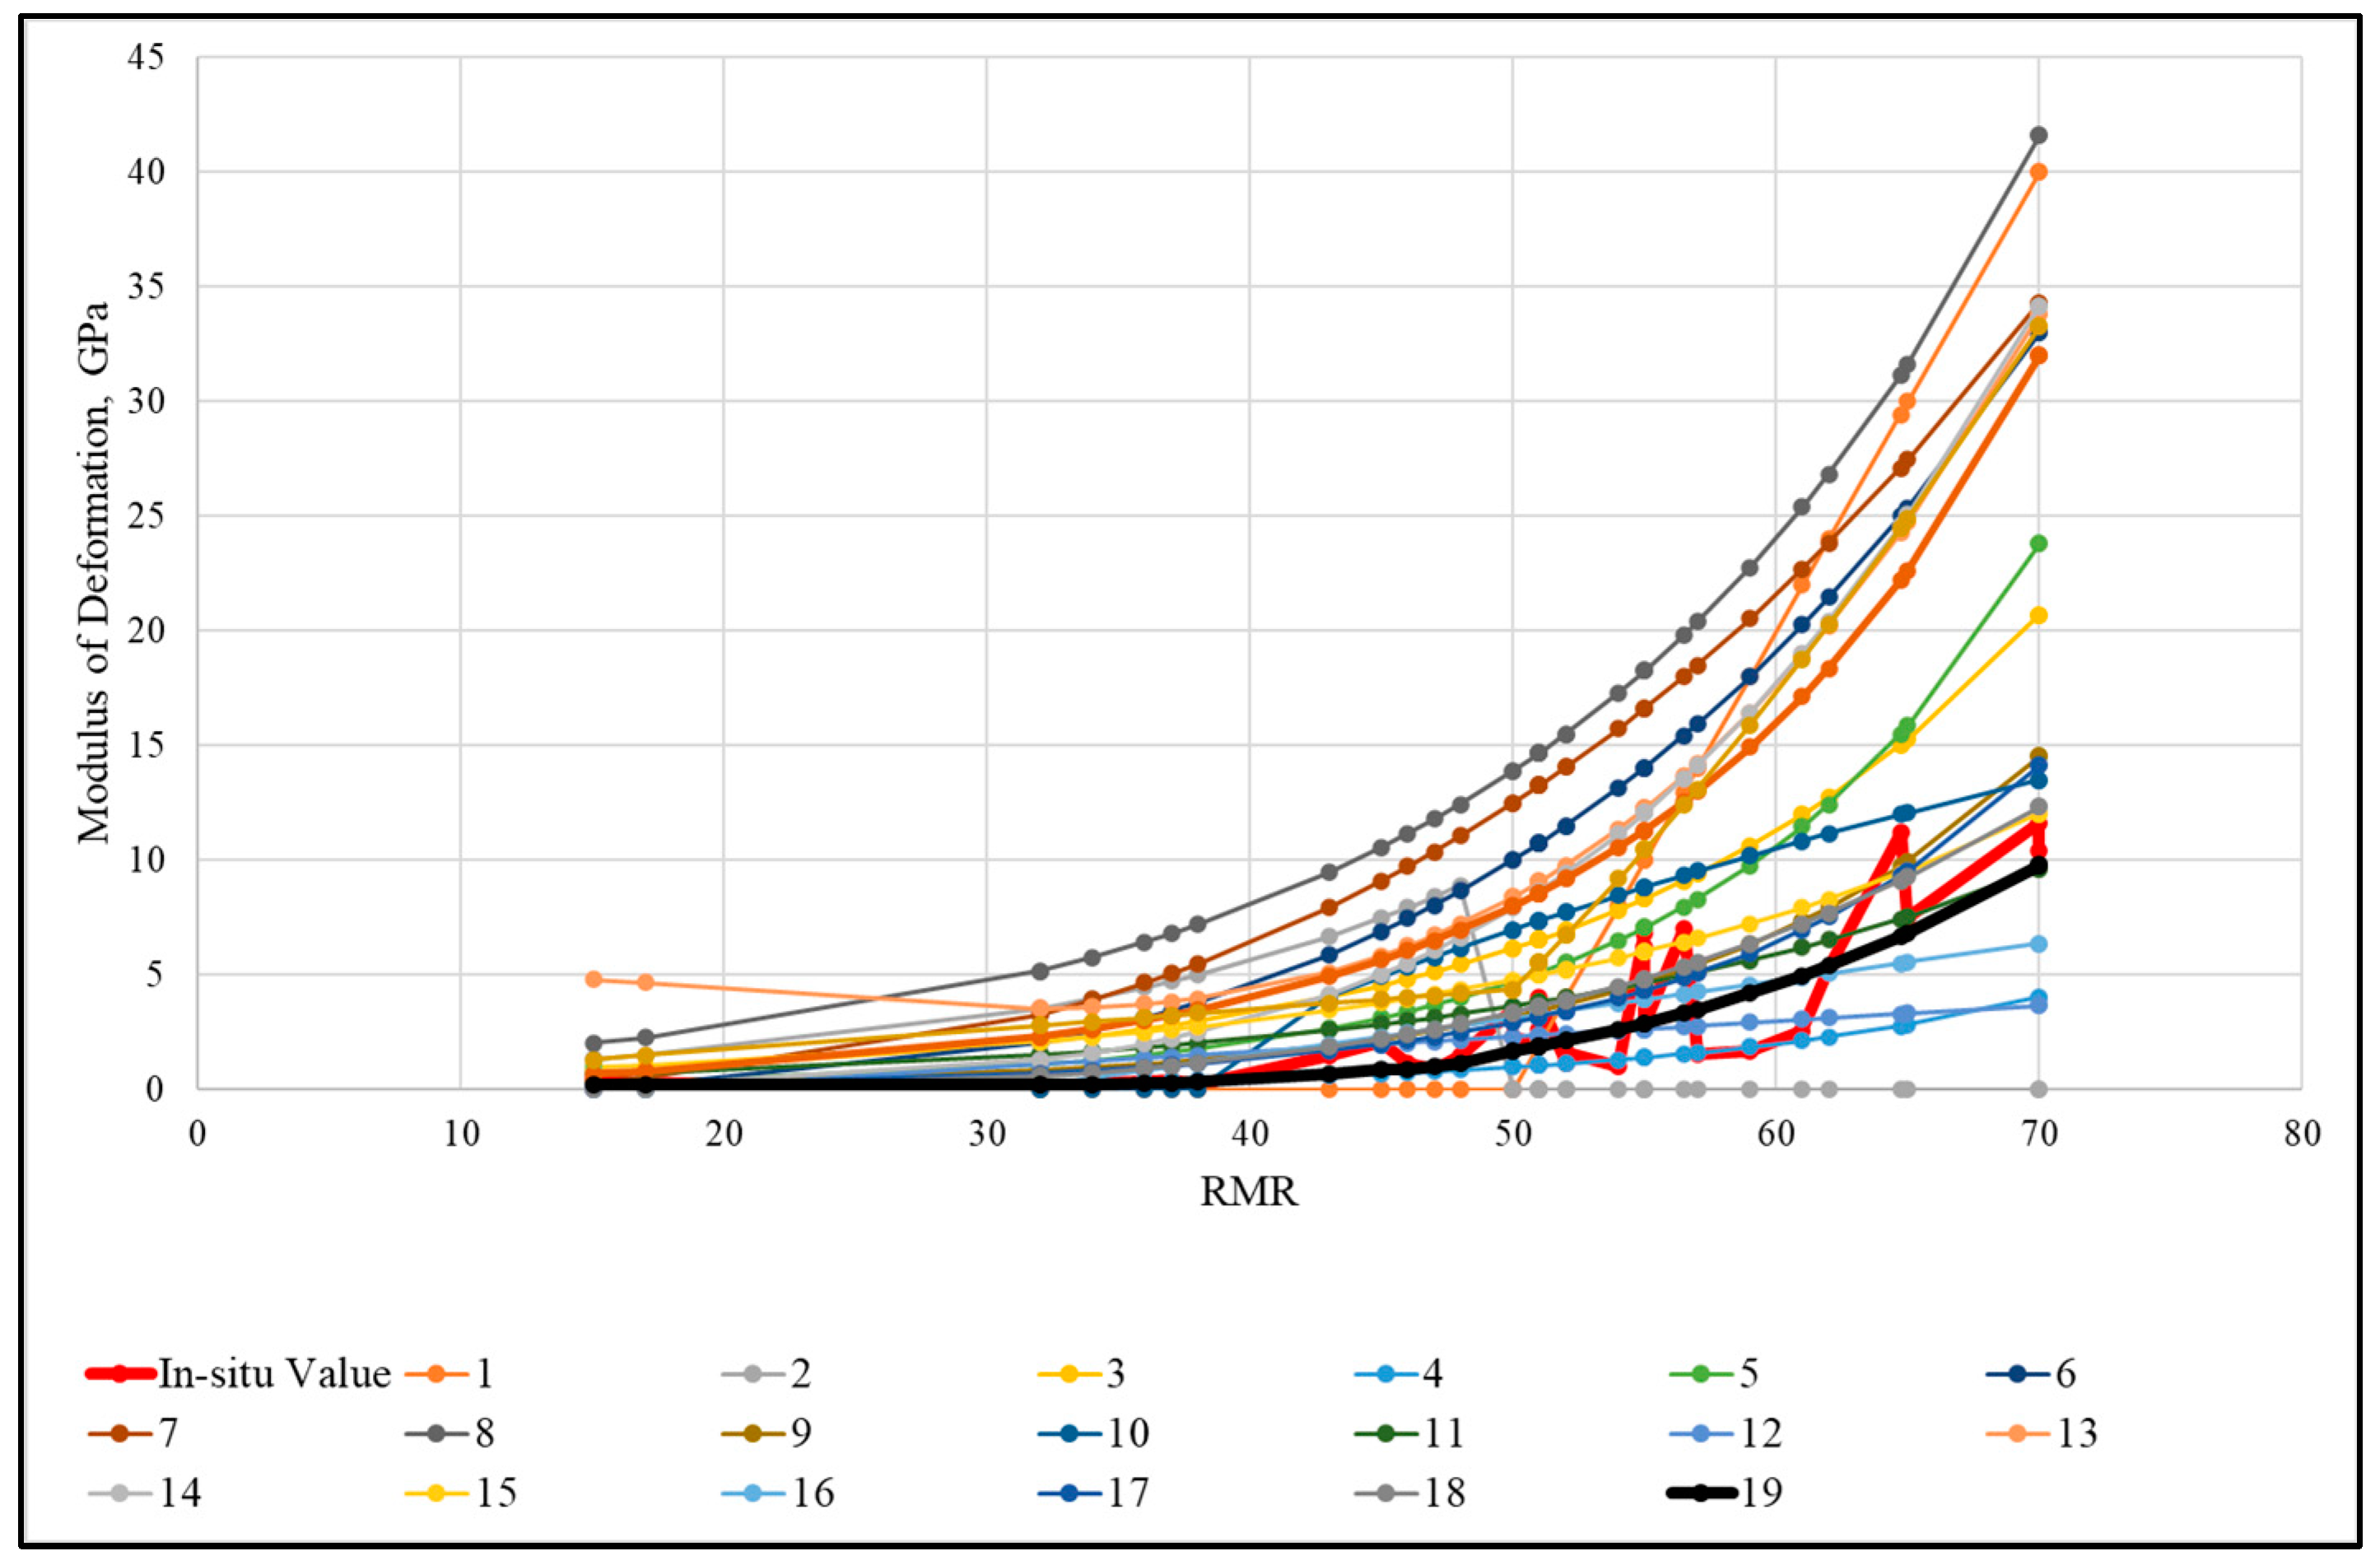
  • The review of various empirical models available for estimating Ed values indicates a considerable variation in the value of the deformation modulus for the Himalayan region. The empirical equations proposed by [14,20,21,29] are also in good comparison with the in situ tested value of Ed, while equations proposed by [11,23,25,27,28] overestimate, and the remaining equations underestimate Ed values.
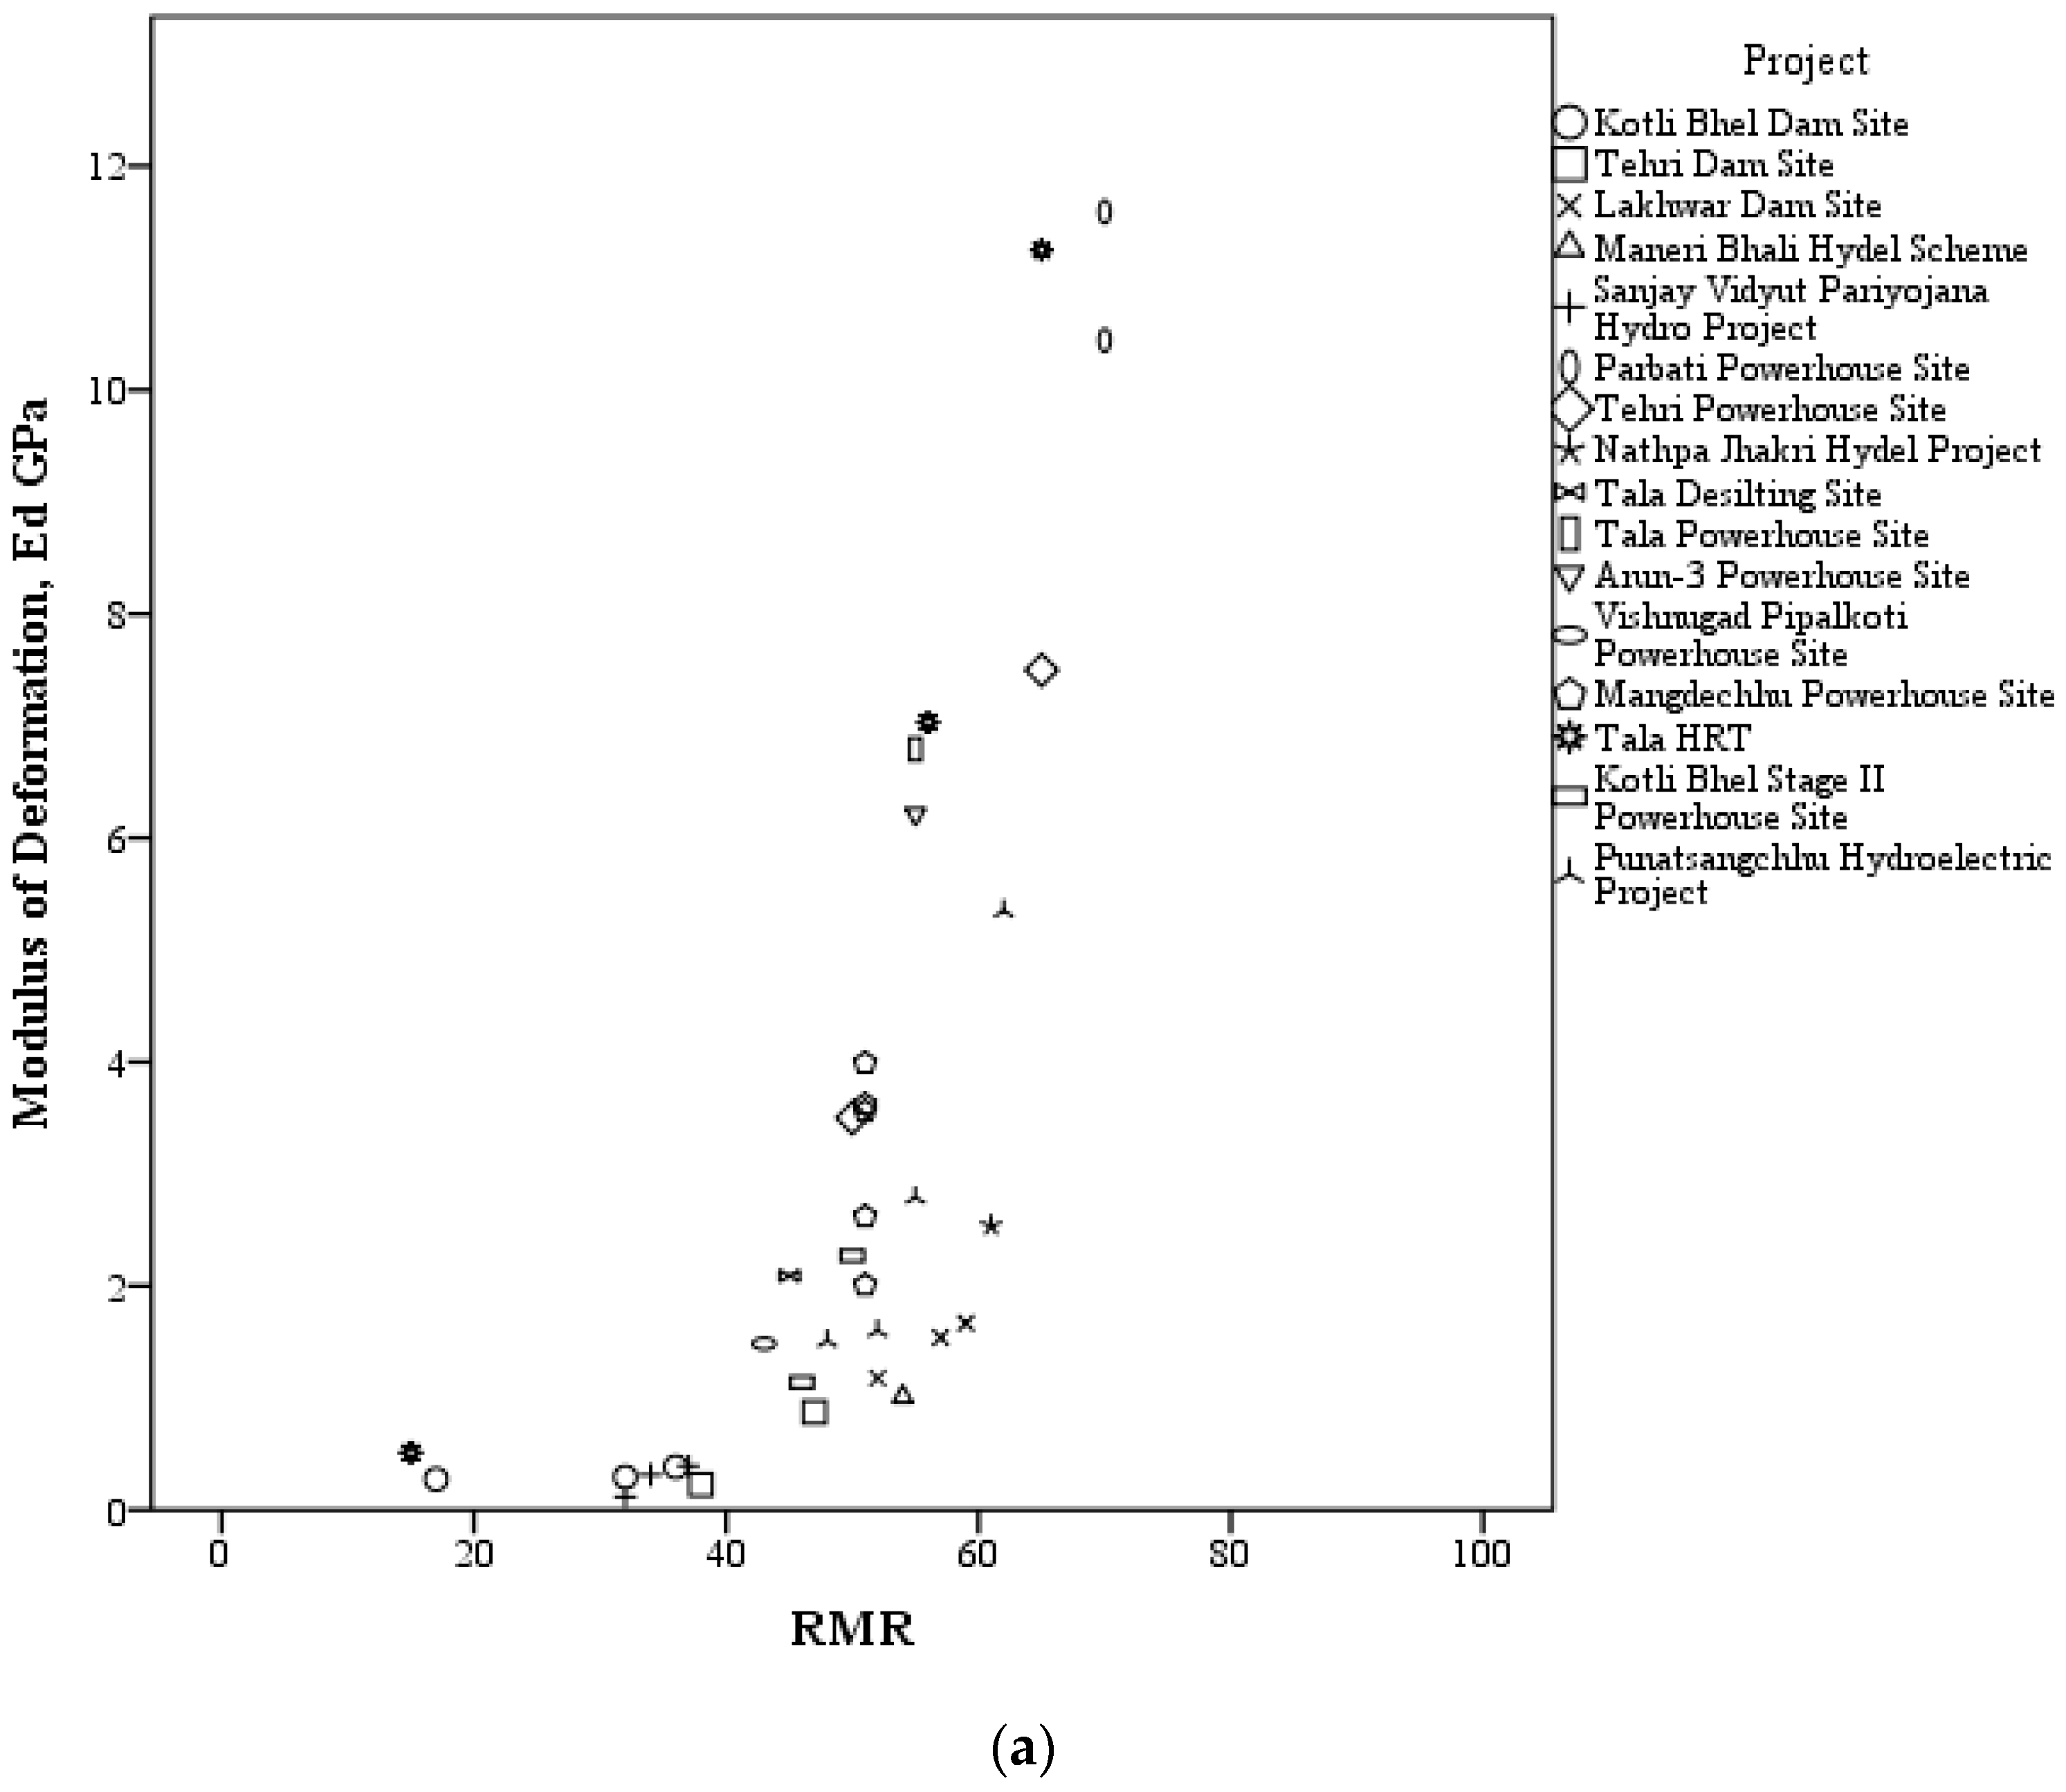
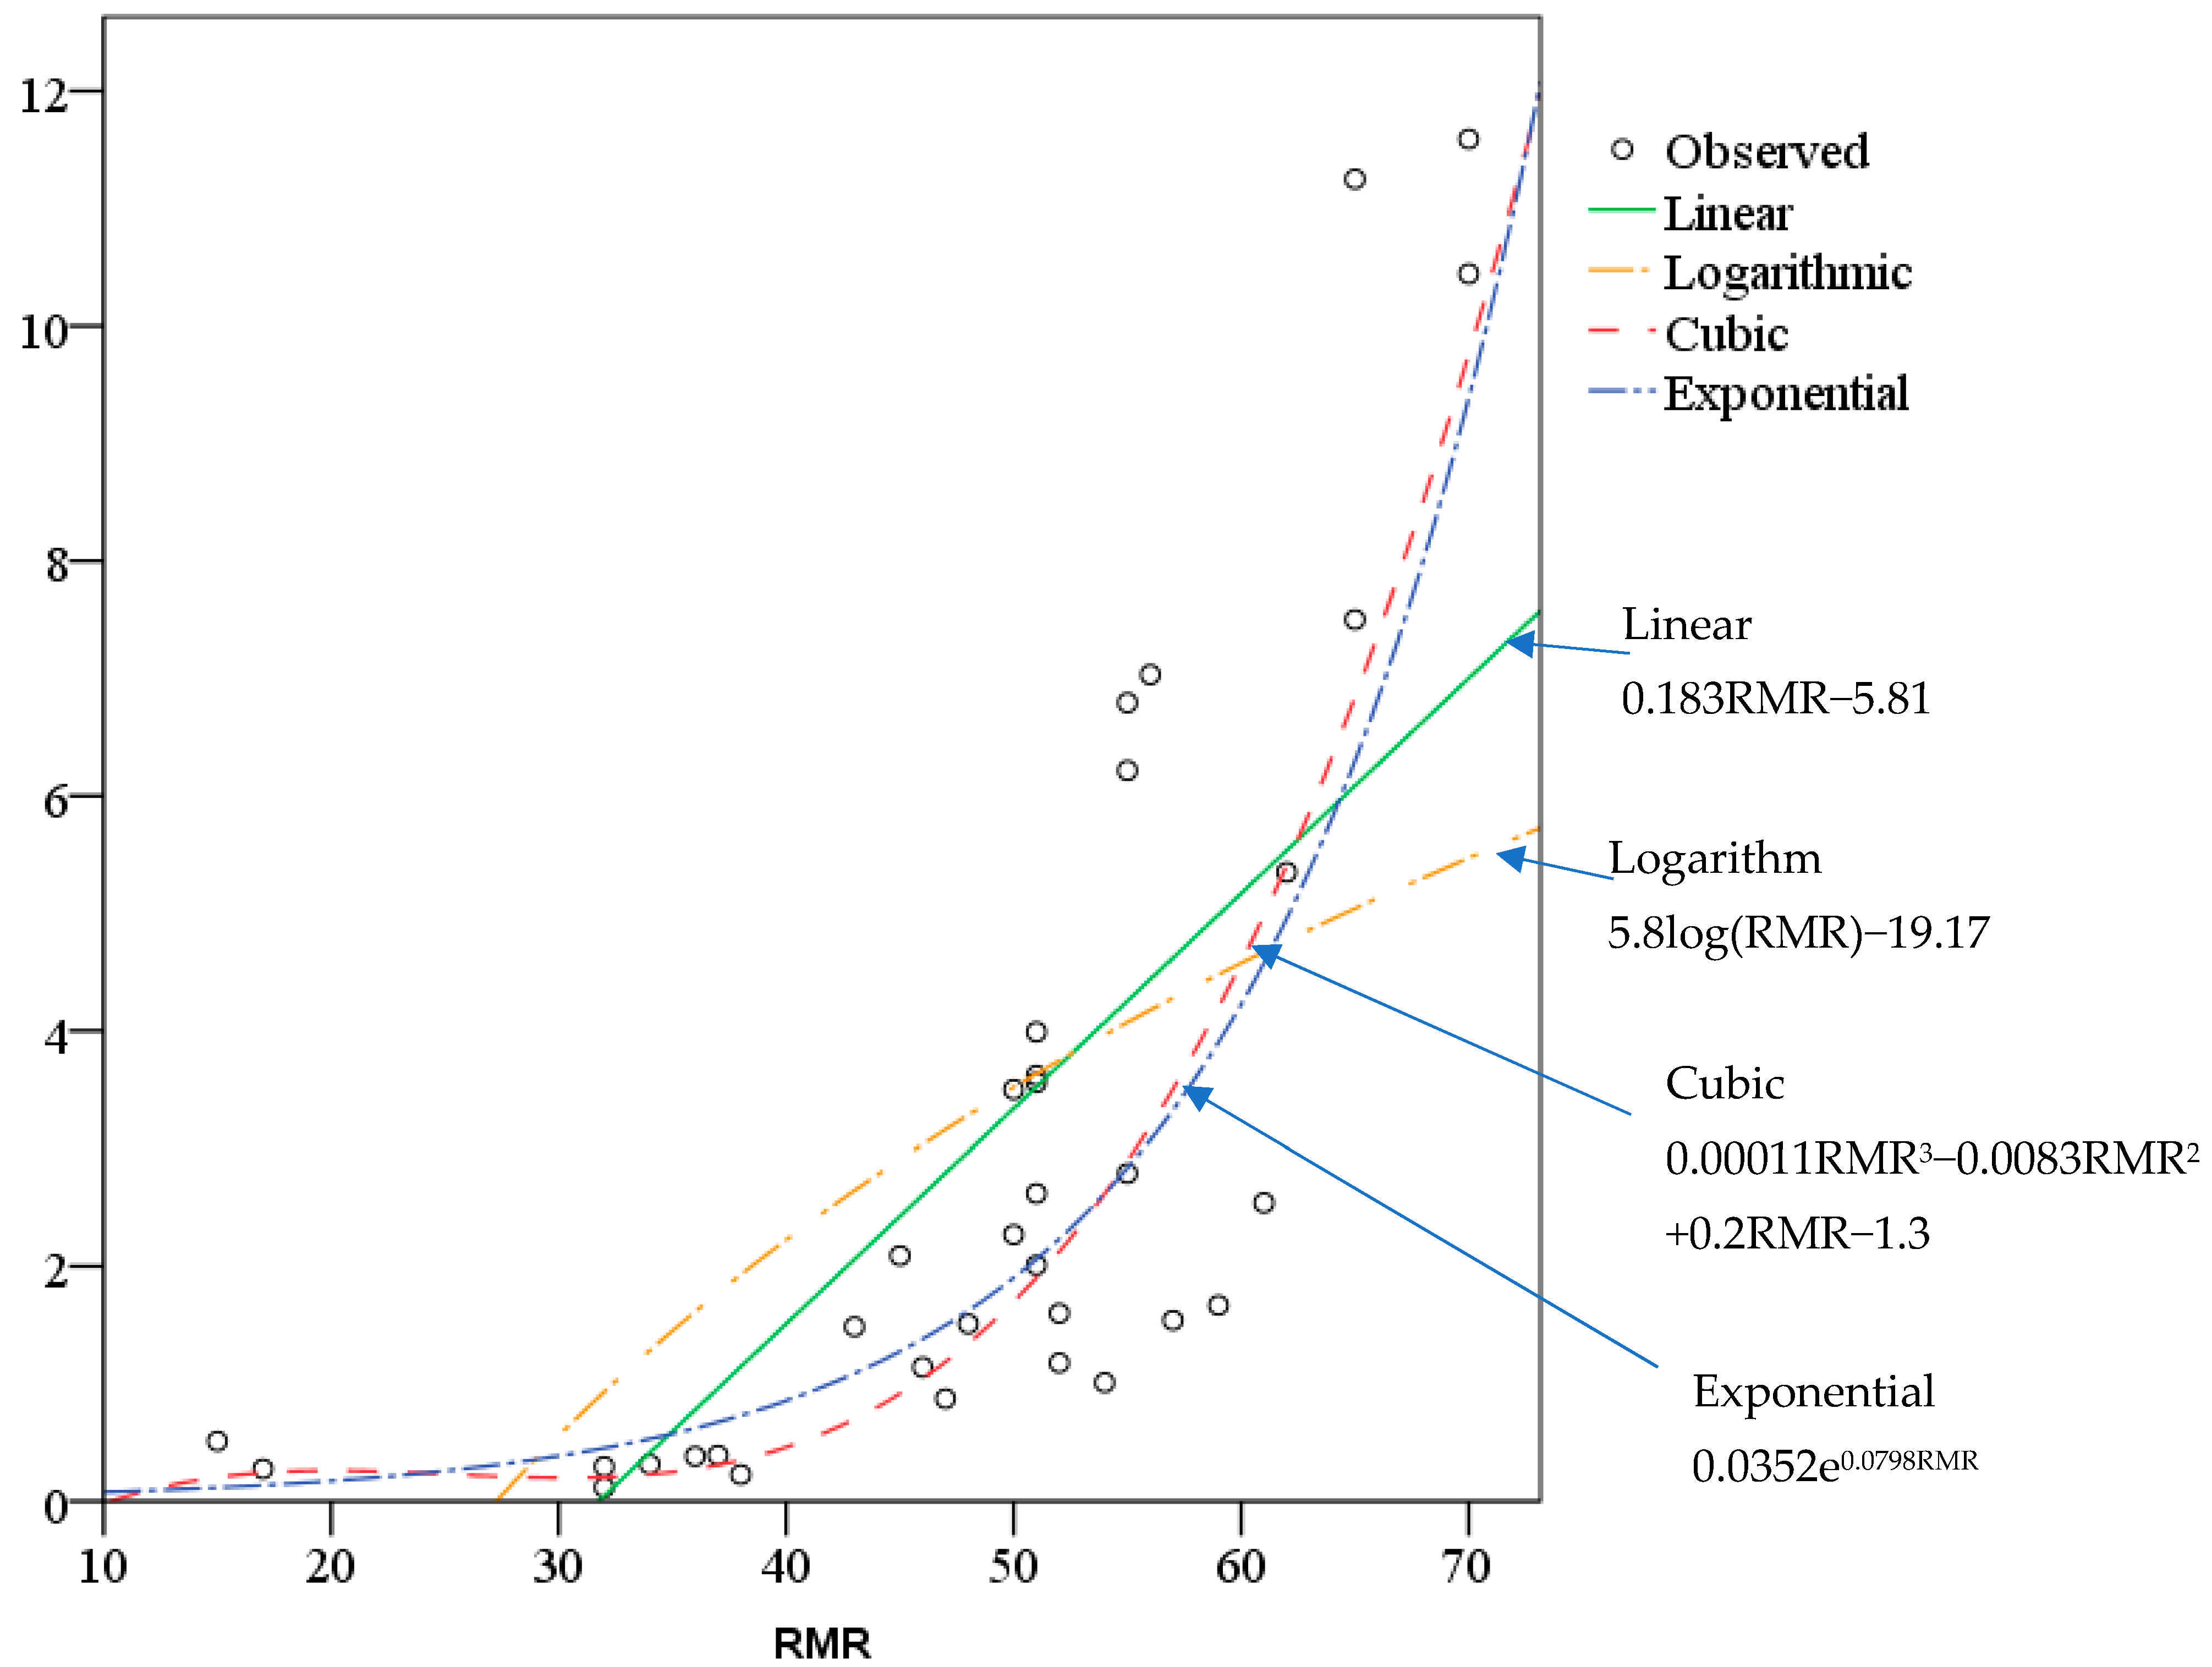
  • Based on the data obtained from 35 test locations, a predictive cubic equation (Equation (19)) could be developed, with R2, RMSE, and VAF values of 0.75, 1.70, and 74.33, respectively. These values indicate higher predictability and maximum accounted-for variance in Ed compared with other available correlations available in the literature.
  • The 3D numerical modelling results show that the Ed value adopted based on the proposed Equation (19) (Model A) correlated well with that of the measured instrumentation data when compared with the value of Ed based on the in situ testing (Model B). Model B underpredicts the deformations in the powerhouse complex at all locations, indicating that the in situ tested Ed value is higher, enhancing the rock mass properties. Measured convergence matched well in Model A compared to Model B. Hence, the relation proposed in Equation (19) can be utilized to estimate the value of Ed.
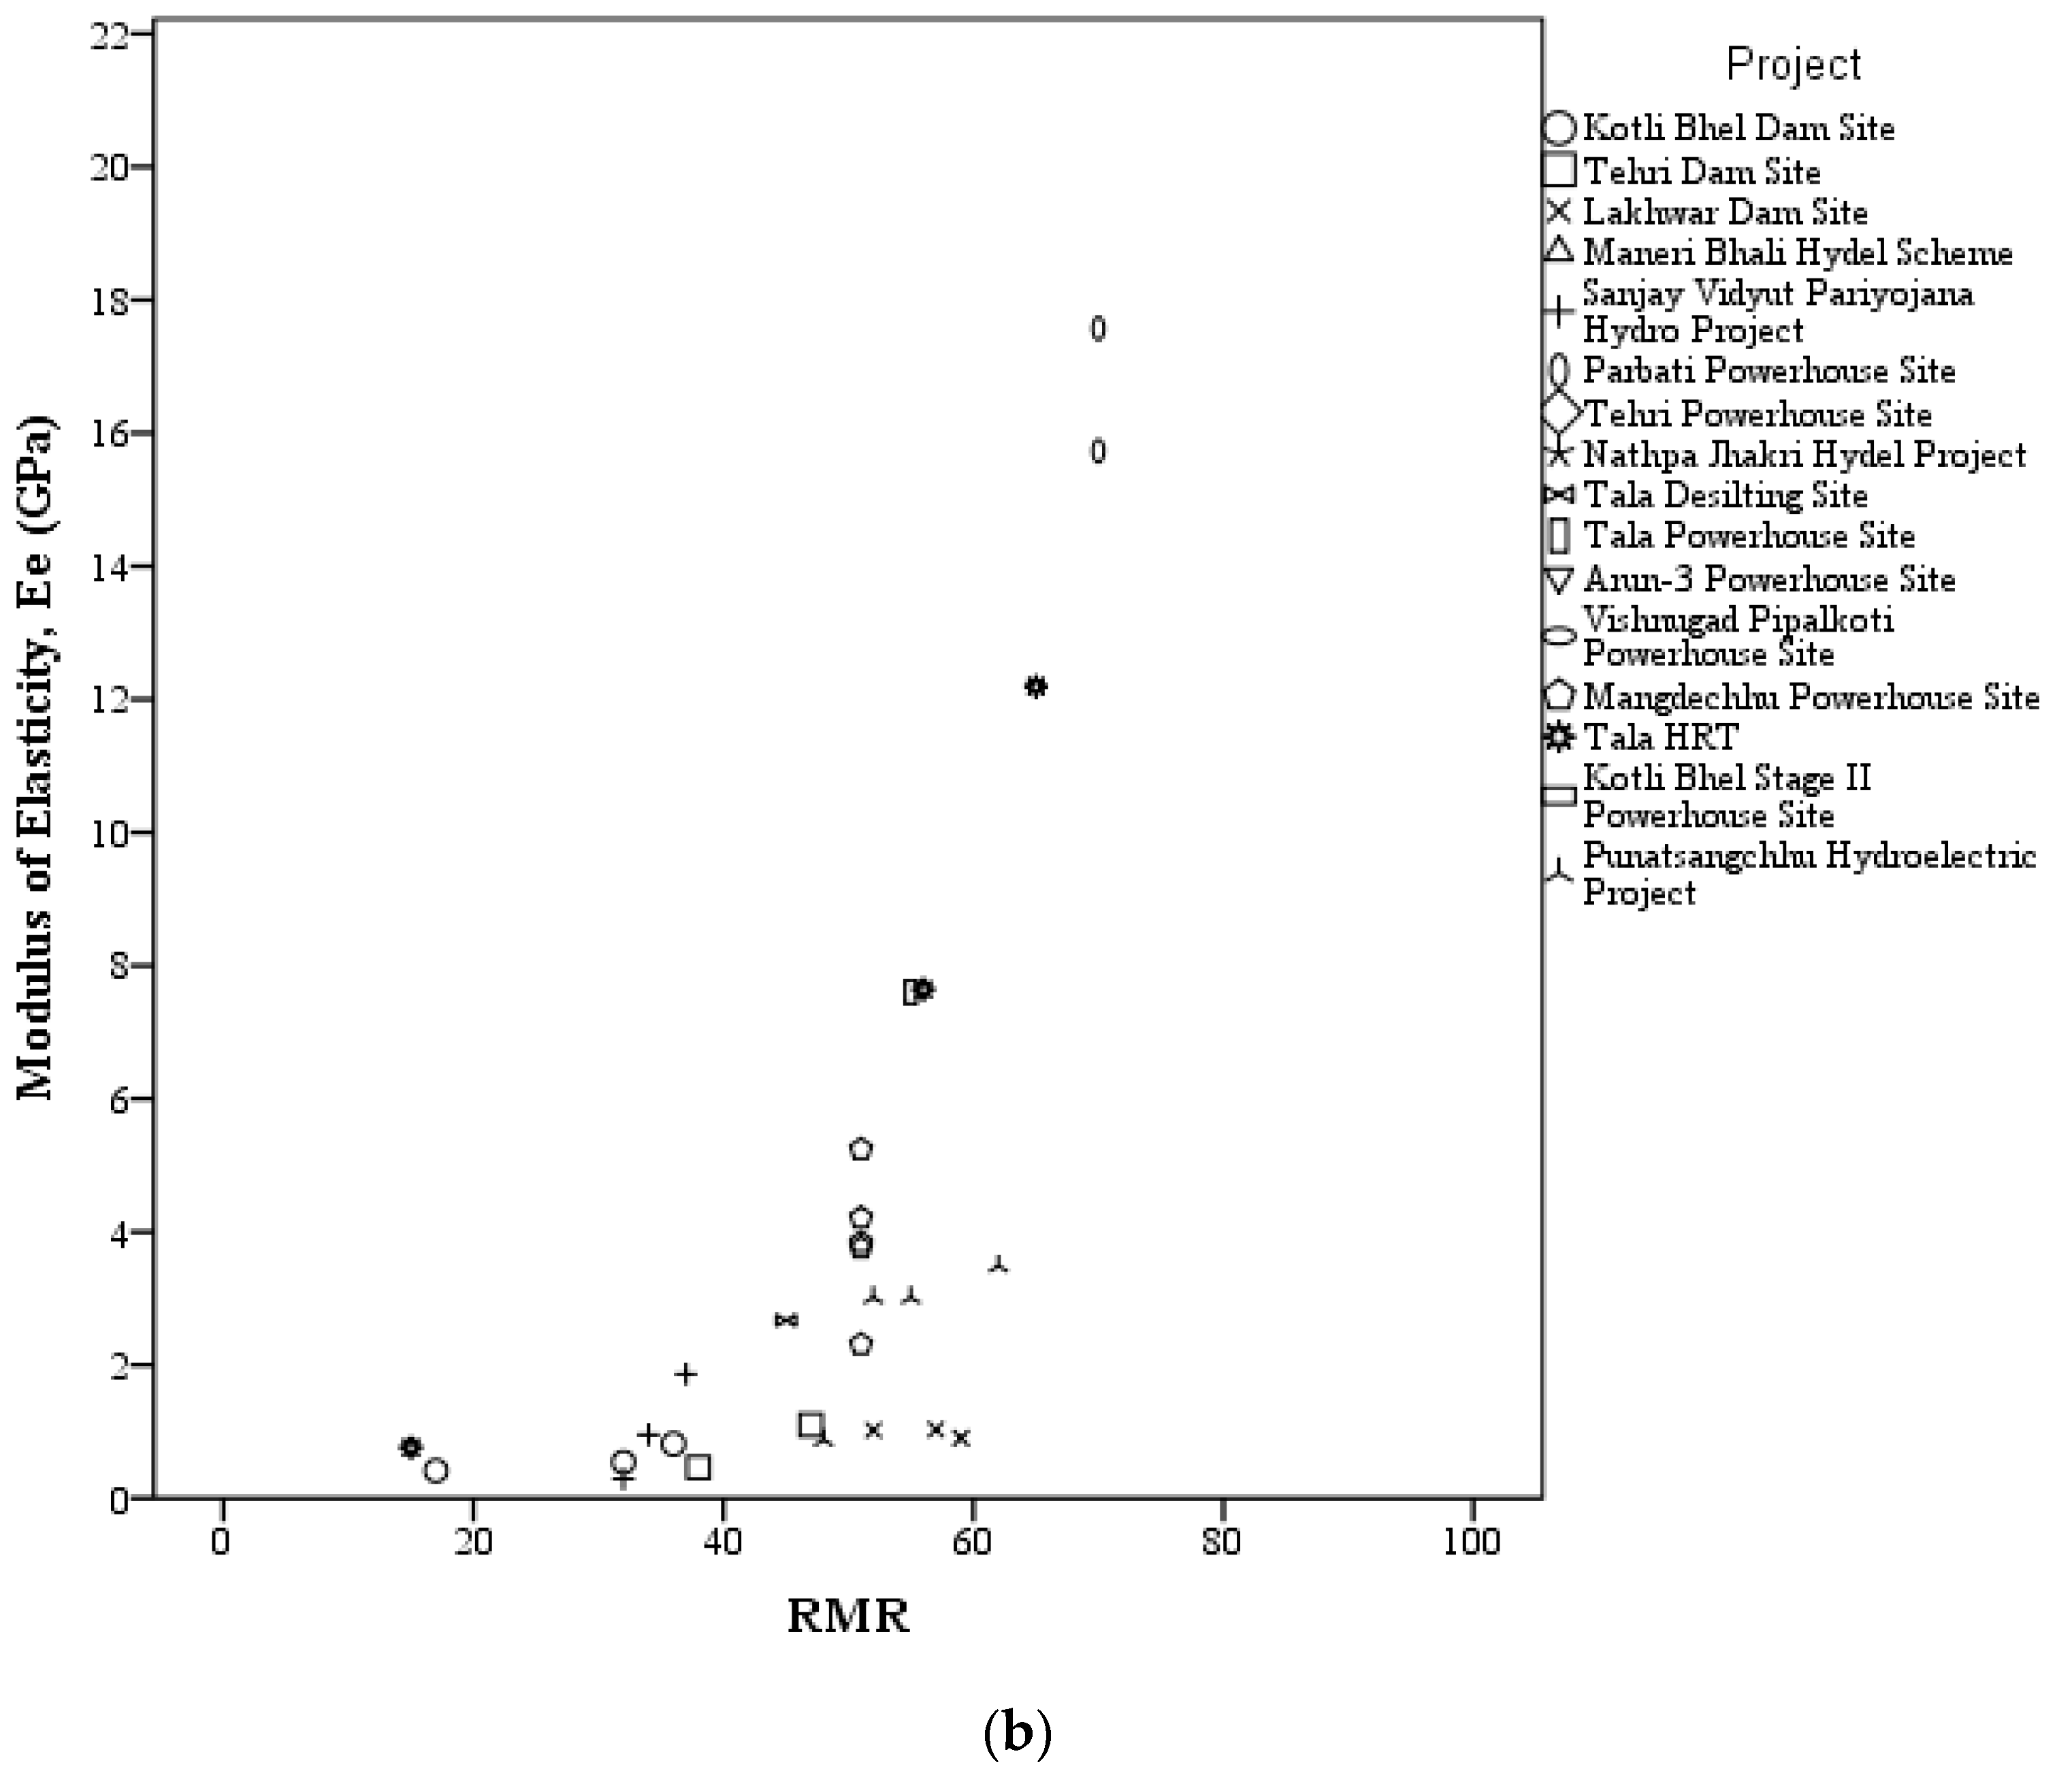
  • From the in situ tested data, the average ratio of Ee/ Ed for the Himalayan region is 1.5.
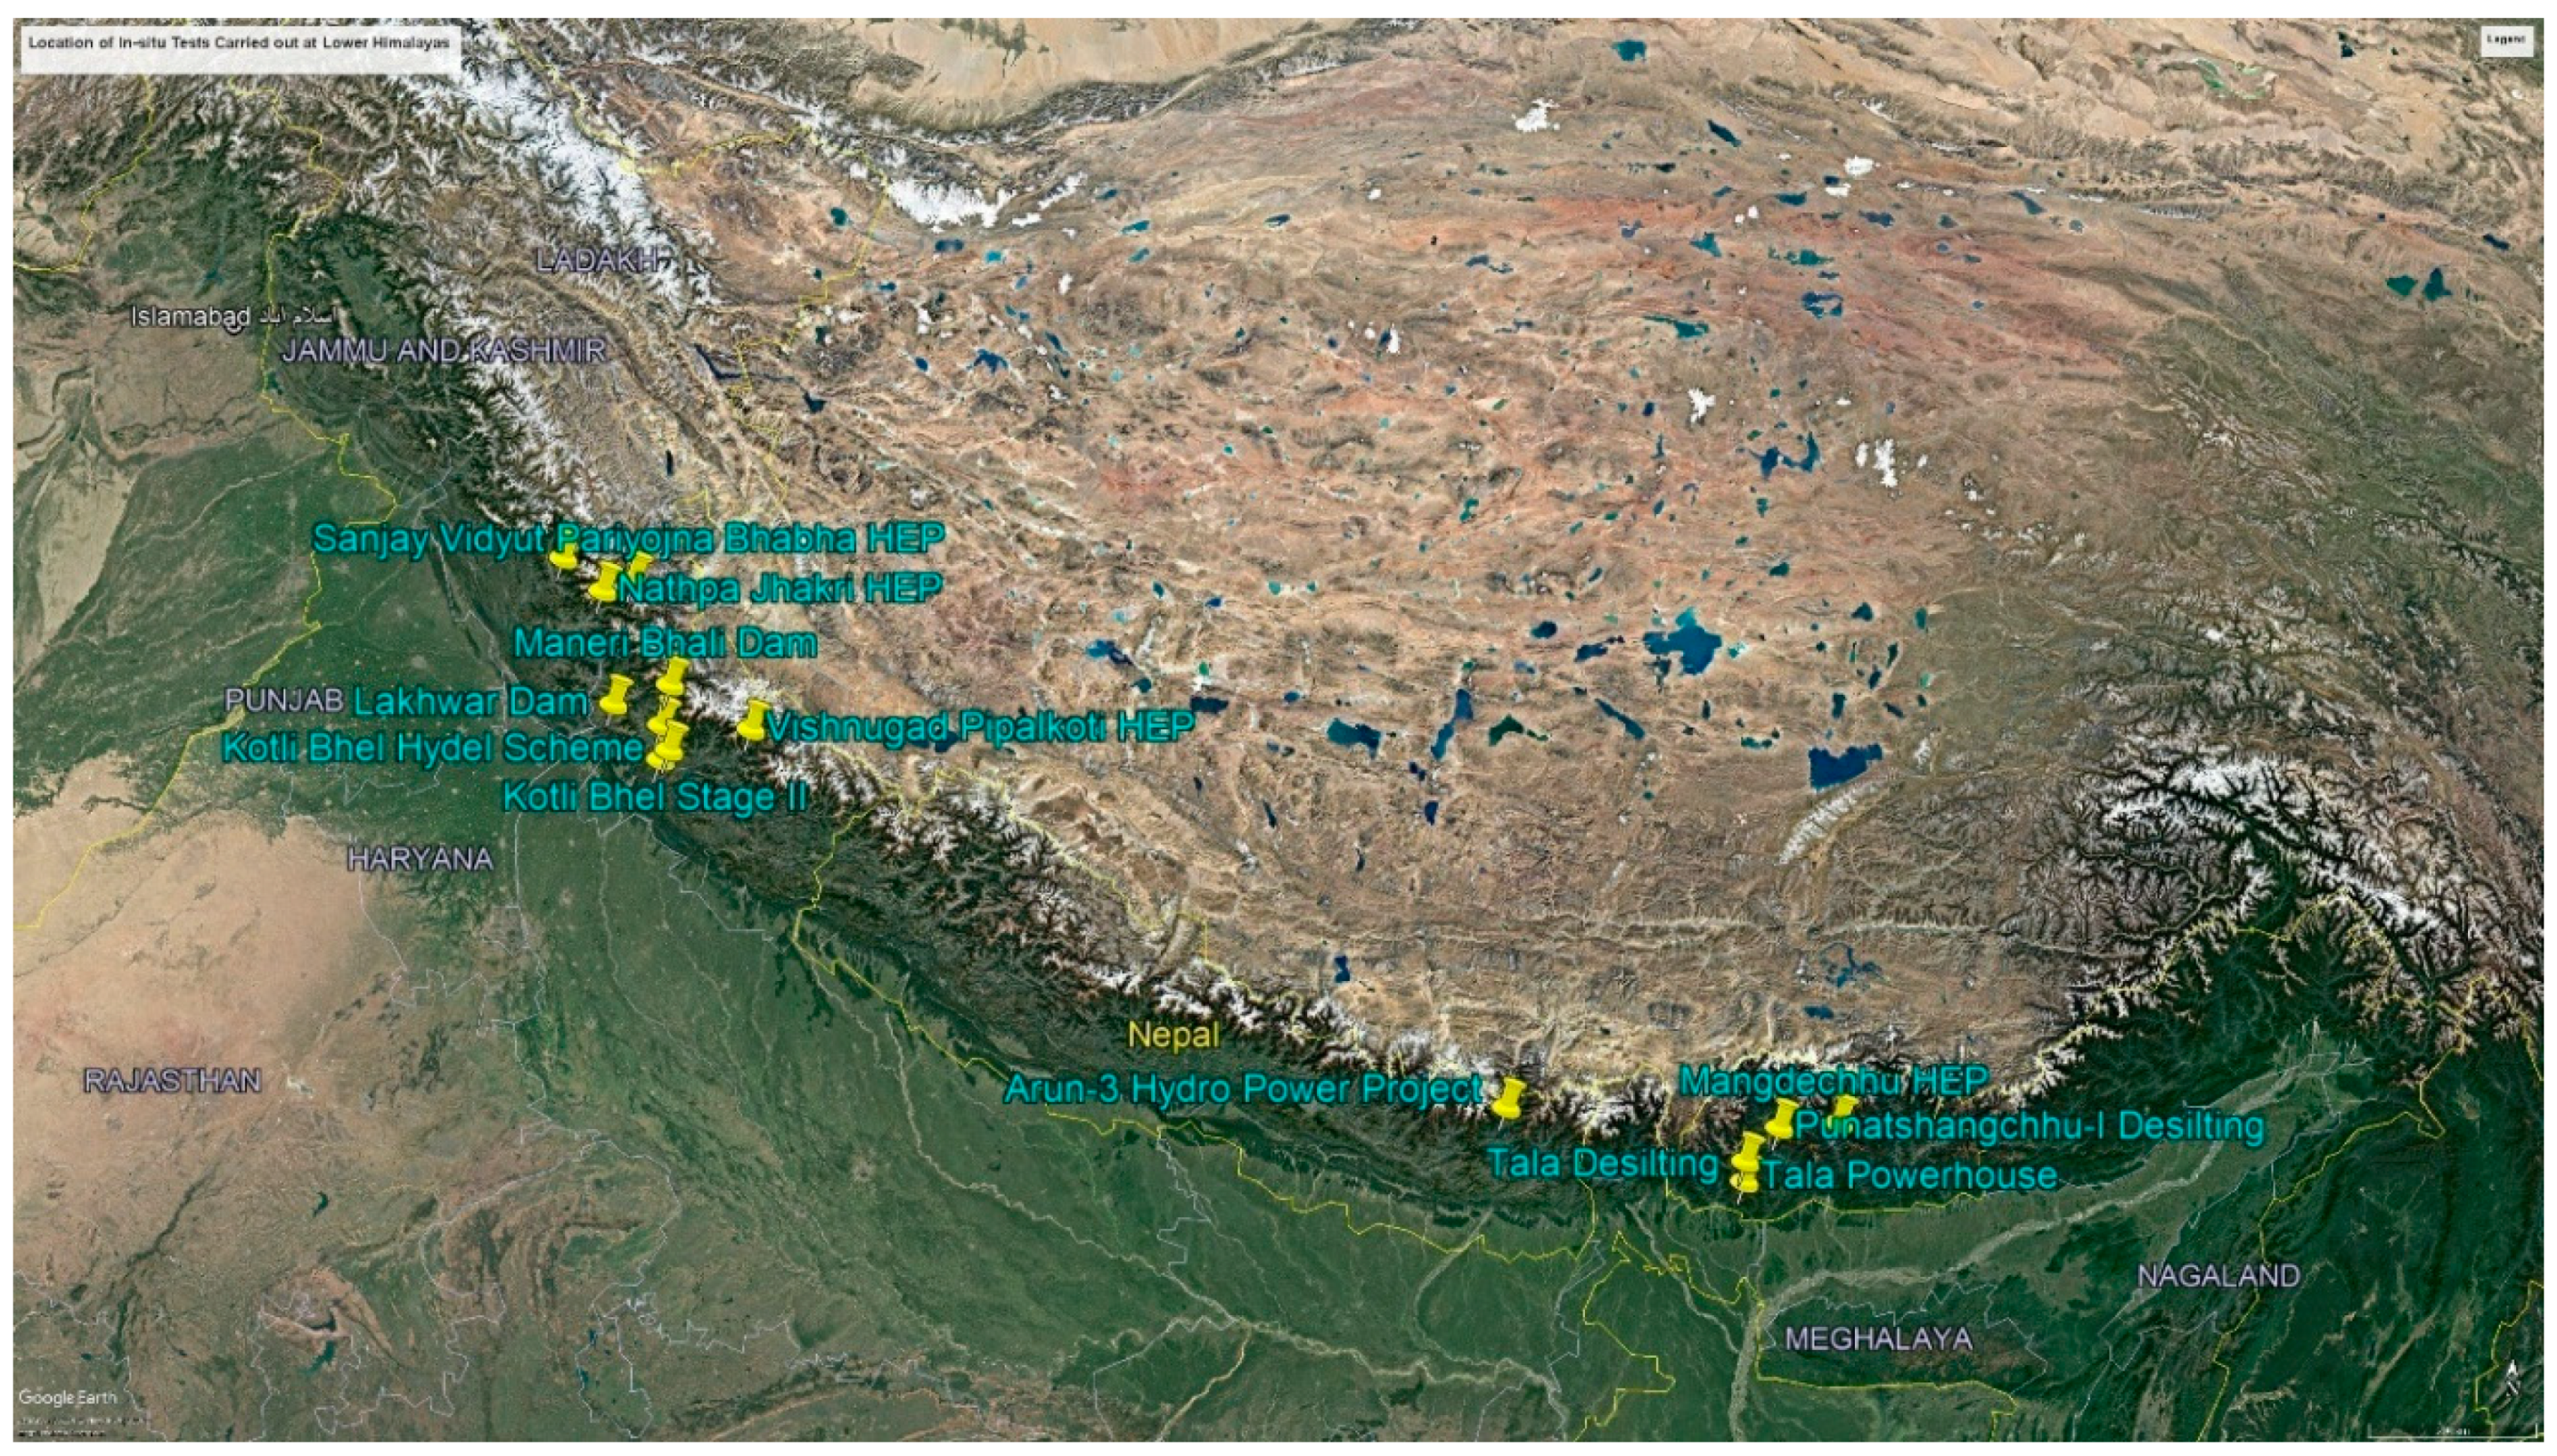
  • The proposed equation validates rock masses from the Himalayan region, with RMR values ranging from 15 to 70.

Author Contributions

Conceptualization, H.V.S.B.; methodology, H.V.S.B.; software, H.V.S.B. and S.R.N.; validation, H.V.S.B.; formal analysis, H.V.S.B.; investigation, H.V.S.B. and R.K.S.; resources, H.V.S.B., R.K.S. and S.R.N.; data curation, H.V.S.B.; writing—original draft preparation, H.V.S.B.; writing—review and editing, R.K.S. and S.R.N.; visualization, H.V.S.B.; supervision, R.K.S. and S.R.N. All authors have read and agreed to the published version of the manuscript.

Funding

This research received no external funding.

Institutional Review Board Statement

Not applicable.

Informed Consent Statement

Not Applicable.

Data Availability Statement

The data presented in this study are available on request from the corresponding author. The data are not publicly available due to the reason that they pertain to mega engineering projects.

Acknowledgments

The authors thank the project authorities and the director of the National Institute of Rock Mechanics (NIRM) for allowing them to conduct the studies. The support provided by the Department of Mining Engineering, Indian Institute of Technology (Indian School of Mines), Dhanbad, India, and BNV Siva Prasad and K Sudhakar, scientists, NIRM, is duly acknowledged. This forms part of the first author’s doctoral research at IIT (ISM).

Conflicts of Interest

The authors declare no conflict of interest.

References

  1. IHA (International Hydropower Association). Hydropower Status Report: Sector Trends and Insights; International Hydropower Association: London, UK, 2020. [Google Scholar]
  2. CEA: HPMD (Central Electricity Authority: Hydro Project Monitoring Division). Progress of On-Going Hydro Electric Projects, Quarterly Review No. 100, January–March 2020; Central Electricity Authority: New Delhi, India, 2020. [Google Scholar]
  3. Kansal, M.L.; Agarwal, S.S. Uncertainties-Based Potential Time and Cost Overrun Assessment While Planning a Hydropower Project. ASCE-ASME J. Risk Uncertain. Eng. Syst. Part A Civ. Eng. 2022, 8, 1–14. [Google Scholar] [CrossRef]
  4. Siva Prasad, B.; Thapliyal, A.; Rabi, B.; Sripad, R. Delineation of Cavity in Downstream Surge Chamber at Punatsangchhu-II Hydroelectric Project, Bhutan. J. Geol. Res. 2019, 1, 5–11. [Google Scholar]
  5. Najman, Y.; Clift, P.; Johnson, M.R.W.; Robertson, A.H.F. Early Stages of Foreland Basin Evolution in the Lesser Himalaya, N India. Geol. Soc. Spec. Publ. 1993, 74, 541–558. [Google Scholar] [CrossRef]
  6. Naik, S.R. Studies on Stability Assessment of Large Caverns in Himalayan Region, National Institute of Technology Karnataka. Ph.D Thesis, National Institute of Technology Karnataka, Surathkal, India, 2017. [Google Scholar]
  7. Brady, B.H.; Brown, E.T. Rock Mechanics for Underground Mining; Kluwer Academic Publishers: New York, NY, USA; Boston, MA, USA; Dordrecht, The Netherland; London, UK; Moscow, Russia, 1978; Volume 24, ISBN 140202116X. [Google Scholar]
  8. Hoek, E.; Diederichs, M.S. Empirical Estimation of Rock Mass Modulus. Int. J. Rock Mech. Min. Sci. 2006, 43, 203–215. [Google Scholar] [CrossRef]
  9. ISRM. Commission on Terminology, Symbols and Graphic Representation; International Society for Rock Mechanics (ISRM): Salzburg, Austria, 1975. [Google Scholar]
  10. ISRM. Suggested Method for Determing In Situ Deformability of Rock; International Society for Rock Mechanics (ISRM): Salzburg, Austria, 1979; pp. 197–214. [Google Scholar]
  11. Palmström, A.; Singh, R. The Deformation Modulus of Rock Masses-Comparisons between in Situ Tests and Indirect Estimates. Tunn. Undergr. Sp. Technol. 2001, 16, 115–131. [Google Scholar] [CrossRef]
  12. Bieniawski, Z.T. Determining Rock Mass Deformability: Experience from Case Histories. Int. J. Rock Mech. Min. Sci. 1978, 15, 237–247. [Google Scholar] [CrossRef]
  13. Aladejare, A.E.; Malachi Ozoji, T.; Adebayo Idris, M.; Lawal, A.I.; Onifade, M. Empirical Estimation of Rock Mass Deformation Modulus of Rocks: Comparison of Intact Rock Properties and Rock Mass Classifications as Inputs. Arab. J. Geosci. 2022, 15, 1033. [Google Scholar] [CrossRef]
  14. Serafim, J.L.; Pereira, J.P. Considerations on the Geomechanical Classification of Bieniawski. In Proceedings of the International Symposium on Engineering Geology and Underground Openings, Lisbon, Portugal, 12–15 September 1983; pp. 1133–1144. [Google Scholar]
  15. Chun, B.-S.; Lee, Y.; Jung, S. The Evaluation for Estimation Method of Deformation Modulus of Rock Mass Using RMR System. J. Korean GEO-Environ. Soc. 2006, 7, 25–32. [Google Scholar]
  16. Isik, N.S.; Ulusay, R.; Doyuran, V. Deformation Modulus of Heavily Jointed-Sheared and Blocky Greywackes by Pressuremeter Tests: Numerical, Experimental and Empirical Assessments. Eng. Geol. 2008, 101, 269–282. [Google Scholar] [CrossRef]
  17. Mohammadi, R.R. The Estimation of Rock Mass Deformation Modulus Using Regression and Artificial Neural Networks Analysis. Sociology 2010, 35, 1. [Google Scholar]
  18. Shen, J.; Karakus, M.; Xu, C. A Comparative Study for Empirical Equations in Estimating Deformation Modulus of Rock Masses. Tunn. Undergr. Sp. Technol. 2012, 32, 245–250. [Google Scholar] [CrossRef]
  19. Kang, S.S.; Kim, H.Y.; Jang, B.A. Correlation of in Situ Modulus of Deformation with Degree of Weathering, RMR and Q-System. Environ. Earth Sci. 2013, 69, 2671–2678. [Google Scholar] [CrossRef]
  20. Nejati, H.R.; Ghazvinian, A.; Moosavi, S.A.; Sarfarazi, V. On the Use of the RMR System for Estimation of Rock Mass Deformation Modulus. Bull. Eng. Geol. Environ. 2014, 73, 531–540. [Google Scholar] [CrossRef]
  21. Alemdag, S.; Gurocak, Z.; Gokceoglu, C. A Simple Regression Based Approach to Estimate Deformation Modulus of Rock Masses. J. Afr. Earth Sci. 2015, 110, 75–80. [Google Scholar] [CrossRef]
  22. Khabbazi, A.; Ghafoori, M.; Lashkaripour, G.R.; Cheshomi, A. Estimation of the Rock Mass Deformation Modulus Using a Rock Classification System. Geomech. Geoengin. 2013, 8, 46–52. [Google Scholar] [CrossRef]
  23. Jose, M.; Galeral, M.; A’lvarez, Z.B.T. Evalution of the Deformation Modulus of Rock Masses: Comparison of Pressuremeter and Dil-Atometer Tests with RMR Prediction. In Proceedings of the ISP5-Pressio International Symposium, Marne-la-Vallee, France, 22–24 August 2005. [Google Scholar]
  24. Mehrotra, V.K. Estimation of Engineering Parameters of Rock Mass; University of Roorkee: Roorkee, India, 1992. [Google Scholar]
  25. Kim, G. Revaluation of geomechanics classification of rock masses. In Proceedings of the Korean Geotechnical Society of Spring National Conference, Seoul, South Korea, 27 March 1993; pp. 33–40. [Google Scholar]
  26. Jašarević, I.; Kovačević, M.S. Analyzing Applicability of Existing Classification for Hard Carbonate Rock in Mediterranean Area. In Proceedings of the ISRM International Symposium-EUROCK 1996, Turin, Italy, 16 September 1996; pp. 811–818. [Google Scholar]
  27. Aydan, O.; Ulusay, R.; Kawamoto, T. Assessment of Rock Mass Strength for Underground Excavations. Int. J. Rock Mech. Min. Sci. Geomech. Abstr. 1997, 34, 705. [Google Scholar] [CrossRef]
  28. Read, S.A.L.; Perrin, N.D.; Richards, L.R. Applicability of the Hoek-Brown Failure Criterion to New Zealand Greywacke Rocks. In Proceedings of the 9th ISRM Congress, Paris, France, 24 August 1999; pp. 655–660. [Google Scholar]
  29. Diederichs, M.S.; Kaiser, P.K. Stability of Large Excavations in Laminated Hard Rock Masses: The Voussoir Analogue Revisited. Int. J. Rock Mech. Min. Sci. 1999, 36, 97–117. [Google Scholar] [CrossRef]
  30. Gokceoglu, C.; Sonmez, H.; Kayabasi, A. Predicting the Deformation Moduli of Rock Masses. Int. J. Rock Mech. Min. Sci. 2003, 40, 701–710. [Google Scholar] [CrossRef]
  31. Kayabasi, A.; Gokceoglu, C.; Ercanoglu, M. Estimating the Deformation Modulus of Rock Masses: A Comparative Study. Int. J. Rock Mech. Min. Sci. 2003, 40, 55–63. [Google Scholar] [CrossRef]
  32. Bieniawski, Z.T. Engineering Rock Mass Classifications: A Complete Manual for Engineers and Geologists in Mining, Civil, and Petroleum Engineering; Wiley: Hoboken, NJ, USA, 1989. [Google Scholar]
  33. Prasad, B.N.V.S.; Murthy, V.M.S.R.; Naik, S.R. Drillability Predictions in Aravalli and Himalayan Rocks—A Petro-Physico-Mechanical Approach. Curr. Sci. 2022, 122, 907–917. [Google Scholar] [CrossRef]
  34. Siva Prasad, B.N.V.; Murthy, V.M.S.R.; Naik, S.R. Influence of Static and Dynamic Rock Properties on Drillability Prognosis for Mining and Tunnelling Projects. Indian Geotech. J. 2022, 52, 765–779. [Google Scholar] [CrossRef]
  35. Siva Prasad, B.; Murthy, V.M.S.R.; Naik, S.R. Compendious Index for Drillability: A Rapid Tool to Assess Drill Penetration Rate and Bit Life for Rock Engineering Applications. Bull. Eng. Geol. Environ. 2023, 82, 1–20. [Google Scholar] [CrossRef]
  36. Sekar Bellapu, H.V.; Sinha, R.K.; Naik, S.R. Estimation of Deformation Modulus of Rock Mass for an Underground Cavern Based on Back Analysis. Lect. Notes Civ. Eng. 2022, 228, 393–404. [Google Scholar] [CrossRef]
  37. Bellapu, H.V.S.; Sinha, R.K.; Naik, S.R. Estimation of Modulus of Deformation by Different Methods for an Underground Cavern—A Case Study. Indian Geotech. J. 2022, 1–7. [Google Scholar] [CrossRef]
  38. Öge, İ.F. Determination of Deformation Modulus in a Weak Rock Mass by Using Menard Pressuremeter. Int. J. Rock Mech. Min. Sci. 2018, 112, 238–252. [Google Scholar] [CrossRef]
  39. Zhang, B.; Mu, J.; Zheng, J.; Lv, Q.; Deng, J. A New Estimation Method and an Anisotropy Index for the Deformation Modulus of Jointed Rock Masses. J. Rock Mech. Geotech. Eng. 2022, 14, 153–168. [Google Scholar] [CrossRef]
  40. Mehrotra, V.K.; Subhash, M. Use of In Situ Modulus for Classification of Rock Mass in Himalayas. In Proceedings of the International Symposium on Tunnelling for Water Resources and Power Projects, New Delhi, India, 19–23 January 1988; p. 402. [Google Scholar]
  41. Agarwal, K.; Saran, S.; Jain, P.; Chandra, S. A Case Study w.r.t Geotechnical Aspects for the Pressure Tunnel of Sanjay Vidyut Pariyojana-Bhaba. In Proceedings of the International Symposium on Tunnelling for Water Resources and Power Projects, New Delhi, India, 19–23 January 1988; p. 402. [Google Scholar]
  42. Sayeed, I.; Khanna, R. Geotechnical Investigations for Locating an Underground Powerhouse in Calcareous Rocks, Himachal Pradesh, India. In Proceedings of the Recent Advances in Rock Engineering (RARE), Bengaluru, India, 16–18 November 2016. [Google Scholar]
  43. Singh, R. Engineering in Rocks for Slopes, Foundations and Tunnels; Ramamurthy, T., Ed.; PHI: Delhi, India, 2015. [Google Scholar]
  44. Singh, R. Evaluation of Rock Mass Design Parameters for Tunneling at Tala Hydroelectric Project in Bhutan Himalayas. In Proceedings of the Seminar on Productivity and Speed in Tunnelling, Dehradun, India, 26–27 June 2003; pp. 41–54. [Google Scholar]
  45. Sarwade, D.V.; Mishra, K.K.; Kapoor, V.K.; Kumar, N. Rock Mass Deformability: Empirical and Practical Approach. In Proceedings of the ISRM International Symposium—6th Asian Rock Mechanics Symposium, ARMS, New Delhi, India, 25–27 October 2010; pp. 23–27. [Google Scholar]
  46. Naik, S.R.; Bhushan, R.; Bhusan, R.; Sekar, V.; Sudhakar, K. 3D Stress Analysis of Powerhouse Complex and Other Tunnels at PSP Tehri Project; NIRM: Bengaluru, India, 2014. [Google Scholar]
  47. Bellapu, H.V.S.; Bhusan, R.; Sudhakar, K.; Naik, S.R. 3D Numerical Model Studies for Stress Analysis of Underground Powerhouse Complex of Arun-3 H.E. Project (900 MW), Nepal; NIRM: Bengaluru, India, 2020. [Google Scholar]
  48. Vijay Sekar, B.; Bhusan, R.; Praveena, D.; Sudhakar, K.; Sivaprasad, B. 3D Numerical Modelling of Powerhouse Complex and Surge Tank for Vishnugad Pipalkoti Hydro Electric Project (444 MW), Uttarakhand; NIRM: Bengaluru, India, 2021. [Google Scholar]
  49. Naik, S.R.; Bhusan, R.; Sekar, B.H.V.; Sudhakar, K. 3D Stress Analysis of Underground Powerhouse Complex at Mangdechhu Hydroelectric Project, Bhutan; NIRM: Bengaluru, India, 2018. [Google Scholar]
  50. National Institute of Rock Mechanics, Annual Report (2010–11); NIRM: Bengaluru, India, 2011.
  51. Goyal, D.P.; Khazanchi, R.N. 1020 MW Tala Hydroelectric Project (Bhutan)–A Fast Construction Model. In International Conference on Accelrated Construction of Hydropower Projects; Central Board of Irrigation and Power: New Delhi, India; Tala Hydroelectric Project Authority: Gedu, Bhutan, 2003; pp. 26–27. [Google Scholar]
  52. Jeyaseelan, R. Design of Large Caverns. In International Conference on Accelrated Construction of Hydropower Projects; Central Board of Irrigation and Power: New Delhi, India; Tala Hydroelectric Project Authority: Gedu, Bhutan, 2003; pp. 15–17. [Google Scholar]
  53. Chopra, V.; Gupta, A. Roof Arch Failure of Machine Hall Cavern–Tala Hydroelectric Project. In International Conference on Accelrated Construction of Hydropower Projects; Central Board of Irrigation and Power: New Delhi, India; Tala Hydroelectric Project Authority: Gedu, Bhutan, 2003; pp. 29–31. [Google Scholar]
  54. Bhasin, R.; Pabst, T.; Li, C. Stability Analysis of Surrounding Rock of a Large Hydropower Cavern in the Himalayas. In Rock Characterisation, Modelling and Engineering Design Methods; CRC Press: Boca Raton, FL, USA, 2013; pp. 659–664. [Google Scholar]
  55. Singh, R.; Sharma, B.N.; Puri, P.K.; Gupta, M.; Goyal, D.P.; Chugh, I.K. Experience of Long Rock Bolts in Machine Hall Cavern at Tala Hydoelectric Project. In International Conference on Accelrated Construction of Hydropower Projects; Central Board of Irrigation and Power: New Delhi, India; Tala Hydroelectric Project Authority: Gedu, Bhutan, 2003; pp. 15–17. [Google Scholar]
  56. Sharma, B.N.; Engineer, S. Experience of Dywidag Rock Bolts in Machine Hall Cavern at Tala Project. In International Conference on Accelrated Construction of Hydropower Projects; Central Board of Irrigation and Power: New Delhi, India; Tala Hydroelectric Project Authority: Gedu, Bhutan, 2003; Volume 9, pp. 68–74. [Google Scholar]
  57. Singh, R. Quality Management of Powerhouse Cavern at Tala Hydoelectric Project in Bhutan Himalayas. In International Conference on Accelrated Construction of Hydropower Projects; Central Board of Irrigation and Power: New Delhi, India; Tala Hydroelectric Project Authority: Gedu, Bhutan, 2003; pp. 503–506. [Google Scholar]
  58. Venkatesh, H.S.R.N.; Gupta, B.N.; Sharma, M.C.D.; Puri, P.K. Rock Mass Damage Control in Machine Hall Cavern of Tala Hydroelectric Project (Bhutan) by Near Field Vibration Monitoring. In International Conference on Accelerated Construction of Hydropower Projects; Central Board of Irrigation and Power: New Delhi, India; Tala Hydroelectric Project Authority: Gedu, Bhutan, 2003; Volume I, pp. 23–31. [Google Scholar]
  59. Singh, R.; Dhawan, A.K. Experience of Deformability Measurement Using Goodman Jack. In Proceedings of the International Conference on Rock Engineering Techniques for Site Characterisation, ROCKSITE, Bangalore, India, 26 November 1999; pp. 29–36. [Google Scholar]
  60. Singh, R. Instrumentation at Tala Hydroelectric Project in Bhutan. In International Conference on Accelrated Construction of Hydropower Projects; Central Board of Irrigation and Power: New Delhi, India; Tala Hydroelectric Project Authority: Gedu, Bhutan, 2003; pp. 42–66. [Google Scholar]
Figure 1. Google Earth image showing the location of the in situ tests carried out in different hydroelectric projects situated in the Himalayan region.
Sustainability 15 05721 g001
Figure 2. Plot between modulus of deformation and the RMR. (a) Ed vs. RMR. (b) Ee vs. RMR.
Sustainability 15 05721 g002aSustainability 15 05721 g002b
Figure 3. Relationship between modulus of deformation and RMR.
Sustainability 15 05721 g003
Figure 4. Relationship between Ed and RMR for (a) sedimentary rocks and (b) metamorphic rocks.
Sustainability 15 05721 g004
Figure 5. Estimated value of Ed based on empirical Equations (1)–(19).
Sustainability 15 05721 g005
Figure 6. Three-dimensional view of the Tala Powerhouse complex, developed using FLAC3D.
Sustainability 15 05721 g006
Figure 7. Excavation sequence simulated in 3D model.
Sustainability 15 05721 g007
Figure 8. Plot between measured and modelled convergence at different elevations.
Sustainability 15 05721 g008
Figure 9. Displacement contours at RD 65 after excavation. (a) Model A. (b) Model B.
Sustainability 15 05721 g009
Table 1. Empirical equations for estimating Ed using RMR.
Equation No.Ref.YearEquationType of EquationR2LimitationsData Sets UsedRMR RangeCountry of OriginLithology
(1)[12]1978 E d = 2 R M R 100 Linear-RMR > 503 Sites 51–85South AfricaShale, siltstone, dolerite, mudstone, and sandstone (hard rocks).
(2)[14]1983 E d = 10 ( R M R 10 ) / 40 Power-RMR ≤ 501526–83-Dolerite, sandstone, mudstone, shale, siltstone, gneiss, and granite (soft rocks).
(3)[24]1992 E d = 10 ( R M R 20 ) / 38 Power0.91-120-India
(4)[25]1993 E d = 0.03 e 0.07 R M R Exponential-----
(5)[26]1996 E d = e ( 4.407 + 0.081 R M R ) Exponential----CroatiaLimestone
(6)[27]1997 E d = 0.0000097 R M R 3.54 Power-----Gneiss, granite, and sandstone.
(7)[28]1999 E d = 0.1 ( R M R 10 ) 3 Power--1526–83New ZealandGraywacke, sandstones, and mudstones.
(8)[29]1999 E d = ( 7 ± 3 ) ( 10 ( R M R 44 ) / 21 ) 0.5 Non-linear----Various
(9)[30]2003 E d = 0.0736 e ( 0.0755 R M R ) Exponential0.62-11520–85VariousQuartzdiorite, limestone, and shale.
(10)[31]2003 E d = 19.43 ln R M R 69.03 Logarithm--5738–84TurkeyGrey and pinky quartzdiorite.
(11)[15]2006 E d = 0.3228 e ( 0.0485 R M R ) Exponential0.36-8 Sites -Korea
(12)[16]2008 E r m = 6.7 R M R 103.06 Linear0.94RMR ≥ 27927–61TurkeyGraywacke
(13)[17]2010 E d = 0.0003 R M R 3 0.0193 R M R 2 + 0.315 R M R + 3.4065 Polynomial0.8446-4210–85IranLimestone and marble
(14)[18]2012 E d = 110 e ( R M R 110 37 ) 2 Gaussian function0.932-43-VariousMudstone, siltstone, sandstone, shale, dolerite (hard rocks), granite, gneiss, mudstone, siltstone, sandstone, shale, and dolerite (soft rocks).
(15)[19]2013 E d = 10 ( R M R 16 ) / 50 Power0.64-4207–92KoreaGneiss
(16)[20]2014 E d = 0.1627 R M R 5.0165 Linear0.6709-5230–76IranSandy siltstone, mudstone, conglomerate, sandstone, dislocated rock mass, faulted rock mass, and shear zone.
(17)[21]2015 E d = 0.058 e ( 0.0785 R M R ) Exponential0.97-4 Sites -TurkeyBasalt, tuffites, and diabases.
(18)[22]2013 E d = 9 E 7 R M R 3.868 Power0.89-8239–85IranGrey-green schist, phyllite, dark grey to black limestone, and limy dolomite.
Table 2. Empirical equations for estimating Ed using RMR based on 35 test data.
S.No.Type of EquationEquationCoefficient of Regression, R2
1Linear0.183RMR − 5.810.53
2Logarithmic5.8log(RMR) − 19.170.37
3Cubic 0.00011 R M R 3 0.0083 R M R 2 + 0.2 R M R 1.3 0.75
4Exponential 0.0352 e 0.0798 R M R 0.708
Table 3. Support system considered in the model for MHC and THC.
CavernSupport System
MHC–Crown 32 mm diameter, 8 m and 6 m long rock bolts at 1.5 m × 1.5 m pattern
Steel-fiber-reinforced shotcrete (SFRS) of 100 mm thickness
Steel ribs of ISMB 300 at 0.6 m spacing
32 mm/26.5 mm diameter, 12 m long Dywidag rock bolts at 1.5 m spacing
MHC–Walls32 mm/26.5 mm diameter, 12 m long Dywidag rock bolts at 1.5 m spacing
THC–Crown32 mm diameter, 8 m and 6 m long rock bolts at 3 m × 1.5 m pattern
Steel-fiber-reinforced shotcrete (SFRS) of 100 mm thickness
Steel ribs of ISMB 350 at 0.6 m spacing
THC–Walls32 mm/26.5 mm diameter, 8 m long Dywidag rock bolts at 1.5 m spacing
MHC and THC WallsInitial layer of shotcrete of 50 mm thickness
Welded-wire mesh of 100 mm × 100 mm × 5 mm
Final two shotcrete layers of 50 mm each
Disclaimer/Publisher’s Note: The statements, opinions and data contained in all publications are solely those of the individual author(s) and contributor(s) and not of MDPI and/or the editor(s). MDPI and/or the editor(s) disclaim responsibility for any injury to people or property resulting from any ideas, methods, instructions or products referred to in the content.

