Article

An Evaluation of Possible Sugarcane Plantations Expansion Areas in Lamongan, East Java, Indonesia

1
Graduate School, IPB University, Bogor 16680, Indonesia
2
Soil Science and Land Resources Department, IPB University, Bogor 16680, Indonesia
3
Environmental Research Center, IPB University, Bogor 16680, Indonesia
4
Forest Resources Conservation and Ecotourism Department, IPB University, Bogor 16680, Indonesia
5
Agroindustrial Technology Department, IPB University, Bogor 16680, Indonesia
*
Author to whom correspondence should be addressed.
Sustainability 2023, 15(6), 5390; https://doi.org/10.3390/su15065390
Submission received: 16 January 2023 / Revised: 4 March 2023 / Accepted: 6 March 2023 / Published: 17 March 2023
(This article belongs to the Special Issue Geographic Information Science for the Sustainable Development)

Abstract

:
Sugar is a significant commodity for Indonesia because the need for sugar reaches 7 million tons. Meanwhile, imports from Thailand, Australia, and Brazil were approximately 5.54 million tons in 2020. Sugarcane and sugar production in East Java province is also supported by Lamongan Regency. Therefore, this study aims to evaluate the possible sugarcane plantation expansion areas in Lamongan. The evaluation process carried out in this study was an analysis of land suitability using the analytic network process (ANP) and land availability using an overlay analysis of several policy maps. Three parameters with the highest weight of the ANP were soil drainage (0.181), cation exchange capacity and base saturation (0.134), and rainfall (0.133). The total possible area for sugarcane plantations expansion in Lamongan was 32,552.37 ha and the largest class was Possible Area 2 (65.67%). The three sub-districts with the highest possible areas include Solokuro, Ngimbang, and Mantup. We recommend that the government and stakeholders extend the area allocated to sugarcane plantations in Lamongan because the possible expansion areas are still more than 30 ha, while in the 2011–2031 spatial plan they were only 8927 ha. Expansion plans must take into consideration other uses such as residence, industry, food crops, and protected areas.

1. Introduction

The rising demand for sugar coincides with a reversal in the national production pattern, resulting in a significant increase in sugar imports. Several studies have found that land conversion has led to an annual decline in its production [1,2]. The conversion of agricultural land, including the sugarcane plantation to non-agricultural land, is a serious issue that can threaten the sustainability of the plant. In addition to the national level, this problem is also experienced in East Java, including in Lamongan Regency, which also affects the dynamics of sugarcane and sugar production. Lamongan Regency is one of the regencies of East Java province which contributes to the production of sugarcane and sugar. East Java is the largest contributor to sugar production in Indonesia (47%) [3].
One of the factors causing land conversion is the increased population growth rate [4,5,6]. Agricultural lands are frequently transformed into residential, commercial, and industrial zones. Continuous conversion may threaten sugarcane and sugar production in Lamongan, East Java, and at the national level. Land conversion is strongly influenced by the development of infrastructure that drives non-agriculture new growth centers [7].
A previous study revealed that a decline in sugarcane plantation areas can cause difficulties in achieving self-sufficiency [8]. Furthermore, self-sufficiency is the ability of a region to address its needs independently [9]. In this case, it is an effort to meet the demand for sugarcane and sugar. Sugar self-sufficiency can be achieved through effective cooperation among stakeholders.
The expansion of sugarcane plantations is important to minimize the negative impact of land conversion, which can reduce the cultivation area as well as the production of the plant. This expansion policy is contained in the technical material of the 2011–2031 Lamongan Regency’s spatial plan [10], especially in the agricultural sector, but there are still possible cultivation areas that have not been utilized. These regions can be allocated in the spatial plan as an effort to increase sugar production in Lamongan Regency.
Areas that have the potential to be expanded into sugarcane plantations can be assessed by analyzing the suitability and availability of land. Several methods can be used to analyze land suitability, including the matching criteria [11] and multi-criteria decision-making (MCDM) techniques [12]. One of the methods included in the MCDM and widely used in several fields is the analytic hierarchy process (AHP) and analytic network process (ANP). The ANP technique allows the production of more accurate modeling than the AHP technique because all elements of the network can be related to each other [13,14,15].
An earlier study carried out a suitability analysis for major crops by using ANP and overlay analysis in the Andit Tid watershed, Ethiopia [16]. The ANP technique has also been used to perform spatial suitability analysis for land use planning in coastal areas of Malaysia [17]. A spatial-based suitability analysis with ANP was also carried out to evaluate the sustainable citrus land planning integrated with the GIS method [18].
Studies on the use of the ANP method have been continuously developed because it can be applied in various sectors, including the assessment of land suitability [19], supply chain management [20], and conservation [21]. Meanwhile, this study used the ANP method to analyze the land suitability for sugarcane plantations. In addition to land suitability analysis, it is important to carry out an analysis of land availability to ensure that suitable areas are available for use. Therefore, land suitability analysis with ANP is combined with land availability analysis by overlaying several policy documents to evaluate potential areas for sugarcane plantation expansion. This study aims to evaluate the possible expansion areas of sugarcane plantations in Lamongan Regency. Evaluation of possible sugarcane plantation expansions area is helpful in increasing sugar production at the regional level to support sugar self-sufficiency in Indonesia.

2. Methodology

2.1. Study Area

This study was carried out in Lamongan Regency, East Java province, Indonesia, in 2021, as shown in Figure 1. Furthermore, the regency has a tropical climate that is suitable for the cultivation of sugarcane [11] because it is located between 6°51′54″–7°23′06″ south latitude and 112°33′45″–112°34’45″ east longitude [22]. It has an area of 175,985.39 hectares, directly adjacent to the Java Sea in the north; Jombang and Mojokerto in the south; Gresik in the east; and Bojonegoro and Tuban to the west [23]. The population of this area in 2021 was 1,356,027 [24], and most of the inhabitants worked in the agricultural sector [25]. The agriculture, forestry, and fishery sectors were the largest contributors to the region’s gross domestic product, representing 30% [26].

2.2. Data Collection

The data used in this study were obtained from Indonesian government agencies, the government of Lamongan Regency, interviews, and questionnaires, as well as other secondary data sources. Some of them included the land unit map sourced from the Center for Agricultural Land Resources [27]; climate data obtained from weather measurement stations of the Meteorology, Climatology, and Geophysics Agency [28]; a topographical earth map from the Geospatial Information Agency [29]; coordinates of sugar factories and sugarcane plantations as a result of field checks taken using GPS; sugarcane plantations production and land area data from Lamongan Regency Statistics [30]; a land use/cover map from the previous study [31]; digital elevation model (DEM) data from the United States Geological Survey (USGS) [32]; results of expert and stakeholder interviews and questionnaires; Lamongan Regency’s spatial plan map from the Regional Development Planning Agency [10]; and a forest area map from the Ministry of Environment and Forestry [33].

2.3. Land Suitability Analysis

Land suitability analysis was carried out using Spatial-ANP, which is a combination of spatial analysis and the analytic network process, a development of the AHP (analytic hierarchy process) method. The analytic network process (ANP) is a technique for obtaining relative importance or priority based on multi-criteria assessed by individuals or based on the normalization of measurement results [34]. The use of the ANP method allows all elements at all levels to be connected within the network [35].
The ANP analysis in this study was used to obtain the weights of the land suitability for sugarcane criteria using several parameters including climate, land, topographic, and land management factors [36]. Land parameters include soil type, cation exchange capacity, base saturation, pH, soil depth, drainage, and land capability obtained through land unit map analysis [37]. Furthermore, the topographical parameters include slope and elevation collected through DEM data analysis [36]. The climate factors consist of rainfall and temperature obtained from the results of climate data measurements [38]. The land management parameters include the distance to roads, which was analyzed using a topographic map, the distance to sugar factories, collected through an analysis of the coordinates of sugar factories, and land use/cover [37]. Each criterion consists of subcriteria presented in Figure 2, Figure 3, Figure 4 and Figure 5.
The weights in the ANP were determined after interviews were carried out with six experts and stakeholders. Each participant identified the level of importance of the criteria based on the pairwise comparison matrix of the questionnaire. Opinions from different experts were then combined with geometric mean [39,40]. Furthermore, the cation exchange capacity and base saturation criteria were combined in the assessment because they represented the level of nutrient retention in the soil.
The steps for land suitability analysis using ANP include:
(a)
Perform pairwise comparisons and estimate relative weights
  • The relative weight of the ANP method was determined using pairwise comparisons on a scale of 1–9 to compare the two elements [41,42]. Subsequently, the consistency index (CI) value was then calculated using the following formula:
    C I = λ m a x n n 1
  • where CI is the consistency index; λmax is the principal eigenvalue of the matrix; and n is the number of elements. In addition, the consistency ratio (CR) was calculated to determine the consistency of expert and stakeholder opinions, and it was obtained by dividing the CI by the random consistency index (RI) based on the following formula:
    C R = C I / R I
The consistency ratio value was estimated to be below 10% [43,44,45].
(b)
Assemble the initial supermatrix
  • The AHP procedure was used to determine the relative weights of the ANP. All vector eigenvalues from the pairwise comparison matrix were subsequently entered into the ANP supermatrix.
(c)
Construct the weighted supermatrix
  • The weighted supermatrix was arranged according to each weighted priority vector obtained from the pairwise comparison matrix between the clusters.
(d)
Create the limiting supermatrix
  • This stage was carried out by raising the weighted supermatrix to the power of k (1, 2,..., n) until the numbers for each column in one row were the same.
(e)
Combine each data with the weighted linear combination (WLC)
  • The final weight of the land suitability analysis was the total of the weighted results of the criteria with ANP multiplied by the score of each sub-criteria [46,47,48]. The largest final value indicated the most suitable class. The WLC formula is presented below:
    W L C = i = 1 n W i * X i
  • where WLC, n, Wi, and Xi represent the final land suitability weight, the number of criteria, the criterion weight to i, and the score of each class on criterion i, respectively. The WLC results will be classified into four land suitability classes, namely S1 (highly suitable), S2 (moderately suitable), S3 (marginally suitable), and N (not suitable) [49,50,51].
(f)
Test the accuracy of land suitability analysis
  • The accuracy test results of the land suitability analysis were carried out by comparing the land suitability map with the field checking coordinate taken using GPS and productivity data generated from production and land area data [19]. The total points used in the accuracy test are 36 sample points. Furthermore, the calculation of overall accuracy (OA) and kappa accuracy (KA) is performed to determine the accuracy value of the results of a land suitability analysis, which is carried out using the following formula [52]:
    O A = i = 1 m n i i N n   x   100 %
    K i = N i = 1 m n i i i = 1 m n i + + n + i   N 2 i = 1 m n i + + n + i  
  • where the OA is overall accuracy; n is the total point of the classification results; ii is the element in the ith column and row; i = 1 m n i i is the total result of the test point which corresponds to the control point in the field checking; N is the sum of all points; n i +   is the point of land suitability analysis; and n + i is the field checking point. If the accuracy value is close to 1, the results of the land suitability analysis are getting better. An accuracy test value of 0 means that the accuracy of the analysis results is very bad; a value of 0.01 to 0.20 is bad; a value of 0.21 to 0.4 is sufficient; a value of 0.41 to 0.60 means moderate; a value of 0.61 to 0.80 means good; and an accuracy value of 0.81 to 1.00 means very good [53].

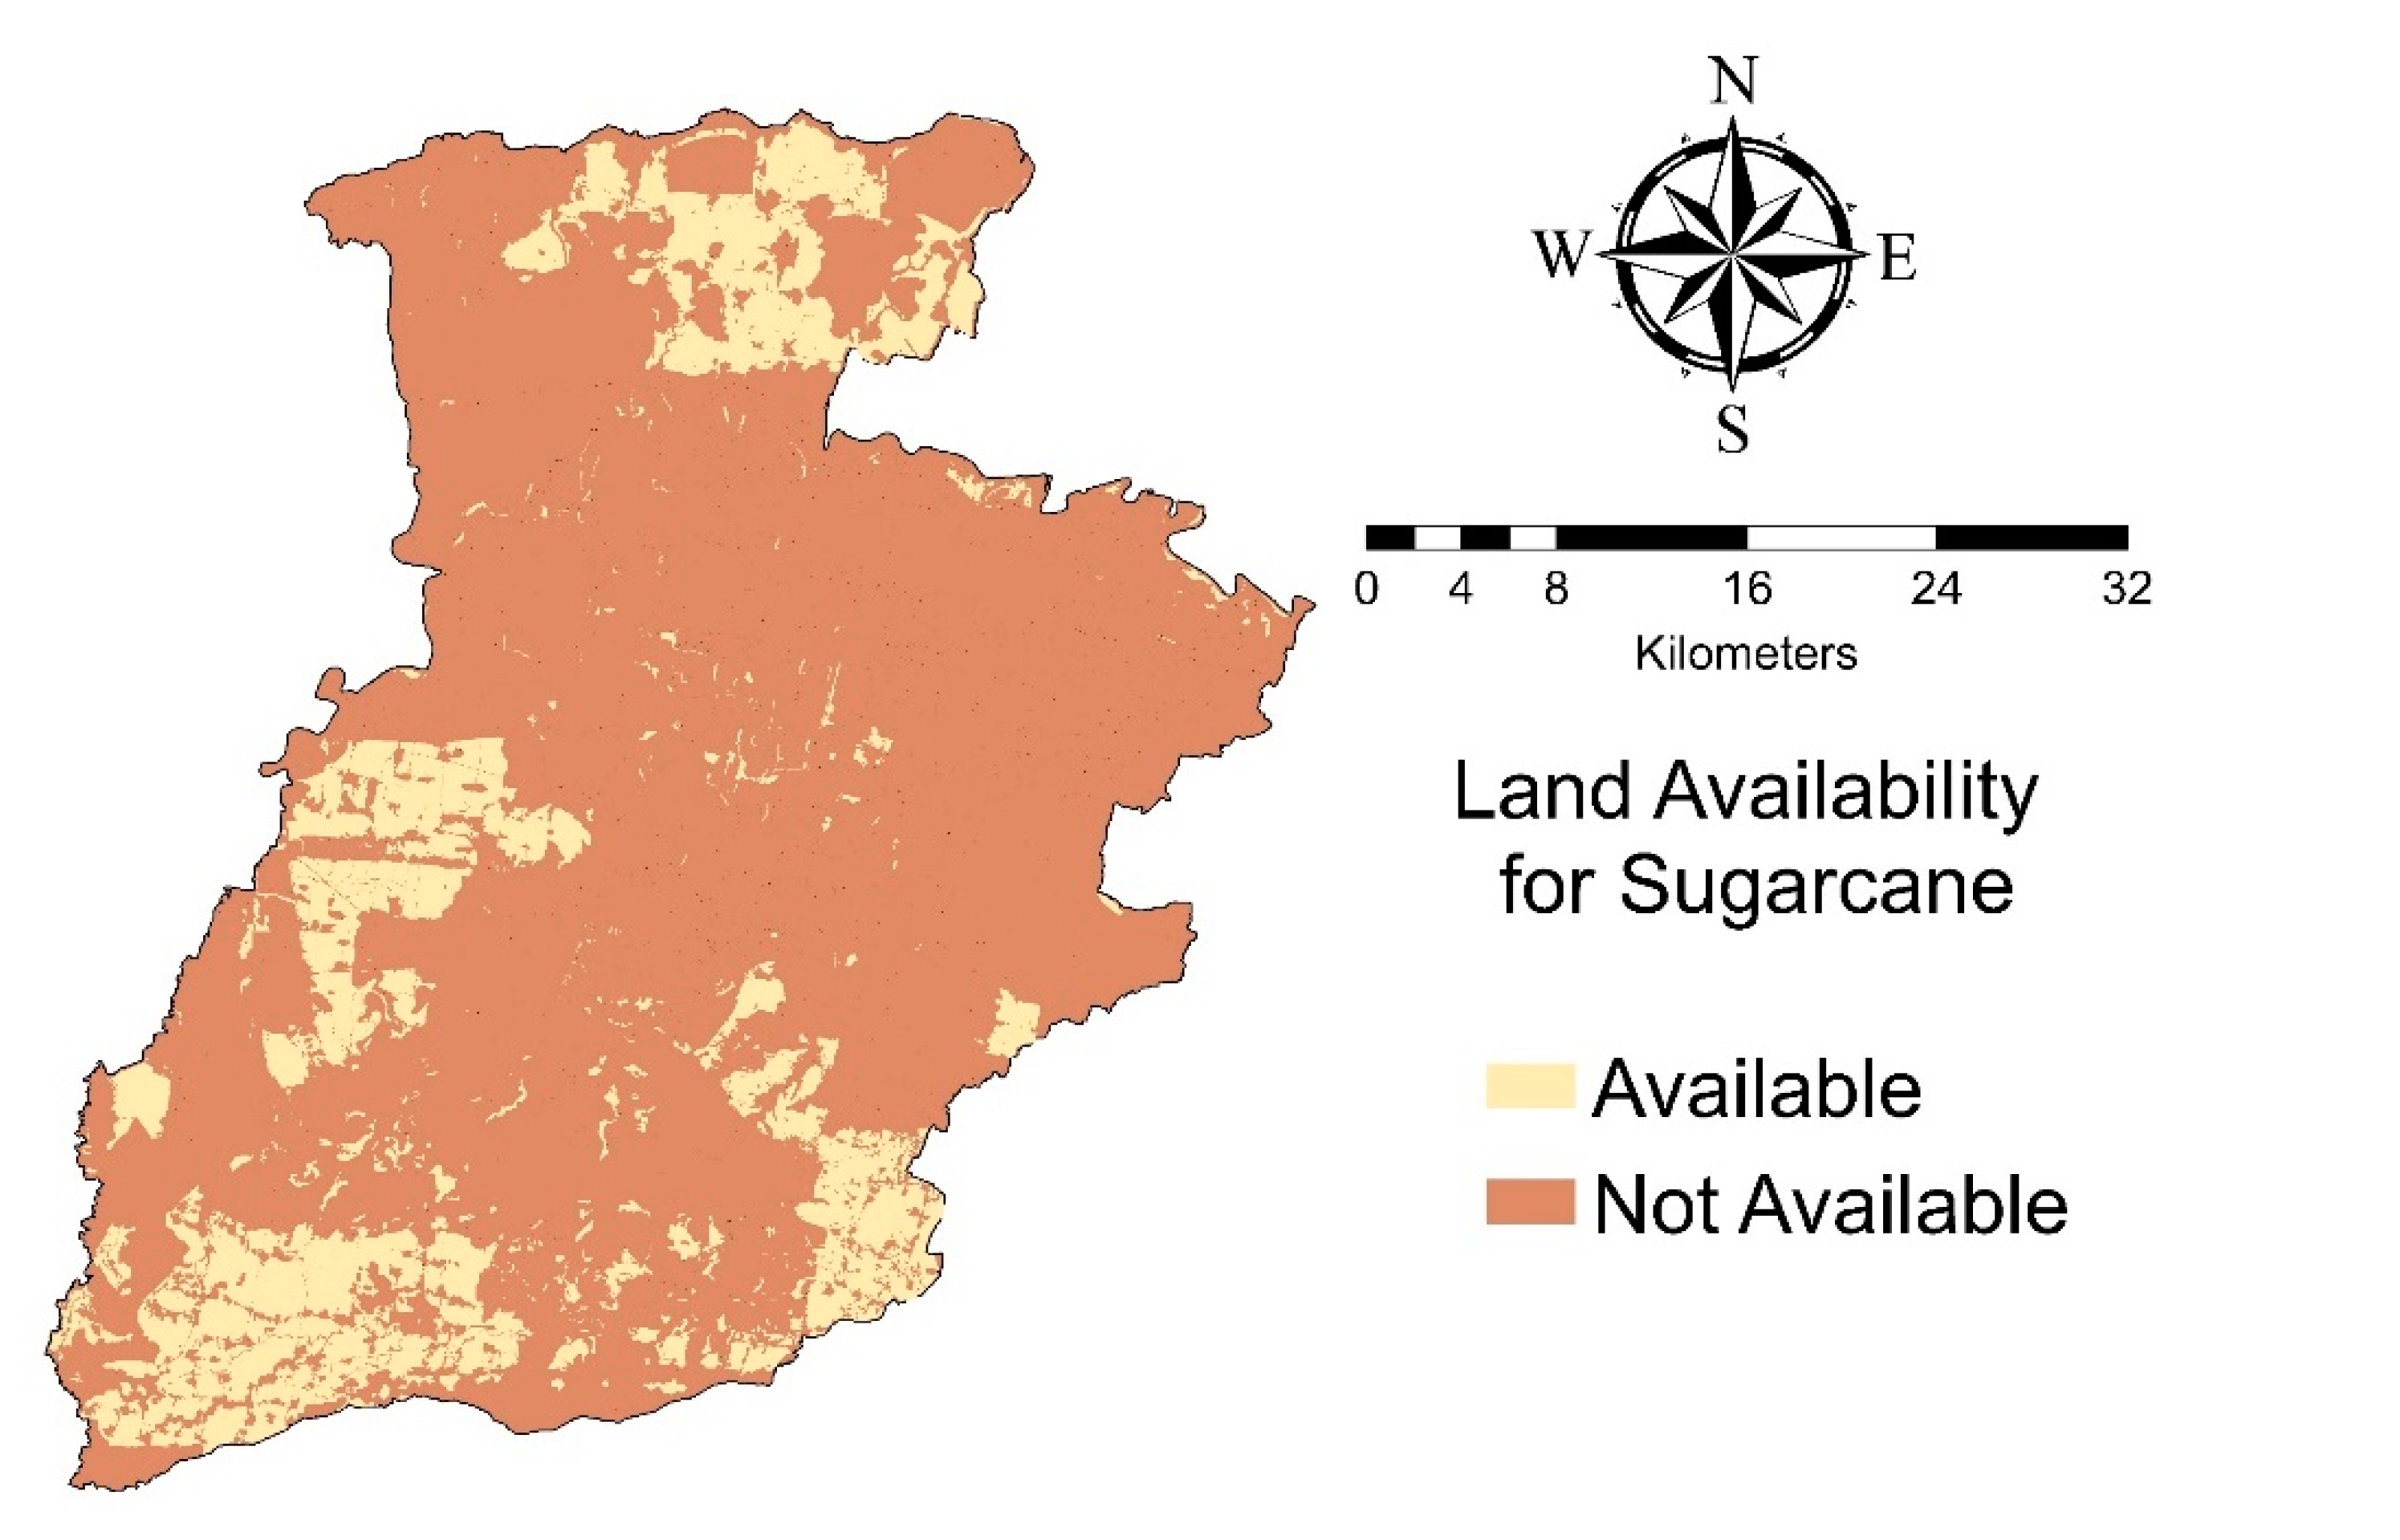
2.4. Land Availability Analysis

Information on suitable land was still insufficient to identify regions likely to be expanded into sugarcane plantations, considering that available areas were increasingly limited due to population growth [38]. Therefore, an analysis of availability was carried out to determine the potential expansion area of sugarcane plantations. Availability analysis for sugarcane plantations was carried out by overlaying land use/land cover maps (Figure S1), forest area maps (Figure S2), and spatial plan maps (Figure S3) [54]. The spatial plan map with the possibility of being expanded for sugarcane plantations consists of cultivation areas in the form of plantations, dry fields/fields, and rainfed rice fields. Food agricultural land in the form of protected agriculture was excluded from the analysis to ensure that it does not interfere with the fulfillment of staple food needs [55,56,57]. The location on the forest area map that can be used to expand sugarcane plantations was included in the area of other uses, namely undesignated regions. The types of land use/land cover that may be used are shrubs, open land, fields/moors, and existing plantations.

2.5. An Evaluation of Possible Expansion Areas of Sugarcane Plantations in Lamongan Regency

Possible expansion areas can be evaluated by overlaying land suitability and availability maps [58,59]. This method will produce output in the form of a map showing the most feasible regions for sugarcane plantation expansion without violating the boundaries set by regulations, such as protected forest areas and regional spatial plans. After obtaining suitable and available land maps, an evaluation of the possible sugarcane plantation expansion areas was carried out by overlaying them. Furthermore, three classes of possible areas were obtained, namely, PA1 (Possible Area 1), PA2 (Possible Area 2), and PA3 (Possible Area 3) which are highly, moderately, and marginally suitable and available.

3. Results

The Weighting of Land Suitability Criteria

Criteria weighting by experts using the ANP method has been carried out to determine the order of importance of each criterion used in the analysis of land suitability for sugarcane plantations in Lamongan. The order of importance of the resulting criteria includes soil drainage, cation exchange capacity and base saturation, rainfall, soil depth, land capability, slope, temperature, soil type, elevation, land use, soil pH, distance to the sugar factory, and distance to the road. The consistency ratio of the analysis using ANP is 0.091, so the results of the criterion weighting may be accepted because it is below the 10% inconsistency limit [20]. The pairwise comparison matrix weight and the rank of each criterion result based on all expert opinions analyzed using the ANP method are presented in Table 1.
Each criterion used in the land suitability analysis consisted of several sub-criteria, which were determined by thresholds and intervals based on academic literature and other legal sources [60,61,62]. The sub-criteria with the highest weight in the criteria for soil type are mollisols and alfisols because these two soil types have fertile parent material and are the most productive soil types in the world [63]. The higher the soil CEC, the higher the KB, which indicates that the soil is fertile because it has not experienced too much leaching [64]. The deeper the soil, the higher the score, because the root media for plants will be wider. The highest score in the pH sub-criteria is in class 6.6–7.5 because the pH in this class is assumed to be neutral. Class 3 drainage has the highest score because it is in good condition. The land capability class in Lamongan Regency with the highest carrying capacity is class II, so this class has the higher score.
The criterion for the slope with the highest score is the slope of 0–3% because the surface is flat, making it easier for cultivation activities. An excellent altitude for sugar cane plantations is less than 600 m above sea level [65]. Rainfall of 1300–1500 mm has the highest score because the sugar content in sugarcane will decrease if the rainfall is too high. Temperatures of 26–30 °C are given the highest score because temperatures that are too low can slow down sugarcane growth and result in low yields [66], while temperatures that are too high may reduce sugarcane production. Types of land use that have the highest score are sugarcane plantations, fields/moors, and paddy fields. Fish ponds, water bodies, and built-up areas are given a score of 0 because these criteria are not suitable for sugarcane plantations [36]. The closer the distance to the road and the distance to the sugar factory, the higher the score given because it is easier to access to and from the sugarcane plantations [37]. The results of scoring of the sub-criteria for each criterion are presented in Table 2.
Based on the results of the analysis, lands in Lamongan were dominated by the S2, with a total area of 103,616.73 ha (58.88%). The land suitability accuracy test results were 86.11% for overall accuracy and 73.72% for kappa accuracy, which means that the resulting land suitability map is good. Meanwhile, the area and percentage of each class of land suitability for sugarcane plantations in Lamongan Regency are presented in Table 3, while their distribution is shown in Figure 6.
After overlaying the land use/land cover maps, forest area maps, and spatial plan maps, the area and distribution of land available for sugarcane plantation expansion in Lamongan are obtained. The total available land with the potential to expand sugarcane plantations in Lamongan Regency was 32,552.37 ha, as shown in Figure 7. Most of the available land is located in the northern and southern parts of Lamongan Regency (Figure 7) because the area is still not widely utilized for other purposes.
The results of the analysis show that most of the regions observed were in Possible Area 2 (PA2), with a total area of 21,376.39 ha (65.67%). Most of PA 2 areas are spread in the southern part of Lamongan district, which includes the sub-districts of Ngimbang, Sukorame, Bluluk, Sambeng, Mantup, Kembangbahu, Modo, and Kedungpring, as shown in Figure 8. Meanwhile, the area for each class is presented in Table 4.
Table 4 shows that the total possible sugarcane plantation expansion areas in Lamongan Regency were 32,552.37 ha. Furthermore, most of them were in the moderate suitability class with an area of 21,376.39 ha (65.67%). Based on the results of the analysis, the identified regions and sub-districts have a high possibility of expansion of sugarcane plantations in Lamongan Regency. The three big sub-districts in this study were Solokuro, Ngimbang, and Mantup sub-districts, which have areas of 4335.50 ha, 4144.25 ha, and 3278.25 ha, respectively, as shown in Figure 9.

4. Discussion

The three main criteria for the determination of land availability in East Java include soil drainage, cation exchange capacity and base saturation, and rainfall. Furthermore, soil drainage has the greatest weight, namely 0.181, and it indicates the extent to which water is lost from the surface [64]. Good water drainage canals are very important for sugarcane plantations because stagnant water causes root rot [66]. Several studies have also revealed that it has a significant impact on productivity and plays a role in the conservation of agricultural land [67]. These are in accordance with the previous study that drainage is very important for sugarcane plants because the drainage system can prevent the loss of nutrients due to soil erosion [68].
Cation exchange capacity and base saturation ranked second in the land suitability analysis with a weight of 0.134. A previous study revealed that they served as indicators for the determination of soil fertility [69]. Cation exchange capacity and base saturation are attributes that have a direct effect on sugarcane production [70]. The higher the cation exchange capacity and base saturation values, the more readily nutrients are absorbed by plants [71].
Rainfall had the third-highest weight of 0.133 in the analysis. An increase in rainfall from the optimal level reduced sugarcane production [72]. Therefore, the maturation period often occurred during the dry months to optimize sunlight energy, thereby increasing the sugar content in the plant. In addition, changes in rainfall patterns caused by climate change can cause water stress on sugarcane [73].
The distance to the road has the lowest weight compared to all criteria, namely 0.011. This was because almost 99% of locations in Lamongan Regency have a distance of 0–1000 m from the road. This indicates that road network infrastructures are relatively quite easy to obtain. The quality of transportation infrastructure in the form of roads is very important because they serve as a link in the supply chain [74].
The total possible sugarcane plantation expansion areas in Lamongan Regency were 32,552.37 ha, and the three highest contributing sub-districts include Solokuro, Ngimbang, and Mantup. The distribution of sub-districts allows the expansion of sugarcane areas in Lamongan. This study complies with the spatial plan of Lamongan Regency [10]. The results of the analysis showed that these areas were dominated by Possible Area 2 (PA2) with moderately suitable land (S2). The dominant soil types in this area are inceptisols; soil depth 76–100 cm; cation exchange capacity 17–24 cmol; base saturation 61–80%; drainage class 3; pH 5.6–6.5; land capability class II; slope 8–15%; elevation < 600 m above sea level; rainfall 2500–3000 mm; temperature 26–28 °C; land use in the form of paddy fields; distance to the road 0–1000 m; and distance to the sugar factory 0–15 km.
This study shows that Lamongan Regency still has the opportunity to expand the plantation area to support the growth of sugar production in the region, as well as in other regencies. The 2011–2031 technical material spatial plan also allocated the expansion of plantations covering an area of 8927 ha, including sugarcane [10]. Therefore, sugarcane plantations can be allocated with a larger area in the spatial plan for the next period in order to optimize their production. These results can be used as input for reviewing the spatial plan for Lamongan Regency in the context of expanding land allocation, as well as for the next period.

5. Conclusions

Soil drainage, cation exchange capacity and base saturation, and rainfall were some of the criteria that played a very important role in determining the land suitability for sugarcane plantations in Lamongan Regency. Furthermore, Possible Area 1 had a percentage of 28.92%, which indicates that Possible Areas 2 and 3 with lower suitability can still be improved through various efforts, such as improving soil drainage, adding organic matter, providing limestone, ensuring sufficient water, making terraces for less sloping land, and improving infrastructure.
The political implication of this study is that the expansion of sugarcane plantations in Lamongan Regency still has a large possible area of 32,552.37 ha and is spread over several sub-districts. The spatial allocation is currently only 8927 ha; meanwhile, during this time, it is still possible to expand to 23,625.37 ha. Therefore, we recommend that the government and stakeholders expand the area allocation for sugarcane plantations in Lamongan. The development of sugarcane plantations on the basis of potential areas for expansion can be carried out by paying attention to other aspects, such as spatial allocation plans for residential, industry, food crops, water catchment, and protected areas. The expansion plan that is in line with the possible areas evaluation results is expected to support the achievement of national sugar self-sufficiency, create jobs, and reduce importation volume.

Supplementary Materials

The following supporting information can be downloaded at https://www.mdpi.com/article/10.3390/su15065390/s1, Figure S1: Land use/land cover map of Lamongan Regency; Figure S2: Forest area map; Figure S3: Spatial plan map of Lamongan Regency 2011–2031.

Author Contributions

Conceptualization, S.D.A., W., Y.S. and M.; methodology, M. and W.; software, M.; validation, S.D.A. and Y.S.; formal analysis, S.D.A. and W.; investigation, W., Y.S. and M.; resources, S.D.A. and W.; data curation, Y.S. and M.; writing—original draft preparation, S.D.A.; writing—review and editing, W., Y.S. and M.; visualization, S.D.A. and Y.S.; supervision, W. and M.; project administration, S.D.A.; funding acquisition, W. All authors have read and agreed to the published version of the manuscript.

Funding

This research was funded by the Indonesian Ministry of Education and Culture according to contract number 001/E5/PG.02.00PT/2022 and sub-contract number 3705/IT3.L1/PT.01.03/P/B/2022 for the Pendidikan Magister Menuju Doktor untuk Sarjana Unggul—PMDSU (Masters Education towards Doctorate for Superior Scholars) scholarship program.

Institutional Review Board Statement

Not applicable.

Informed Consent Statement

Not applicable.

Data Availability Statement

The data in this study can be requested from the corresponding author. However, some data cannot be shared because it is not publicly available by the relevant institutions.

Acknowledgments

We thank the Indonesian Ministry of Education and Culture and IPB University for the support and funding provided for this research. We also thank all the agencies involved in this research to meet the needs of research data, experts and stakeholders who have provided an assessment of the criteria used in the research, and all parties who have contributed to the research and completion of this paper.

Conflicts of Interest

The authors declare no conflict of interest.

References

  1. Rahman, M.E.; Sinaga, B.M.; Harianto; Susilowati, S.H. Domestic support policies for neutralizing the negative impacts of import tariff reduction on Indonesian sugar industry. J. Agro Ekon. 2019, 36, 91. [Google Scholar] [CrossRef] [Green Version]
  2. Sumarno, J.; Anasiru, R.H.; Retnawati, E. Sugarcane farm efficiency in Gorontalo Province. J. Penelit. Tanam. Ind. Littri 2020, 26, 11. [Google Scholar] [CrossRef]
  3. Indonesian Statistics. Indonesian Sugarcane Statistics; Indonesian Statistics: Jakarta, Indonesia, 2020; pp. 22–23. [Google Scholar]
  4. Jayadi, I.M.Y.; Christiawan, P.I.; Sarmita, I.M. The impact of population growth on the carrying capacity of agricultural land in Sambangan Village. J. Pendidik. Geogr. Undiksha 2017, 5, 2. [Google Scholar] [CrossRef]
  5. Sasongko, W.; Akbar Safari, I.; Eka Sari, K. Conversion of productive agricultural land due to growth of developed land in Sumenep Regency. Plano Madani 2017, 6, 15–26. [Google Scholar]
  6. Putri, N.E.; Hakim, N.; Yamin, M. Ecological footprint and biocapacity analysis for flooding prevention in South Sumatera. J. Mimb. 2016, 32, 58–64. [Google Scholar]
  7. Decreased Land Area, It Is Difficult for RNI to Get Raw Materials. Available online: https://industri.kontan.co.id/news/luas-lahan-menurun-rni-sulit-dapatkan-bahan-baku (accessed on 25 October 2022).
  8. Yunitasari, D.; Hakim, D.; Juanda, B.; Nurmalina, R. Achieving national sugar self-sufficiency: A policy model to increase sugar production and boost sugar cane farmer’s income in East Java. J. Ekon. Kebijak. Publik 2015, 6, 1–15. [Google Scholar]
  9. Enriquez, J.P. Food Self-Sufficiency: Opportunities and challenges for the current food system. Biomed. J. Sci. Tech. Res. 2020, 31, 23984–23989. [Google Scholar] [CrossRef]
  10. Lamongan Regency Government. Technical Material for the Lamongan Regency Spatial Plan 2011–2031; Lamongan Regency Government: Lamongan, Indonesia, 2011; Volume 1. [Google Scholar]
  11. Hardjowigeno, S.; Widiatmaka. Evaluation of Land Suitability and Land Use Planning; Gadjah Mada Univer‌‌sity‌‌ Press: Yogyakarta, Indonesia, 2011; pp. 315–316. [Google Scholar]
  12. Widiatmaka; Ambarwulan, W.; Sudarsono. Spatial multi-criteria decision making for delineating agricultural land in Jakarta metropolitan area’s hinterland: A case study of Bogor Regency, West Java. Agrivita 2016, 38, 105–115. [Google Scholar] [CrossRef] [Green Version]
  13. Aragonés-Beltrán, P.; Pastor-Ferrando, J.P.; García-García, F.; Pascual-Agulló, A. An analytic network process approach for siting a municipal solid waste plant in the metropolitan area of Valencia (Spain). J. Environ. Manag. 2010, 91, 1071–1086. [Google Scholar] [CrossRef] [PubMed]
  14. Jorge-García, D.; Estruch-Guitart, V. Comparative analysis between AHP and ANP in prioritization of ecosystem services—A case study in a rice field area raised in the Guadalquivir Marshes (Spain). Ecol. Inform. 2022, 70, 101739. [Google Scholar] [CrossRef]
  15. Dano, U.L.; Balogun, A.L.; Matori, A.N.; Yusouf, K.W.; Abubakar, I.R.; Mohamed, M.A.S.; Aina, Y.A.; Pradhan, B. Flood susceptibility mapping using GIS-based analytic network process: A case study of Perlis, Malaysia. Water 2019, 11, 615. [Google Scholar] [CrossRef] [Green Version]
  16. Paul, M.; Negahban-Azar, M.; Shirmohammadi, A.; Montas, H. Assessment of agricultural land suitability for irrigation with reclaimed water using geospatial multi-criteria decision analysis. Agric. Water Manag. 2020, 231, 105987. [Google Scholar] [CrossRef]
  17. Pourebrahim, S.; Hadipour, M.; Bin Mokhtar, M. Integration of spatial suitability analysis for land use planning in coastal areas; case of Kuala Langat District, Selangor, Malaysia. Landsc. Urban Plan. 2011, 101, 84–97. [Google Scholar] [CrossRef]
  18. Zabihi, H.; Ahmad, A.; Vogeler, I.; Said, M.N.; Golmohammadi, M.; Golein, B.; Nilashi, M. Land suitability procedure for sustainable citrus planning using the application of the analytical network process approach and GIS. Comput. Electron. Agric. 2015, 117, 114–126. [Google Scholar] [CrossRef]
  19. Kenzong, B.; Bitondo, D.; Tamfuh, P.A.; Kameni, G.S.K.; Vounang, J.G.; Enang, R.K.; Temgoua, E.; Bitom, D. Assessing and mapping land suitability units for maize (Zea mays) production using integrated DEMATEL-ANP model and gis in the Foumbot agricultural basin (Cameroon Western Highlands). J. Geosci. Environ. Prot. 2022, 10, 57–85. [Google Scholar] [CrossRef]
  20. Salehi, R.; Ali Asaadi, M.; Haji Rahimi, M.; Mehrabi, A. The information technology barriers in supply chain of sugarcane in Khuzestan Province, Iran: A combined ANP-DEMATEL approach. Inf. Process. Agric. 2021, 8, 458–468. [Google Scholar] [CrossRef]
  21. Shafaghat, A.; Keyvanfar, A.; Wui Ket, C. A decision support tool for evaluating the wildlife corridor design and conservation performance using analytic network process (ANP). J. Nat. Conserv. 2022, 70, 126280. [Google Scholar] [CrossRef]
  22. Lamongan Statistics. Lamongan Regency in Figures; Lamongan Statistics: Lamongan, Indonesia, 2022; pp. 3–31. [Google Scholar]
  23. Sukaris, S.; Setyawan, A.C. Antecedents of visiting decisions on artificial travel destinations: Millennial generation perspectives. Innov. Res. J. 2020, 1, 1–9. [Google Scholar] [CrossRef]
  24. Population by Regency/Municipality in East Java Province (Thousand), 2017–2021. Available online: https://lamongankab.bps.go.id/statictable/2022/07/21/5348/jumlah-penduduk-menurut-kabupaten-kota-di-provinsi-jawa-timur-ribu-2017-2021.html (accessed on 15 January 2022).
  25. Population Aged 15 Years and over Who Worked during the Previous Week by Main Industry and Sex in Lamongan Regency. Available online: https://lamongankab.bps.go.id/statictable/2016/11/05/485/-jumlah-penduduk-berumur-15-tahun-keatas-yang-bekerja-selama-seminggu-yang-lalu-menurut-lapangan-usaha-utama-dan-jenis-kelamin-di-kabupaten-lamongan-2015.html (accessed on 15 January 2022).
  26. Gross Regional Domestic Product at 2010 Constant Market Prices by Industry in Lamongan Regency. Available online: https://lamongankab.bps.go.id/statictable/2022/07/21/5381/produk-domestik-regional-bruto-atas-dasar-harga-konstan-2010-menurut-lapangan-usaha-di-kabupaten-lamongan-miliar-rupiah-2015-2019.html (accessed on 16 January 2022).
  27. Center for Agricultural Land Resources. Semi-Detailed Land Map Atlas of Lamongan Regency, East Java Province; Agency for Agricultural Research and Development: Bogor, Indonesia, 2017. [Google Scholar]
  28. Online Data, the Meteorology, Climatology, and Geophysics Agency Database. Available online: https://dataonline.bmkg.go.id/home (accessed on 25 January 2022).
  29. Indonesia Geospatial Portal. Available online: https://tanahair.indonesia.go.id/ (accessed on 25 January 2022).
  30. Total Area of Plantation Plants by District and Plant Type (Hectares). Available online: https://lamongankab.bps.go.id/sindicator/54/229/1/luas-areal-tanaman-perkebunan-menurut-kecamatan-dan-jenis-tanaman.html (accessed on 26 January 2022).
  31. Artikanur, S.D.; Widiatmaka, W.; Setiawan, Y.; Marimin, M. Predicting sugar balance as the impact of land-use/land-cover change dynamics in a sugarcane producing regency in East Java, Indonesia. Front. Environ. Sci. 2022, 10, 787207. [Google Scholar] [CrossRef]
  32. EarthExplorer USGS. Available online: https://earthexplorer.usgs.gov/ (accessed on 27 January 2022).
  33. Interactive Map. Available online: https://sigap.menlhk.go.id/sigap/peta-interaktif (accessed on 30 January 2022).
  34. Saaty, T.L. Fundamentals of the analytic network process-dependence and feedback in decision-making with a single network. J. Syst. Sci. Syst. Eng. 2004, 13, 129–157. [Google Scholar] [CrossRef]
  35. Hidayati, J.; Sukardi, S.; Suryani, A.; Sugiharto, S.; Fauzi, A.M. Analysis of productivity improvement in the palm oil plantation revitalization of North Sumatera using analytic network process. Int. J. Adv. Sci. Eng. Inf. Technol. 2014, 4, 162. [Google Scholar] [CrossRef]
  36. Widiatmaka; Ambarwulan, W.; Setiawan, Y.; Walter, C. Assessing the suitability and availability of land for agriculture in Tuban Regency, East Java, Indonesia. Appl. Environ. Soil Sci. 2016, 2016, 7302148. [Google Scholar] [CrossRef] [Green Version]
  37. Jamil, M.; Ahmed, R.; Sajjad, H. Land suitability assessment for sugarcane cultivation in Bijnor District, India using geographic information system and fuzzy analytical hierarchy process. GeoJournal 2018, 83, 595–611. [Google Scholar] [CrossRef]
  38. Widiatmaka. Integrated use of GIS, AHP and remote sensing in land use planning for tropical high altitude vegetable crops. J. Appl. Hortic. 2016, 18, 87–99. [Google Scholar]
  39. Ozkaya, G.; Erdin, C. Evaluation of smart and sustainable cities through a hybrid MCDM approach based on ANP and TOPSIS technique. Heliyon 2020, 6, e05052. [Google Scholar] [CrossRef]
  40. Matin, A.; Zare, S.; Ghotbi-Ravandi, M.; Jahani, Y. Prioritizing and weighting determinants of workers’ heat stress control using an analytical network process (ANP) a field study. Urban Clim. 2020, 31, 100587. [Google Scholar] [CrossRef]
  41. Saaty, T.L. Decision making with the analytic hierarchy process. Int. J. Serv. Sci. 2008, 1, 83–98. [Google Scholar] [CrossRef] [Green Version]
  42. Nesticò, A.; Elia, C.; Naddeo, V. Sustainability of urban regeneration projects: Novel selection model based on analytic network process and zero-one goal programming. Land Use Policy 2020, 99, 104831. [Google Scholar] [CrossRef]
  43. Ocampo, L.A.; Seva, R.R. Using analytic network process for evaluating mobile text entry methods. Appl. Ergon. 2016, 52, 232–241. [Google Scholar] [CrossRef]
  44. Xu, J.; Li, L.; Ren, M. A hybrid ANP method for evaluation of government data sustainability. Sustainability 2022, 14, 884. [Google Scholar] [CrossRef]
  45. Navarro, I.J.; Martí, J.V.; Yepes, V. Analytic network process-based sustainability life cycle assessment of concrete bridges in coastal regions. Sustainability 2022, 14, 10688. [Google Scholar] [CrossRef]
  46. Pamucar, D.; Gigovic, L.; Bajic, Z.; Janoševic, M. Location selection for wind farms using gis multi-criteria hybrid model: An approach based on fuzzy and rough numbers. Sustainability 2017, 9, 1315. [Google Scholar] [CrossRef] [Green Version]
  47. de Silva, M.C.O.; Vasconcelos, R.S.; Cirilo, J.A. Risk mapping of water supply and sanitary sewage systems in a city in the Brazilian semi-arid region using GIS-MCDA. Water 2022, 14, 3251. [Google Scholar] [CrossRef]
  48. Mousavi, S.M.; Darvishi, G.; Mobarghaee Dinan, N.; Naghibi, S.A. Optimal landfill site selection for solid waste of three municipalities based on boolean and fuzzy methods: A case study in Kermanshah Province, Iran. Land 2022, 11, 1779. [Google Scholar] [CrossRef]
  49. Admasu, S.; Desta, H.; Yeshitela, K.; Argaw, M. Analysis of land suitability for apple-based agroforestry farming in Dire and Legedadi Watersheds of Ethiopia: Implication for ecosystem services. Heliyon 2022, 8, e11217. [Google Scholar] [CrossRef] [PubMed]
  50. Moisa, M.B.; Merga, B.B.; Gabissa, B.T.; Gemeda, D.O. Assessment of land suitability for oilseeds crops (sesame and groundnut) using geospatial techniques: In the case of Diga District, East Wollega Zone, Western Ethiopia. Oil Crop Sci. 2022, 7, 127–134. [Google Scholar] [CrossRef]
  51. Moisa, M.B.; Tufa, C.A.; Gabissa, B.T.; Gurmessa, M.M.; Wedajo, Y.N.; Feyissa, M.E.; Gemeda, D.O. Integration of geospatial technologies with multi-criteria decision analysis for aquaculture land suitability evaluation: The case of Fincha’a River Sub-Basin, Western Ethiopia. J. Agric. Food Res. 2022, 10, 100448. [Google Scholar] [CrossRef]
  52. Aliani, H.; Ghanbari Motlagh, M.; Danesh, G.; Aliani, H. Land suitability analysis for urban development using TOPSIS, WLC and ANP Techniques (Eastern Cities of Gilan-Iran). Arab. J. Geosci. 2021, 14, 1276. [Google Scholar] [CrossRef]
  53. Alkaradaghi, K.; Ali, S.S.; Al-Ansari, N.; Laue, J. Evaluation of land use &amp; land cover change using multi-temporal landsat imagery: A case study Sulaimaniyah Governorate, Iraq. J. Geogr. Inf. Syst. 2018, 10, 247–260. [Google Scholar] [CrossRef] [Green Version]
  54. Widiatmaka; Ambarwulan, W.; Sutandi, A.; Murtilaksono, K.; Munibah, K.; Daras, U. Suitable and available land for cashew (Anacardium occidentale L.) in the island of Lombok, Indonesia. J. Appl. Hortic. 2015, 17, 129–139. [Google Scholar] [CrossRef]
  55. Prasada, I.M.Y.; Priyanto, M.W. Impact of implementation of land protection regulations. Agritech 2019, 22, 140–154. [Google Scholar]
  56. Oktafianti, K.D.; Lanya, I.; Trigunasih, N.M. Mapping of sustainable food agriculture areas in North Kuta and Mengwi based on remote sensing and geographic information systems. J. Agric. Sci. 2021, 11, 176–188. (In Indonesian) [Google Scholar] [CrossRef]
  57. Miswar, D.; Salsabilla, A.; Susanti, E.; Aryati, F. Understanding study of sustainable food agricultural land (LP2B) using spatial approach South Pringsewu District. Int. J. Multicult. Multi-Relig. 2021, 8, 74–86. [Google Scholar] [CrossRef]
  58. Widjayatnika, B.; Baskoro, D.P.T.; Pravitasari, A.E. Land use change and direction of land utilization for agriculture in Penajam Paser Utara Regency, East Kalimantan. J. Reg. Rural Dev. Plan. 2018, 1, 243. [Google Scholar] [CrossRef] [Green Version]
  59. Susilawati, D.M.; Maarif, M.S.; Widiatmaka; Lubis, I. Land suitability and availability evaluation for shallot farming development in Brebes Regency, Central Java. J. Nat. Resour. Environ. Manag. 2019, 9, 507–526. [Google Scholar] [CrossRef]
  60. Alturk, B.; Kurc, H.C.; Konukcu, F.; Kocaman, I. Multi-criteria land use suitability analysis for the spatial distribution of cattle farming under land use change modeling scenarios in Thrace Region, Turkey. Comput. Electron. Agric. 2022, 198, 107063. [Google Scholar] [CrossRef]
  61. Bamrungkhul, S.; Tanaka, T. The Assessment of land suitability for urban development in the anticipated rapid urbanization area from the belt and road initiative: A case study of Nong Khai City, Thailand. Sustain. Cities Soc. 2022, 83, 103988. [Google Scholar] [CrossRef]
  62. Nath, A.J.; Kumar, R.; Devi, N.B.; Rocky, P.; Giri, K.; Sahoo, U.K.; Bajpai, R.K.; Sahu, N.; Pandey, R. Agroforestry land suitability analysis in the Eastern Indian Himalayan Region. Environ. Chall. 2021, 4, 100199. [Google Scholar] [CrossRef]
  63. Eswaran, H.; Reich, P.F.; Padmanabhan, E. World soil resources opportunities and challenges. In World Soil Resources and Food Security; Rattan, L., Stewart, B.A., Eds.; CRC Press: Boca Raton, FL, USA, 2011; Volume 1, pp. 29–52. [Google Scholar]
  64. Hardjowigeno, S. Ilmu Tanah; Jakarta Akademika Pressindo: Jakarta, Indonesia, 2007. [Google Scholar]
  65. Osly, P.J. Planning Model for Sustainable Agriculture Plantation (Case Study: East Seram Regency, Maluku Province). Ph.D. Thesis, IPB University, Bogor Regency, Indonesia, 2015. [Google Scholar]
  66. Pramuhadi, G. Climatic factors in dry land sugarcane cultivation. J. Pangan 2016, 19, 331–344. [Google Scholar]
  67. Halbac-Cotoara-Zamfir, R.; Farias-Ramirez, A.J.; de Miranda, J.H.; Moreno-Pizani, M.A.; Duarte, S.N.; Paredes-Trejo, F.J.; Salvati, L.; Halbac-Cotoara-Zamfir, C. Simulation of subsurface drainage in the sugarcane crop under different spacing and drain depths. Land 2022, 11, 626. [Google Scholar] [CrossRef]
  68. Pratamaningsih, M.M.; Mulyani, A. Characteristics and land potential for sugarcane development in Blitar Regency, East Java Province. IOP Conf. Ser. Earth Environ. Sci. 2021, 648, 012007. [Google Scholar] [CrossRef]
  69. Yunan, D.; Xianliang, Q.; Xiaochen, W. Study on cation exchange capacity of agricultural soils. IOP Conf. Ser. Mater. Sci. Eng. 2018, 392, 042039. [Google Scholar] [CrossRef]
  70. Sanches, G.M.; Graziano Magalhães, P.S.; Junqueira Franco, H.C. Site-specific assessment of spatial and temporal variability of sugarcane yield related to soil attributes. Geoderma 2019, 334, 90–98. [Google Scholar] [CrossRef]
  71. Purnamasari, L.; Rostaman, T.; Widowati, L.R.; Anggria, L. Comparison of appropriate cation exchange capacity (cec) extraction methods for soils from several regions of Indonesia. IOP Conf. Ser. Earth Environ. Sci. 2021, 648, 012209. [Google Scholar] [CrossRef]
  72. Ayub, S.; Huang, S.; Hassan Raza, S. Effect of climatic vulnerabilities on sugarcane production in Punjab, Sindh and KPK: A case study from Pakistan. J. Agric. Res. 2021, 2021, 305–312. [Google Scholar]
  73. Chandiposha, M. Potential impact of climate change in sugarcane and mitigation strategies in Zimbabwe. Afr. J. Agric. Res. 2013, 8, 2814–2818. [Google Scholar] [CrossRef]
  74. Hartatik, E.S. The development of agroindustry and transportational network in the Central Java during Dutch colonization. Paramitha 2014, 24, 1–16. [Google Scholar]
Figure 1. Study area map.
Sustainability 15 05390 g001
Figure 2. Criteria on land parameters for land suitability analysis.
Sustainability 15 05390 g002
Figure 3. Criteria on climate parameters for land suitability analysis.
Sustainability 15 05390 g003
Figure 4. Criteria on topographic parameters for land suitability analysis.
Sustainability 15 05390 g004
Figure 5. Criteria on land management parameters for land suitability analysis.
Sustainability 15 05390 g005
Figure 6. Distribution of land suitability classes for sugarcane in Lamongan Regency.
Sustainability 15 05390 g006
Figure 7. Distribution of available land for sugarcane in Lamongan Regency.
Sustainability 15 05390 g007
Figure 8. Distribution of possible sugarcane plantations expansion areas in Lamongan Regency.
Sustainability 15 05390 g008
Figure 9. Ranking of the possible land area for sugarcane plantations expansion in Lamongan Regency based on sub-district.
Sustainability 15 05390 g009
Table 1. Pairwise comparison matrix results based on all expert opinions.
12345678910111213WeightRank
11.000.241.531.630.821.850.870.860.181.110.773.751.260.0628
24.171.001.000.930.442.042.835.350.692.075.924.244.900.1342
30.651.001.001.000.330.521.411.490.380.410.895.431.030.05511
40.611.081.001.001.001.082.241.411.391.300.974.380.290.0864
51.222.273.031.001.002.832.832.002.002.003.7432.865.490.1811
60.540.491.920.930.351.001.081.000.912.000.886.004.000.0705
71.150.350.710.450.350.931.002.120.352.702.006.574.380.0696
81.160.190.670.710.501.000.471.000.580.920.7110.257.750.0619
95.561.452.630.720.501.102.861.721.003.401.0014.009.170.1333
100.900.482.440.720.340.400.361.090.291.001.837.250.710.0627
111.300.171.121.030.271.140.501.411.000.541.004.070.470.05610
120.270.240.180.230.030.170.150.100.070.140.251.000.410.01113
130.790.200.970.300.060.250.230.130.110.140.402.441.000.02112
Information: 1. Soil Type. 2. Cation Exchange Capacity and Base Saturation. 3. Soil pH. 4. Soil Depth. 5. Soil Drainage. 6. Land Capability. 7. Slope. 8. Elevation. 9. Rainfall. 10. Temperature. 11. Land Use. 12. Distance to Road. 13. Distance to Sugar Factory.
Table 2. Score of each criterion for each parameter.
ParameterCriteriaSub-CriteriaScore
Land
a.
Soil Type
Mollisol10
Alfisol10
Inceptisol8
Entisol6
Vertisol6
b.
Cation Exchange Capacity (cmol), Base Saturation (%)
25–40, 61–8010
17–24, 36–608
c.
pH
6.6–7.510
5.6–6.58
d.
Soil Depth (cm)
76–10010
51–758
25–506
<250
e.
Drainage
Class 38
Class 46
Class 64
f.
Land Capability
Class II8
Class III6
Class IV4
Class VI0
Class VIII0
Topography
a.
Slope (%)
0–310
3–88
8–156
15–254
25–402
b.
Elevation (m)
<60010
Climate
a.
Rainfall (mm)
1300–150010
2500–30006
b.
Average Temperature (°C)
26–2810
29–3010
Land Management
a.
Land Use/Land Cover
Sugarcane Plantation10
Field/moor10
Ricefield10
Forest8
Shrubs6
Open Land4
Fishpond0
Water Body0
Built-Up Area0
b.
Distance to Road (m)
0–100010
1001–20008
2001–30006
c.
Distance to Sugar Factory (km)
0–1510
16–308
31–456
46–604
Table 3. Area and percentage of each class of land suitability for sugarcane plantations in Lamongan Regency.
Land Suitability ClassArea (ha)Percentage (%)
S1 (Highly Suitable)32,198.8618.30
S2 (Moderately Suitable)103,616.7358.88
S3 (Marginally Suitable)15,916.979.04
N (Not Suitable)24,252.8313.78
Total175,985.39100.00
Table 4. Area and percentage of possible sugarcane plantations expansion areas in Lamongan Regency.
Possible Area ClassArea (ha)Percentage (%)
PA1 (Possible Area 1)9413.9128.92
PA2 (Possible Area 2)21,376.3965.67
PA3 (Possible Area 3)1762.075.41
Total32,552.37100.00
Disclaimer/Publisher’s Note: The statements, opinions and data contained in all publications are solely those of the individual author(s) and contributor(s) and not of MDPI and/or the editor(s). MDPI and/or the editor(s) disclaim responsibility for any injury to people or property resulting from any ideas, methods, instructions or products referred to in the content.

