1. Introduction
Land use structure optimization research, as an integral part of global environmental change and development sustainability research [
1,
2,
3], affects natural and social systems [
4]. Considering the natural ecological change process, changes in land use affect soil [
5], hydrology [
6], climates [
7], and ecosystems [
6]. Different types of land rely on different economic industrial structures for the allocation of land resource structures, and economic factors affect the evolution of land use [
8]. As the carrier of carbon emissions [
9], the carbon cycle in the environment is changed due to changes in land use structure [
10]. Direct carbon emissions from land use refer to carbon emissions generated by human land use for the sake of a productive life and the transformation of the land use structure [
11]. Unreasonable land use weakens the carbon sequestration capacity of land ecosystems, and the greater amount of carbon released into the atmosphere leads to environmental degradation [
12]. Land use optimization research should consider resources, the environment, the economy, and ecology due to the complex interaction between land use, ecosystems, and the social economy. By taking the above factors as constraints or a decision making basis for land use spatial optimization, one can promote sustainable land use.
Land use structure optimization is an important tool used to achieve the sustainable development of land resources [
13]. It refers to the optimization of the quantity and spatial structure, such as the optimization and forecasting of the land use quantity and structure with linear programming [
14], grey prediction model and system dynamics [
15], and the methods reported in [
16]. Moreover, a spatial optimization model of land use is established by combining simulated annealing [
17], genetic algorithms [
18], particle swarm optimization [
19], and geographic information systems (GIS). Huang [
20], Zhang [
21], and Liu [
22] optimized and predicted land use space, combining a spatial optimization model and multi-objective algorithm by coupling multi-objective linear optimization with the CA-Markov model, the landscape pattern with the CLUE-S model, and system dynamics (SD) with future land use simulation models (FLUS).
Today, researchers pay more attention to land use optimization simulations based on specific objectives, such as urban low-carbon development [
23,
24], the promotion of urban development and ecological protection [
25], and the balance between ecological and economic development [
26,
27]. However, there are few studies oriented towards land use policy, focusing on analyzing land use optimization from the perspectives of ecology, the economy, and low carbon. Based on the above research, this work optimized multi-objective land use space by coupling with the GMOP-PLUS model, in which the patch-generating land use simulation (PLUS) model was improved in comparison to the cellular automata (CA) model. The transition analysis strategy (TAS) and pattern analysis strategy (PAS) were applied to the original model to reveal the driving factors of land use changes, which were used to simulate the patch evolution of multiple land uses across multiple spaces and time [
28].
The Beijing–Tianjin–Hebei region is the “third growth pole” of China’s economy after the Pearl River Delta and the Yangtze River Delta, which is the site for the mission of building China’s Innovation-Driven New Engine and Ecological Restoration and Environmental Improvement Demonstration Area. Land use problems in the Beijing–Tianjin–Hebei region have gradually become prominent. Firstly, the pressures on land for food production and economic construction have become worse. This region faces great pressure on food production, with 2.3% of the country’s land area accommodating around 8% of the country’s population. The apparent uneven quality of cultivated land in the region is affected by topography, hydrology, and other factors leading to unbalanced economic development. The central and southern plains of the Beijing–Tianjin–Hebei region show a prominent land use contradiction, because they hold both the grain-producing areas and areas of economic construction.
Secondly, the degree of land use development in Beijing, Tianjin, and Hebei is different from region to region. For a virtuous land use cycle, it is beneficial to have a structure that can be reasonably adjusted considering different land use development patterns exacerbated by regional socioeconomic development. Thirdly, ecological land becomes largely occupied as the society and economy grow rapidly, which results in insufficient reserve land resources and limited development space. Therefore, it is urgent to explore a scientific land use plan to realize the coordinated development of social resources and natural resources in the region. The land use problems in the Beijing–Tianjin–Hebei region are representative in China. The study of this region aims to understand the changing trends of different land use scenarios influenced by human society. It can enlighten and enable us to formulate effective land use management strategies for this region and other similar regions and provides a basis for land use optimization.
The following are the research objectives of this work: (1) First, the multiple land use optimization goals of low-carbon, ecological, and economic coordinated development are set. This work realizes the quantitative and spatial optimization simulation of land use in the study area by setting different land use optimization scenarios. (2) The economic benefits and ecological benefits of, and carbon emissions from, land use in 2030 are compared between different scenarios. The grey multi-objective optimization (GMOP) model is used to set the optimization goals, and different scenarios are created using the PLUS model to optimize land use in the study area. This work will be informative for future land use planning and policy formulation in the Beijing–Tianjin–Hebei region and help to achieve sustainable development.
2. Methods and Data Collection
2.1. Study Area
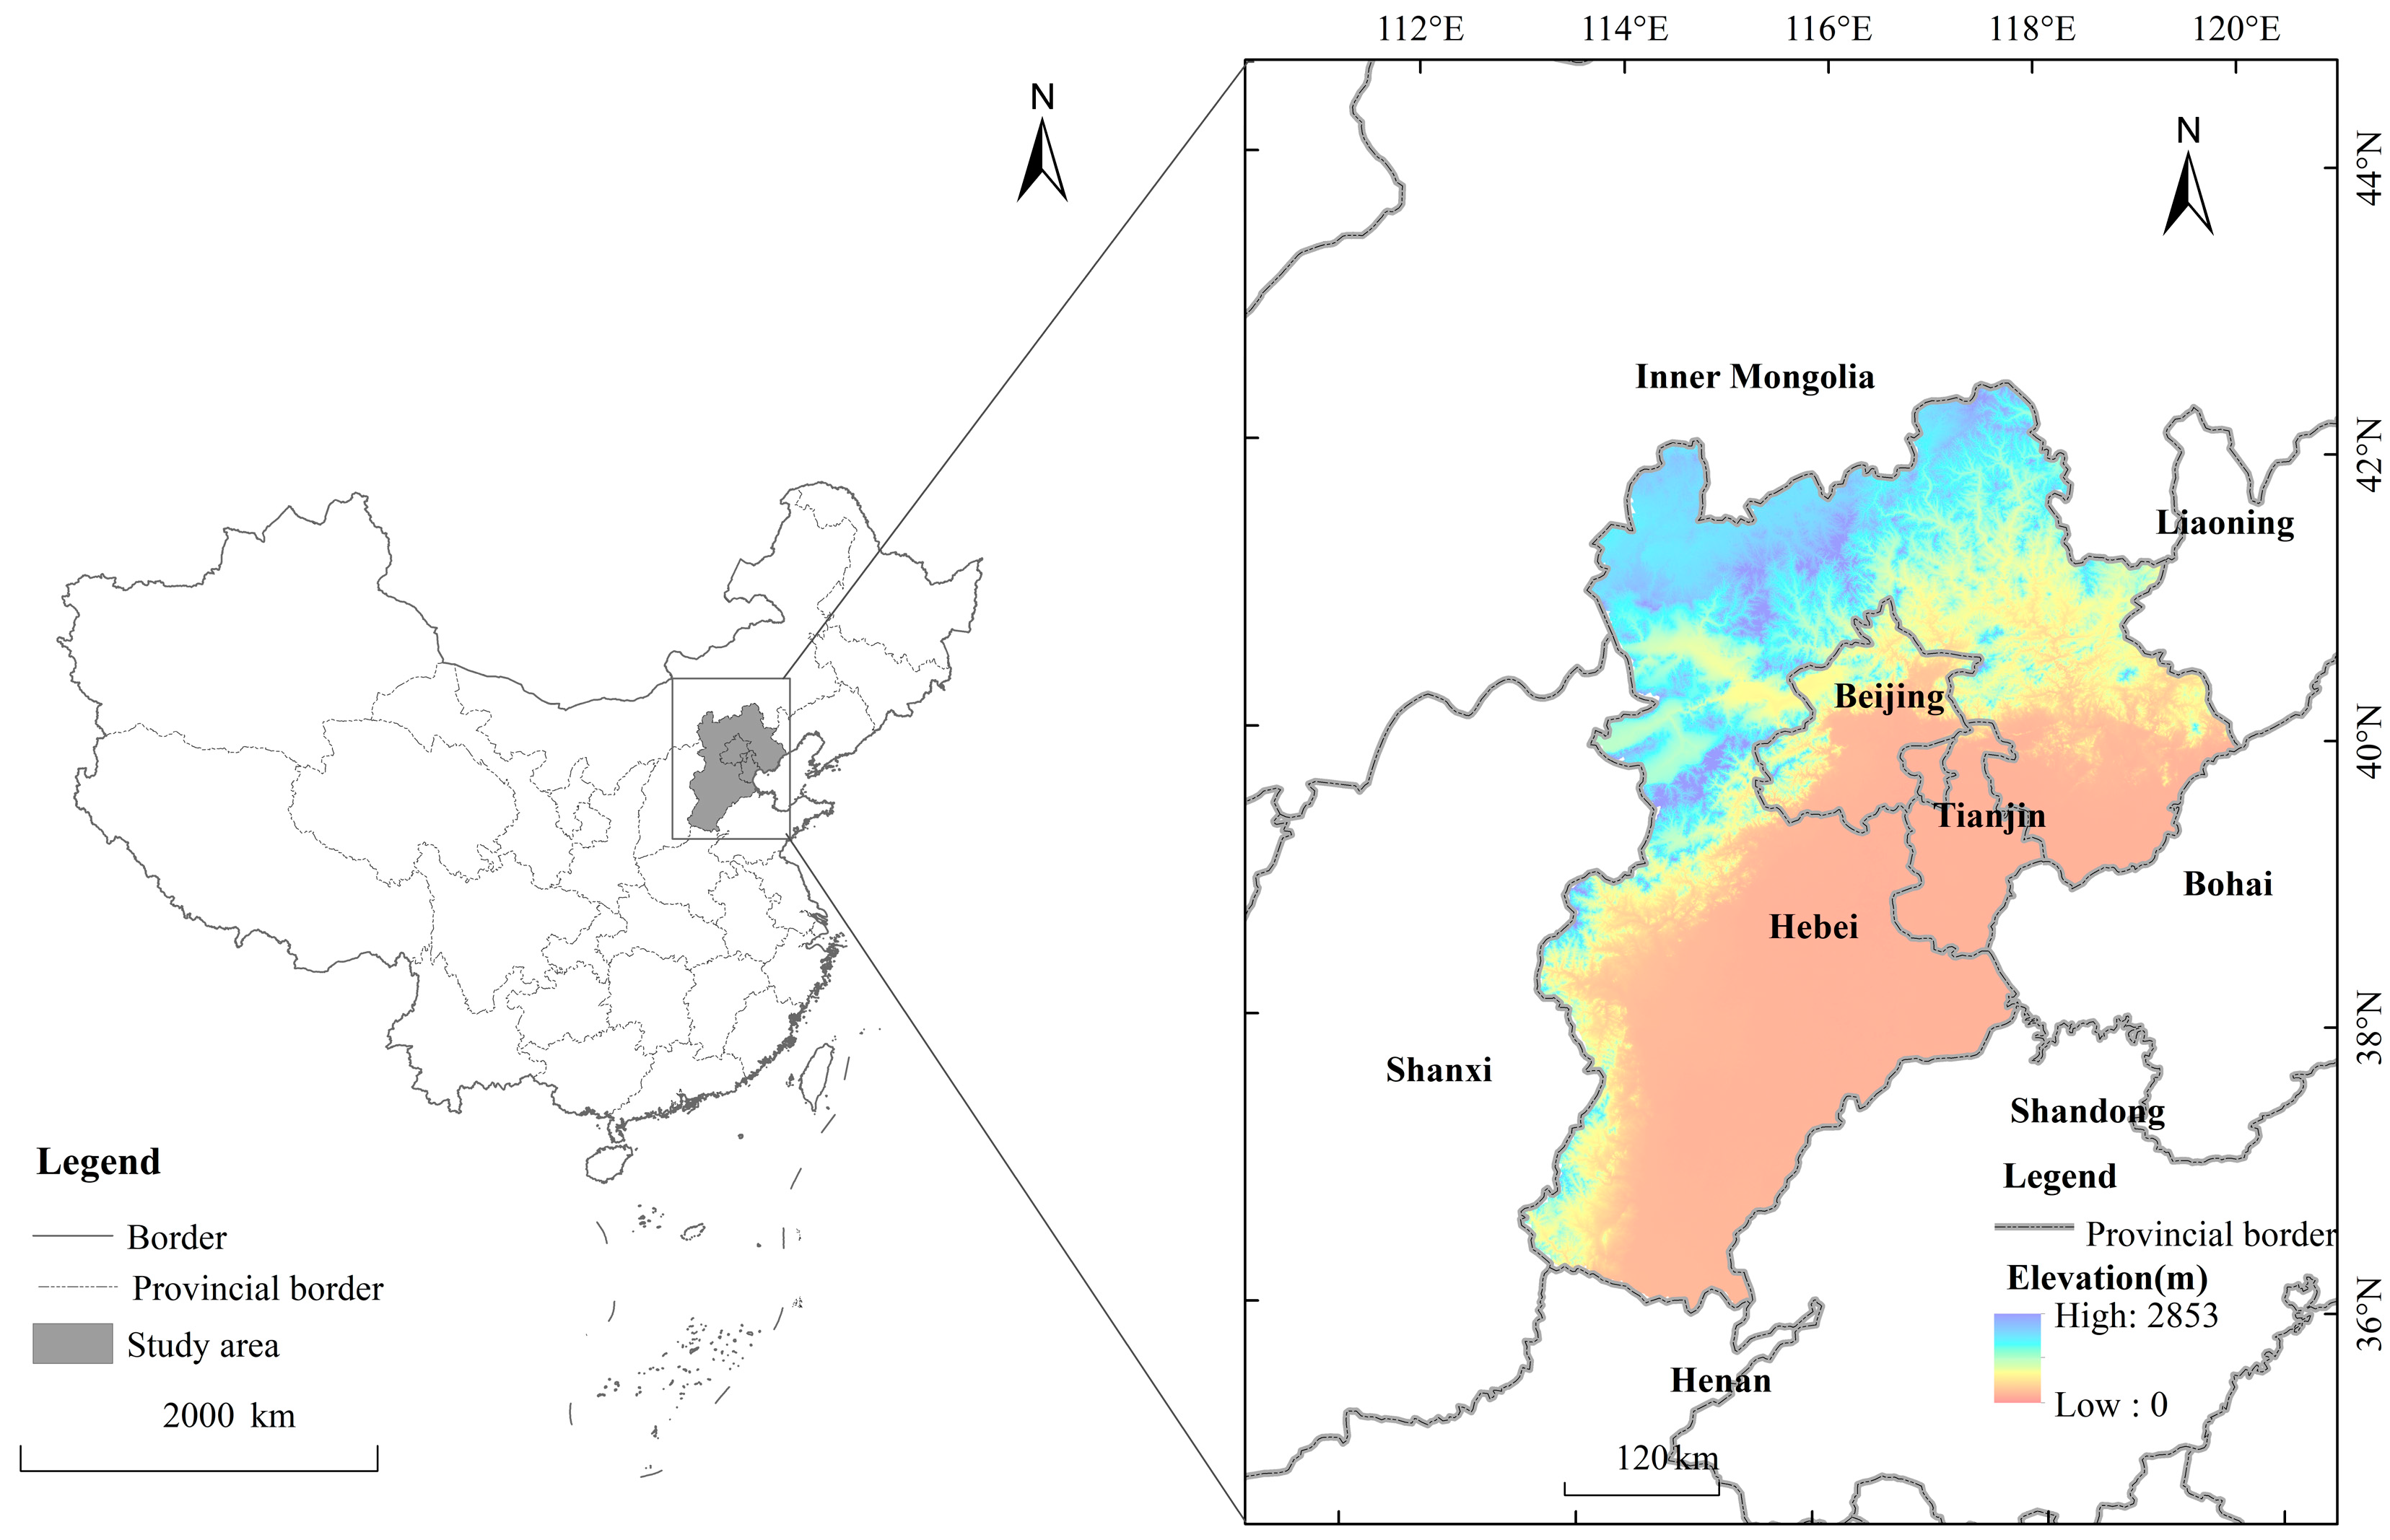
The Beijing–Tianjin–Hebei region includes 11 cities in Hebei Province, Beijing, and Tianjin (See
Figure 1). Located in the north of the North China Plain, the third step of China’s topography, it is bordered by the Yanshan Mountain Range in the north, the Bohai Sea in the east, the rest of the North China Plain in the south, and the Taihang Mountain Range in the west. The terrain, with a total land area of about 218,000 km
2, is complex and diverse, mainly including plains, mountains, hills, plateaus, and basins. The average altitude of the Beijing–Tianjin–Hebei region is about 1500 m. Its overall terrain is generally high in the northwest and low in the southeast, where the Yanshan–Taihangshan cordillera gradually transitions to the plains in the southeast.
The region’s gross domestic product (GDP) increased rapidly from CNY 3979.84 to 8090.08 billion from 2010 to 2020, of which Beijing, Tianjin, and Hebei accounted for 37.84, 17.41, and 44.75%, respectively, in 2020. The change was less than 1% compared with 2010. However, the three provinces’ area ratios accounted for 7.56, 5.51, and 86.93%, respectively, which reflects the long-term uneven development of the region. Moreover, the total energy consumption increased from 391,357,700 to 477.52 million tons (converted into standard coal), of which Hebei’s growth accounted for 76.39%, while the carbon emissions increased with primary energy consumption. Meanwhile, farmland decreased by 0.40 million hm2; construction land increased by 0.19 million hm2; and forest land and grassland changed little. The increased carbon emissions from human activities are not easily absorbed. Therefore, scientific and rational land use planning is urgently needed to promote regional ecological security, the economy, and the sustainable use of land resources. The Guiding Opinions of the State Council on Accelerating the Establishment and Improvement of a Green and Low-Carbon Circular Development Economic System was issued on 22 February 2021. Later, Hebei, Tianjin, and Beijing enacted implementation plans based on the current reality. This plan, incorporating carbon peaking and carbon neutrality into the overall layout of socio-economic development and the construction of the Ministry of Ecology, proposes the implementation of green and low-carbon requirements for territorial spatial planning. Therefore, 2030 was set as the target year for peak carbon emissions.
2.2. Data Sources and Processing
The dataset of this work includes the following aspects:
(1) Triple-phase land use raster data with a spatial resolution of 30 m for 2000, 2010, and 2020 were derived from the Data Center for Resources and Environmental Sciences and the Chinese Academy of Science.
(2) The spatial resolution of the precipitation data, which were derived from the National Tibetan Plateau Scientific Data Center, was 1 km. Since the precipitation data were gathered monthly, the raster data for 2010 and 2020 were accumulated monthly.
(3) The spatial resolution of the digital elevation model (DEM) grid data, derived from the geospatial data cloud (
http://www.gscloud.cn accessed on 5 August 2021), was 30 m.
(4) The socio-economic data included the population and GDP (per capita), with a spatial resolution of 1 km for the raster data, which came from the Sciences Resource and Environment Data Center of the Chinese Academy. The vector dataset for evaluating the distances from roads and railways was derived from Open Street Map (
http://www.openstreetmap.org accessed on 5 August 2021), in which the roads are divided into national trunk highways, motorways, and primary, secondary, and tertiary roads. Additionally, social driving factors were simulated. The urban nighttime light data with a spatial resolution of 1 km for 2010 and 2020 were derived from the China Research Data Service Platform (
https://www.cnrds.com accessed on 5 August 2021).
(5) The statistical data included the total population; the annual output and sown area of rice, corn, and wheat; the second and third output values; and the agriculture, forestry, animal husbandry, and fishery output values for Beijing, Tianjin, and Hebei. The above data were derived from the Hebei Statistical Yearbook (2000–2020), Tianjin Statistical Yearbook (2000–2020), and Beijing Statistical Yearbook (2000–2020). Moreover, the energy consumption was derived from the China Energy Statistics Yearbook (2000–2020), and food crops prices were derived from the National Agricultural Product Cost–Benefit Information Compilation (2000–2020). This work adopted ArcGis10.5 to unify all the raster data to a spatial resolution of 300 × 300 m, and the data were coordinated with the WGS-1984-UTM-Zone-50N projected coordinate system to render them applicable to the PLUS model.
2.3. Research Framework
This work includes four parts, as follows: (1) calculations of the ecological and economic benefits and the carbon emission coefficients of six land types; (2) land use structure optimization based on GMOP; (3) spatial optimization of land use based on PLUS; and (4) analysis of the optimized land use results (see
Figure 2).
2.4. GMOP Model Specification
GMOP was developed by combining the grey model and grey prediction theory with multi-objective programming [
29]. We set objective optimization functions and constraints for the model based on policymakers’ expectations (such as the protection of ecological functions) to solve the problem of land use optimization. The model construction included the selection of decision variables, construction of the target system, determination of the constraint conditions, and selection of the solution method.
This work took the areas of six land use types as variables and set the land development target system based on the ecological and economic benefits and carbon emissions. Firstly, the ecological benefits, characterized by the value of ecosystem services, the economic benefits, characterized by the output value, the carbon emission coefficient, and the estimation method were used to calculate the carbon emissions. Secondly, the corresponding ecological and economic benefits and carbon emission target factors were substituted to obtain the objective function. Then, the optimization objective functions of ecology (maximum ecological benefit), economy (maximum economic benefit), and sustainable development were set according to the optimized scenario. Finally, the areas of six land types were obtained by LINGO18.0, combined with the constraints.
2.4.1. Target System Construction
Considering the current situation and development needs, this work proposes a land use optimization goal based on the coordinated development of low carbon, ecology, and economy. The goal was to comply with the trend of low-carbon city development. The following objective functions were established based on three aspects, namely, ecological and economic benefits and carbon emissions, as follows:
(1) Carbon emission target coefficient
Carbon emissions from cultivated land, forest land, grassland, the water area, and unutilized land were calculated using the following direct carbon emission coefficient:
where
Ci is the carbon emissions for different land use types,
Si is the area, and
Ki is the carbon emission coefficient.
This work set the carbon emission coefficients of cultivated land, forest land, grassland, the water area, and unutilized land as follows [
30,
31]: The carbon emission and absorption coefficients of cultivated land were the same as those of crops, which were 0.504 and 0.007 t/hm
2, respectively. The difference between them was the net carbon emission coefficient of 0.479 t/hm
2. The carbon emission coefficients of forest land and grassland were −0.581 and −0.021 t/hm
2, respectively. The unutilized lands was mostly grassland, saline-alkali land, marshland, foreshore, sand, and naked land, with large seasonal changes and a weak carbon absorption capacity. Therefore, its carbon absorption was not considered, and the carbon emission coefficient was −0.005 t/hm
2.
The construction land carbon emissions increased significantly with economic development, which could be estimated by indirect carbon emission estimation. The carbon emissions per unit area from 2000 to 2020 were calculated based on the energy consumption and land use area, while the emissions in 2030 were predicted using the grey prediction model, with the coefficient of 313.03 t/hm
2:
where
E is the construction land carbon emissions;
Eti is the energy carbon emissions;
Eni is the energy consumption;
θi is the coefficient of energy conversion to standard coal; and
fi is the energy carbon emission coefficient. The energy consumption for thermal power generation and heating is included in other energy statistics. Additionally, the average coal carbon emission coefficient is the coal carbon emission coefficient. The energy carbon emission and standard coal conversion coefficients (see
Table 1) refer to the 2006 IPCC Guidelines for National Greenhouse Gas Inventories and China Energy Statistics Yearbook (2000–2020).
(2) Ecological benefit target coefficient
Land use optimization considers ecological optimization; thus, the ecological benefit value of each land type is calculated using the ecosystem service value. Referring to the equivalent factors table of ecosystem service values (compiled by Xie et al. in 2005) [
32] applicable to China, this work established a similar table applicable to the Beijing–Tianjin–Hebei region (see
Table 2). The economic value of the ecosystem service value’s equivalent factor is 1/7 [
33] of the national average value of grain per unit area for the given year:
where
Ea is the national average value of grain per unit area (yuan/hm
2);
n is the crop species number;
i is the crop type (main food crops: rice, wheat, and maize);
mi is the crop planting area (hm
2);
pi is the national crop average unit price (yuan/kg);
qi is the crop yield per unit area (kg/hm
2); and
M is the total area for crop planting (hm
2).
The equivalent factor’s economic value for 2020 (CNY 2479.75/hm
2) was obtained by calculating the data from 2000 to 2020, while the value of 2030 (CNY 4306.90/hm
2) was predicted using the GM (1,1) model.
Table 3 shows the ecological value target coefficient.
(3) Economic benefit target coefficient
The output values of agriculture, forestry, animal husbandry, and fishery can be used as the output benefits of cultivated land, forest land, grassland, and waters, combined with their economic data. Meanwhile, the economic benefits of construction land are obtained by adding the output values of the second and third industries. Additionally, the economic benefits of unutilized land can be set to CNY 1/hm
2, according to previous studies [
34]. Then, the economic benefit coefficient of each land type from 2000 to 2020 is calculated, and the coefficients of 2030 are obtained using the GM (1,1) model (see
Table 3).
2.4.2. GMOP Model Land Structure Optimization
Firstly, the variables and constraints were set according to the land use, socio-economic conditions, planning requirements, and future development trends over many years. Then, the objective function was determined according to the need for different development benefits (see
Table 4). Finally, LINGO18.0 was used to calculate the optimized land use structure of Beijing–Tianjin–Hebei for 2030. (LINGO, an abbreviation of linear interactive and general optimizer, is used to solve interactive linear, nonlinear, and integer optimizations).
Among the objectives of ecological optimization, the ecosystem service value of the land resources was the largest, and the ecological benefits were maximized. When the economic benefit of each land output was the largest, the land use economic development was the best according to the economic optimization goal. The three optimization objective functions, including carbon emission minimization, economic benefit maximization, and ecological benefit maximization, were sorted into a combined function according to the sustainable development optimization goal. The research of Liu et al. [
35] on low-carbon, economy-oriented land use structure optimization demonstrated that when the weights of the three objective functions of carbon emissions, ecological benefits, and economic benefits are 0.2, 0.1, and 0.7, respectively, the scheme focuses on economic development and imposes less constraints on increased carbon emissions. When the
a,
b, and
c values are 0.3, 0.2, and 0.5, respectively, the carbon emission constraint of this scheme is medium. When the
a,
b, and
c values are 0.7, 0.1, and 0.2, respectively, the scheme imposes the greatest constraints on carbon emissions, with the optimization results having greater carbon emission reduction effects. This work set the target weights according to the third scheme based on the vision of carbon neutrality.
The constraints of each variable were established (see
Table 5) based on the National Land Use Planning Outline (2006–2020), Hebei Province Land and Space Planning (2021–2035), and Beijing–Tianjin–Hebei Collaborative Development Planning Outline.
2.5. Land Use Optimization Based on the PLUS Model
The PLUS model is new and based on cellular automata [
38]. It applies a new land use expansion analysis strategy in contrast to other land use simulations, which leads to a better understanding of the land use change mechanism. This new model can use the mechanism of multi-type land use patch change to simulate the patch-level evolution of multiple land types.
In this study, 2020 was taken as the base year, and 2030 was taken as the target year. The following steps were performed when the PLUS model was used to stimulate a multi-type land use scenario in the Beijing–Tianjin–Hebei region: (1) Land expansion, based on information extracted from the land use data from 2010 to 2020, were combined with the natural and social conditions to select the appropriate driving factors of land use change. Moreover, land expansion analysis strategy (LEAS) rules were used to mine the incentives for change and the probability of each type of development. (2) The weight, patch formation threshold, and land use demand of the six land types were set according to different scenarios after each development probability was incorporated into CA based on the multi-type random patch seeds (CARS) model. The land use demand in the business-as-usual scenario was forecasted using the Markov model, while the rest were forecasted using the GMOP model.
2.5.1. PLUS Model Setting and Verification
The natural environment and policies, which are affected by human social activities and regional socio-economic development, can promote land use change. Therefore, 11 driving factors were selected from the above-mentioned aspects (
Figure 3), including elevation, slope, annual precipitation, night light, population density, GDP, and distances to the railways, motorways, and primary, secondary, and tertiary roads, to explore the development probability of each category [
28,
39].
The model adopted historical data on land use and the driving factors from 2010 to 2020. Then, the spatial pattern was simulated, and the simulation results were verified based on actual land use data for 2020. The Kappa coefficient was 0.8828, while the simulation accuracy was 91.81%. The results were highly reliable, indicating that the PLUS software was suitable for the multi-objective programming of land use allocation.
2.5.2. Development Scenario Setting
This work aimed to realize the optimization, as proposed earlier based on the GMOP model, through the PLUS model after considering the current land use situation and regional development needs. Therefore, four land use change scenarios corresponding to the optimization goals were established, namely, business-as-usual, economic development, ecological protection, and sustainable development scenarios. The number of areas of each land use type in the economic development scenario was calculated using the economic optimization objective function; that in the ecological protection scenario was calculated using the ecological optimization objective function; and that in the sustainable development scenario was calculated using the sustainable development optimization objective function. The principles and objectives for the designed scenarios are as follows:
(1) Business-as-usual (BAU) scenario: The previous trend of land use change continued, and the land demand for 2030 was calculated using the transition probability from 2010 to 2020 with Markov model. The transfer cost and direction were consistent with those for the same period.
(2) Ecological protection (EP) scenario: The scenario reflected the implementation of local government policies to protect forests, grasslands, and water sources; control the growth of cultivated and construction lands; and encourage the policy of restoring farmland to forests, grasslands, or lakes based on the Returning Farmland to Forest Program, the Northeast–Northwest–North China Shelterbelt Program, and the Fourteenth Five-Year Plan for Ecological Protection. Therefore, the transformation rules reduced the probability of the transformation of forest land and grassland into non-ecological land, such as construction land. The water mask, extracted in 2020 on the premise of protecting water sources, was a non-convertible area.
(3) Economic development (ED) scenario: This scenario, based on the policy of the rapid development of urban construction land in the region, gave priority to economic development, with more demand for urban spaces. Combined with previous studies, our findings indicated that cultivated land and grassland were converted into construction land, and the growth rate of ecological land slowed.
(4) Sustainable development (SD) scenario: By weighing multiple scenarios, one can identify a suitable development model for the region. Therefore, this work proposes a sustainable development scenario, which provides a new perspective on multi-objective weighing. By developing a low-carbon economy and establishing green and sustainable land use planning, from the perspective of low-carbon, the construction land expansion speed and the probability of the transformation of land use types into cultivated and construction lands were reduced.
Conversion costs connote the difficulty of switching from the current land use type to the demand type. Different conversion cost matrices were set (see
Table 6) according to the different scenarios described above. The list shows the current land use types, and the rows represent the future types, where 0 means no conversion and 1 means that conversion is permitted.
3. Results
3.1. Analysis of Land Use Scenario Prediction Results
The land use quantities based on different optimization objectives in Beijing, Tianjin, and Hebei for 2030 were obtained using the GMOP model (see
Table 7). Meanwhile, the land use change characteristics in the four different scenarios were calculated (see
Figure 4) by simulating the spatial distribution with the PLUS model.
The quantity and spatial pattern of each land use type in 2030 are quite different from those observed in 2020 according to the various backgrounds (see
Table 7). The land use types observed in the region are mainly cultivated land, forest land, and grassland, with cultivated land accounting for 45.55%. The trends of land use change in the future scenarios are as follows: the BAU scenario continued the trend of cultivated land degradation, with the degradation area reaching 210,307.82 hm
2, which accounted for 3.66% of the total area. Cultivated land was converted into construction land, forest land, and grassland (see
Table 8). An area of 157,245.73 hm
2 was converted into construction land, which accounted for 74.77% of the total degraded area. Therefore, the rapid urbanization process and the implementation of de-farming and reafforestation reduced the amount of cultivated land. This situation is in line with the trend of continuous downward adjustment of cultivated land tenure in the Beijing–Tianjin–Hebei region from 2010 to 2020. On the other hand, the decline in cultivated land in the SD scenario shows a slower trend compared with the BAU one, which ensures the cultivated land quantity.
EP scenario: The area of forest land and water area increased significantly, while that of construction land decreased by 417,459.75 hm2, which accounted for 15.34% of the total area. In total, 7.54% was converted into grassland and 6.36% was converted into a water area. However, the increased area of forest land was mainly transferred from grassland. The spaces of the Bashan Plateau and the Yanshan–Taihang Mountains revealed less arable land and mushrooming ecological land. The construction land shrank inward during the ecological protection period. Moreover, some construction land was vacated and converted into grassland, and shallow mountain grassland was vacated, being converted into forest land, with increased ecological land obtained through the advancement of greening and afforestation ecological projects.
ED scenario: The scale of construction land expanded, while that of cultivated land decreased. In total, 735,163.72 hm2 was converted into construction land, which was 1.03 times the size of the water area in 2020. The areas of forest land, grassland, and the water area increased by 1.13, 1.12, and 19.54%, respectively, and they were transformed from cultivated land. Therefore, urbanization increased the rapid economic development but encroached on the agricultural land. Spatially, the growth of construction land mostly occurred in the central plain area, which indicates that urbanization continued to spread to the central Beijing–Tianjin–Hebei region. However, the central Beijing–Tianjin–Hebei region is mostly a plain area, most of which is agricultural land suitable for agriculture. The encroachment of agricultural land due to urbanization is further evidenced by this trend.
SD scenario: The development of a low-carbon economy and the implementation of ecological projects reduced carbon emissions and optimized economic and ecological benefits. (1) This scenario showed the least reduction in the cultivated land area, which accounted for 2.49% of the total area, while the expansion trend of construction land was similar to that of the BAU. (2) The increased areas of forest land and grassland were the same as those in the ED scenario, while the increased area originated from the transformation of construction land in the SD scenario. The above information shows that the expansion of construction land tended to be stable under the requirement of low-carbon development, and economic development should ensure the quantity of cultivated land and the benefit of an increased ecological land area.
3.2. Comparison of the Results for Different Optimization Scenarios
The comparison of the results of the different scenarios (see
Figure 5) is as follows: The total carbon emissions in the EP scenario amounted to 724.59 million tons, being 20% less than that estimation for the BAU scenario, because the increased forest land area yielded 0.27 million tons of carbon absorption. However, the ecological benefit of the EP scenario only increased by 2.79% compared with that of the BAU scenario, and the ecological benefits of forest land, grassland, and the water area did not increase. Moreover, the reduction in the construction land area led to an 18.94% decline in economic efficiency. The economic benefits provided by construction land outweighed those of the other land types, and its carbon emissions also appear to follow the same trend. The area of construction land should be controlled to reduce carbon emissions, which undermine the economic benefits.
ED scenario: The total carbon emissions and ecological benefits were 1086.32 million tons and CNY 2357.57 billion, respectively. They increased by 19.94% and decreased by 2.23% compared with the BAU scenario, respectively, indicating low ecological benefits. The economic benefit was CNY 16,729.40 billion, being 18.89% higher than that of the BAU scenario, indicating that the maximum economic benefit was achieved. Additionally, the construction land area increased compared with the natural situation, which improved the land economic benefits. Meanwhile, fossil energy combustion and carbon emissions from industrial activities placed pressure on the ecological environment and carbon emissions management, affecting economic development.
SD scenario: The total emissions amounted to 855.97 million tons, being 49.78 million tons less than that of the BAU scenario, with a decrease of 5.5%. The ecological benefit was CNY 2442.69 billion, being CNY 31.31 billion higher than that of BAU scenario, with an increase of 1.29%. The economic benefit was CNY 13,341.74 billion, being CNY 729.02 billion less than that of the BAU scenario, with a decrease of 5.18%. However, it was 1.54 times higher than that in 2020. The carbon emissions reduction was mainly achieved by controlling the construction land area, along with the increase in the ecological land area in the SD scenario. This indicates that construction land can make certain concessions for the purpose of regional ecology protection. A follow-up promotion of land intensification, as well as the adjustment of the industrial structure, could help to meet the need for socio-economic development.
This work explained the relationship between land use structure change, carbon emissions, and ecological and economic benefits by setting different scenarios. Forest land expansion increased, with carbon emission reductions of 0.27 million tons in the EP scenario and 2523.55 tons in the SD scenario compared with the BAU scenario. However, carbon emissions were reduced by 49.77 million tons in the SD scenario, and more than 90% originated from construction land contraction. The construction land included three types of high-carbon-emission land, namely, industrial, construction, and transportation lands, indicating that the limitation of its excessive expansion could control land use carbon emissions.
The reduction in ecological benefits in the ED scenario was due to the degradation of cultivated land (CNY 47.46 billion) and the expansion of construction land (CNY 22.78 billion), while the increase in the EP scenario was due to the increase in the amount of cultivated land (CNY 5.15 billion) and forest land area (CNY 23.15 billion) compared with the BAU scenario. If the same area is increased, the ecological benefit of forest land will be higher than that of cultivated land. Limited by the afforestation project period, the variation in forest land is limited in the short term. However, ecological engineering and cultivated land protection measures need to be implemented in parallel in the long term, and ecological land cannot be developed at the expense of cultivated land.
The economic benefits of cultivated and forest land in the EP scenario increased by CNY 2.65 and 5.93 billion (See
Table 9), respectively, and that of construction land decreased by CNY 2678.81 billion compared with the BAU scenario. Construction land had the greatest impact on economic benefits, but the development plan needs to balance ecology and the economy. The economic efficiency needs to be improved through high-quality regional development rather than blind development.
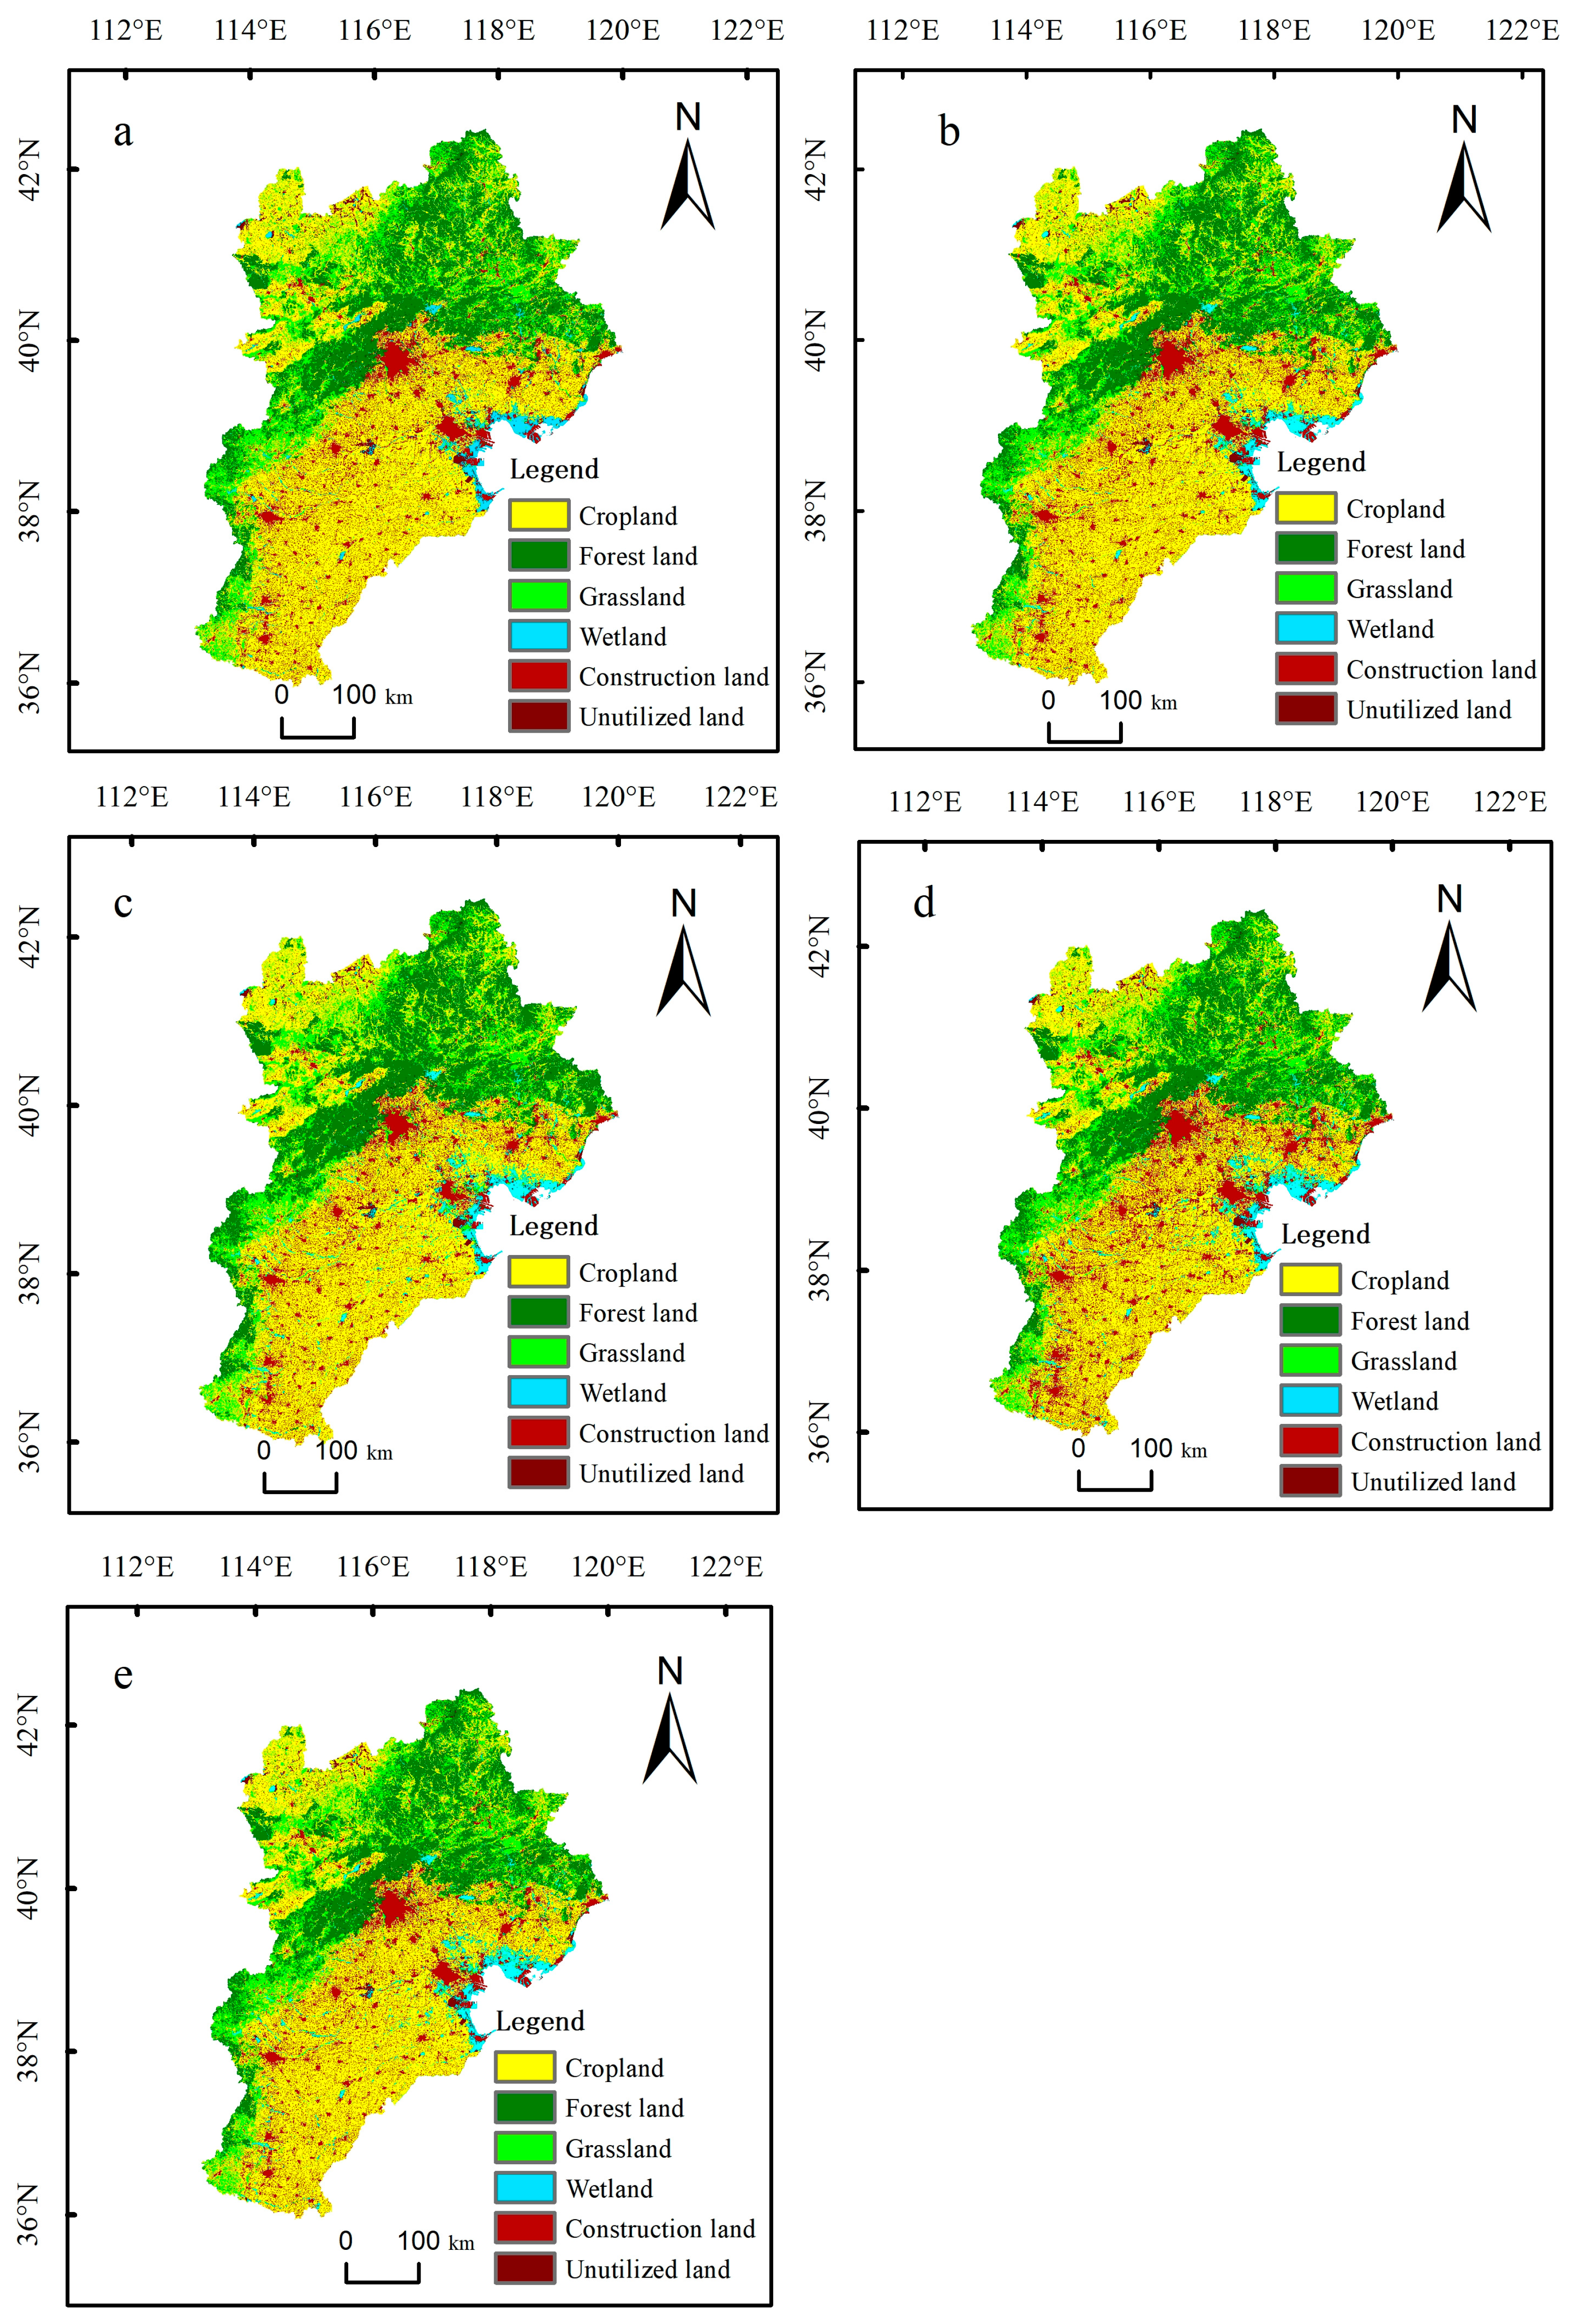
3.3. Spatial Distribution Comparison of Different Optimization Scenarios
Forest land, in the EP scenario, grows along the Yanshan–Taihang Mountains and results from the extensive expansion of forest land and the fragmentation of grassland. Additionally, grassland is degraded from the periphery of the non-ecological land, such as construction land, compared to the land use structure in 2020 (see
Figure 6b). Therefore, a policy of natural afforestation should be introduced so as to encourage farmers to cultivate forests in mountainous areas. Moreover, the degradation of construction land into grassland needs to incorporate the recultivation of idle, abandoned rural construction land into forest and grasslands.
Carbon emissions in the EP scenario were reduced compared with the BAU scenario, but the government should invest more manpower and material resources in these efforts. However, the notion of sacrificing the economy to seek ecological stability is not ideal. Ecological protection in real planning scenarios should be coordinated with economic construction. Sacrificing construction land for ecological development is not desirable in the Beijing–Tianjin–Hebei economic environment, because ecological protection cannot achieve a win–win situation between low-carbon ecology and urban development.
The expanded patches of construction land in the ED scenario are scattered in the plain area compared with the land use structure in 2020 (see
Figure 6c). The construction land extends outward, encroaching on the surrounding cultivated land, indicating that the development and construction needs are significant. The water expansion patches are distributed in the coastal and central areas, indicating that wetland parks have been built in the coastal port zones of Tianjin and Tangshan. The excavation and dredging of watercourses have increased the number of water areas. Therefore, the central waters of Beijing, Tianjin, and Hebei have promoted eco-hydraulic engineering through the construction of a water conservancy infrastructure network system to form a water scale system. The construction land scale is the largest, and the cultivated land scale is the smallest, with small changes in ecological lands such as forest land and grassland. Increased water areas with low ecological benefits reduce land allocation with large ecological benefits, which hinders green ecology and low-carbon development.
The forest and grassland expansion areas in the SD scenario are in the northern mountains and northwest, respectively, while the water expansion mode is similar to that of the ED scenario compared with the land use structure in 2020 (see
Figure 6d). Therefore, constraints and planning indicators are set for the expansion of construction from the planning governance level. The green space and water network systems have been planned and improved in the existing construction land so that the ecological lands, such as forest land, grassland, and water, can grow synchronously in the form of facilities supporting construction land. Moreover, current ecological projects such as the construction of the Three-North Shelterbelt, the Tai hang Mountain greening project, and de-farming and reafforestation should continue to be implemented in the northwest, and ecological construction should be steadily promoted.
The SD scenario is a development model in which urban construction boundaries tend to stabilize within elastic limits. The transformation of construction land through extensive expansion into land under integrated, efficient use has promoted the economy based on improved land use. The reasonable planning of the ecological land layout and reduction in construction costs for the mutual transformation of various land types can help to achieve low-carbon emission reduction, ensuring the synchronous development of the ecological economy.
4. Discussion
Sustainable development is an economic growth model focusing on long-term development, which refers to the coordinated development of socioeconomic resources and the environment. Sustainable development of land use is a complex issue including the integration of biodiversity conservation, climate change, food security, poverty alleviation, and sustainable energy [
40]. The study of the sustainable development of land use in the Beijing–Tianjin–Hebei region inevitably involves the ecological environment. The existing ecological and environmental problems in the Beijing–Tianjin–Hebei region are closely related to the sustainable development of land use. For example, the Yanshan Mountains in the west and north undergo serious soil erosion every summer, which results in the siltation of reservoirs. Land desertification in northern Hebei has caused wind and sand weather and even sandstorm weather in Beijing and Tianjin. Moreover, the excessive reclamation of land in poverty-affected areas has caused serious damage to the local land and placed the ecological economy in a vicious circle. However, challenges and opportunities arise in parallel. The Outline of the Beijing–Tianjin–Hebei Coordinated Development Plan, approved in 2015, has ushered in a historic opportunity for the development of the Beijing–Tianjin–Hebei region. The “Beijing–Tianjin–Hebei coordinated development” is a regional development strategy implemented by the state, which is conducive to promoting urban agglomerations and their competitiveness. Sustainable land use and the ecological environment are the foundation of regional sustainable development.
Beijing, Tianjin, and Hebei implemented the overall deployment of One Core, Three Axes, Four Zones, and Multiple Nodes [
41]. Geographical and resource advantages promote urbanization, which brings with it greater challenges for the originally fragile ecological environment. This work predicted land use changes and their possible impacts on the ecology and economy of the Beijing–Tianjin–Hebei region based on different prospects and proposed relevant suggestions for upgrading sustainable land use models. This work will be helpful for addressing existing land and ecological environment problems.
The coupled GMOP-PLUS model provides the optimal land use structure, quantity, and space and suitable land use planning for the Beijing–Tianjin–Hebei region in regard to eco-economic benefits and carbon emissions. The coupled GMOP-PLUS model, compared with methods used in previous studies, is oriented towards the value of ecosystem services [
42,
43], and the scenario of ecological optimization and coordinated development of the economy and ecology is selected for fixed development scenarios. The GMOP model can determine the optimal objective function, and the coupled PLUS-GMOP model can provide a scientific reference for coordinated regional eco-economic development. Taking 2030 as the carbon neutrality target, this work evaluated land system carbon emissions in a sustainable development scenario.
Cultivated land degrades and construction land increases in the BAU scenario, which is consistent with the research results of Fu et al. [
44] for Beijing, Tianjin, and Hebei. The expansion of construction land in the ED scenario destroys a large area of cultivated land and contradicts the premise of controlling the increment in the area of construction land in the overall planning of land use.
Yang et al. [
45] proposed converting the occupied cultivated land into ecological land in the BAU scenario. However, ecological land, in the EP scenario, originates from the contraction of construction land, and forest land increases due to grassland conversion. This scenario considers the constraints of cultivated land protection and the population’s food demands on cultivated land conversion. Moreover, the SD scenario explains the urbanization process. The establishment of an ecological economy to jointly promote the goal of limiting the uncontrolled growth of the urban construction space can inhibit the growth of high urban carbon emissions.
The economic and ecological benefits and carbon emissions of Beijing, Tianjin, and Hebei increase by 168.22, 50.56, and 30.84%, respectively, in the BAU scenario compared with those in 2020, respectively. Economic growth will be rapid from 2020 to 2030. However, the EP scenario, unlike that of 2020, shows increases in the economic benefits, ecological benefits, and carbon emissions by 117.40, 54.77, and 4.67%, respectively. Even the most stringent ecological protection scenarios can have economic benefits that are slightly increased under the ecological goals. The economic development goal leads to a large transformation of cultivated land into construction land compared with the ecological optimization goal and the sustainable development goal.
The purposes of the EP and SD scenarios, aiming to simulate the implementation of ecological projects, are as follows: (1) the restoration and construction of ecological resources such as woodlands, grasslands, and waters; (2) the consolidation of the function of the ecological conservation area in the northwest; and (3) increased vegetation productivity to provide more carbon reduction services. These goals are in line with the green transformation of the accelerated development mode based on China’s 14th Five-Year Plan.
It can be naturally concluded from the four scenarios that the lowest carbon emissions or the maximum ecological benefits are not necessarily the best choice based on the comparison of the four scenarios. Only by comprehensively considering the future direction of land use development can land development policies be proposed.
The three proposed optimization scenarios beneficially transform the current situation of land use, but the development characteristics are different, with different emphases. Therefore, future research directions should seek a multi-objective optimization scenario to analyze future land use development and explore universal optimal allocation scenarios of regional land use structures.
The following suggestions are made based on previous research and the results of the current work [
46,
47,
48]:
(1) Flexible planning to optimize the land use layout
Since the planning is conducted under the socio-economic conditions of the time, regional conditions will change significantly over time. Thus, land use planning should be conducted flexibly alongside dynamic monitoring, through which we can adjust the layout of land use according to changes in the external situation in a timely manner. We should strengthen restrictions on the use and development of land resources. The maintenance of scientific agricultural land areas is feasible during the long-term dynamic monitoring of agricultural land in the central and southern areas; however, it is not feasible for promoting the economy at the expense of the former goal.
A blueprint for the expansion of construction land should be written during the development stage. The increment in construction land should be reduced on a year-by-year basis, and urban development boundaries should be limited. Firstly, the new construction land in Beijing, Tianjin, and other megacities should be strictly controlled. Secondly, those in Tangshan, Shijiazhuang, Handan, Baoding, and other large cities should be rationally allocated. Thirdly, the new construction land in other medium-sized cities such as Qinhuangdao and Xingtai should be increased appropriately. As for the eastern areas, they should give full play to their ecological and coastal resource advantages so as to develop the regional economy.
(2) Combining systematization and correlation to highlight functional partitioning
The direction of land use in the Beijing–Tianjin–Hebei region should start with each region’s endowment resources and economic development and view the research area as an organic whole. The three regions of Beijing, Tianjin, and Hebei should be viewed as interlinked so that the resource advantages of each region can be fully exploited and the functional divisions can be highlighted. For example, mountains and hilly area can be found everywhere in the Zhangjiakou and Chengde areas, including the western Baoding, Shijiazhuang, Xingtai, and Handan areas. While the economy is relatively backward, the environment takes the lead, with a heavy proportion of forest land and grassland. The main functional area, here, can be positioned as one of ecological conservation due to the high contribution rate of the ecological benefits.
Cangzhou, Tangshan, and Qinhuangdao are adjacent to Tianjin, together marking the first coastal development area. They border the Bohai Sea and possess convenient transportation conditions with obvious geographical advantages. Resources can be used, and complementary advantages can be achieved, by giving full play to the functional characteristics of each region.
(3) Paying attention to ecological construction and reducing carbon emissions
The ecological land should be retained to the greatest extent in the Taihang Mountains and Yanshan Mountains, because it has the ecological effects and entertainment service functions of regulating the microclimate, purifying the air, and conserving the water sources. The Zhangcheng area in the north of Hebei Province should be noted for its location in the upwind and water areas of Beijing and Tianjin. Its environment needs to be protected; hence, we should handle the relationship between economic construction land and ecological land in a reasonable manner. The Beijing–Tianjin–Hebei region still relies heavily on its secondary industry, meaning that it is the key to reducing carbon emissions. The secondary and tertiary industries’ land use allocation can be handled in a more reasonable manner through the development of high-tech industries, such as the new industrialization base around the Bohai Sea, which relies on its port advantage.
5. Conclusions
This work set multiple quantitative structure optimization objectives using the GMOP model by combining knowledge of land use carbon emissions, the land ecosystem service value, land economic value, and previous research results, including ecological benefit maximization, economic benefit maximization, and sustainable development goals. Four spatial development scenarios, namely the BAU, EP, ED, and SD, were set using the PLUS model. Then, the land use structure and spatial layout of Beijing, Tianjin, and Hebei in 2030 were simulated and optimized on the premise of introducing macro-control constraints. The following conclusions were obtained by comparing the changes in carbon emissions and economic and ecological benefits in each simulation scenario:
(1) The future expansion of construction land will mostly sacrifice cultivated land, especially in the central plains and the periphery of the urban construction land. If ecological protection measures are not taken, there will be little change in ecological lands such as woodland, grassland, and water.
(2) Ecological and economic benefits will increase in 2030, and carbon emissions will increase in tandem with economic development and population growth. The highest ecological benefit, that of the EP scenario, is CNY 2478.70 billion, with the lowest carbon emissions of 7.25 × 10⁸ t, and the economy declines by 18.94% compared with the BAU scenario. The ED scenario has the highest carbon emissions and economic benefits, which are 1.09 × 10⁹ t and CNY 16,729.40 billion, respectively; however, the ecological benefits are low.
(3) Beijing, Tianjin, and Hebei will develop together in the future, and different land plans will lead to greater differences in land use patterns. Therefore, it is necessary to coordinate different land use types so as to comprehensively select appropriate regional land use strategies.


