Article

Impact of Agricultural Land Use Types on Soil Moisture Retention of Loamy Soils

1
Institute of Geography and Earth Sciences, University of Pécs, Ifjúság útja 6., 7624 Pécs, Hungary
2
Doctoral School of Earth Sciences, University of Pécs, Ifjúság útja 6., 7624 Pécs, Hungary
3
Research Centre of the Slovenian Academy of Sciences and Arts, Anton Melik Geographical Institute, Novi trg 2., 1000 Ljubljana, Slovenia
4
South Transdanubian Water Management Directorate, Köztársaság tér 7, 7623 Pécs, Hungary
*
Author to whom correspondence should be addressed.
Sustainability 2023, 15(6), 4925; https://doi.org/10.3390/su15064925
Submission received: 18 January 2023 / Revised: 20 February 2023 / Accepted: 3 March 2023 / Published: 9 March 2023
(This article belongs to the Special Issue Applications of GIS and Remote Sensing in Soil Environment Monitoring)

Abstract

:
Increasingly severe hydrological extremes are predicted for the Pannonian Basin as one of the consequences of climate change. The challenges of extreme droughts require the adaptation of agriculture especially during the intense growth phase of crops. For dryland farming, the selections of the optimal land use type and sustainable agricultural land management are potential adaptation tools for facing the challenges posed by increased aridity. To this end, it is indispensable to understand soil moisture (SM) dynamics under different land use types over drought-affected periods. Within the framework of a Slovenian–Hungarian project, soil moisture, matric potential and rainfall time series have been collected at three pilot sites of different land use types (pasture, orchards and a ploughland) in SW Hungary since September 2018. Experiments were carried out in soils of silt, silt loam and clay loam texture. In the summers (June 1 to August 31) of 2019 and 2022, we identified normal and dry conditions, respectively, with regard to differences in water balance. Our results demonstrated that soil moisture is closely controlled by land use. Marked differences of the moisture regime were revealed among the three land use types based on statistical analyses. Soils under pasture had the most balanced regime, whereas ploughland soils indicated the highest amplitude of moisture dynamics. The orchard, however, showed responses to weather conditions in sharp contrast with the other two sites. Our results are applicable for loamy soils under humid and subhumid temperate climates and for periods of extreme droughts, a condition which is expected to be the norm for the future.

1. Introduction

Reports by the Intergovernmental Panel on Climate Change (IPCC) predict that the increasing frequency of both extreme precipitation and prolonged drought periods is very likely in the near future [1]. This pattern was exemplified in Hungary in 2010, with record high annual precipitation totals, followed by the record low annual rainfall total of 2011. However, thanks to the storage of surplus moisture from the previous year in soils, the 2011 drought did not cause remarkable losses in crop yields. Negative water balances, water stress and drought will likely be manifested in diverse ways geographically in the future [2]. Nonetheless, due to the rain shadow effect of the Alps and the Carpathians, the Pannonian Basin will likely be affected by water shortages in the near future [3] and alternating inundations by flash floods, inland excess waters [4,5,6] and soil erosion [7].
A novel element of sustainable adaptation to climatic conditions of negative water balances could be integrated water management, equally directed to the prevention of excess runoff and prolonged droughts [8,9]. In basin locations and areas of transit waters, such as the Pannonian Basin, water retention is of increasing importance [9,10]. This has been crucial since the river regulation works in the early- and mid-1800s when water conveyance had been accelerated artificially. Over the 1800s and 1900s, flood control measures meant the cost-intensive construction of hydrologic structures (levees, dykes and embankments). Nevertheless, recently, the negative consequences of the rapid conveyance and limited storage of water through the Pannonian Basin have been recognized. The main hydrological constraints are limited land availability and water retention and the reduced storage capacity of the soil [11].
By recognizing the beneficial role of ecosystem services [12,13,14], a paradigm change occurred in water management policies in many countries in Europe and North America. Water conservation in a sustainable way has priority, especially in floodplains and low-lying areas. Water should be retained in floodplains or various stormwater-mitigation facilities (e.g., raingardens and flood retention pools), in natural and manmade reservoirs and other water bodies instead of increasing the intensity of water conveyance [15].
Adaptation to the increased extremities of hydrologic phenomena (droughts and floods) and the retention of water are indispensable in light of climate change [16]. Therefore, analyzing the suitability of soil textural types, fertility, topography and crop varieties may increase the profitability of the given land use type if managed site-specifically [17,18,19,20].
Hence, for sustainable site-specific best management practices, the re-evaluations of landscape diversity and efficiency of increased water retention are essential [21]. As opposed to costly hydrologic structures that are often undesired for natural or seminatural environments [22,23], greener investments and eco-friendly solutions are needed [10], which may comply with the EU Water Framework Directive or other similar frameworks [24,25,26]. To maintain a more balanced water budget in the long run, the following specific goals should be stated [10]:
  • decreasing hydrologic extremities;
  • infiltration and subsurface recharge should be intensified over excess runoff;
  • increased replenishment and recharge into the vadose zone as well as aquifers;
  • canopy density and leaf area index (e.g., employing intercropping) shall be increased to reduce throughfall and decrease evaporation loss.
Land use and management can significantly affect both atmospheric (e.g., greenhouse gas emission rates and vapor content) and soil physical properties, including porosity hydraulic conductivity [16,27], rate of infiltration, and volume of plant-available water [28,29,30,31]. Land use changes may influence the intensity of certain elements of the water cycle, especially the magnitude and time of evapotranspiration [32]. Fu et al. revealed the beneficial impacts of intercropping and terraced agriculture on soil moisture [21]. Niu et al. demonstrated that grasslands had the highest mean soil moisture contents among five different land use types (grassland, cropland, poplar land, interdunes and shrubland) in north-eastern China [33]. The degradation of physical soil properties can directly affect moisture dynamics in the vadose zone. For example, soil productivity decreased by converting natural pastures to farmlands in Iran [28].
The present paper reveals the findings of a Hungarian–Slovenian joint research project titled “Possible ecological control of flood hazard in the hill regions of Hungary and Slovenia”. The key objective of the project is providing data on moisture dynamics of silty and loamy soils found on surfaces of high relief. The goal of this study is to present the influence of land use type coupled with periods of different water balances (‘normal’ or dry summer periods) on moisture dynamics. According to our hypothesis, soils of ploughlands should have a lower water retention capacity, whereas balanced moisture dynamics characterize soils under closer-to-natural land use types. The novelty of our paper is to provide data on the effect of agricultural land use types on soil moisture dynamics. The selected area is markedly affected by a changing climate of increasing aridity. Sustainable adaptation to changing climates at local scales helps in maximizing the site-specific efficiency of ecosystem services. The present study complements previous research carried out in Central Hungary [16].

2. Materials and Methods

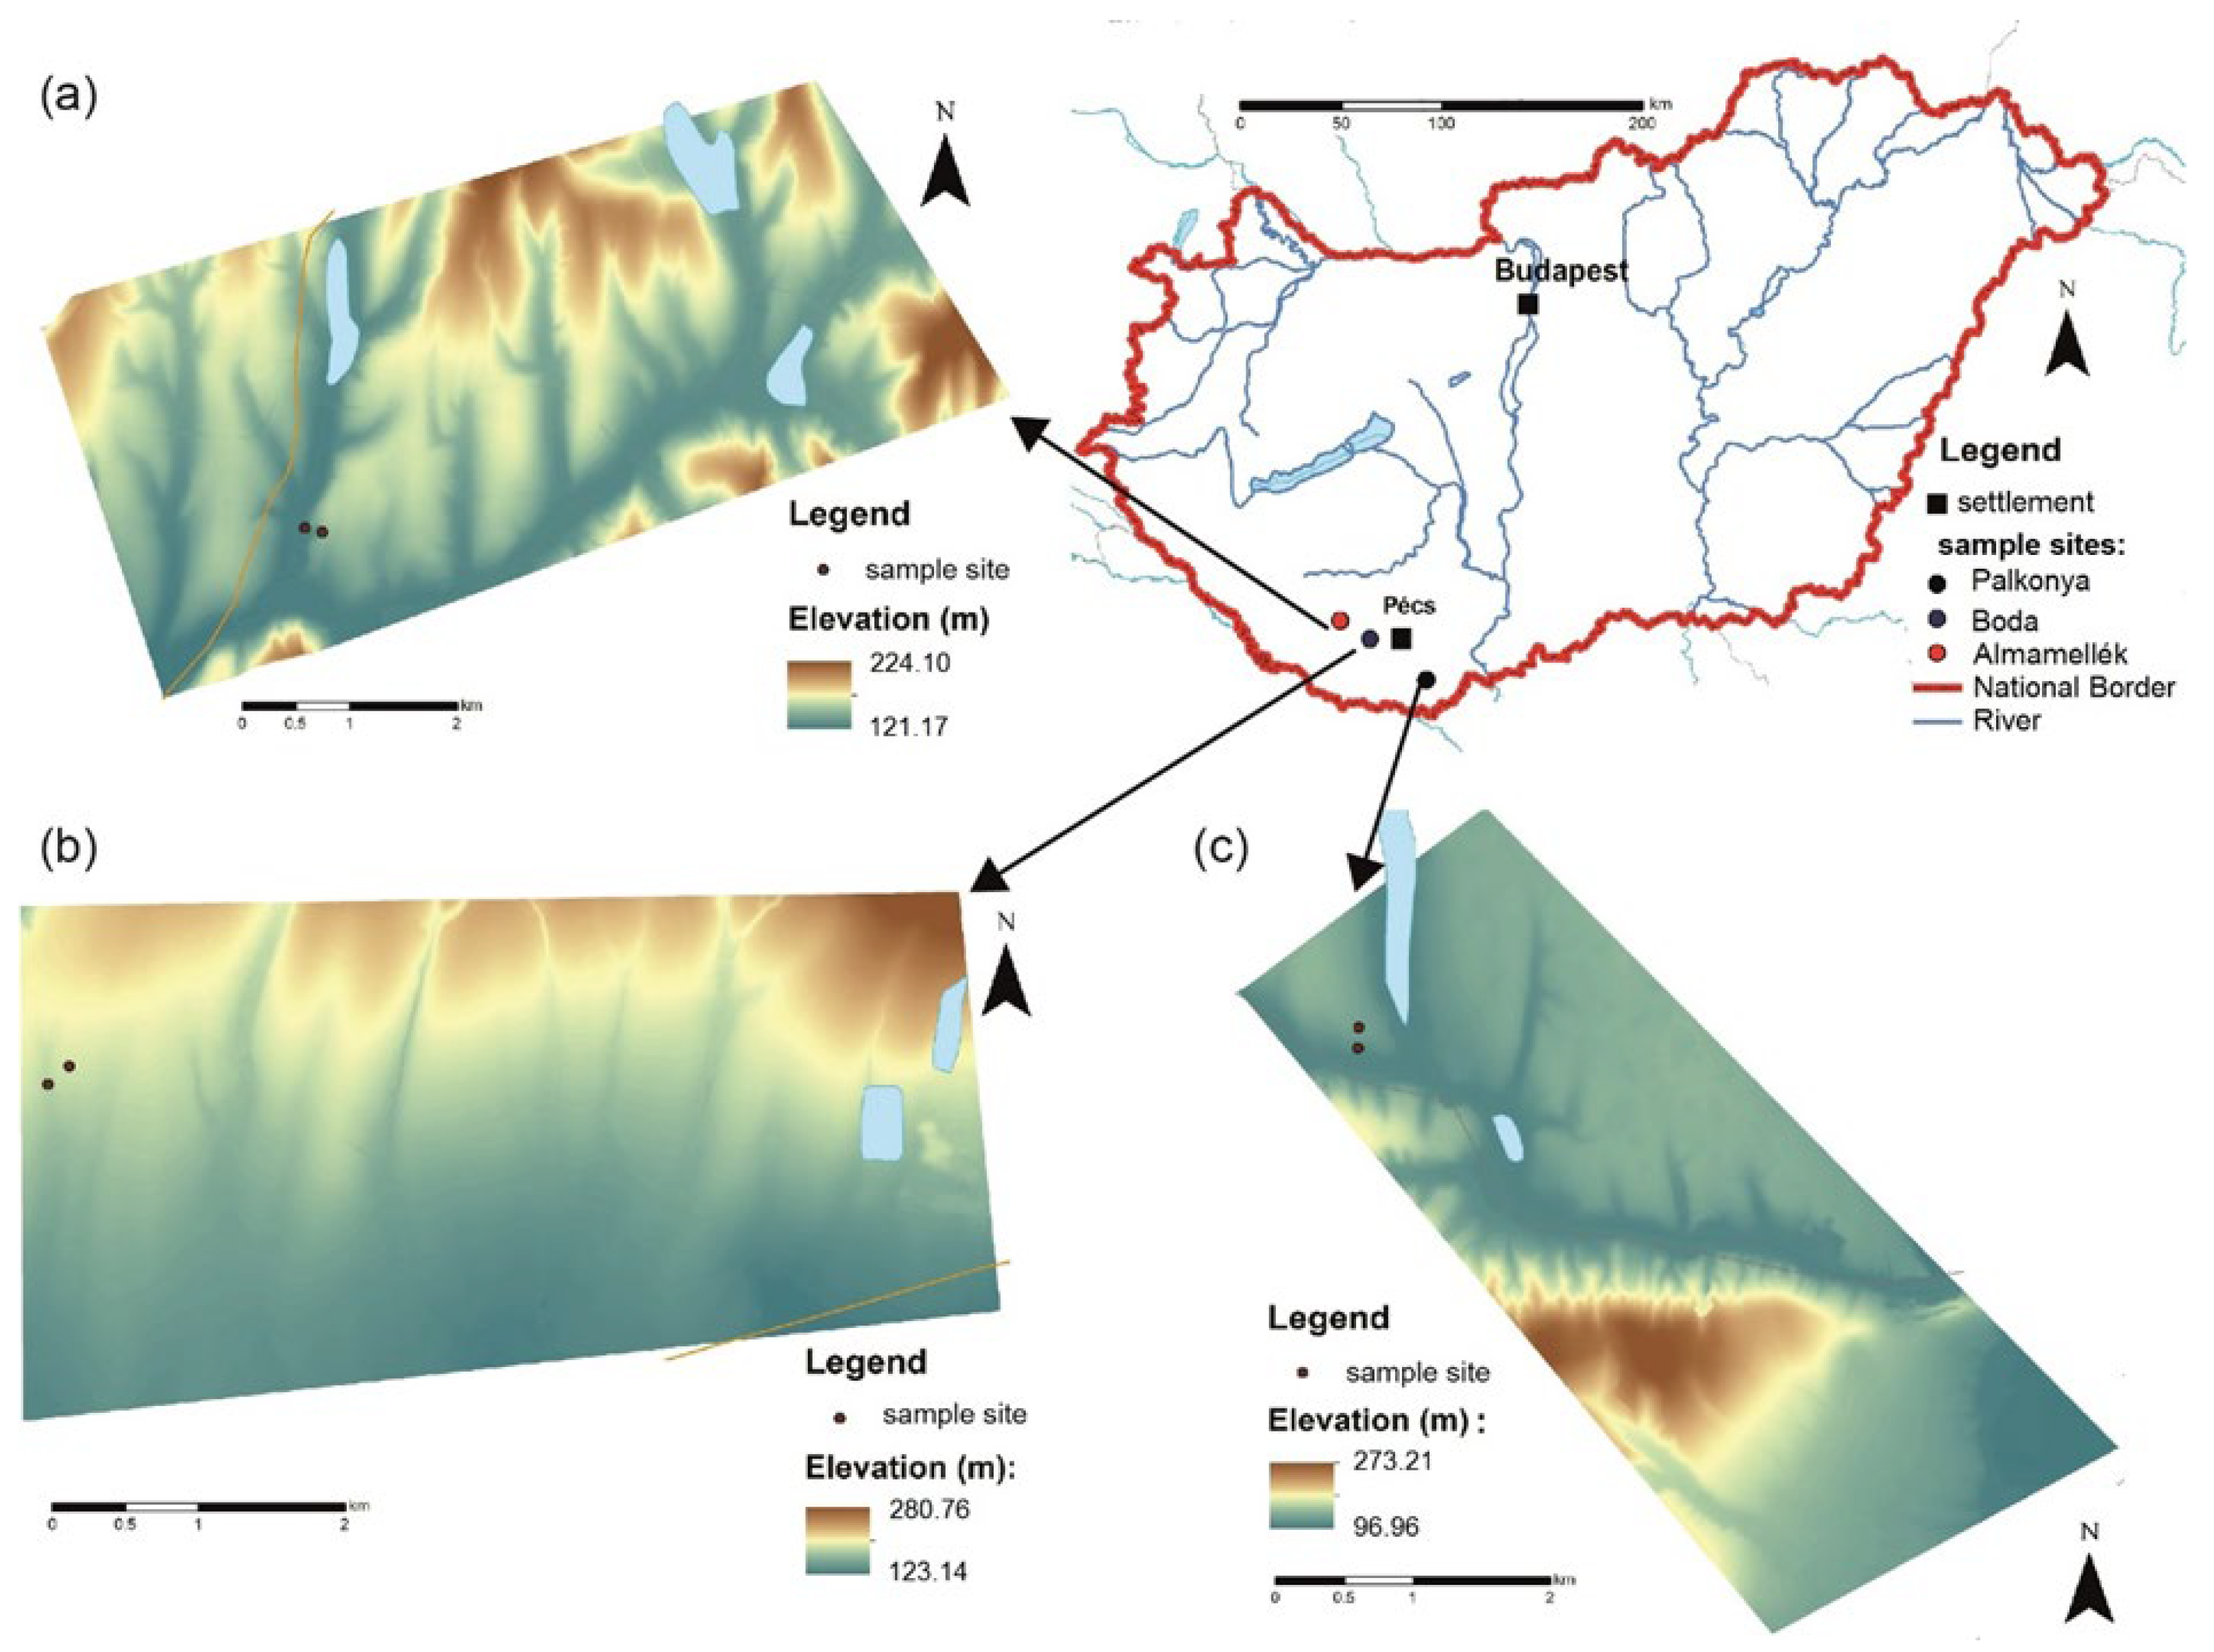
2.1. Location of Study Sites

For the analyses, three sites were selected in the Transdanubian Hills (SW Hungary) in the vicinity of the city of Pécs: at the villages of Boda (ploughland), Palkonya (orchard) and Almamellék (pasture) (Figure 1). It is a region of a subhumid continental climate influenced by the air masses (whether continental, Atlantic or Mediterranean) and the orographic effect. Although in the long-term precipitation shows an increasing gradient towards the western part of the country, in many years, field rainfall totals show a rather mosaic pattern.
In all study sites, slightly eroded brown forest soils with clay illuviation (WRB: Endocalcic Luvisol) are found. All soils are formed on loess. The three sites are similar in terms of textural type (silt and silt loam) and diagnostic soil type (Calcaric Phaeozem, WRB).

2.1.1. Ploughland Site (Foothills of the Mecsek Mountains)

This study site is located at a distance of 10 km west of city of Pécs, in the southern footslopes of the Mecsek Mountains, gently sloping to the direction of the Pécs half-basin, west of the village of Boda. The elevation of the lower and upper station is 172 and 182 m, respectively (Table 1). The average slope for this site is 2.63°, whereas the maximum is 6.48°. The land use type is large-scale farming of conventional tillage, with sugar-beet, cereals, sunflower, soybean and rape seed as the most common crops. In both study years, this site was cropped with soybean. The distance between the two monitoring stations of this site is 190 m. A derasional valley and an erosional gully are found at this site, uphill and downhill of the lower station, which is located at the southern margin of a small grove. These landforms and the grove likely influence the soil moisture budget around the station.

2.1.2. Orchard Site

The second study site lies at the southern edge of the village of Palkonya in the north-western foreland of the Villány Hills. Land utilization is a cherry orchard. The parent material is Pleistocene loess overlying a Mesozoic limestone. Elevation of the lower and upper stations is 175 and 182.7 m. The slope of the uphill station is steeper, with an average slope of 18°, whereas the slope is gradually decreasing to a footslope position closer to the foothill station and the reservoir located in the valley bottom. The two stations of this site were installed at a distance of 156 m.

2.1.3. Pasture Site

This study site is situated in the Zselic Hills, where the elevation of the lower and upper is 112.6 and 124.6 m, respectively. The average slope in the Almamellék site is 5.92° uphill from the uphill station, whereas it reaches a maximum of 9.7° immediately downhill from the upper station. Furthermore, the land is utilized here as a natural pasture and meadow. The monitoring stations are located at a distance of 167 m from each other.

2.2. Field Monitoring Setup

To track local moisture dynamics, SM monitoring was installed for each study site in December 2018. At each site, two monitoring stations were deployed. Rainfall was measured using tipping-bucket rain gauges (ECRN-100, Meter Group Inc., Pullman, WA, USA) of 0.2 mm resolution. Rain gauges as well as WP4 temperature and relative humidity sensors were installed only at the uphill stations. At both stations of each site, TDR-type soil moisture sensors (Meter Group Inc., Teros 12) and tensiometers (Teros 21) were used to measure volumetric water contents and matric potential, respectively. At each station, 4 sensors were deployed at depths of 10 and 30 cm (one soil moisture sensor and one tensiometer at each depth). The depths were selected based on soil type (loamy soil) and the typical crops grown in SW Hungary. Soils to a depth of 30 cm experienced the largest fluctuation in soil moisture. TDR sensors had been laboratory-calibrated prior to their installation in the field. Data were logged and stored with EM-60 data loggers at a time interval of 15 min.

2.3. Particle Size Analysis of the Soil Samples

Soil samples were taken from the depths of the sensors. Organic matter and CaCO3 were removed from the samples using H2O2 and 10% HCl, respectively. The grain size distribution of the soil samples was determined with static light scattering using a Malvern MasterSizer 3000 (Malvern Inc., Malvern, England, United Kingdom) particle size analyzer. The textural type was determined using an MS Excel macro (https://www.nrcs.usda.gov/resources/education-and-teaching-materials/soil-texture-calculator, accessed on 10 January 2023) and clay–silt and silt–sand boundaries at 2 and 63 µm, respectively.

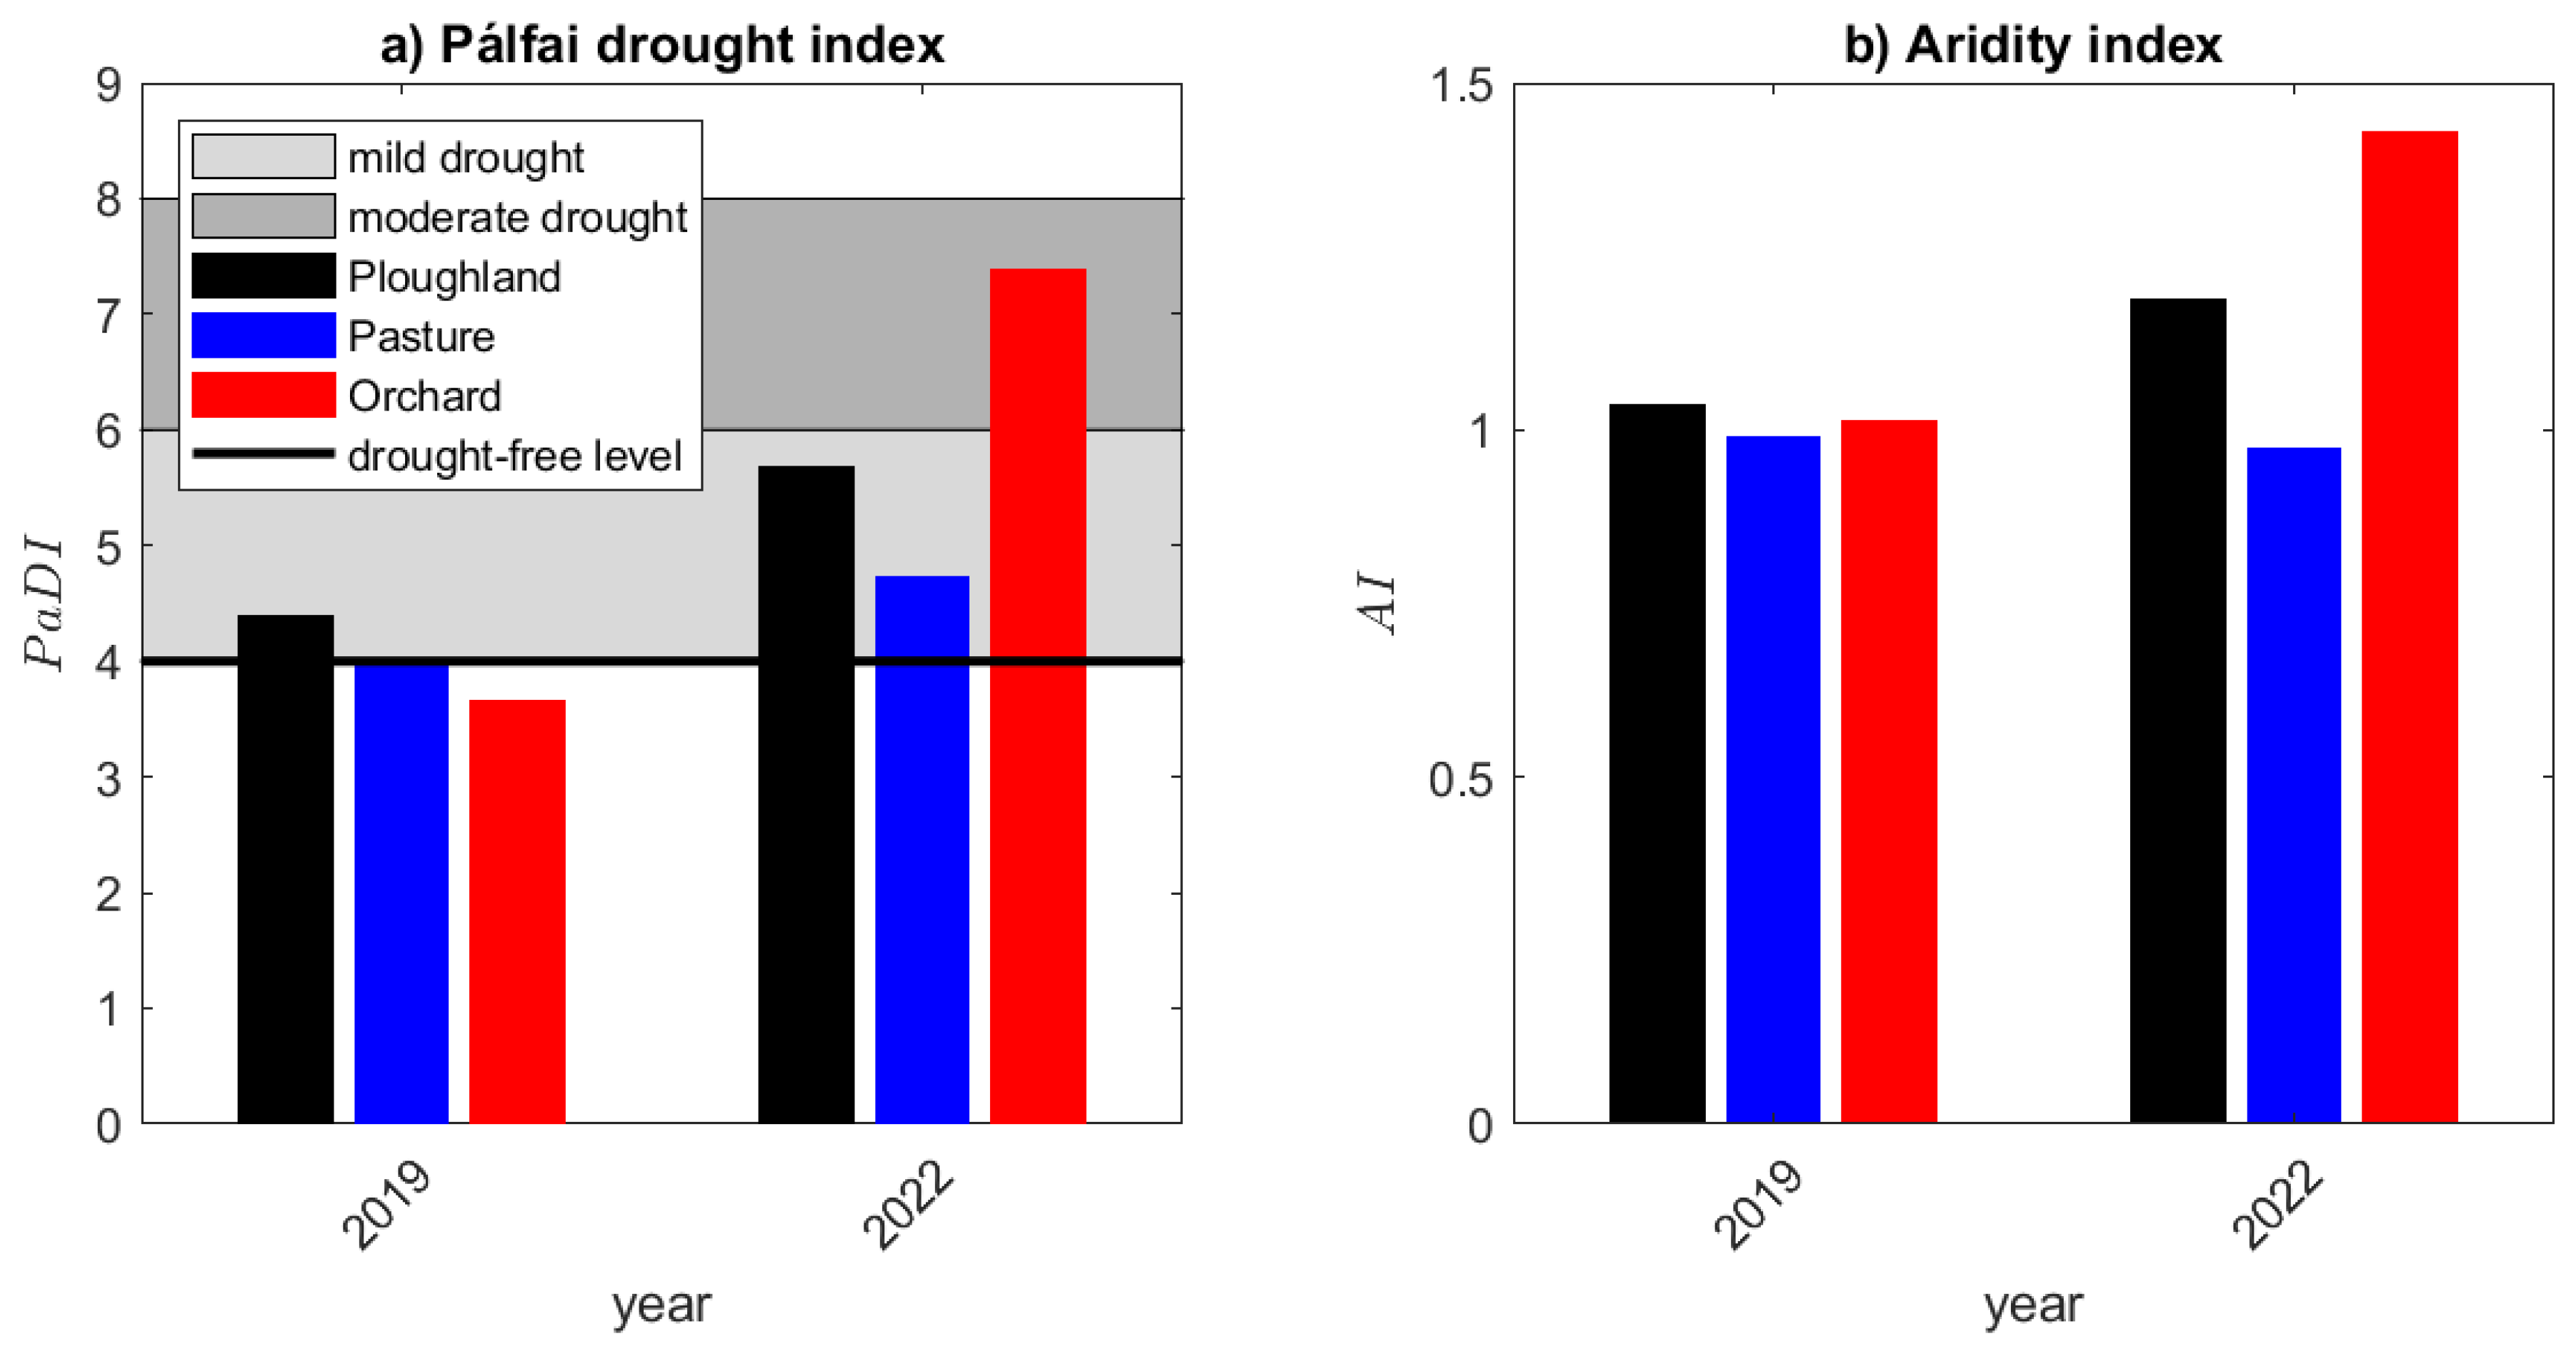
2.4. Calculation of the Pálfai Drought Index and the Aridity Indices

The Pálfai Drought Index (hereafter PaDI, [34]) was calculated for the three study sites using mean monthly temperatures and weighted monthly precipitation totals. Potential evapotranspiration was calculated using the Thornthwaite equation [35,36], widely applied for the estimation of PET under humid and subhumid temperate climates.

2.5. Analysis of Field Data
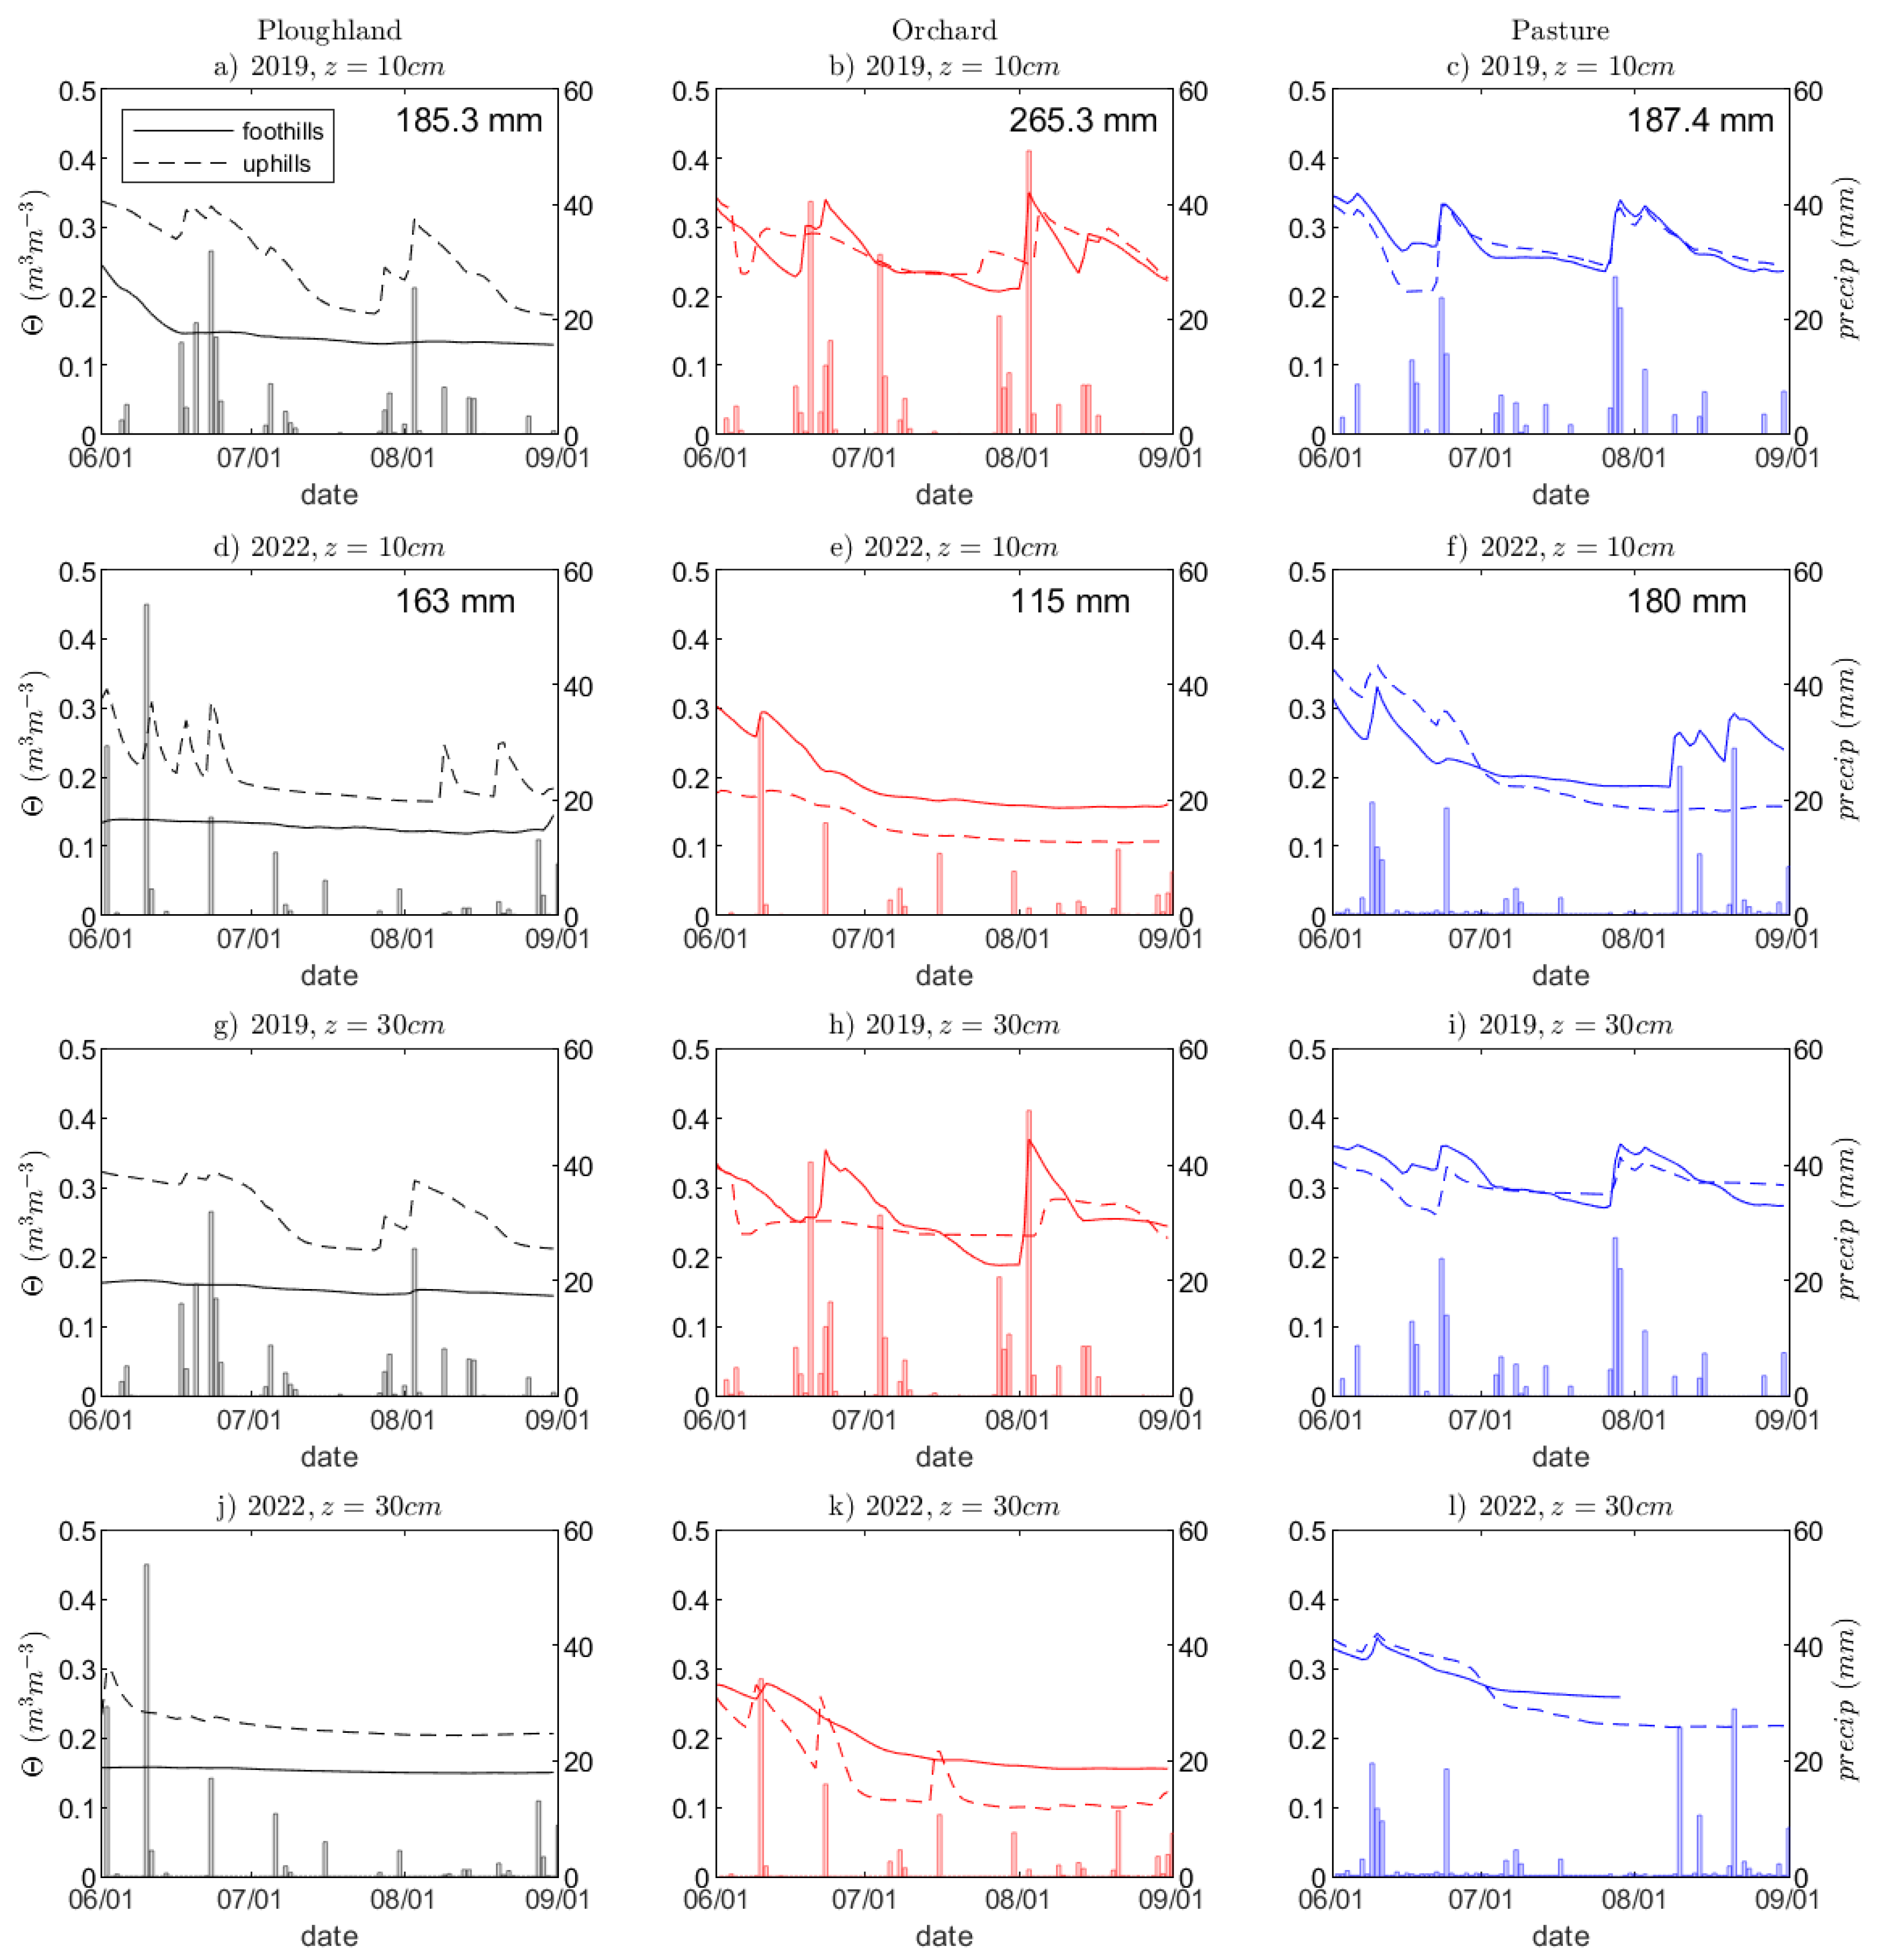
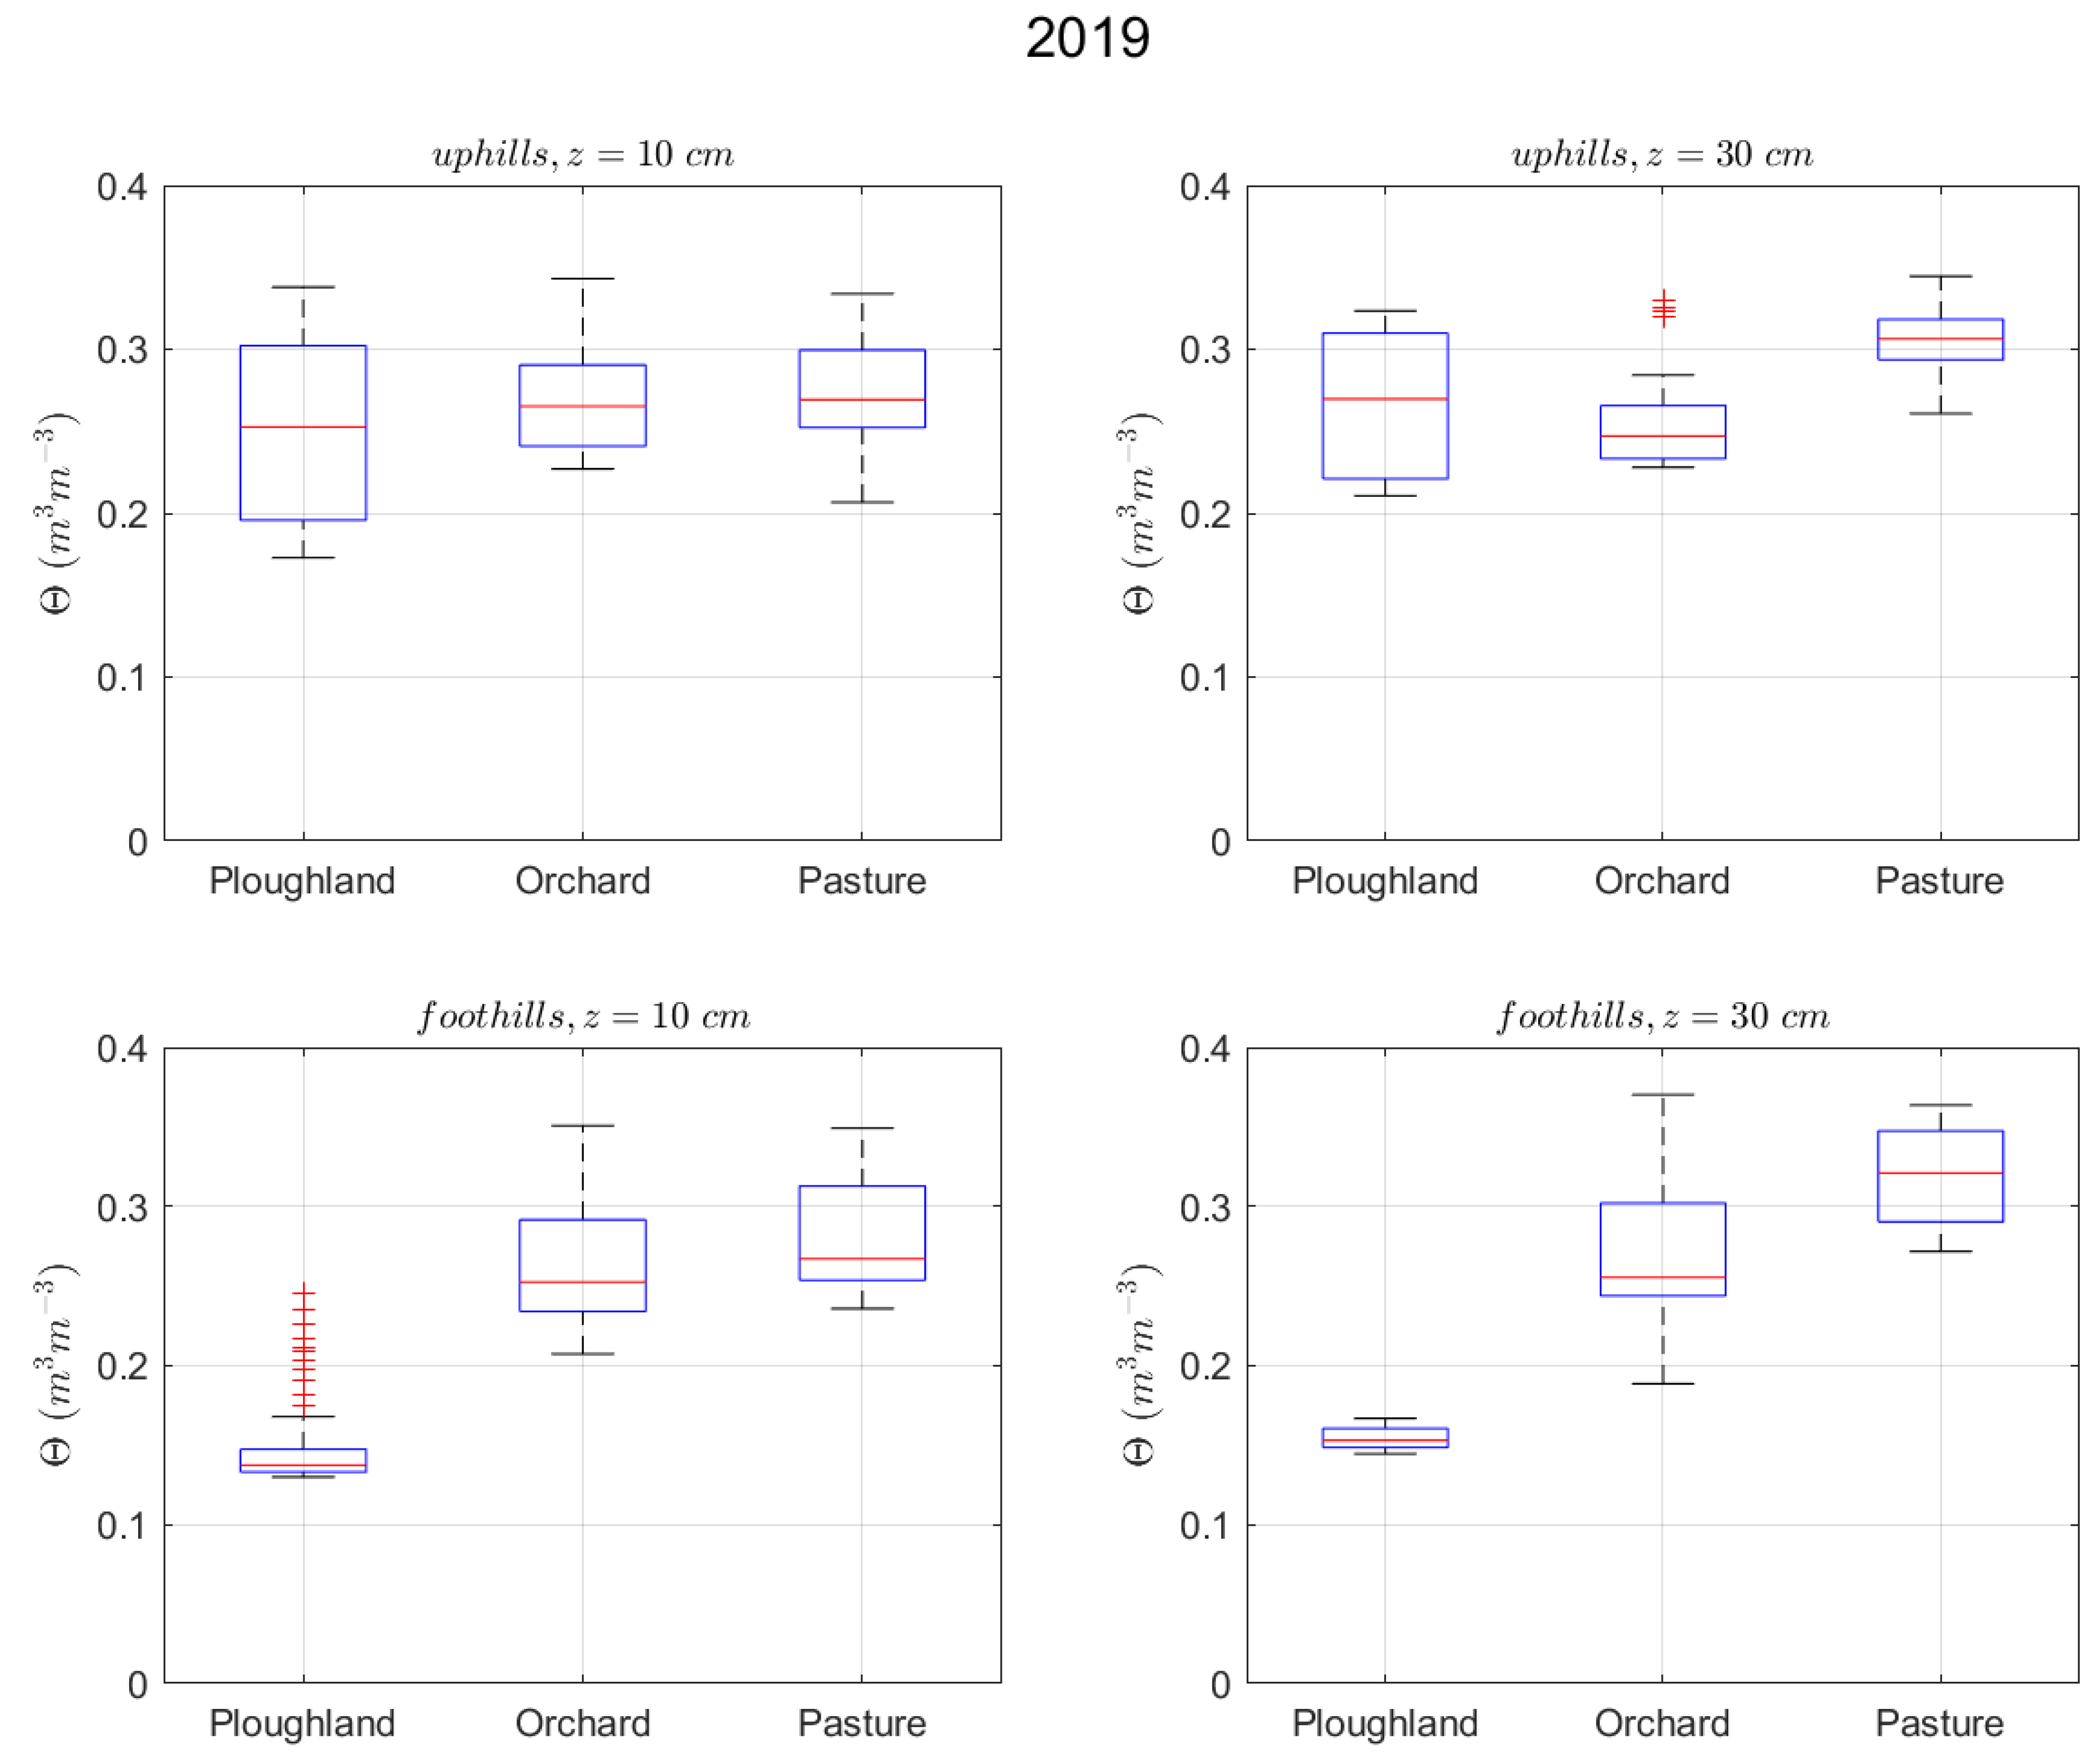
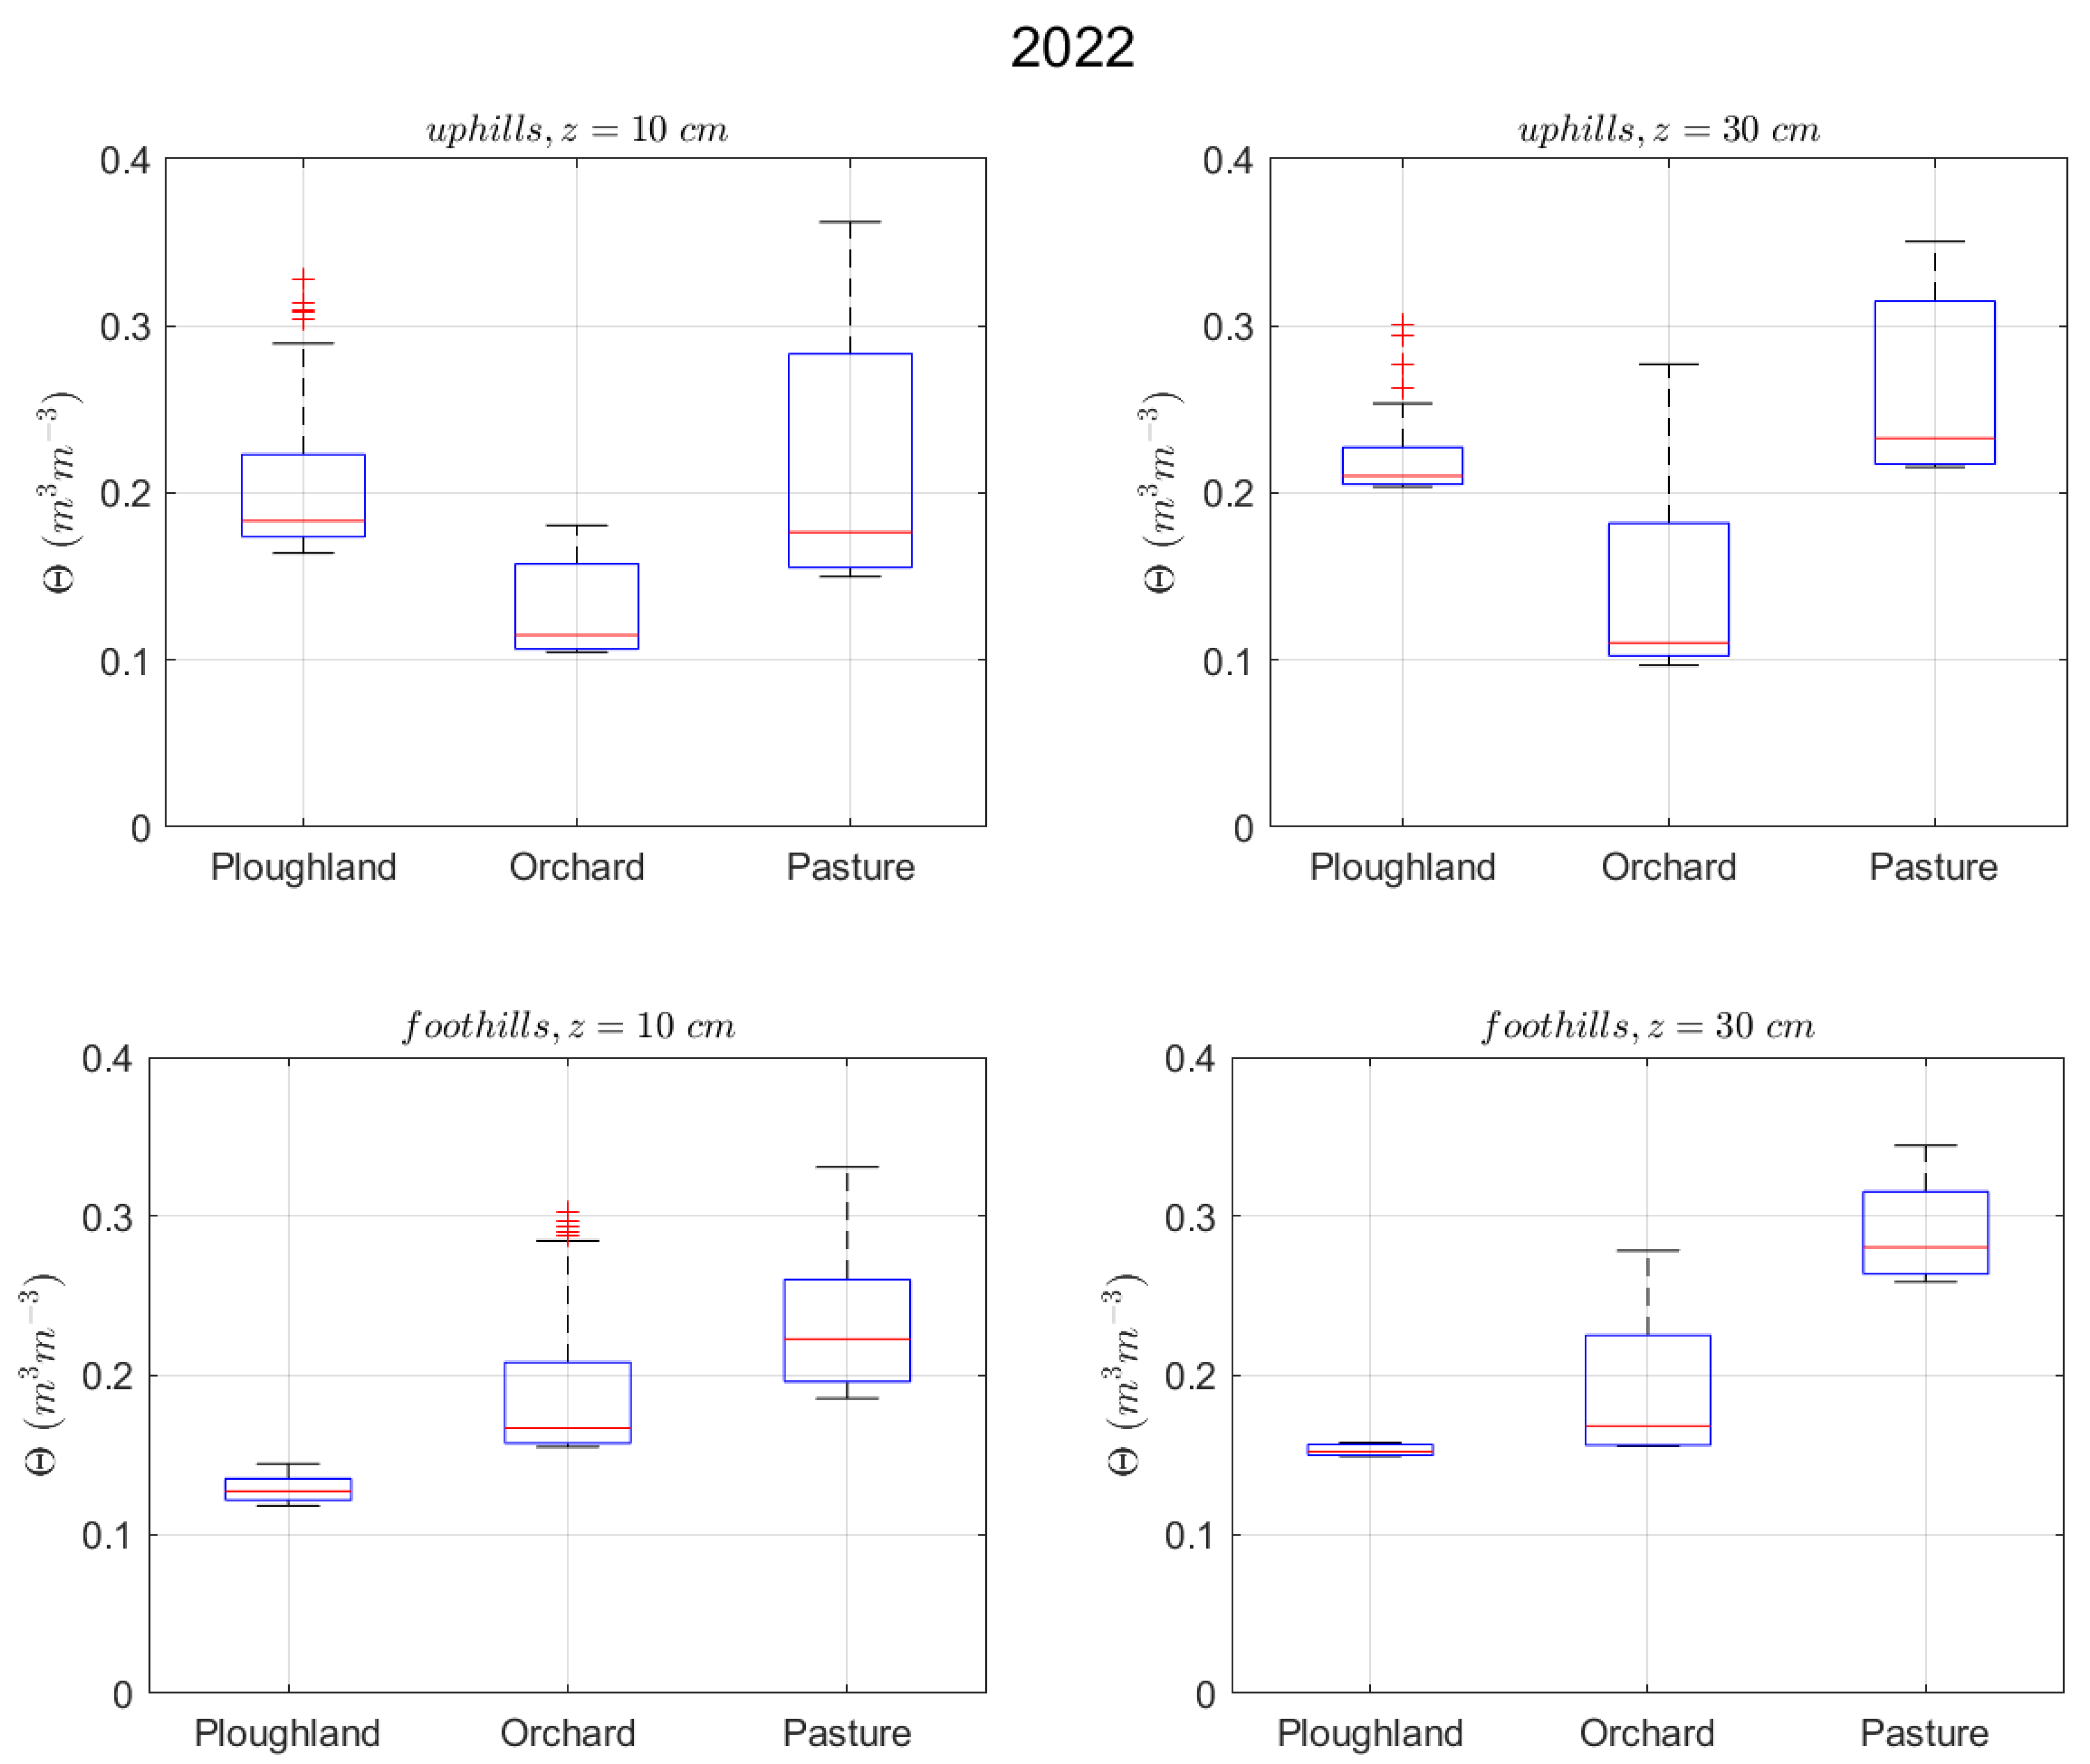
The field data were statistically analyzed using MATLAB R2020b and MS Excel programs. The statistics focused on descriptive statistical parameter calculations (mean, median, standard deviation, minimum, maximum and range of the data). Boxplots were generated by the MATLAB program from raw data (excluding missing or inappropriate values). The general description of the boxplots was the following: the boxes’ sizes show the interquartile range (IQR, data fall into 25–75% percentile), the median was plotted on the boxplots (red lines) and the outliers were measured (all variables located at a distance from the median 1.5 times larger than the IQR were outliers). The whiskers showed the 5–95% percentiles.

3. Results

3.1. Soil Textural Types
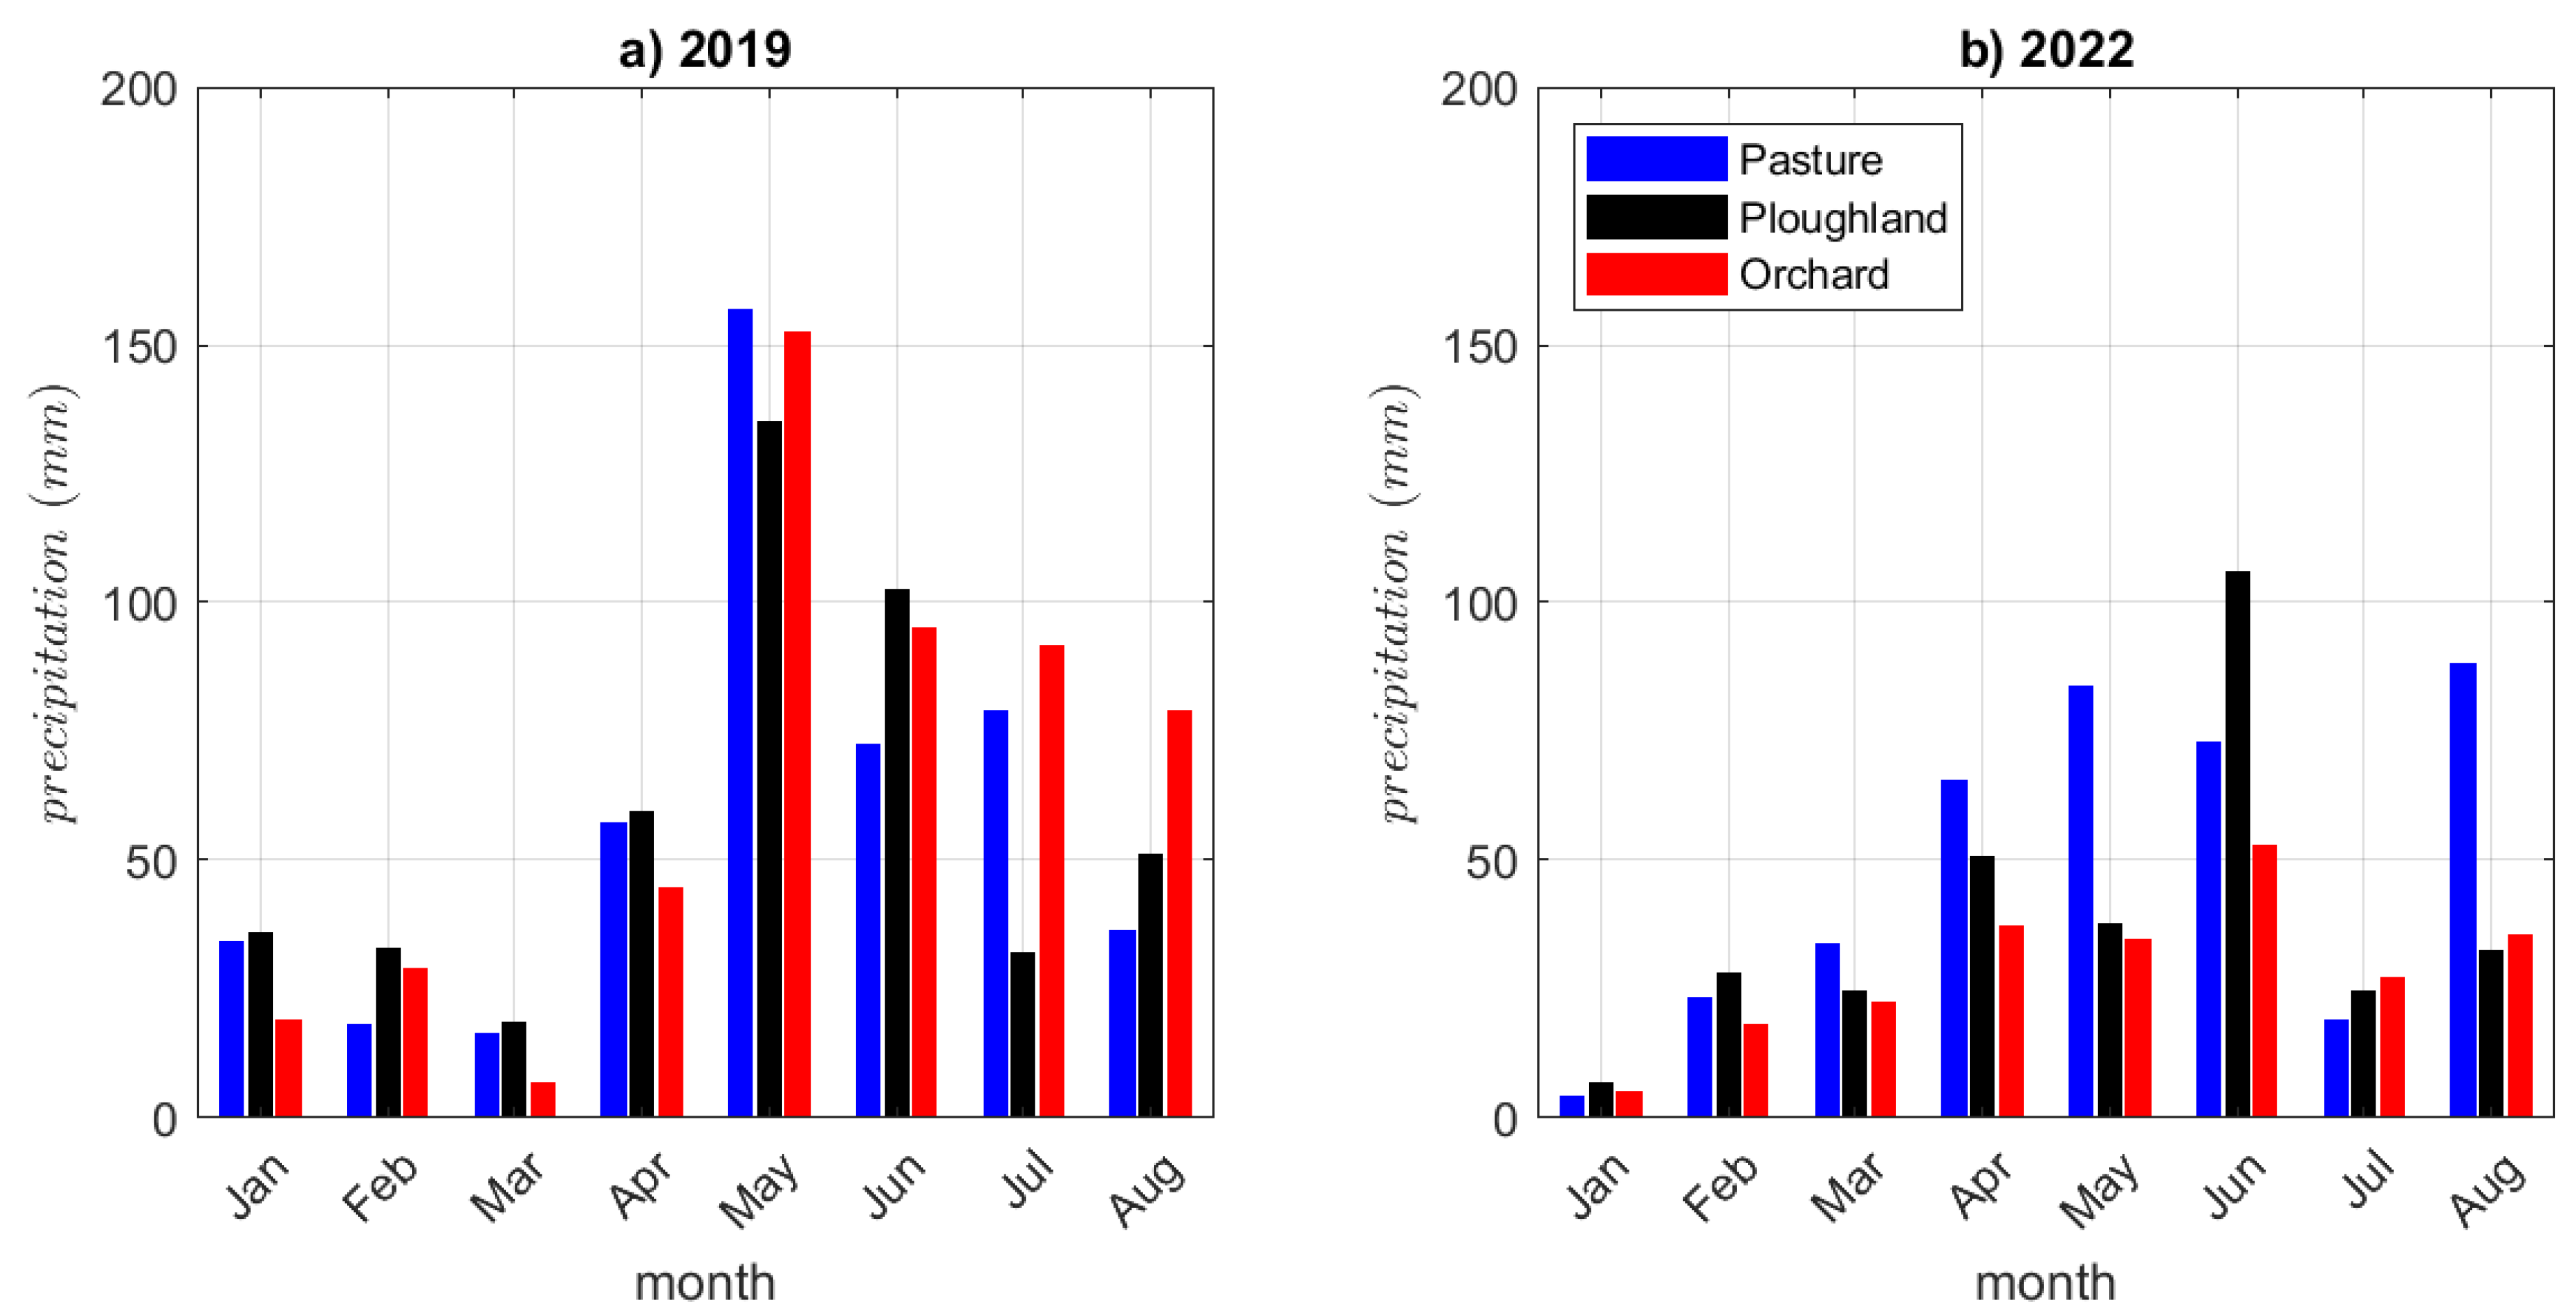
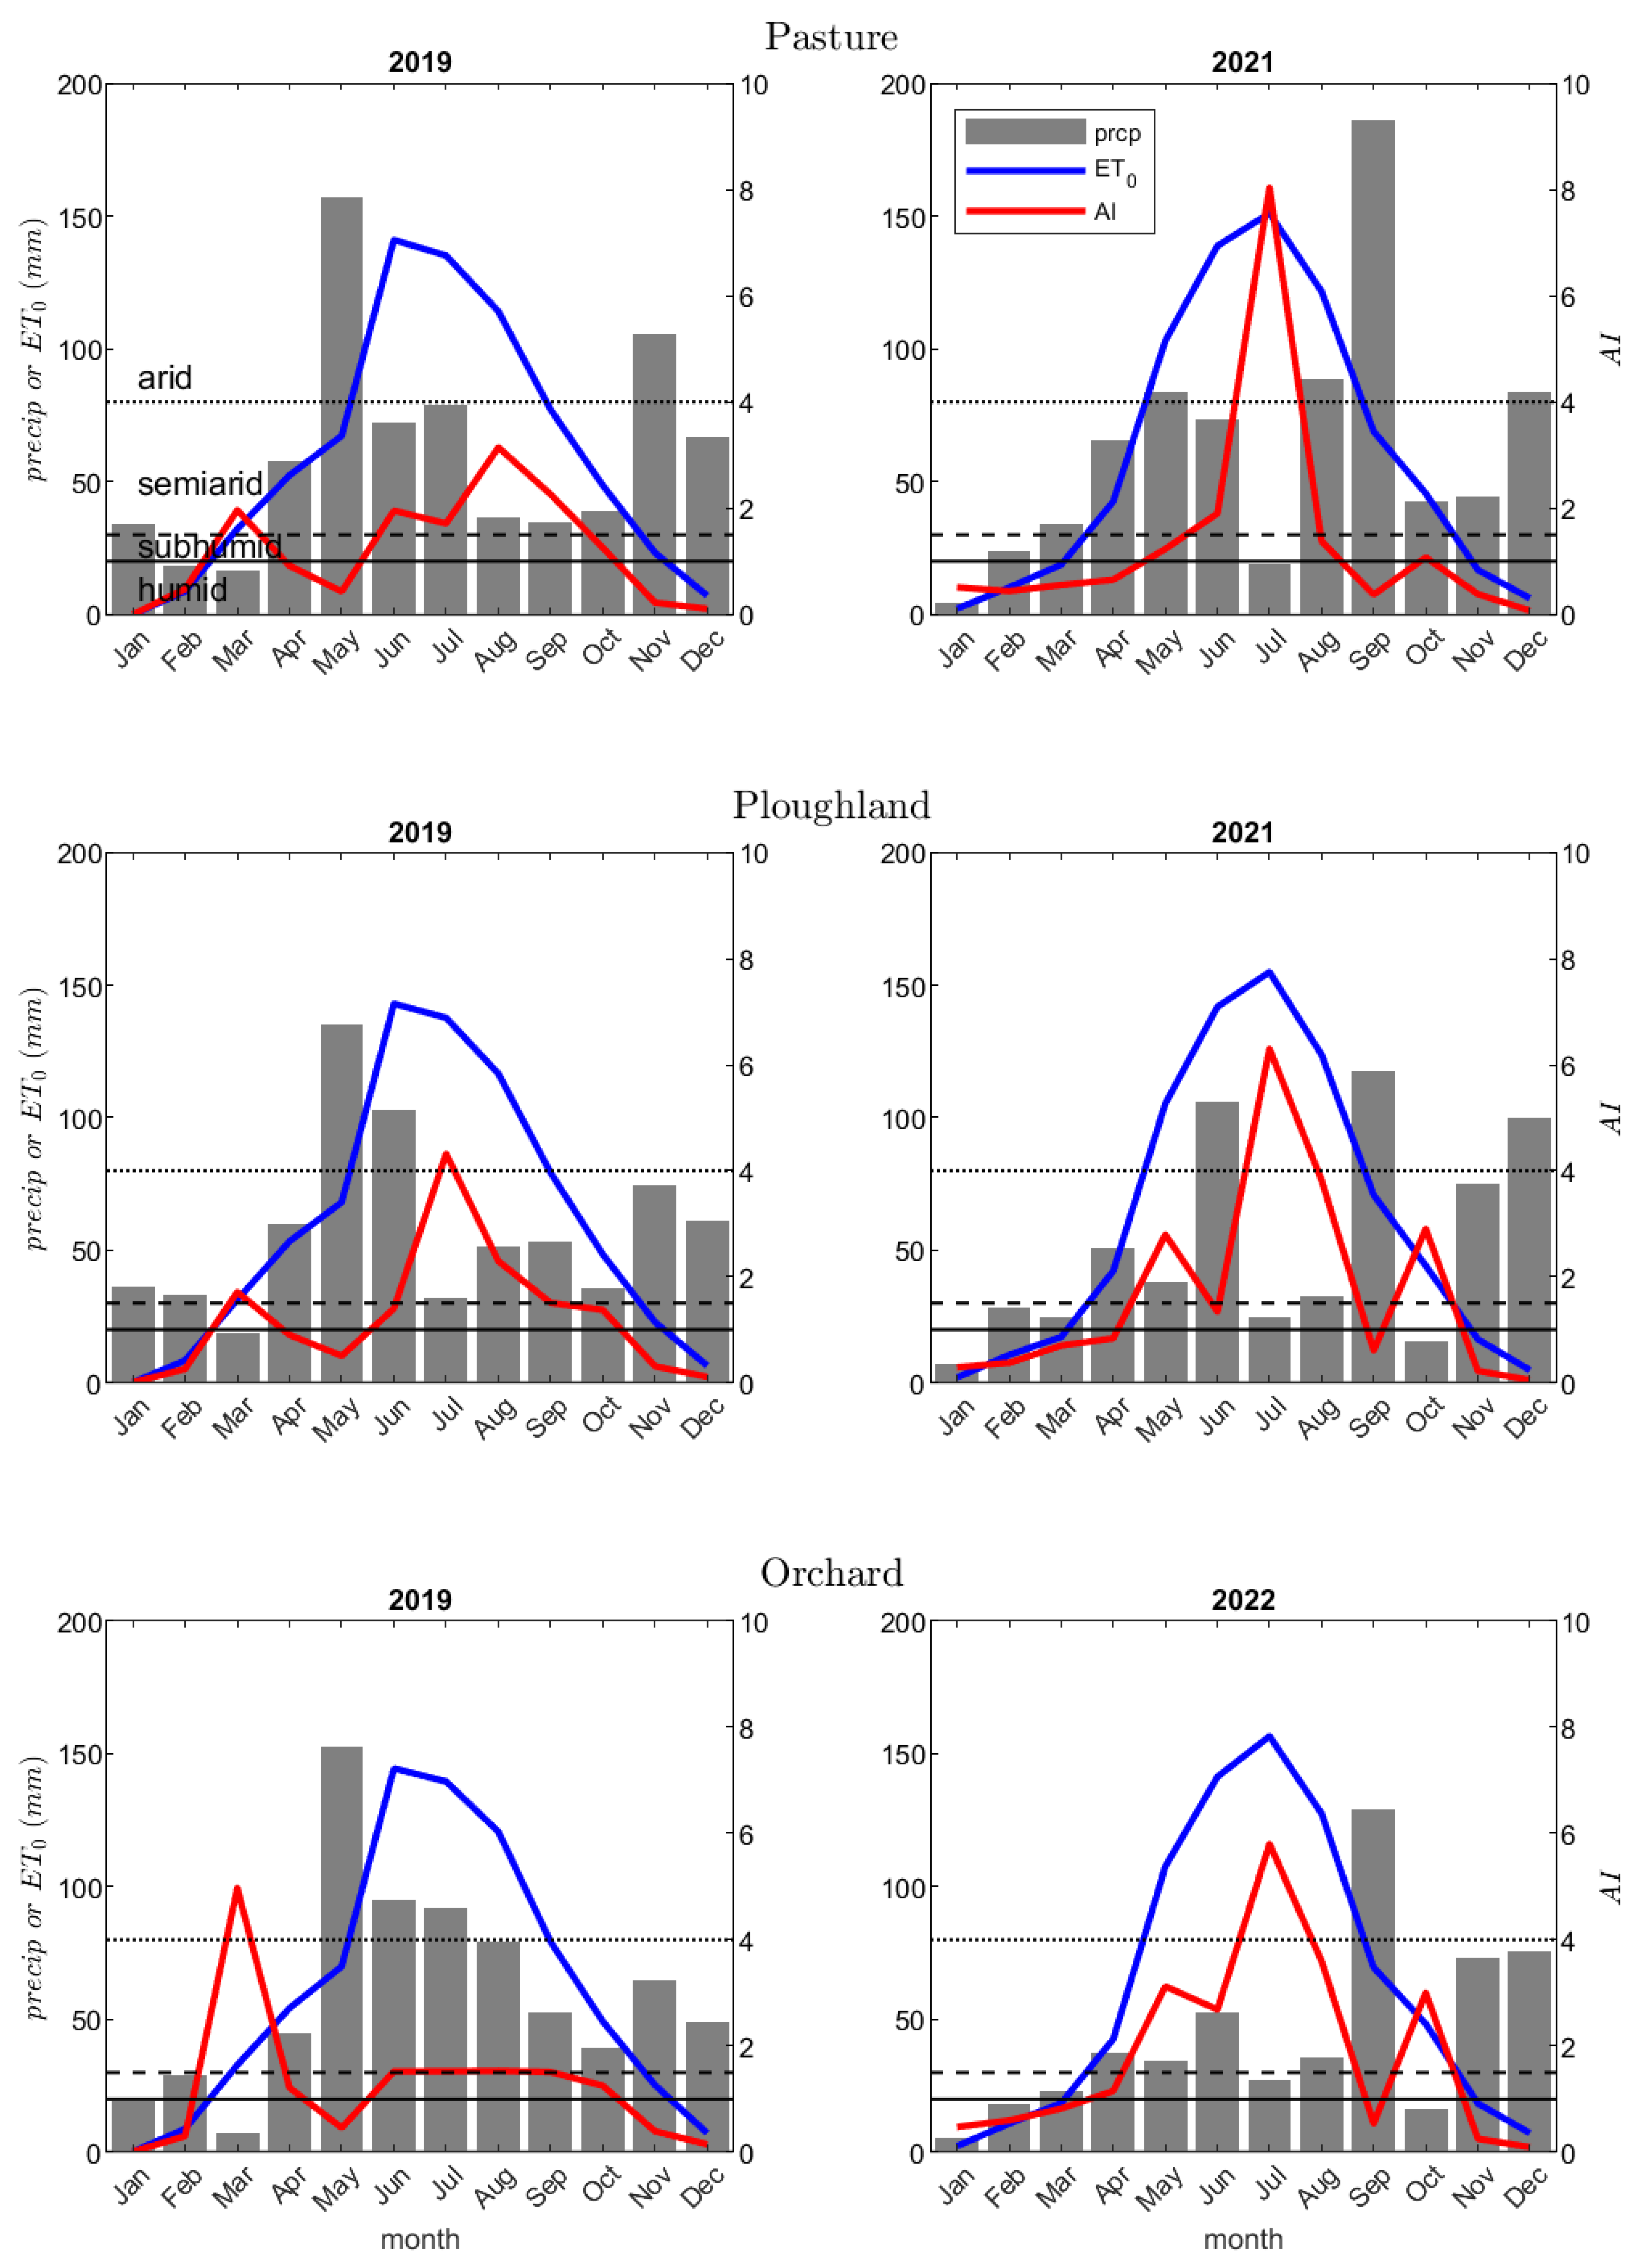
Soil texture at the three sites was dominated by the silt fraction, hence the soils were classified as either silt or silt loam types (Table 2). In general, all samples of the ploughland and the foothill pasture had higher sand content (24–32%) than the other sites.

3.2. Water Balance

Rainfall distribution showed a rather contrasting picture among the three sites. The highest rainfall for both the summer and the period of January to August was measured for the orchard site in 2019 and for the pasture in 2022, whereas the lowest rainfall total in 2022 was observed in the orchard (Table 3).
Both the antecedent (January to May) and summer precipitation of all three study sites indicated marked contrasts between the two studied years (Figure 2). January and May’s monthly precipitation totals demonstrated the largest variation between 2019 and 2022.
Mean monthly temperatures showed a less diverse pattern than rainfall among the three sites. Both the highest mean annual and the highest summer mean temperatures were recorded in the orchard in 2019 and 2022 (Table 4). Consistently, the lowest temperatures were registered at the pasture in both studied years. Mean summer and mean annual temperatures were about 1 °C and 0.2 °C higher in 2022 than in 2019, respectively. The differences between spring season average temperatures were minor; however, the growing season temperature at all sites was about 0.7 °C higher in 2022 than in 2019. The greatest variation was measured in autumn and differed by 0.8 to 1.1 °C from site to site (higher in 2019).
The higher summer temperatures and lower precipitations of 2022 compared to 2019 generated significant differences in PET, aridity index and PaDI both seasonally and annually. Monthly potential evapotranspiration revealed the greatest variations between 2019 and 2022 in the summer months. The close-to-record temperatures in July (Tmax = 39.2 °C in Palkonya) generated a monthly PET of almost 160 mm at all three sites. The largest differences in PET were registered in May.
PaDI and the aridity index demonstrated great variations between the two studied years. Due to the high rainfall totals of 2019 at the orchard site, its PaDI did not indicate any water stress in the first study year, whereas the other two sites had a PaDI of 4.2 and 4.6 which referred to mild drought conditions. Although drought conditions remained in the class of mild drought in 2022 at the pasture and the ploughland, all three sites experienced water stress with the highest increase in PaDI at the orchard site, which entered the class of moderate drought (Figure 3a).
Aridity indices were around 1 in 2019 (common for Hungary since the onset of meteorological measurements), whereas they turned into a negative water balance (AI > 1) for the ploughland and the orchard by 2022 (Figure 3b).
Figure 4 shows the aridity index, total monthly precipitation and monthly evapotranspiration in 2019 and in 2022 for the ploughland, pasture and orchard locations. All sites in 2022 experienced semiarid or arid conditions especially during the growing season (from April to October), except for September. However, in 2019 aridity was less severe, but still reached the semiarid category during this most critical season. The orchard site remained under subhumid conditions. Compared to Figure 4 (PaDI), the orchard site showed more intense drought in 2022, since over the growing season it experienced a lower amount of plant-available water (less precipitation) against high evapotranspiration.
In terms of the average aridity index, precipitation and evapotranspiration, summer periods had intensively critical values for almost all sites, especially in 2022. The main difference was found in the growing season when higher evapotranspiration and lower precipitation in 2022 resulted in more arid conditions (Table 5). Nevertheless, on an annual basis and in autumn the differences were negligible. During the winter of 2021/2022, all sites received a substantial precipitation amount, but this was not able to compensate for the low rainfall during the growing season in 2022. It is to be pointed out that in 2021 the summer, and, in fact, the entire growing season were also moderately dry (mild drought, with around PaDI = 5, not shown here).

3.3. Soil Moisture Regime

In general, the SM regime showed a rather variable picture for the three study sites. On average, the natural pasture had the highest volumetric water content and soils and that site had the most responsive behaviour to rainfall events. The foothill site of the ploughland, however, had the lowest SM contents and the least variability of SM among all sites (Figure 5). The orchard site revealed a contrasting picture between the two studied years due to (i) necrosis, tree removal above the upper monitoring station and (ii) the markedly less precipitation in 2022 compared to 2019. While the moisture regime at this site demonstrated a great variability in 2019, the SM content showed a monotonously decreasing trend over the summer of 2022.
The statistics of SM indicated marked variations among the three land use types. Commonly, the pasture showed the highest SM content, and the ploughland had the lowest median SM values. The footslope station of the ploughland revealed the lowest SM content and the lowest SM range, likely influenced by the grove uphill. On the other hand, the orchard showed the greatest range of SM over the two studied summers due to its extreme water balance and the removal of tree canopy at the upper station (Figure 6 and Figure 7). The natural pasture presented the greatest water stress tolerance and the most homogeneous water dynamics among the three land use types. At all stations, mean and median SM contents in 2022 were either equal to (at the ploughland footslope, 30 cm) or lower than those in 2019 (at all other stations).

4. Discussion

Our research confirmed former results [16,21,27,30,37,38,39,40,41,42,43,44,45], i.e., moisture content of the vadose zone is markedly influenced by land use type, distance from landscape and morphological features, local water and moisture balance and soil texture.
In both summers, the most optimal moisture content (i.e., the highest median with the lowest variability) was revealed in the pasture. The highest median SM content was found here over both studied summers. A higher drought risk during the two studied summers was found both at the ploughland and the orchard. SM contents were low in the ploughland on many occasions and for prolonged periods in 2019, during which the matric potential fell below the permanent wilting point (data are not shown here). The longest of such periods lasted for 73 and 101 days in 2019 and 2022, respectively, at the upper station of the ploughland. According to our a priori hypothesis, the ploughland should have had a large evaporation loss and hence low mean SM content. Yet, due to the dense canopy cover of soybean until late September, evaporation loss caused by direct solar radiation was limited. The orchard performed well when the canopy was present at the site (in 2019); however, when the land use type was changed by 2022, its water retention capacity deteriorated. As a consequence, the orchard showed a markedly more negative water balance in 2022 compared to 2019, further exacerbated by the effect of the absence of canopy. The negative water balance of 2022 in the orchard produced the lowest median SM content at both monitored depths of the upper stations.
Our results have been partly confirmed by the findings of Wang et al. [46], who found the second highest SM content in grasslands in eastern China. Nonetheless, in their study, corn had the highest SM content due to the reduced evaporation from the soil. However, Shi et al. [47] pointed out that intense transpiration created extreme water stress in orchards in the Loess Plateau of China, underpinning our result concerning the high variations of SM at the orchard site.
Opposed to the findings of Tölgyesi et al. [48], we did not find compelling evidence of the drying effect of trees in the top 30 cm of the soil. This may be explained by (i) the removal of trees, (ii) the finer soil textural types of our site and (iii) the extreme water balance of the orchard site in 2022 compared to the ploughland and the pasture. Our results, however, indicated the enhanced water retention and water storage capacity of the soil due to the canopy cover and shading of the orchard (cherry) trees during the summer of 2019, and hence contributed to the overall roles of natural ecosystem services. This finding is corroborated by the results of Syrbe and Grunewald [41] and Ribeiro and Šmid Hribar [49]. In a good agreement with the findings of the present study, previous studies also demonstrated the benefit of low-impact agricultural practices for the reduction or possibly the termination of the decline of plant-available water [50,51].
Depending on the water balance and the proximity of the groundwater table, the direction of water motion may differ temporally or seasonally. During the summer, according to matric potential data, capillary rise was common at all monitoring stations [30]. Such capillary rise-dominated periods were intermittently interrupted by intense infiltration events such as surface runoff and probably also through flow rates also intensified during heavy thunderstorms (e.g., 2 August 2019: 51.5 mm and 9 June 2022: 55.2 mm). Leitinger et al. revealed the marked influence of the slope gradient on the distribution of SM along the hillslope in the Eastern Alps [40]. They also found a significant influence of water balance and land management type on infiltration and surface runoff [40]. Their findings revealed the impact by cattle trampling and treading; however, at our pasture site, no grazing animals were kept.

5. Conclusions

The marked variations among the three study sites can be partially explained by the difference in land use types, whereas the contrast between 2019 and 2022 can be explained by the influence of water balance. The most stable behaviour was found for the natural grazing land in both years. Our hypothesis, however, according to which the ploughland should have demonstrated the worst moisture dynamics, was not proven, especially in 2022. This is likely attributed to the (i) spatial variability of water balance and (ii) crop type, as soybean forms a relatively dense canopy early in the growing season and harvesting is commonly timed to late September and early October in SW Hungary. Hence, evaporation loss from the soil due to direct irradiation is limited. A third possible reason for the observed variation among the three sites is the insufficient spatial resolution of field-monitored SM data.
Our result may be utilized by stakeholders in the field of agricultural and farming businesses especially under subhumid climates of the temperate zone.
Although tackling the challenges posed by drought is not a novel phenomenon in the Pannonian Basin, adaptation to altered climates is not just an option presently: it is crucial. Therefore, a long-term analysis of climatic trends and water budget is indispensable, similar to the site-specific differentiation and optimization of agriculture. The present study aimed at providing data for studies of this type and delivering a more accurate understanding of these processes with the aim to adjust ecosystem services at a local scale. The present study could be improved with analyses performed (i) under more controlled conditions, (ii) within a more restricted geographical area, (iii) using hydrologic models and (iv) estimating local water balances at a higher spatial resolution.

Author Contributions

Conceptualization, S.C.; methodology, S.Á.F.; formal analysis, N.S., E.P., A.C. and M.I.; investigation, S.Á.F.; data curation, G.N., S.C. and R.B.; writing—original draft preparation, S.C.; writing—review and editing, N.S., D.L., G.P., R.C., M.F. and S.Á.F.; visualization, N.S. and G.N.; project administration, D.L.; funding acquisition, D.L., R.C. and M.F. All authors have read and agreed to the published version of the manuscript.

Funding

The authors are grateful for the financial support from the National Research, Development and Innovation Office (NKFIH) within the framework of the Hungarian–Slovenian collaborative project “Possible ecological control of flood hazard in the hill regions of Hungary and Slovenia” (contract no SNN 125727) and within the framework of the program Excellence in Higher Education, Theme II. 3. (“Innovation for sustainable life and environment”). The study was financed by the project “Possible ecological control of flood hazard in the hill regions of Hungary and Slovenia” (SNN 125727; Slovenian Research Agency ARRS, N6-0070) and a research programme Geography of Slovenia (Slovenian Research Agency ARRS, P6-0101).

Institutional Review Board Statement

Not applicable.

Informed Consent Statement

Not applicable.

Data Availability Statement

Data are located on the University of Pécs data storage system (One Drive–Pécsi Tudományegyetem), which due to system safety issues are available upon request.

Conflicts of Interest

The authors declare no conflict of interest.

References

  1. IPCC 2013. Climate Change 2013: The Physical Science Basis. Summary for Policymakers. Intergovernmental Panel of Climate Change; Cambridge University Press: Cambridge, UK, 2013; 222p, Available online: https://www.ipcc.ch/site/assets/uploads/2018/03/WG1AR5_SummaryVolume_FINAL.pdf (accessed on 18 January 2023).
  2. Li, M.; Chu, R.; Islam, A.R.M.T.; Jiang, Y.; Shen, S. Attribution Analysis of Long-Term Trends of Aridity Index in the Huai River Basin, Eastern China. Sustainability 2020, 12, 1743. [Google Scholar] [CrossRef] [Green Version]
  3. Didovets, I.; Krysanova, V.; Bürger, G.; Snizhko, S.; Balabukh, V.; Bronstert, A. Climate change impact on regional floods in the Carpathian region. J. Hydrol. Reg. Stud. 2019, 22, 100590. [Google Scholar] [CrossRef]
  4. Fábián, S.Á.; Kovács, J.; Lóczy, D.; Schweitzer, F.; Varga, G.; Babák, K.; Lampért, K.; Nagy, A. Geomorphologic hazards in the Carpathian Foreland, Tolna County (Hungary). Stud. Geomorphol. Carpatho Balc. 2006, 11, 107–118. Available online: https://www.igipz.pan.pl/tl_files/igipz/ZGiHGiW/sgcb/sgcb_40/sgcb_40_07.pdf (accessed on 18 January 2023).
  5. Czigány, S.; Pirkhoffer, E.; Balassa, B.; Bugya, T.; Bötkös, T.; Gyenizse, P.; Nagyváradi, L.; Lóczy, D.; Geresdi, I. Villámárvíz mint természeti veszélyforrás a Dél-Dunántúlon. Földrajzi Közlemények 2010, 134, 281–298. Available online: https://www.foldrajzitarsasag.hu/downloads/foldrajzi_kozlemenyek_2010_134_evf_3_szam.pdf (accessed on 18 January 2023).
  6. Lóczy, D.; Czigány, S.; Pirkhoffer, E. Flash Flood Hazards. In Studies on Water Management Issues; Kumarasamy, M., Ed.; InTech: Rijeka, Croatia, 2012; pp. 27–52. [Google Scholar] [CrossRef] [Green Version]
  7. Lukić, T.; Micić Ponjiger, T.; Basarin, B.; Sakulski, D.; Gavrilov, M.; Marković, S.; Zorn, M.; Komac, B.; Milanović, M.; Pavić, D.; et al. Application of Angot precipitation index in the assessment of rainfall erosivity: Vojvodina Region case study (North Serbia). Acta Geogr. Slov. 2021, 61, 123–153. [Google Scholar] [CrossRef]
  8. Grobicki, A.; MacLeod, F.; Pischke, F. Integrated policies and practices for flood and drought risk management. Water Policy 2015, 17, 180–194. [Google Scholar] [CrossRef]
  9. Ferk, M.; Ciglič, R.; Komac, B.; Lóczy, D. Management of small retention ponds and their impact on flood hazard prevention in the Slovenske Gorice Hills. Acta Geogr. Slov. 2020, 60, 107–125. [Google Scholar] [CrossRef]
  10. European Commission. A Guide to Support the Selection, Design and Implementation of Natural Water Retention Measures in Europe: Capturing the Multiple Benefits of Nature-Based Solutions; European Commission: Brussels, Belgium, 2014; 98p, Available online: http://www.ecrr.org/Portals/27/Publications/NWRMpublication.pdf (accessed on 18 January 2023).
  11. Castellini, M.; Iovino, M. Pedotransfer functions for estimating soil water retention curve of Sicilian soils. Arch. Agron. Soil Sci. 2019, 65, 1401–1416. [Google Scholar] [CrossRef]
  12. Fisher, B.; Turner, K. Ecosystem services: Classification for valuation. Biol. Conserv. 2008, 141, 1167–1169. [Google Scholar] [CrossRef]
  13. Haines-Young, R.; Potschin, M. Common International Classification of Ecosystem Services (CICES): 2011 Update; European Environment Agency: London, UK, 2011; 17p, Available online: https://cices.eu/content/uploads/sites/8/2009/11/CICES_Update_Nov2011.pdf (accessed on 18 January 2023).
  14. Dezső, J.; Lóczy, D.; Salem, A.M.; Nagy, G. Floodplain Connectivity. In The Drava River: Environmental Problems and Solutions; Lóczy, D., Ed.; Springer International Publishing: Cham, Switzerland, 2019; pp. 215–230. [Google Scholar] [CrossRef]
  15. Lóczy, D. Hydromorphological-Geoecological Foundations of Floodplain Management: CaseS from Hungary; Lambert Academic Publishing: Saarbrücken, Germany, 2013; 382p. [Google Scholar]
  16. Horel, Á.; Zsigmond, T.; Farkas, C.; Gelybó, G.; Tóth, E.; Kern, A.; Bakacsi, Z. Climate Change Alters Soil Water Dynamics under Different Land Use Types. Sustainability 2022, 14, 3908. [Google Scholar] [CrossRef]
  17. Abdelkadir, A.; Yimer, F. Soil water property variations in three adjacent land use types in the Rift Valley area of Ethiopia. J. Arid Environ. 2011, 75, 1067–1071. [Google Scholar] [CrossRef]
  18. Jakab, G.; Németh, T.; Csepinszky, B.; Madarász, B.; Szalai, Z.; Kertész, Á. The influence of short term soil sealing and crusting on hydrology and erosion at Balaton Uplands, Hungary. Carpathian J. Earth Environ. Sci. 2013, 8, 147–155. [Google Scholar]
  19. Saeidi, S.; Grósz, J.; Sebők, A.; Barros, V.D.d.; Waltner, I. Analysis results of land-use and land cover changes of Szilas catchment from 1990. Tájökológiai Lapok 2019, 17, 265–275. [Google Scholar] [CrossRef]
  20. Hota, S.; Mishra, V.; Mourya, K.K.; Giri, K.; Kumar, D.; Jha, P.K.; Saikia, U.S.; Prasad, P.V.V.; Ray, S.K. Land use, landform, and soil management as determinants of soil physicochemical properties and microbial abundance of Lower Brahmaputra Valley, India. Sustainability 2022, 14, 2241. [Google Scholar] [CrossRef]
  21. Fu, B.; Wang, J.; Chen, L.; Qui, Y. The effects of land use on soil moisture variation in the Danangou catchment of the Loess Plateau, China. Catena 2003, 54, 197–213. [Google Scholar] [CrossRef]
  22. Jørgensen, D.; Jørgensen, F.A. Aesthetics of energy landscapes. Environ. Space Place 2018, 10, 1–14. [Google Scholar] [CrossRef]
  23. Peng, S.H.; Han, K.T. Assessment of aesthetic quality on soil and water conservation engineering using the scenic beauty estimation method. Water 2018, 10, 407–422. [Google Scholar] [CrossRef] [Green Version]
  24. European Commission. Directive 2000/60/EEC. Establishing a framework for community action in the field of water policy. Off. J. Eur. Communities Luxembg. 2000, L327, 1–71. [Google Scholar]
  25. European Commission. Ecoflood Guidelines: How to Use Floodplains for Flood Risk Reduction; Office for Official Publications of the European Communities: Luxembourg, 2006; 144p. [Google Scholar]
  26. European Commission. Directive 2007/60/EC of the European Parliament and of the Council on the assessment and management of flood risks. Off. J. Eur. Union L 2007, 288, 27–34. [Google Scholar]
  27. Horel, Á.; Tóth, E.; Gelybó, G.; Kása, I.; Bakacsi, Z.; Farkas, C. Effects of Land Use and Management on Soil Hydraulic Properties. Open Geosci. 2015, 1, 742–754. [Google Scholar] [CrossRef]
  28. Haghighi, F.; Gorji, M.; Shorafa, M. A study of the effects of land use changes on soil physical properties and organic matter. Land Degrad. Dev. 2010, 21, 496–502. [Google Scholar] [CrossRef]
  29. Sławiński, C.; Cymerman, J.; Witkowska-Walczak, B.; Lamorski, K. Impact of diverse tillage on soil moisture dynamics. Int. Agrophys. 2012, 26, 301–309. [Google Scholar] [CrossRef]
  30. Nagy, G.; Lóczy, D.; Czigány, S.; Pirkhoffer, E.; Fábián, S.Á.; Ciglič, R.; Ferk, M. Soil moisture retention on slopes under different agricultural land uses in hilly regions of Southern Transdanubia. Hung. Geogr. Bull. 2020, 69, 263–280. [Google Scholar] [CrossRef]
  31. Tang, M.; Li, W.; Gao, X.; Wu, P.; Li, H.; Ling, Q.; Zhang, C. Land use affects the response of soil moisture and soil temperature to environmental factors in the loess hilly region of China. PeerJ 2022, 10, e13736. [Google Scholar] [CrossRef] [PubMed]
  32. Wang-Erlandsson, L.; Ent, R.J.; Gordon, L.J.; Savenije, H.H.G. Contrasting roles of interception and transpiration in the hydrological cycle—Part 1: Temporal characteristics over land. Earth Syst. Dynam. 2014, 5, 441–469. [Google Scholar] [CrossRef] [Green Version]
  33. Niu, C.Y.; Musa, A.; Liu, Y. Analysis of soil moisture condition under different land uses in the arid region of Horqin sandy land, northern China. Solid Earth 2015, 6, 1157–1167. [Google Scholar] [CrossRef] [Green Version]
  34. Pálfai, I. Az aszály definíciói, befolyásoló tényezői és mérőszámai. (Definition, influencing factors and indices of drought). In Belvizek és Aszályok Magyarországon (Inland Excess Water and Drought in Hungary); Pálfai, I., Ed.; Hidrológiai Tanulmányok: Budapest, Hungary, 2004; pp. 255–263. [Google Scholar]
  35. Thornthwaite, C.W. A contribution to the report of the committee on transpiration and evaporation. Trans. Am. Geophys. Union 1944, 25, 686–693. [Google Scholar]
  36. Thornthwaite, C.W. A re-examination of the concept and measurement of potential evapotranspiration. John Hopkins Univ. Publ. Climatol. 1954, 7, 200–209. [Google Scholar]
  37. Kocsis, T.; Anda, A. Microclimate simulation of climate change impacts in a maize canopy. Időjárás 2006, 116, 109–122. [Google Scholar]
  38. Emerson, C.H.; Welty, C.; Traver, R.G. Watershed-scale evaluation of a system of storm water detention basins. J. Hydrol. Eng. 2005, 10, 237–242. [Google Scholar] [CrossRef]
  39. Davis, A.P.; Hunt, W.F.; Traver, R.G.; Clar, M. Bioretention technology: Overview of current practice and future needs. J. Environ. Eng. ASCE 2009, 135, 109–117. [Google Scholar] [CrossRef]
  40. Leitinger, G.; Tasser, E.; Newesely, C.; Obojes, N.; Tappeineret, U. Seasonal dynamics of surface runoff in mountain grassland ecosystems differing in land use. J. Hydrol. 2010, 385, 95–104. [Google Scholar] [CrossRef]
  41. Syrbe, R.-U.; Grunewald, K. Restrukturierungsbedarf für regionaltypische Landschaftselemente und Biotopstrukturen am Beispiel Sachsens. Nat. Und Landsch. 2013, 88, 103–111. [Google Scholar] [CrossRef]
  42. Wang, S.; Fu, B.; Gao, G.; Liu, Y.; Zhou, J. Responses of soil moisture in different land cover types to rainfall events in a re-vegetaion catchment area of the Loess Plateau, China. Catena 2013, 101, 122–128. [Google Scholar] [CrossRef]
  43. Zucco, G.; Brocca, L.; Moramarco, T.; Morbidelli, R. Influence of land use on soil moisture spatial–temporal variability and monitoring. J. Hydrol. 2014, 516, 193–199. [Google Scholar] [CrossRef]
  44. Výleta, R.; Danáčová, M.; Škrinár, A.; Fencík, R.; Hlavčová, K. Monitoring and assessment of water retention measures in agricultural land. Earth Environ. Sci. 2017, 95, 022008. [Google Scholar] [CrossRef] [Green Version]
  45. Juhos, K.; Czigány, S.; Madarász, B.; Ladányi, M. Interpretation of soil quality indicators for land suitability assessment—A multivariate approach for Central European arable soils. Ecol. Indic. 2019, 99, 261–272. [Google Scholar] [CrossRef]
  46. Wang, H.; Gao, J.E.; Zhang, S.L.; Zhang, M.J.; Li, X.H. Modeling the impact of soil and water conservation on surface and ground water based on the SCS and Visual MODFLOW. PLoS ONE 2013, 8, e79103. [Google Scholar] [CrossRef] [Green Version]
  47. Shi, D.; Tan, H.; Rao, W.; Liu, Z.; Elenga, H.I. Variations in water content of soil in apricot orchards in thewestern hilly regions of the Chinese Loess Plateau. Vadose Zone J. 2020, 19, e20034. [Google Scholar] [CrossRef]
  48. Tölgyesi, C.; Török, P.; Hábenczyus, A.A.; Bátori, Z.; Valkó, O.; Deák, B.; Kelemen, A. Underground deserts below fertility islands? Woody species desiccate lower soil layers in sandy drylands. Ecography 2020, 43, 848–859. [Google Scholar] [CrossRef]
  49. Ribeiro, D.; Šmid Hribar, M. Assessment of land-use changes and their impacts on ecosystem services in two Slovenian rural landscapes. Acta Geogr. Slov. 2019, 59, 143–160. [Google Scholar] [CrossRef] [Green Version]
  50. Guerrero, B.; Amosson, S.; Nair, S.; Marek, T. The importance of regional analysis in evaluating agricultural water conservation strategies. J. Reg. Anal. Policy 2017, 47, 188–198. [Google Scholar] [CrossRef]
  51. Fuentes, J.P.; Flury, M.; Bezdicek, F.D. Hydraulic Properties in a Silt Loam Soil under Natural Prairie, Conventional Till, and No-Till. Soil Sci. Soc. Am. 2004, 68, 1679–1688. [Google Scholar] [CrossRef] [Green Version]
Figure 1. Location of the study sites on the digital elevation model (DEM) generated from a LiDAR survey. (a) Almamellék (pasture); (b) Boda (ploughland); (c) Palkonya-Villánykövesd (orchard).
Sustainability 15 04925 g001
Figure 2. Monthly precipitation totals from January to August in (a) 2019 and (b) 2022.
Sustainability 15 04925 g002
Figure 3. (a) PaDI and (b) aridity indices of 2019 and 2022.
Sustainability 15 04925 g003
Figure 4. Monthly precipitation totals (prcp), evapotranspiration (ET0) and aridity indices (AI) for the different sites (pasture, ploughland and orchard) of 2019 and 2022. Solid lines depict the value of AI = 1, dashed lines AI = 1.5 and dotted lines AI = 4 as a reference for humid (AI < 1), subhumid (1 ≤ AI ≤ 1.5), semiarid (1.5 ≤ AI ≤ 4) and arid (AI ≥ 4) conditions, respectively.
Sustainability 15 04925 g004
Figure 5. Soil moisture dynamics of the study sites (first column ploughland, middle column pasture and right column orchard) in the summers of 2019 (1st and 3rd rows) and 2022 (2nd and 4th rows), for (af) 10 cm and (gl) 30 cm. The values on the right upper corners in subplots from (a) to (f) represent the precipitation amount during the summer (June to August).
Sustainability 15 04925 g005
Figure 6. Mean soil moisture values of the study sites in the summer of 2019.
Sustainability 15 04925 g006
Figure 7. Mean soil moisture values of the study sites in the summer of 2022.
Sustainability 15 04925 g007
Table 1. General geographical parameters of the three study sites.
Slope (°)
Village NameSite Area (ha)PositionEOV X (m)EOV Y (m)Elevation (m)MinMaxMean
Almamellék7.4Foothill556,430.490,123.7126.10.8517.46.19
Uphill556,590.790,108.8141.2
Boda16.32Foothill571,380.081,182.91750.026.482.63
Uphill571,518.281,322.1182.7
Palkonya6.85Foothill599,400.261,098.8112.63.099.75.92
Uphill599,407.461,201.5124.6
Table 2. Fine earth fractions and textural types of the soils of the monitoring sites.
Land UseDepth [cm]Slope PositionClay [%]Silt [%]Sand [%]Textural Type
Pasture10Uphill4.8895.020.10Silt
Pasture30Uphill4.5687.797.65Silt
Pasture10Foothill2.4872.5624.96Silt loam
Pasture30Foothill2.8764.5332.60Silt loam
Orchard10Uphill4.4386.569.01Silt
Orchard30Uphill6.6393.370.00Silt
Orchard10Foothill3.6886.979.35Silt
Orchard30Foothill4.0886.569.36Silt
Ploughland10Uphill1.2373.9526.05Silt loam
Ploughland30Uphill0.7569.2430.76Silt loam
Ploughland10Foothill0.8072.1027.90Silt loam
Ploughland30Foothill1.2175.6724.33Silt loam
Table 3. Precipitation totals [mm] for the periods of January to August and June to August, 2019 and 2022.
Land Use20192022
1–86–81–86–8
Pasture469.7187.4390180
Ploughland466.7185.3310.4163
Orchard516.7265.3231.7115
Table 4. Mean annual, growing season (April–October), spring (March to May), summer (June to August) and autumn (September to November) temperatures [°C] in 2019 and 2022.
Land UseAnnualGrowing SeasonSpringSummerAutumn
2019202220192022201920222019202220192022
Ploughland12.1712.2917.418.111.211.422.2823.3112.711.5
Orchard12.6612.8117.818.511.711.822.6923.6013.312.2
Pasture12.0212.1817.117.81111.321.9122.8912.511.5
Table 5. Summary statistics of the annual, growing season (April–October) and seasonal (spring, summer, autumn and winter. Seasons are the same as in Table 4, and the winter periods have been selected as the following: 2018/2019: December 2018–February 2019 and 2021/2022: December 2021–February 2022 mean of aridity index (AI), precipitation (P) and evapotranspiration (ET0).
AnnualGrowing SeasonSpringSummerAutumnWinter
20192022201920222019202220192022201920222018/20192021/2022
Pasture
P59.562.267.779.676.773.962.56059.390.822.744.5
ET058.960.490.895.950.654.8130.1137.249.643.7--
AI1.21.41.72.11.10.82.33.81.20.6--
Ploughland
P57.551.466.854.870.964.861.854.35469.129.441.3
ET059.661.192.397.650.954.9132.5140.250.143.7--
AI1.21.71.82.71.01.42.73.81.11.2--
Orchard
P60.143.879.247.367.941.388.438.35272.618.433.0
ET060.962.593.999.052.356.2134.8141.751.245.4--
AI1.21.81.32.82.21.71.54.01.11.3--
Disclaimer/Publisher’s Note: The statements, opinions and data contained in all publications are solely those of the individual author(s) and contributor(s) and not of MDPI and/or the editor(s). MDPI and/or the editor(s) disclaim responsibility for any injury to people or property resulting from any ideas, methods, instructions or products referred to in the content.

