Article

Characterization Methods of Ions and Metals in Particulate Matter Pollutants on PM2.5 and PM10 Samples from Several Emission Sources

1
Grupo de Investigación y Laboratorio de Monitoreo Ambiental—GLIMA, Universidad de Antioquia UdeA, Calle 70 N°. 52-21, Medellin 050010, Colombia
2
CCComposites Laboratory, Universidad de Antioquia UdeA, Calle 70 N°. 52-21, Medellín 050010, Colombia
*
Author to whom correspondence should be addressed.
Sustainability 2023, 15(5), 4402; https://doi.org/10.3390/su15054402
Submission received: 3 January 2023 / Revised: 22 February 2023 / Accepted: 22 February 2023 / Published: 1 March 2023
(This article belongs to the Special Issue Air Pollution Management and Environment Research)

Abstract

:
This research investigated the current methods of characterization of ions and metals in particulate matter pollutants from different emission sources. The study was conducted through the Proknow-C methodology, in which a portfolio that includes scientific and review articles was selected. The document addresses different methodologies currently used to quantify diverse ions and metals (IIMM) found in particulate matter (PM), specifically focused on PM10 and PM2.5. The investigation was made going through the types of filters used to capture the pollutant, the equipment and the corresponding characterization techniques. Results show the Proknow-C method is a reliable way to analyze PM pollution research, revealing the state of art for metals and ions types, characterization technologies, current situations and trends. Sulfate, nitrate, and ammonium ions are found in concentrations between 70 and 80% of the PM. Among the main metals found are chromium, nickel, lead, cadmium, iron, manganese, coper, and zinc. The main detection method found in the studied research was inductively coupled plasma mass spectrometry. It was also found that geographic information systems are a good tool for integrating special data with PM and air pollution, which could accelerate the diagnosis and thus the actions to give solution to the problem.

1. Introduction

Air pollution refers to the presence of harmful substances in the atmosphere in quantities that can be detrimental to human health and ecosystems [1,2,3]. It is related to emissions generated by industry [4,5], rapidly developing economic areas [6,7], vehicular emissions [8], and to adverse climatic conditions [9]. The main sources of pollution of human origin are waste burning in rural areas, mining and quarrying, manufacturing, chemical industry, oil refining, combustion engines and incinerators, urban transport, and energy production [10]. Pollutants actively intervene in the physics and chemistry of the atmosphere in processes such as cloud formation or radioactive balance [5,6,11], which also change the conditions of other environmental actors even altering the hydrological cycle [12]. Meteorological conditions such as climate [11], wind speed and direction [13], and precipitation levels [14], play an important role in the formation, transport, diffusion, and removal of atmospheric pollutants [2]. The atmosphere is one of the components of the environment most susceptible to the human activities [15].
Particulate matter (PM), also known as atmospheric aerosol or airborne dust [16], liquid or solid, which is a pollutant that contributes to environmental damage [17,18,19]. It directly influences the formation of haze [6,17,18,20] and ecological impacts [8], greenhouse effect, and climate change [8,12,17]. PM concentrations are used as an indicator of air quality [7]. PM can be transported through the air for extremely long distances [21] and stay suspended for long times [10]. It is a complex pollutant of not specific chemical and physical composition [22,23], may consist on carbon compounds [12,24], ions [23,25,26], metals [27,28,29], hydrocarbons [30,31,32], among others [10,33,34]. Moreover, its composition may change over time according to the characteristics of the region [35]. PM is classified according its size into PM10 and PM2.5 (aerosol which aerodynamic diameter is less than 10 µm and 2.5 µm, respectively) [27,36]. Depending on their origin, these can be classified as primary (direct emission of particles as such into the atmosphere) or secondary (generated in the atmosphere due to transformations of gases into particles) particles [37]. The characterization of these pollutants provides information about their chemical components, their origin, and emission sources. The composition of the PM10 and PM2.5 samples will depend from the specific area where the sample is taken.
PM is widely investigated for negative environmental effects [38,39]. It’s generated by several emission sources such as biomass burning [14], traffic [8], wildfires [40], industrial processes, and natural sources [41]. Wildfires contribute to particulate matter pollution worldwide, but more intensively in some areas such as California (USA) [42] and in the Amazonia region (mainly in Brazil, Perú, and Colombia). These fumes from wildfires have been shown to be toxic for lung macrophages [43], very critical for the human health because these cells surround and destroy microorganisms, eliminate dead cells, and stimulates other cells that contribute to the immune system.
PM is also investigated because it is a hazard for the human health [44,45,46]. These particles can be inhaled and enter the lungs causing harmful health effects [6], while finer particles may reach the alveolar region of the lungs [47,48]. The negative effects of PM10 and PM2.5 depend on their complexity and variation of parameters, which include: particle size, heterogeneity, chemical composition, type of origin of the particle, pH, and solubility. Furthermore, depending on their concentration, exposure time, and toxicity, they can be lethal or cause major health problems in the short or long term. [16]. In addition, the mentioned characteristics may change over the time and with different weather conditions [41].
As an example of climatic conditions, in Medellin, Colombia, the geographical feature of mountains valley limits the dispersion of air pollution [14]. The unique shape of the valley, resembling a bowl, impedes the flow of wind and causes the accumulation of pollutants in the air. This phenomenon is especially pronounced during thermal inversion, when cold air from the surrounding mountains is held in place by a layer of warm air, creating a lid-like effect [4]. Figure 1a shows a typical emission source, while Figure 1b,c show two different city views with PM pollution at Medellin.
Pollution in urban environments is one of the biggest challenges that exist today. PM negatively influences climate change, air quality, and consequently the health of human beings [49]. In 2016, about 4.2 million deaths worldwide were attributed to air pollution [50]. The main effects that PM causes on health are related not only to respiratory and cardio-vascular problems, but also to damage to multiple organs and tissues [35]. Due to the above, it is considered that this contaminant is linked to morbidities and premature deaths [28]. PM10 is also known as the respirable fraction of PM, which is one of the main causes of health problems around the world due to the presence of toxic compounds in its composition, and to the ability to lodge in the lung tissues [51]. However, it has been observed that finer particles (PM2.5) can be more dangerous than PM10 since they can penetrate the alveolar region of the lungs [28]. Depending on their origin, these can be classified as primary (direct emission of particles as such into the atmosphere) or secondary (generated in the atmosphere due to transformations of gases into particles) particles [37].
PM is not the only environmental problem in Latin-America: the lack of appropriate regulations or law enforcements, and the lack of investment in circular economy aggravate the situation. However, some initiatives applied in Colombia and other countries are trying to change the trend of the region particularly in recycling solutions [52,53,54], education [55], and circular economy [56,57]. All these efforts could motivate the government to take difficult decisions to give solution to the PM contamination.
The goal of this article is to understand the current state regarding the characterization of ions and metals in PM10 and PM2.5 samples. Some of the most common methodologies for sampling, analysis, and source detection for these metal species are included as well. The search keywords were carefully selected to find the characterization methods associated with metals and ions in particulate matter, also detailing PM10 and PM2.5, and some of the most known technologies, but not limited to: AAS: Atomic absorption spectroscopy, ICP: induction plasma spectrometry, IC: ion chromatography, WSIS: Water-soluble ions. The filters and its associated technology are important to understand is limitations and advantages as well, now that pollution tests are more demanded worldwide, possibly requiring a new generation of them.

1.1. The Main Technologies

There are several important techniques used for the characterization of metals and ions in PM. Next, it is summarized the main technologies used for PM investigation.
Atomic Absorption Spectrometry is based on the light absorption by the atoms of the sample [58]. The amount of light that is absorbed by the atoms in the sample is measured, whose intensity is directly related to the concentration of the element in the sample. It is used to measure the concentration of elements in a sample. Ion Chromatography is a separation technique [59], based on the interaction of ions in a sample with a chromatographic column. The sample is injected onto the column and the components are separated based on their affinity for the column and their electrical charge. This technique is used to separate and identify components of a complex sample. Inductively coupled plasma mass spectroscopy is an ionization technique used to convert compounds into ions for further materials analysis [60]. A plasma is generated in a chamber and used to ionize the compounds in the sample. The generated ions can be analyzed with techniques such as mass spectrometry, chromatography, liquid chromatography, or X-ray diffraction for valuable information about the composition, structure, and properties of the materials [61]. Voltammetry is used to study the transfer of electrons in an electrochemical system. This is based on the measurement of the electrical current that flows through an electrochemical system in response to a change in electrical potential. It is used to determine the concentration of electroactive compounds in a solution and to characterize the electrochemical properties of materials. Liquid chromatography is a separation technique used to separate compounds in a solution [62]. The sample is injected into a column that contains an adsorbent material, where the compounds are separated on the column based on their affinity for the adsorbent material and their flow rate through the column. It is widely used for the analysis of complex compounds. X-ray diffraction is a characterization technique used to identify the crystalline structure of materials [63]. It allows the identification of complex crystalline structures and the detection of impurities in materials. It is a versatile technique and can be used to analyze a wide range of samples. Neutron activation is a technique used for the characterization of metals and their elemental composition [64], based on bombarding a metal sample with neutrons, which results in the formation of radioactive isotopes. These isotopes emit gamma radiation, which can be detected and analyzed to determine the chemical composition of the sample.

1.2. The Filters

The correct selection of the type of filter ensure the completeness and accuracy of results obtained in PM10 and PM2.5 sampling. The main filters used are presented below, classified by their constitutive materials.
The fiberglass filter is a strong and durable, ideal for sampling in harsh environments [65]. However, it could release glass fiber particles into the sample during the filtration process, which can affect the integrity of the sample and lead to erroneous results in the subsequent analysis. Polyurethane foam is lightweight and inexpensive, commonly used elsewhere [66]. One limitation is that it can be quite porous and not retain all the particles in the sample, which can result in loss of information and inaccurate results. Quartz filter is inert and thus, it does not affect the composition of the sample [67], making it ideal for sampling sensitive chemicals. It could be more expensive than other filters, limiting their use in some regions. Teflon filter is resistant to high temperatures and corrosion, making it suitable for sampling in harsh environments [68]. However, it can also be more expensive when compared to others, and potentially contaminate the sample with Teflon particles during the filtration process. Aluminum filter is cheap and available elsewhere [69], but it can be sensitive to corrosion therefore reacting with certain components of the sample [70]. Polycarbonate filter is ductile and strong, making it suitable for sampling in environments durability is required. However, it can also be prone to damaging the integrity of the sample. Biofilters such as tree leaves are a natural and affordable material [71], but they are non-uniform materials affecting the effectiveness in the filtration process.
Therefore, the best filter for sampling PM10 and PM2.5 depends on many factors, including the environment, costs, and measurement accuracy requirements. In general, teflon and quartz filters are considered the most suitable for sampling PM10 and PM2.5 due to their inertness and resistance to corrosion, which reduces the possibility of sample contamination. However, it is recommended to conduct a detailed evaluation depending on the specific filter application.

2. Methods

The instrument of intervention Knowledge Development Process—Constructivist (ProKnow-C), was used in this research to undertake an analysis of the characteristics of the publications. The ProKnow-C was developed from 1994 by the Laboratory of Constructivist Decision Aid Methodologies (LabMCDA-C), of the Federal University of Santa Catarina [72]. The methodology is divided into two steps: data collection and information analysis:

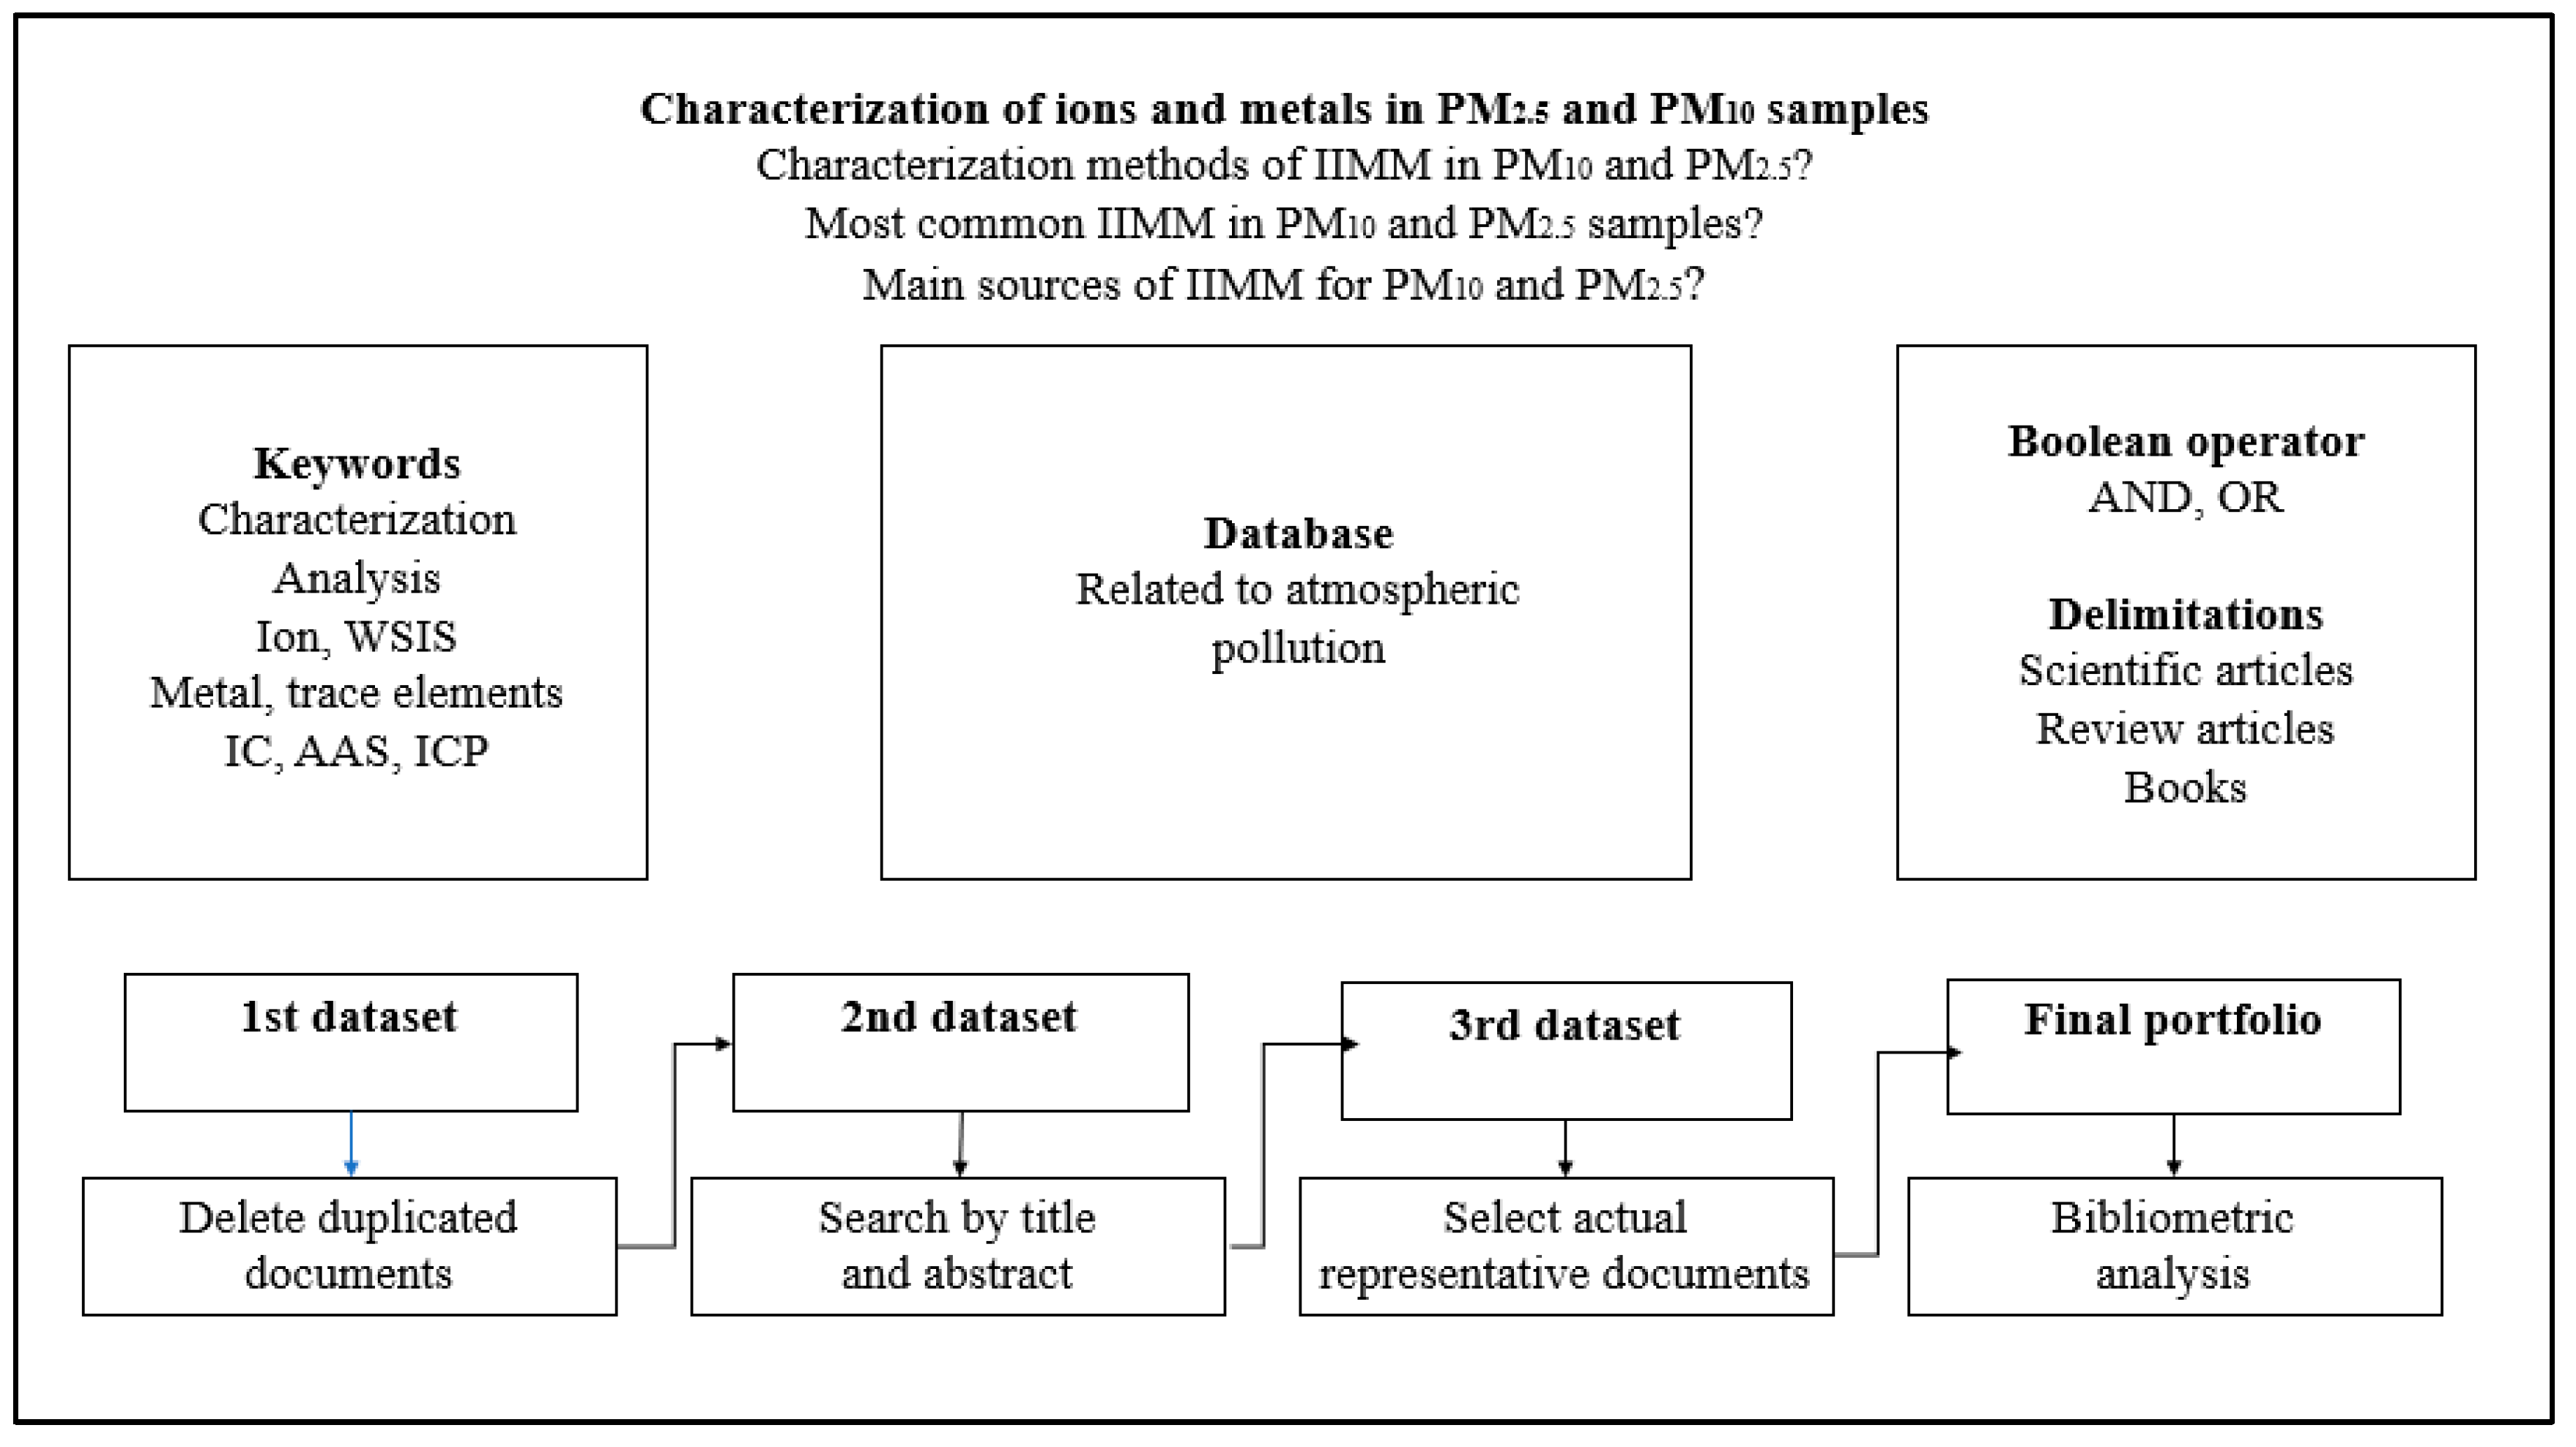
2.1. Data Collection

The development of this step is about selecting a representative fragment of the literature relative to the “Characterization of metal and ions in PM10 and PM2.5”, addressed both in theoretical and empirical research. Thus, for conducting this research, the methodology used is based on a structured selection and analysis of literature of the area, aiming the construction of knowledge on a particular subject, following a constructivist view. This allows a critical analysis of the bibliographic portfolio (BP). The selection of the BP was performed searching the commands of the Table 1 in the international databases of research, commands selected after analyze target questions, keywords, and thesaurus.
The procedure to obtain the final portfolio of documents begins with the target questions that allow summarizing the subject to be investigated. Subsequently, keywords and boolean operators were selected to build search commands, the databases in which the information will be searched are selected and the delimitations are established as needed. When searching for the commands in the databases, an initial portfolio of 3542 documents (scientific articles, review articles, and books) were obtained. Using a bibliographic manager such as Mendeley, the repeated documents were eliminated, while a second portfolio of 1121 was obtained, from which the relevant information is selected by its abstract and/or title. After this step an amount of 103 documents obtained, and deeply analyzed. Finally, it was found that the most important articles are 41, being the center of the analysis. The processes made in the step one is resumed in the Figure 2.

2.2. Information Analysis
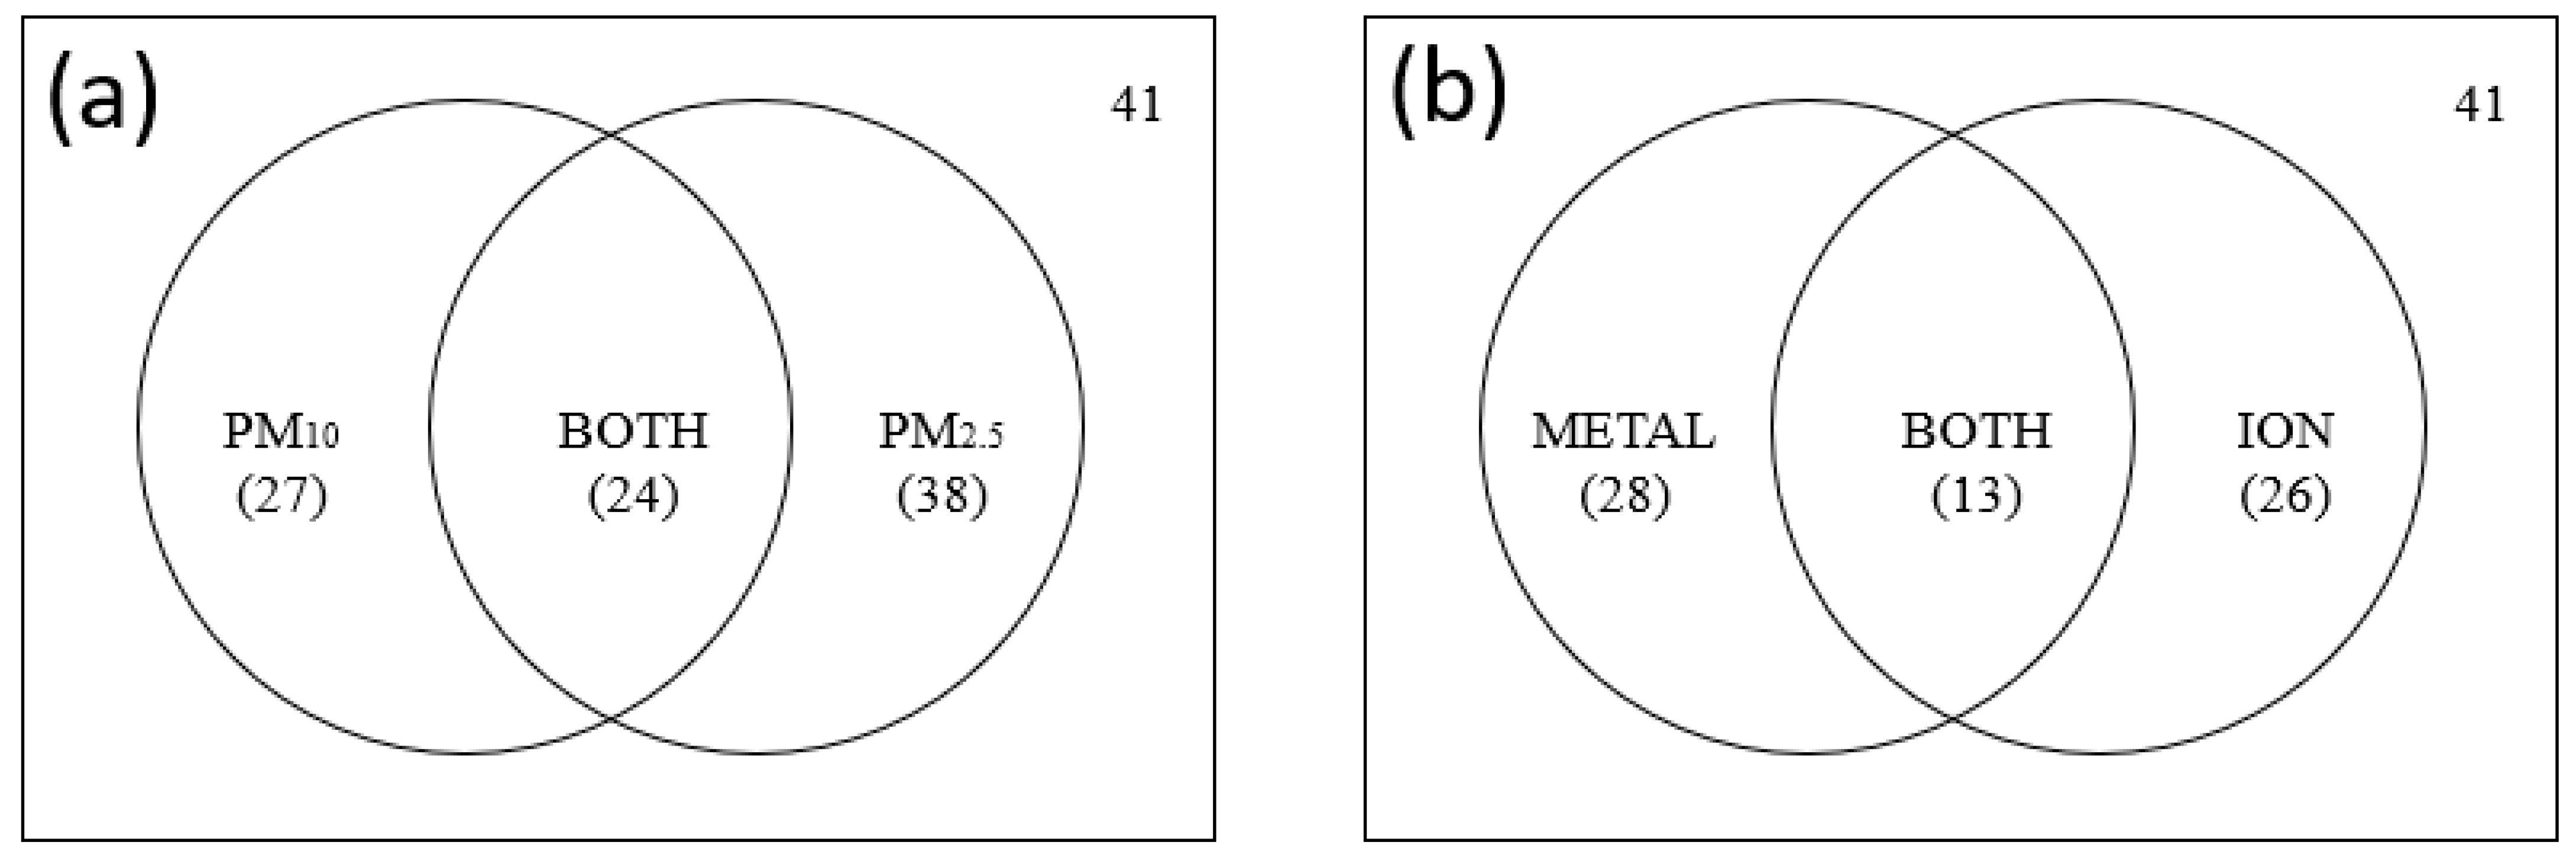
After the selection of the articles which composed the BP, they were analyzed in 4 main points: (I) Identification of most representative articles. (II) Principal instruments of sampling, to analyze the material of the filters, the devices used to catch the pollutant, and the different kind of methodologies carried out to get the samples. (III) Characterization of IIMM, that include all the different techniques used to measure the concentration of IIMM, the conservation and preparation of the samples. And (IV), the main species found, which are the main IIMM in PM10 and PM2.5 samples, which are the most characterized.

3. Results

After selecting the documents of interest through the methodology, a total of 41 relevant articles were chosen to be analyzed in the bibliographic portfolio, later used as the basic references in the analysis. It was found that there is a wide variety of filter materials to collect samples of PM10 and PM2.5 pollutants. These include quartz [73], fiberglass, Teflon, aluminum, polyurethane, and even studies that have used biofilters, such as Malaleuca leaves [51]. Even special bags are used for pollutant collection [74]. There is no specific differentiation for filter selection according to the pollutant to be collected and measured, nor is there a differentiation in the choice of filter to characterize ions or metals. In fact, in some studies, different fractions of the same filter are used to perform characterization of ions and metals. Regarding the collection equipment, high, medium and low volume devices were found. There are even devices that perform the characterization of pollutants automatically, such as optical counters [75]. Also, acid digestion is used to extract contaminants from the filters.
A total of 41 metals were found in these papers: Aluminum (Al), Barium (Ba), Beryllium (Be), Cadmium (Cd), Calcium (Ca), Cerium (Ce), Cesium (Cs), Chromium (Cr), Cobalt (Co), Copper (Cu), Europium (Eu), Iron (Fe), Gallium (Ga), Gold (Au), Hafnium (Hf), Mercury (Hg), Magnesium (Mg), Manganese (Mn), Neodymium (Nd), Nickel (Ni), Potassium (K), Lead (Pb), Samarium (Sm), Scandium (Sc), Sodium (Na), Silver (Ag), Strontium (Sr), Tantalum (Ta), Terbium (Tb), Thallium (Tl), Thorium (Th), Tin (Sn), Titanium (Ti), Tungsten (W), Uranium (U), Vanadium (V), Ytterbium (Yb), Zinc (Zn), and Zirconium (Zr). On the other hand, 11 ions were characterized: Calcium (Ca+2), Magnesium (Mg+2), Sodium (Na+), Potassium (K+), Ammonium (NH4+), Chloride (Cl), Sulfate (SO4−2), Nitrate (NO3), Nitrite (NO2), Fluoride (F), and Phosphate (PO4−3)
Figure 3a shows the number of papers of the BP that contains analysis by the type of filter, where the quartz filter stands out, followed by the glass fiber. Similar to Figure 3a, the analysis of the literature with respect to the characterization techniques is performed in Figure 3b, highlighting ion chromatography as the main technique for the characterization of ions. On the other hand, for the analysis of metals mass spectrometry and atomic absorption spectroscopy are the main ones. In Figure 3c, the most relevant metals for research (lead, cadmium, nickel, chromium and copper are the most studied) are shown; while in Figure 3d, the main ions are shown, highlighting the chloride, nitrate and sulfate anions; and the sodium and ammonium cations.
Figure 4a shows the number of papers found in the search classified by the species, as metals (28), ions (26) and both species (13). Figure 4b shows the number of documents involving PM10 (27), PM2.5 (38), and both (24).

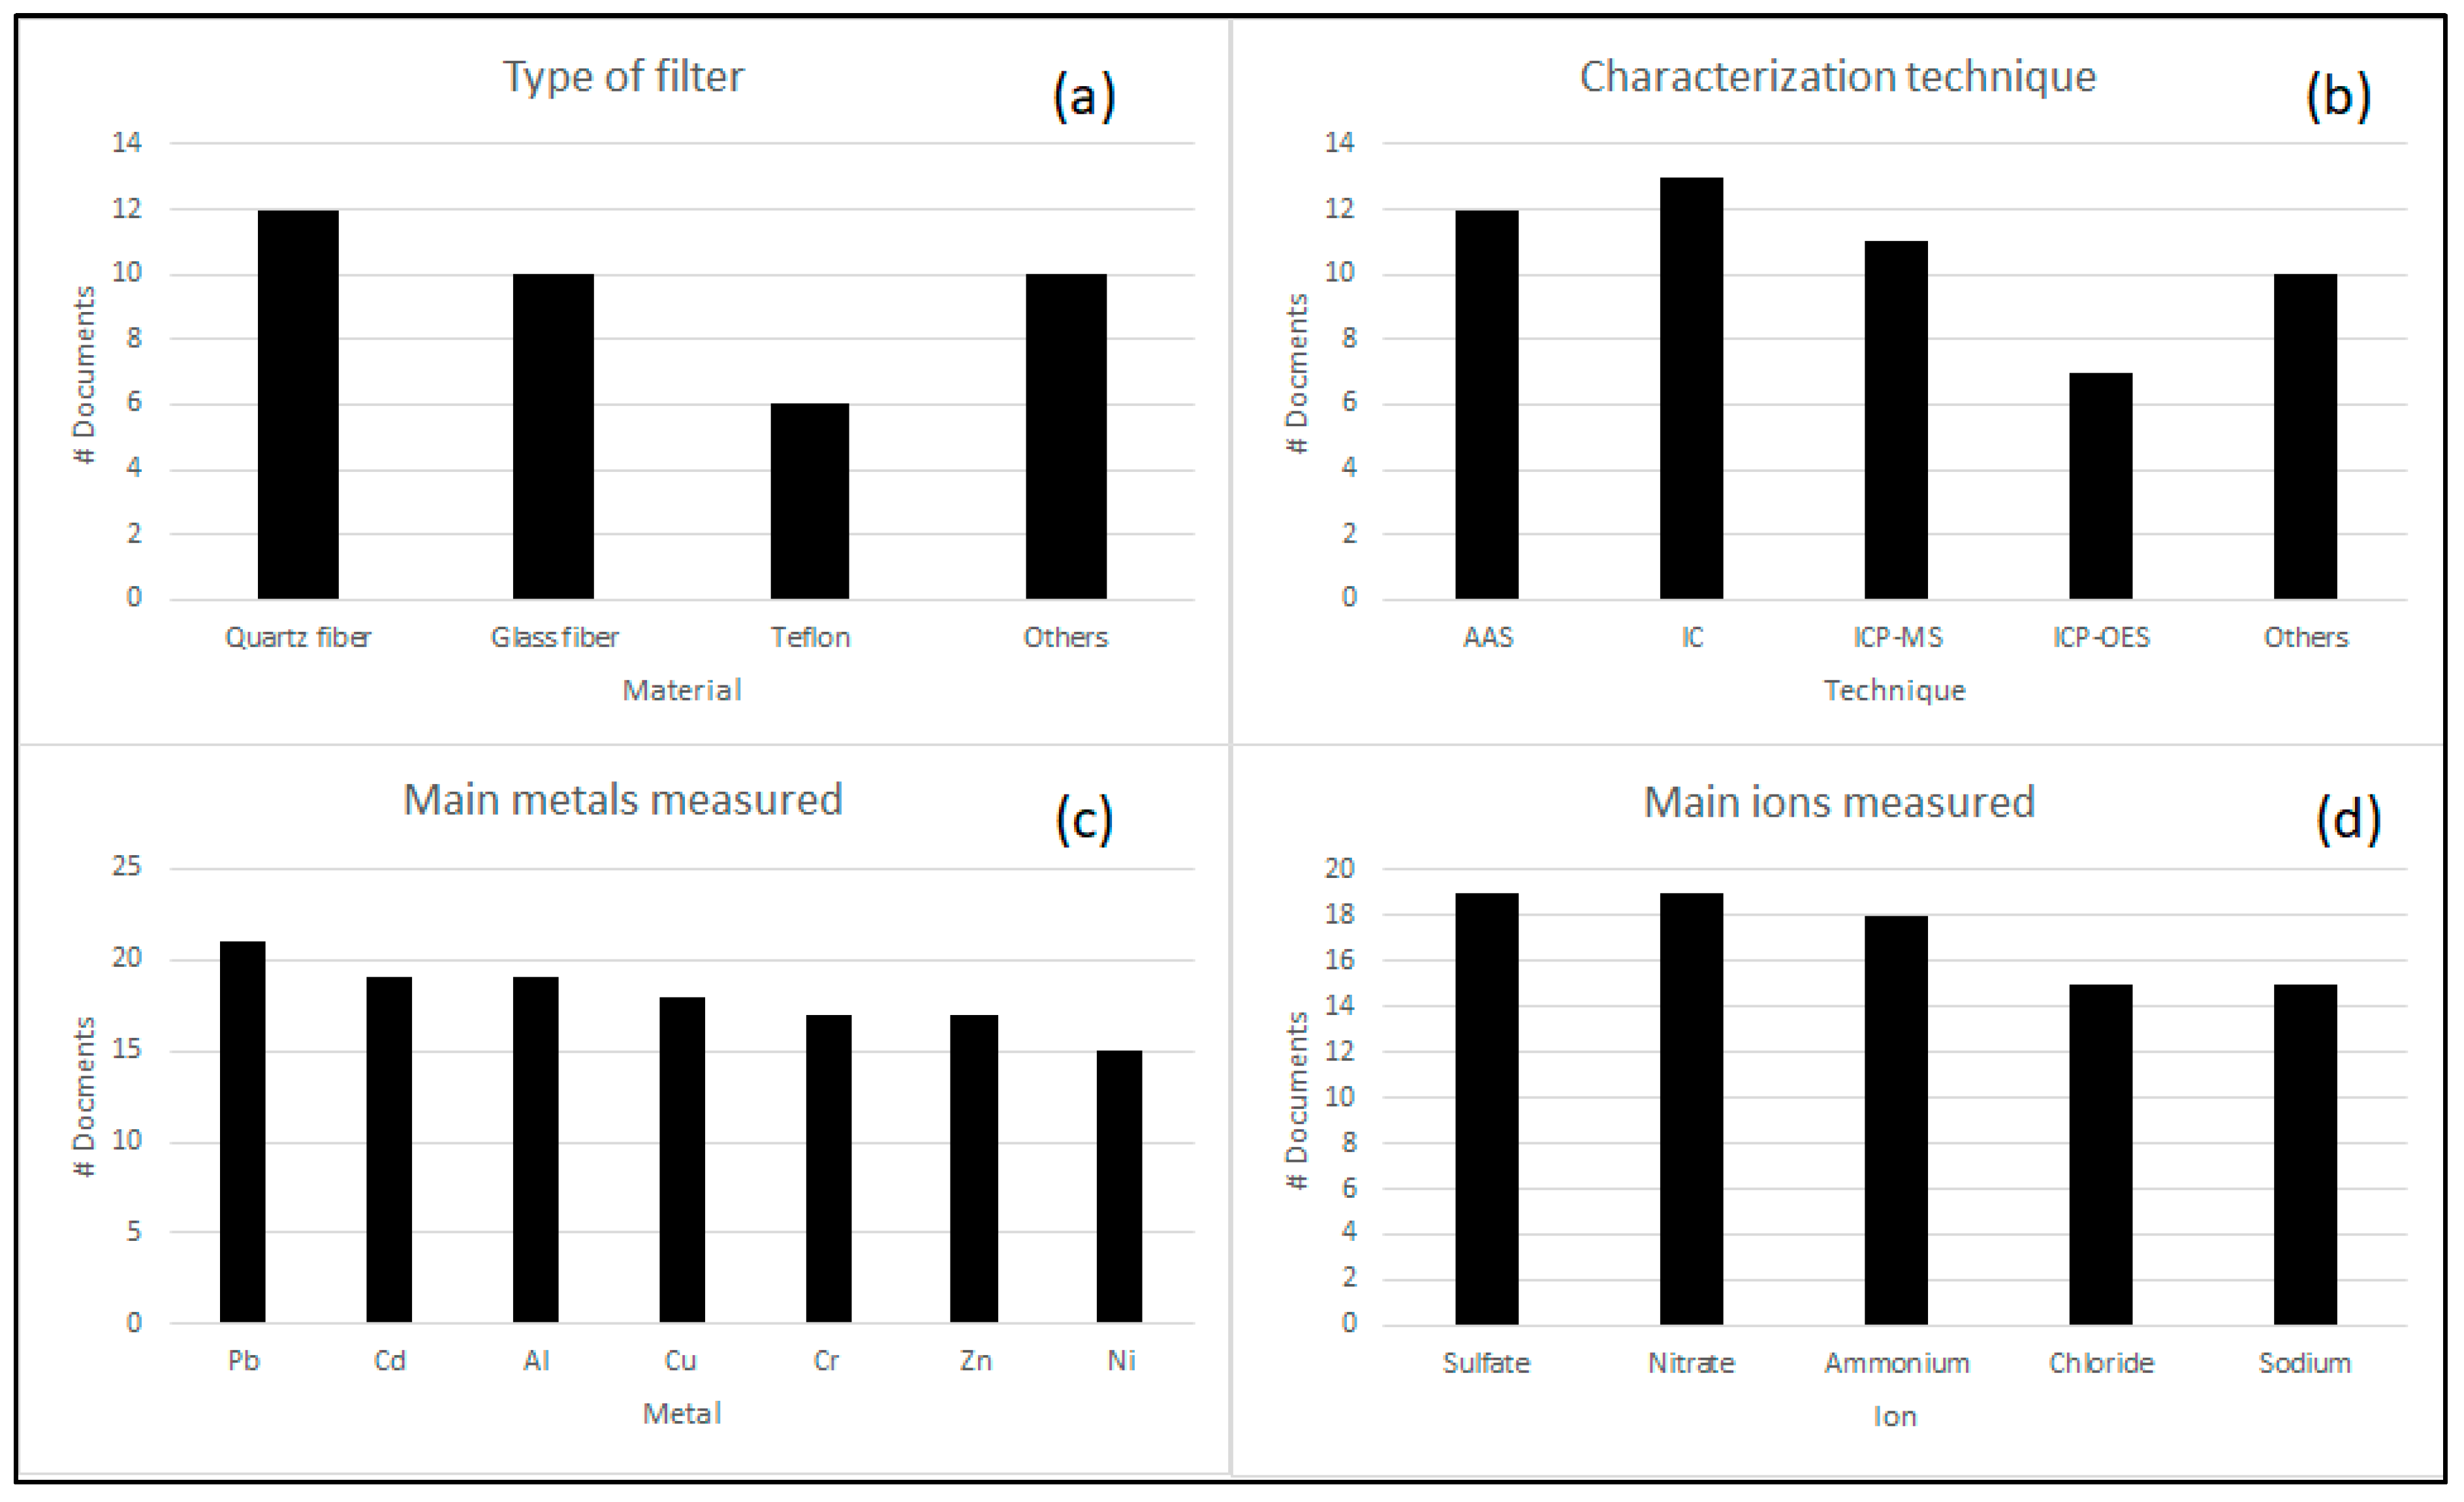
3.1. Filters Types and Parameters

It was found that quartz filters were the most used, followed by fiberglass, polyurethane, Teflon and aluminum filters. Other capture methods were analyzed as well, such as Tedlar bags or biofilters (such as Malaleuca leaves). Some documents are not specific with the type of filter used. Filters of different porosities were used, the preferred one being the 47 mm Whatman filter. It was determined that quartz, glass fiber, polyurethane, and Teflon filters, all used to capture PM10 and PM2.5 samples and to characterize both ions and metals. Table 2 shows the analysis of the physical characteristics of the filters.
Among the measuring devices, high-volume and low-volume collection samples of PM were found to be the preferred for researchers. Table 3 shows the characteristics of the collection devices according to the filter used. the pollutant extraction technique is also shown, where acidification with nitric acid (HNO3) and microwave extraction stand out.

3.2. Characterization Techniques

The methodologies for the characterization of IIMM range from the way in which the sample is taken, the collection de-vice, the characterization technique, and other parameters. Glass fiber, quartz, cellulose membrane, biofilters, and other filters can be used. The collection devices can be Hi-Vol, Med-Vol, Low-Vol, impactor, automatic, etc. As for the material extraction techniques, acid digestion is usually employed, although other alternatives exist, such as microwave extraction. Species analysis techniques are differentiated, where ion chromatography (IC) is commonly used to characterize ions, while atomic absorption spectroscopy (AAS) and induction plasma spectrometry (ICP) are used for metals.
Table 4 shows the characterization techniques used to analyze the chemical components of the filters of the study. For metals, the most commonly used techniques are AAS and ICP, while for ions IC is typically used. Table 4 also shows the methods used to characterize the samples, and the methodologies used to determine the emission sources, where principal component analysis and factorization matrices stand out. Finally, the chemical components found, the pollutant analyzed (PM10 or PM2.5), and the sampling period are described as well. Other methods to characterize metals found were Inductively coupled plasma atomic emission spectroscopy (ICP-AES), Inductively coupled plasma—optical emission spectrometry (ICP-OES), X-ray absorption spectroscopy (XAS), X-ray diffraction (XRD) and Neutron activation analysis (NAA). For ions, there are high performance liquid chromatography (HPL) and Ultraviolet–visible spectroscopy (UV-VIS).

4. Analysis and Discussion

PM is mainly composed of inorganic ions, mineral matter, and carbon compounds [75]. These compounds occupy between 40% to 50% of the mass composition in PM2.5. Metals occupy between 1% and 5%, and are subject of high scientific interest because they are highly related to the morbidities associated to PM [23]. The presence of metals in PM is mainly due to anthropogenic activities such as industrial production [89], vehicular emissions [76,77,89], or other origins [87,89]. Metallurgy is a source of metals such as Mn, Ni, Zn, Cr, Fe, Cu, Cd and Pb [90]; while construction industry is responsible for others such as Al, Cu, K Mg, and Ca. In places where large amount of Ni is found, more respiratory and cardiovascular diseases are reported [90]. The exposure to these metals can be dangerous even in small concentrations [83].
Among the selected articles, almost only ions that were soluble in water (WSIS) were found to be characterized, which is because they are the most relevant in the composition of PM [78]. The most studied ions are sulfate (SO4−2), nitrate (NO3) and ammonium (NH4+), likewise, the fraction of these ions occupy between 70–80% of the total concentration among the IS present in the PM [85]. Other important ions are: chloride (Cl), phosphate (PO43−) and fluoride (F) and the cations: calcium II (Ca+2), potassium (K+), sodium (Na+), and magnesium II (Mg+2).
There are different methodologies to measure PM emission sources. One of the outstanding one is to develop the positive matrix factorization algorithm (PMF) [28]. The United States protection agency (EPA) has established protocols that are used to adequately execute this methodology, see the EPA PMF 5.0 (Table 4 shows which articles use the method). Another way to determine the emission sources consist of the analysis of geographic information systems, mainly satellite images [78]. The chemical mass balance analysis (CMB) is used as well, a method that focuses on direct emission points, which does allow to determine the emission sources of secondary pollutants because they are formed in chemical processes that occur in the atmosphere [5]. Regardless of how emission sources are defined, the results highlight natural sources (suspension of crustal material, sea salts, volcanic eruptions, among others) and anthropogenic sources (automobile, industrial, agricultural, biomass burning, among others).
Regarding the emission sources, the nitrate, sulfate and ammonium ions come from their precursor gases (NOx, SO2, NH3) that are usually emitted in the combustion of coal, industrial and agricultural processes, the high concentrations of these ions in the PM directly affect the degradation of the visibility of the atmosphere [78].
Normally, sulfate occupies the largest fraction among IS [22]. Cl and Na+ come mainly from sea salts [29], although chlorine can also come from coal combustion, home heating, and industrial processes, such as steel alloying [77]. Calcium ions come from the suspension of natural dust or due to agricultural and construction activities. The concentrations of calcium are regularly related to those of magnesium [29]. F is normally low in terms of concentration, among its emission sources are coal combustion processes and brick manufacturing [27].
The metals that covered the most relevance in the studies investigated were: chromium (Cr), nickel (Ni), lead (Pb), cadmium (Cd), iron (Fe), manganese (Mn), copper (Cu), and zinc (Zn), among others. In most studies the metal with the largest fraction was iron. The fraction of metals in PM is usually low, found at a trace level in PM samples. Figure 3c lists the metals that were mostly characterized among the selected studies.
Thallium (Tl) is a toxic heavy metal, that event at low concentration is more hazardous to mammals than Pb, Hg or Cd [91]. One of the human-generated sources of Tl is the sulphide ores from the extraction process [92,93]. Beryllium can be found in the atmosphere as a result of soil particles being lifted and dispersed from typically open mines or areas near factories that process raw materials [94]. Sn compounds are present in limited amounts in the Earth’s surface and the appearance of tin in the atmosphere is largely due to human activities, such as burning fossil fuels, and industrial and refining processes [95]. Besides, tin comes from the burning of fossil fuel and waste incineration [96] and other metals comes from glass making, electronics, and mechanical industries [97]. Titanium oxide (TiO2) serves as a material that can withstand high temperatures therefore used in various industries [98]. Also, crushed titanium (Ti) is increasingly being used in the aerospace, automotive, and other fields for its light weight and strength properties [99]. Powder form of titanium carbide (TiC) is used in the manufacture of strong alloy tools, carbide steel, abrasive substances, and alloys that have enhanced hardness due to dispersion [100].
PM10 and PM2.5 samples can be obtained in filters made of quartz [26,29,77,78], fiberglass [25,27,35,76], Teflon [16,78], polyurethane [28], in special bags [74], or in biofilters, such as leaves of some trees [51]. Among these, quartz and Teflon filters of the Whatman brand stand out as they were the most used in the studies analyzed. Teflon is one of the most common filters: durable, low-cost, and with a good collection efficiency for PM of all sizes. They are hydrophobic as well, making them useful for humid environments. On the contrary, these filters have limitations for analysis of trace metals and volatile organic compounds (VOCs), as they can interfere with the measurement. Quartz filter are hydrophobic, provide good collection efficiency for PM of all sizes, and are transparent, making them useful for the analysis of trace metals and VOCs, as well as for optical particle counting. They are more expensive than Teflon filters, but also more durable and able to be used in multiple tests.
Among the air volume capturing instruments, high volume capturers [29,77], low volume capturers [26], impactor type collectors [79,80], and Anderson and Envirotech brands stand out. Many authors use the sampling methodologies established by the EPA [5]. Ion chromatography (IC) and atomic absorption spectroscopy (AAS) are two techniques that can be used to separate and quantify ionic species and metal ions, respectively. IC can separate and quantify a wide range of ionic species (e.g., anions, cations, acids, and bases) in a sample and can provide high sensitivity and accuracy for trace level analysis. AAS can provide high sensitivity and accuracy for trace level analysis of metal ions and can detect and quantify a wide range of metals in a sample. Both IC and AAS can be used for both qualitative and quantitative
Inductively coupled plasma mass spectrometry (ICP-MS) is a highly sensitive and accurate technique for trace element analysis. It can detect a wide range of elements simultaneously and is particularly well suited for multi-element analysis and quantification of elements in the low parts-per-billion range. ICP-MS works by ionizing the elements in a sample and then measuring the mass of the resulting ions using a mass spectrometer.
The main detection method among the selected articles was inductively coupled plasma mass spectrometry (ICP-MS). Atomic absorption spectroscopy (AAS) and inductively coupled plasma atomic emission spectrometry (ICP-AES) are also highlighted [101] asserts that INAA technologies (instrumental neutron activation analysis) and IPAA (instrumental proton activation analysis) present more accurate results regarding the concentration of metals in PM samples. There are other useful technologies to characterize metals in aqueous samples which are not included among the methods selected by the scientists’ authors of the selected articles, such as: anodic stripping analysis, cold vapor absorption spectrometry, among other methods developed in the Standard Methods.
Geographic Information Systems (GIS) can be a powerful tool for particulate matter (PM) characterization, as they allow for the integration of spatial data with air quality information. With GIS, PM data can be mapped and analyzed to identify patterns and relationships between air quality and various factors, such as land use, demographics, and sources of emissions. One of the main advantages of using GIS for PM characterization is the ability to visualize data in a spatial context. This allows for the identification of hot spots of PM pollution, which can be related to specific sources of emissions or environmental conditions. For example, areas with high levels of PM pollution may be associated with heavy traffic or industrial activities. GIS can also be used to model the dispersion of PM in the atmosphere, taking into account meteorological conditions and other factors that can affect air quality. This information can be used to identify areas that are most vulnerable to PM exposure, as well as to predict the potential impacts of changes in land use or emissions sources [102]. In addition, GIS can be used to integrate PM data with other environmental and health information, such as demographic data and hospitalization records. This allows for the analysis of the relationships between PM exposure and health outcomes, which is essential for understanding the public health impacts of air pollution.

5. Conclusions

The Proknow-C method establishes a suitable route for a comprehensive literature collection of a very significant issue with impact elsewhere, PM pollution, which concentrations vary according to site characteristics (temperature, location, nearby sources, cortical material, etc). This review is very important because atmospheric pollution is of public interest since it seriously affects the public health and the quality of the environment, with many diseases associated to PM. Ions occupy a large fraction of the total composition of PM samples, while metals occupy a small fraction, but their presence in the pollutant increases its toxicity and constitutes a danger to public health. Sulfate, nitrate, and ammonium ions are of great importance in the study of PM10 and PM2.5 because their concentrations are relatively high, and they also affect visibility and cause multiple diseases. It was found that the characterization techniques mostly used for metals are atomic absorption and plasma induction; while for ions is ion chromatography. In general, the atmospheric contamination phenomena are aggravated in the cold seasons elsewhere.
Among the selected articles, only ions that were soluble in water (WSIS) were found to be characterized, this is because they are the most relevant in the composition of PM, the IS occupy between 40 and 50% of the mass in the analyzed samples by scientists [70]. The most studied ions are sulfate (SO42), nitrate (NO3) and ammonium (NH4+), likewise, the fraction of these ions occupy between 70–80% of the total concentration among the IS present in the PM [84].
Measuring the concentrations of ions and metals in PM samples is important because it provides valuable information about the quality of the air, avoiding public health issues. Knowing the concentrations of these components in PM samples, results can help to determine the sources and causes of air pollution, which is essential for developing effective control strategies to reduce exposure to harmful particles. Additionally, by monitoring the levels of ions and metals in PM, public health authorities can assess the potential health risks associated with exposure to these particles, and make informed decisions to protect public health.
PM is a major contributor to air pollution and can have serious impacts on human health. Measuring PM is important for understanding its sources, distribution, and impacts on the local population for other similar scenarios. This research also summarizes the steps involved in measuring PM. The first step in measuring PM is to select appropriate sites for the measurements. Once the sites have been selected, filters can be deployed. Sampling should be conducted following a standardized protocol, such as the one described by the World Health Organization or the U.S. Environmental Protection Agency. The protocol should specify the duration of the sampling, the flow rate of the air through the sampler, and the type of filter to be used. Data should also be collected on relevant environmental parameters, such as temperature, relative humidity, and wind speed and direction. After the sampling period, the filters should be removed from the samplers and sent to a laboratory for analysis. The filters can be analyzed using techniques such as ionic chromatography or atomic absorption spectroscopy, depending on the specific goals of the measurement. These techniques will provide information on the composition of the PM, including the presence of inorganic ions and metals. The data collected from the PM measurements and laboratory analysis should be analyzed to determine the concentration of PM, as well as its sources and composition. This information can be compared to air quality standards and used to identify areas with elevated levels of PM pollution. The PM data can also be mapped using Geographic Information Systems (GIS) to visualize the distribution of PM in the valley and to identify hot spots of PM pollution. By measuring PM and following a standardized protocol and using the appropriate techniques, it is possible to obtain a comprehensive picture of PM in a city in order to develop targeted strategies for reducing its impacts.

Author Contributions

Conceptualization, M.A.C., S.A.F., L.M.G. and D.A.; methodology, M.A.C., S.A.F. and H.A.C.; validation, M.A.C., S.A.F., L.M.G., D.A. and H.A.C.; investigation, M.A.C., S.A.F. and H.A.C.; writing—original draft preparation, M.A.C., S.A.F. and H.A.C.; writing—review and editing, S.A.F. and H.A.C.; supervision, H.A.C.; project administration, M.A.C., D.A. and H.A.C.; funding acquisition, M.A.C. All authors have read and agreed to the published version of the manuscript.

Funding

This research received no external funding.

Institutional Review Board Statement

Not applicable.

Informed Consent Statement

Not applicable.

Data Availability Statement

Data will be available upon request.

Acknowledgments

The authors gratefully acknowledge Universidad de Antioquia for the support in this project.

Conflicts of Interest

The authors declare no conflict of interest.

References

  1. Ubilla, C.; Yohannessen, K. Contaminación Atmosférica Efectos En La Salud Respiratoria En El Niño. Rev. Médica Clínica Las Condes 2017, 28, 111–118. [Google Scholar] [CrossRef]
  2. Maya, A.; del Pilar, M.; Posada-Posada; Isabel, M.; Nowak David, J.; Hoehn Robert, E. Remoción de contaminantes atmosféricos por el bosque urbano en el valle de Aburrá. Colomb. For. 2019, 22, 5–16. [Google Scholar] [CrossRef]
  3. Murillo, P.; Emperatriz, S. Impact of atmospheric contamination in two main cities of Ecuador. Rev. Univ. Y Soc. 2018, 10, 289–293. Available online: http://scielo.sld.cu/scielo.php?script=sci_arttext&pid=S2218-36202018000200289&lng=es&tlng=en (accessed on 27 January 2023).
  4. Dhiraj, G.; Krishnamurthy, V.; Adhikary, P. The Influence of Meteorological Conditions on PM10 Concentrations in Kathmandu Valley. Int. J. Environ. Res. 2008, 2, 2. [Google Scholar]
  5. Zhou, X.; Li, Z.; Zhang, T.; Wang, F.; Tao, Y.; Zhang, X.; Wang, F.; Huang, J.; Cheng, T.; Jiang, H.; et al. Chemical nature and predominant sources of PM10 and PM2.5 from multiple sites on the Silk Road, Northwest China. Atmos. Pollut. Res. 2021, 12, 425–436. [Google Scholar] [CrossRef]
  6. Wang, Y.; Zhang, R.; Saravanan, R. Asian pollution climatically modulates mid-latitude cyclones following hierarchical modelling and observational analysis. Nat. Commun. 2014, 5, 3098. [Google Scholar] [CrossRef] [Green Version]
  7. Chen, J.; Hoek, G. Long-term exposure to PM and all-cause and cause-specific mortality: A systematic review and meta-analysis. Environ. Int. 2020, 143, 105974. [Google Scholar] [CrossRef]
  8. Sanhueza, P.A.; Torreblanca, M.A.; Diaz-Robles, L.A.; Schiappacasse, L.N.; Silva, M.P.; Teresa, D.A. Particulate Air Pollution and Health Effects for Cardiovascular and Respiratory Causes in Temuco, Chile: A Wood-Smoke Polluted Urban Area. J. Air Waste Manag. Assoc. 2009, 59, 1481–1488. [Google Scholar] [CrossRef]
  9. Fonseca-Hernández, M.; Tereshchenko, I.; Mayor, Y.G.; Figueroa-Montaño, A.; Cuesta-Santos, O.; Monzón, C. Atmospheric Pollution by PM10 and O3 in the Guadalajara Metropolitan Area, Mexico. Atmosphere 2018, 9, 243. [Google Scholar] [CrossRef] [Green Version]
  10. Sandra, V.; William, O.; Lucia, O.; Eduardo, P.; Orlando, S. Contaminación Atmosférica Y Efectos Respiratorios En Niños, En Mujeres Embarazadas Y En Adultos Mayores. Rev. UDCA Ac-Tualidad Divulg. Científica 2008, 11, 31–45. [Google Scholar]
  11. Doria, A.C.; Fagundo, C.J. Caracterización química de material particulado PM10 en la atmósfera de La Guajira. Colombia. Rev. Colomb. Química 2016, 45, 19–29. [Google Scholar] [CrossRef]
  12. Ramanathan, V.; Crutzen, P.J.; Kiehl, J.T.; Rosenfeld, D. Atmosphere —Aerosols, climate, and the hydrological cycle. Science 2001, 294, 2119–2124. [Google Scholar] [CrossRef] [PubMed] [Green Version]
  13. Negral, L.; Suárez-Peña, B.; Zapico, E.; Fernández-Nava, Y.; Megido, L.; Moreno, J.; Marañón, E.; Castrillón, L. Anthropogenic and meteorological influences on PM10 metal/semi-metal concentrations: Implications for human health. Chemosphere 2020, 243, 125347. [Google Scholar] [CrossRef] [PubMed]
  14. Sopittaporn, S.; Somporn, C.; Urai, T.; Sukon, P.; Tippawan, P. Determination of PM10 and its ion composition emitted from biomass burning in the chamber for estimation of open burning emissions. Chemosphere 2023, 93, 1912–1919. [Google Scholar] [CrossRef]
  15. Alvarez, E.; Juan; Alvarez, M.; Alfredo; Sánchez, L.; Diana; González, P.; Iván; Torres, H.; Débora; et al. Biomonitoreo de la contaminación atmosférica en La Habana durante la campaña 2004–2005. Nucleus 2011, 50, 18–23. [Google Scholar]
  16. Analí, M.; Harvi, V.; Neyma, G.; Cézar, G.; Lorena, A.; Alberto, C.; María, L. Metales en PM10 y su dispersión en una zona de alto tráfico vehicular. Interciencia 2007, 32, 312–317. [Google Scholar]
  17. Liu, Y.; Zhang, W.; Yang, W.; Bai, Z.; Zhao, X. Chemical compositions of PM 2.5 emitted from diesel trucks and construction equipment. Aerosol Sci. Eng. 2018, 2, 51–60. [Google Scholar] [CrossRef] [Green Version]
  18. Gehui, W.; Renyi, Z.; Mario, E.; Lingxiao, Y.; Misti, L.; Min, H.; Yun, L. Persistent sulfate formation from London Fog to Chinese haze. Proc. Natl. Acad. Sci. USA 2016, 113, 13630–13635. [Google Scholar] [CrossRef] [Green Version]
  19. IPCC. Impacts, adaptation and vulnerability: Working group II contribution to the intergovernmental panel on climate change: Fifth assessment report (AR5): Summary for policymakers, intergovernmental panel on climate change. Working Group Impacts. In Climate Change 2014: Impacts, Adaptation, and Vulnerability. Part A: Global and Sectoral Aspects. Contribution of Working Group II to the Fifth Assessment Report of the Intergovernmental Panel on Climate Change; Cambridge University Press: Cambridge, UK, 2014; pp. 1–32. [Google Scholar]
  20. Huang, R.-J.; Zhang, Y.; Bozzetti, C.; Ho, K.-F.; Cao, J.-J.; Han, Y.; Daellenbach, K.R.; Slowik, J.G.; Platt, S.M.; Canonaco, F.; et al. High secondary aerosol contribution to particulate pollution during haze events in China. Nature 2014, 514, 218–222. [Google Scholar] [CrossRef] [Green Version]
  21. Galon-Negru, A.G.; Olariu, R.I.; Arsene, C. Size-resolved measurements of PM2.5 water-soluble elements in Iasi, north-eastern Romania: Seasonality, source apportionment and potential implications for human health. Sci. Total Environ. 2019, 695, 133839. [Google Scholar] [CrossRef]
  22. Cerón Bretón, J.G.; Cerón Bretón, R.M.; Espinosa Guzman, A.A.; Guarnaccia, C.; Martínez Morales, S.; Lara Severino, R.d.C.; Rangel Marrón, M.; Hernández López, G.; Carranco Lozada, S.E.; Kahl, J.D.W.; et al. Trace Metal Content and Health Risk Assessment of PM10 in an Urban Environment of León, Mexi-co. Atmosphere 2019, 10, 573. [Google Scholar] [CrossRef] [Green Version]
  23. Rengarajan, R.; Sudheer, A.; Sarin, M. Wintertime PM2.5 and PM10 carbonaceous and inorganic constituents from urban site in western India. Atmos. Res. 2011, 102, 420–431. [Google Scholar] [CrossRef]
  24. Christopher, M.; Long Marc, A.; Nascarella Peter, A. Valberg, Carbon black vs. black carbon and other airborne materials containing elemental carbon: Physical and chemical distinctions. Environ. Pollut. 2013, 181, 271–286. [Google Scholar] [CrossRef] [Green Version]
  25. Bhuyan, P.; Barman, N.; Bora, J.; Daimari, R.; Deka, P.; Hoque, R.R. Attributes of aerosol bound water soluble ions and carbon, and their relationships with AOD over the Brahmaputra Valley. Atmos. Environ. 2016, 142, 194–209. [Google Scholar] [CrossRef]
  26. Hama, S.; Kumar, P.; Alam, M.S.; Rooney, D.J.; Bloss, W.J.; Shi, Z.; Harrison, R.M.; Crilley, L.R.; Khare, M.; Gupta, S.K. Chemical source profiles of fine particles for five different sources in Delhi. Chemosphere 2021, 274, 129913. [Google Scholar] [CrossRef] [PubMed]
  27. Evagelopoulos, V.; Charisiou, N.D.; Zoras, S. Dataset of Polycyclic aromatic hydrocarbons and trace elements in PM2.5 and PM10 atmospheric particles from two locations in North-Western Greece. Data Brief 2022, 42, 108266. [Google Scholar] [CrossRef] [PubMed]
  28. Javed, W.; Wexler, A.S.; Murtaza, G.; Ahmad, H.R.; Basra, S.M. Spatial, temporal and size distribution of particulate matter and its chemical constituents in Faisalabad, Pakistan. Atmósfera 2015, 28, 99–116. [Google Scholar] [CrossRef]
  29. Ge, X.; Li, L.; Chen, Y.; Chen, H.; Wu, D.; Wang, J.; Xie, X.; Ge, S.; Ye, Z.; Xu, J.; et al. Aerosol characteristics and sources in Yangzhou, China resolved by offline aerosol mass spectrometry and other techniques. Environ. Pollut. 2017, 225, 74–85. [Google Scholar] [CrossRef]
  30. Hanna, E.; Fuchte; Paas, B.; Auer, F.; Bayer, V.J.; Achten, C.; Schäffer, A.; Smith, K.E. Identi-fication of sites with elevated PM levels along an urban cycle path using a mobile platform and the analysis of 48 particle bound PAH. Atmos. Environ. 2022, 271, 118912. [Google Scholar] [CrossRef]
  31. Insian, W.; Yabueng, N.; Wiriya, W.; Chantara, S. Size-fractionated PM-bound PAHs in urban and rural atmospheres of northern Thailand for respiratory health risk assessment. Environ. Pollut. 2022, 293, 118488. [Google Scholar] [CrossRef]
  32. Ko, J.H.; Wang, J.; Xu, Q. Impact of pyrolysis conditions on polycyclic aromatic hydrocarbons (PAHs) for-mation in particulate matter (PM) during sewage sludge pyrolysis. Chemosphere 2018, 208, 108–116. [Google Scholar] [CrossRef] [PubMed]
  33. Fatima, S.; Mishra, S.K.; Kumar, U.; Ahlawat, A.; Dabodiya, T.S.; Khosla, D. Role of morphology and chemical composition of PM for particle deposition in human respiratory system: A case study over megacity-Delhi. Urban Clim. 2023, 47, 101344. [Google Scholar] [CrossRef]
  34. Pereira, G.M.; Oraggio, B.; Teinilä, K.; Custódio, D.; Huang, X.; Hillamo, R.; Alves, C.A.; Balasubramanian, R.; Rojas, N.Y.; Sanchez-Ccoyllo, O.R.; et al. A comparative chemical study of PM10 in three Latin American cities: Lima, Medellín, and São Paulo. Air Qual. Atmos. Health 2019, 12, 1141–1152. [Google Scholar] [CrossRef]
  35. Dubey, B.; Pal, A.K.; Singh, G. Trace metal composition of airborne particulate matter in the coal mining and non–mining areas of Dhanbad Region, Jharkhand, India. Atmos. Pollut. Res. 2012, 3, 238–246. [Google Scholar] [CrossRef] [Green Version]
  36. Kastury, F.; Smith, E.; Karna, R.R.; Scheckel, K.G.; Juhasz, A. An inhalation-ingestion bioaccessibility assay (IIBA) for the assessment of exposure to metal(loid)s in PM10. Sci. Total Environ. 2018, 631–632, 92–104. [Google Scholar] [CrossRef]
  37. Quijano Parra, A.; Quijano Vargas, M.J.; Henao Martínez, J.A. Caracterización fisicoquímica del material par-ticu-ladofracción respirable PM2.5 en Pamplona-Norte de Santander-Colombia. Bistua: Rev. De La Fac. De Cienc. Básicas 2010, 8, 1–20. [Google Scholar]
  38. William, J.; Shaughnessy, M.M.; Venigalla, T.D. Health effects of ambient levels of respirable particulate matter (PM) on healthy, young-adult population. Atmos. Environ. 2015, 123, 102–111. [Google Scholar] [CrossRef]
  39. Yang, M.; Zeng, H.-X.; Wang, X.-F.; Hakkarainen, H.; Leskinen, A. Sources, chemical components, and toxicological responses of size segregated urban air PM samples in high air pollution season in Guangzhou, China. Sci. Total Environ. 2023, 865, 161092. [Google Scholar] [CrossRef]
  40. Henderson, D.E.; Milford, J.B.; Miller, S.L. Prescribed burns and wildfires in Colorado: Impacts of mitigation measures on indoor air particulate matter. J. Air Waste Manag. Assoc. 2005, 55, 1516–1526. [Google Scholar] [CrossRef]
  41. Nagar, P.K.; Singh, D.; Sharma, M.; Kumar, A.; Aneja, V.P.; George, M.P.; Agarwal, N. Characterization of PM2.5 in Delhi: Role and impact of secondary aerosol, burning of biomass, and municipal solid waste and crustal matter. Environ. Sci. Pollut. Res. 2017, 24, 25179–25189. [Google Scholar] [CrossRef]
  42. Wegesser, T.C.; Pinkerton, K.E.; Last, J.A. California wildfires of 2008: Coarse and fine particulate matter toxicity. Environ. Health Perspect. 2009, 117, 893–897. [Google Scholar] [CrossRef] [PubMed]
  43. Franzi, L.M.; Bratt, J.M.; Williams, K.M.; Last, J.A. Why is particulate matter produced by wildfires toxic to lung macrophages? Toxicol. Appl. Pharmacol. 2011, 257, 182–188. [Google Scholar] [CrossRef] [PubMed] [Green Version]
  44. Donaldson, K.; Mills, N.; MacNee, W.; Robinson, S.; Newby, D. Role of inflammation in cardiopulmonary health effects of PM. Toxicol. Appl. Pharmacol. 2005, 207, 483–488. [Google Scholar] [CrossRef] [PubMed]
  45. Li, N.; Hao, M.; Phalen, R.F.; Hinds, W.C.; Nel, A.E. Particulate air pollutants and asthma: A paradigm for the role of oxidative stress in PM-induced adverse health effects. Clin. Immunol. 2003, 109, 250–265. [Google Scholar] [CrossRef]
  46. Grigoropoulos, K.; Panagopoulos, C.; Gialouris, A.; Kouris, N.; Ferentinos, G.; Polichetti, G.; Thoma, E.; Papadopoulos, J.; Nastos, P.; Tsirogiani, Z.; et al. PM (Particles Matters) And Health Effects In A Pollution Episode In Athens. Eur. J. Intern. Med. 2011, 22 (Suppl. S1), S37–S38. [Google Scholar] [CrossRef]
  47. Lan, Y.; Ng, C.T.; Ong, R.X.S.; Muniasamy, U.; Baeg, G.H.; Ong, C.N.; Yu, L.E.; Bay, B.H. Urban PM2.5 reduces angiogenic ability of endothelial cells in an alveolar-capillary co-culture lung model. Ecotoxicol. Environ. Saf. 2020, 202, 110932. [Google Scholar] [CrossRef]
  48. Chen, X.-Y.; Feng, P.-H.; Han, C.-L.; Jheng, Y.-T.; Wu, C.-D. Alveolar epithelial inter-alpha-trypsin inhibitor heavy chain 4 deficiency associated with senescence-regulated apoptosis by air pollution. Environ. Pollut. 2021, 278, 116863. [Google Scholar] [CrossRef]
  49. von Schneidemesser, E.; Monks, P.S.; Allan, J.D.; Bruhwiler, L.; Forster, P.; Fowler, D.; Lauer, A.; Morgan, W.T.; Paasonen, P.; Righi, M.; et al. Chemistry and the linkages between air quality and climate change. Chem. Rev. 2015, 115, 3856–3897. [Google Scholar] [CrossRef]
  50. Nueve de Cada Diez Personas de Todo el Mundo Respiran Aire Contaminado Sin Embargo, Cada Vez Hay Más Países Que Toman Medidas. 2018. Available online: https://www.who.int/es/news/item/02-05-2018-9-out-of-10-people-worldwide-breathe-polluted-air-but-more-countries-are-taking-action (accessed on 12 December 2022).
  51. Zalakeviciute, R.; Alexandrino, K.; Mejia, D.; Bastidas, M.G.; Oleas, N.H.; Gabela, D.; Rybarczyk, Y. The effect of national protest in Ecuador on PM pollution. Sci. Rep. 2021, 11, 1–12. [Google Scholar] [CrossRef]
  52. Colorado, H.A.; Muñoz, A.; Neves Monteiro, S. Circular economy of construction and demolition waste: A case study of Colombia. Sustainability 2022, 14, 7225. [Google Scholar] [CrossRef]
  53. Agudelo, G.; Cifuentes, S.; Colorado, H.A. Ground tire rubber and bitumen with wax and its application in a real highway. J. Clean. Prod. 2019, 228, 1048–1061. [Google Scholar] [CrossRef]
  54. Rendón, J.; Giraldo, C.H.; Monyake, K.C.; Alagha, L.; Colorado, H.A. Experimental investigation on composites incorporating rice husk nanoparticles for environmental noise management. J. Environ. Manag. 2023, 325, 116477. [Google Scholar] [CrossRef] [PubMed]
  55. Colorado, H.A.; Mendoza, D.E.; Valencia, F.L. A combined strategy of additive manufacturing to support multidisciplinary education in arts, biology, and engineering. J. Sci. Educ. Technol. 2021, 30, 58–73. [Google Scholar] [CrossRef] [PubMed]
  56. Colorado, H.A.; Velásquez EI, G.; Monteiro, S.N. Sustainability of additive manufacturing: The circular economy of materials and environmental perspectives. J. Mater. Res. Technol. 2020, 9, 8221–8234. [Google Scholar] [CrossRef]
  57. Ordoñez, E.; Monteiro, S.N.; Colorado, H.A. Valorization of a hazardous waste with 3D-printing: Combination of kaolin clay and electric arc furnace dust from the steel making industry. Mater. Des. 2022, 217, 110617. [Google Scholar] [CrossRef]
  58. Ferreira, S.L.; Bezerra, M.A.; Santos, A.S.; dos Santos, W.N.; Novaes, C.G.; de Oliveira, O.M.; Garcia, R.L. Atomic absorption spectrometry–A multi element technique. TrAC Trends Anal. Chem. 2018, 100, 1–6. [Google Scholar] [CrossRef]
  59. Jackson, P.E. Ion chromatography in environmental analysis. In Encyclopedia of Analytical Chemistry; John Wiley & Sons Ltd: Hoboken, NJ, USA, 2000; pp. 2779–2801. [Google Scholar]
  60. Hill, S.J. (Ed.) Inductively Coupled Plasma Spectrometry and Its Applications; John Wiley & Sons: Hoboken, NJ, USA, 2008. [Google Scholar]
  61. Batchelor-McAuley, C.; Kätelhön, E.; Barnes, E.O.; Compton, R.G.; Laborda, E.; Molina, A. Recent advances in voltammetry. ChemistryOpen 2015, 4, 224–260. [Google Scholar] [CrossRef]
  62. Fanali, S.; Haddad, P.R.; Poole, C.; Riekkola, M.L. (Eds.) Liquid Chromatography: Applications; Elsevier: Amsterdam, The Netherlands, 2017. [Google Scholar]
  63. Bunaciu, A.A.; UdriŞTioiu, E.G.; Aboul-Enein, H.Y. X-ray diffraction: Instrumentation and applica-tions. Crit. Rev. Anal. Chem. 2015, 45, 289–299. [Google Scholar] [CrossRef]
  64. Greenberg, R.R.; Bode, P.; Fernandes, E.A.D.N. Neutron activation analysis: A primary method of meas-urement. Spectrochim. Acta Part B: At. Spectrosc. 2011, 66, 193–241. [Google Scholar] [CrossRef]
  65. Vaughn, E.; Ramachandran, G. Fiberglass vs. synthetic air filtration media. Int. Nonwovens J. 2002, 11, 3. [Google Scholar] [CrossRef] [Green Version]
  66. Brincat, J.P.; Sardella, D.; Muscat, A.; Decelis, S.; Grima, J.N.; Valdramidis, V.; Gatt, R. A review of the state-of-the-art in air filtration technologies as may be applied to cold storage warehouses. Trends Food Sci. Technol. 2016, 50, 175–185. [Google Scholar] [CrossRef]
  67. Aikawa, M.; Hiraki, T. Difference in the use of a quartz filter and a PTFE filter as first-stage filter in the four-stage filter-pack method. Water Air Soil Pollut. 2010, 213, 331–339. [Google Scholar] [CrossRef]
  68. Hänninen, O.O.; Koistinen, K.J.; Kousa, A.; Keski-Karhu, J.; Jantunen, M.J. Quantitative analysis of envi-ronmental factors in differential weighing of blank Teflon filters. J. Air Waste Manag. Assoc. Tion 2002, 52, 134–139. [Google Scholar] [CrossRef] [PubMed]
  69. Zhang, S.; Wang, Y.; Tan, Y.; Zhu, J.; Liu, K.; Zhu, J. Anodic aluminum oxide with fine pore size control for selective and effective particulate matter filtering. Mater. Res. Express 2016, 3, 074004. [Google Scholar] [CrossRef] [Green Version]
  70. Wagner, A.; Mages, M. Total-Reflection X-ray fluorescence analysis of elements in size-fractionated partic-ulate matter sampled on polycarbonate filters—Composition and sources of aerosol particles in Göteborg, Sweden. Spectrochim. Acta Part B At. Spectrosc. 2010, 65, 471–477. [Google Scholar] [CrossRef]
  71. Avnimelech, Y. Bio-filters: The need for an new comprehensive approach. Aquac. Eng. 2006, 34, 172–178. [Google Scholar] [CrossRef]
  72. Chaves, L.C.; Ensslin, L.; Ensslin, S.R.; Petri, S.M.; Da Rosa, F.S. Gestão do processo decisório: Mapeamento ao tema conforme as delimitações postas pelos pesquisadores. Rev. Eletrônica Estratégia Negócios 2012, 5, 3. [Google Scholar] [CrossRef] [Green Version]
  73. Duarte, R.M.; Matos, J.T.; Paula, A.S.; Lopes, S.P.; Pereira, G.; Vasconcellos, P.; Gioda, A.; Carreira, R.; Silva, A.M.; Duarte, A.C.; et al. Structural signatures of water-soluble organic aerosols in contrasting environments in South America and Western Europe. Environ. Pollut. 2017, 227, 513–525. [Google Scholar] [CrossRef] [Green Version]
  74. Bu-Olayan, A.H.; Thomas, B.V. Exposition of respiratory ailments from trace metals concentrations in incenses. Sci. Rep. 2021, 11, 1–10. [Google Scholar] [CrossRef]
  75. Pey, J.; Alastuey, A.; Querol, X.; Pérez, N.; Cusack, M. A simplified approach to the indirect evaluation of the chemical composition of atmospheric aerosols from PM mass concentrations. Atmos. Environ. 2010, 44, 5112–5121. [Google Scholar] [CrossRef]
  76. Police, S.; Sahu, S.K.; Pandit, G.G. Chemical characterization of atmospheric particulate matter and their source apportionment at an emerging industrial coastal city, Visakhapatnam, India. Atmos. Pollut. Res. 2016, 7, 725–733. [Google Scholar] [CrossRef] [Green Version]
  77. Hernández-Pellón, A.; Fernández-Olmo, I. Airborne concentration and deposition of trace metals and metalloids in an urban area downwind of a manganese alloy plant. Atmos. Pollut. Res. 2019, 10, 712–721. [Google Scholar] [CrossRef]
  78. Tao, J.; Zhang, L.; Gao, J.; Wang, H.; Chai, F.; Wang, S. Aerosol chemical composition and light scattering during a winter season in Beijing. Atmos. Environ. 2015, 110, 36–44. [Google Scholar] [CrossRef]
  79. Shahid, I.; Kistler, M.; Mukhtar, A.; Ghauri, B.M.; Cruz, C.R.-S.; Bauer, H.; Puxbaum, H. Chemical characterization and mass closure of PM10 and PM2.5 at an urban site in Karachi—Pakistan. Atmos. Environ. 2016, 128, 114–123. [Google Scholar] [CrossRef]
  80. Souza, E.J.S.; Mora, C.Z.; Zuluaga, B.H.A.; Amaral, C.D.B.; Grassi, M.T. Multi-elemental analysis of particulate matter PM2.5 and PM10 by ICP OES. Talanta 2021, 221, 121457. [Google Scholar] [CrossRef]
  81. Foley, T.; Betterton, E.A.; Wolf, A.M.A. Ambient PM10 and metal concentrations measured in the Sunnyside unified school district, Tucson, Arizona. J. Ariz. Nev. Acad. Sci. 2012, 43, 67–76. [Google Scholar] [CrossRef]
  82. Bencardino, M.; Pirrone, N.; Sprovieri, F. Aerosol Trace Metal Concentrations over the Mediterranean Basin: Observations through six cruise campaigns on board the CNR Research Vessel URANIA. In Proceedings of the E3S Web of Conferences, Rome, Italy, 23-27 September 2013; Volume 1, p. 23002. [Google Scholar]
  83. Ezeh, G.; Obioh, I.; Asubiojo, O.; Chiari, M.; Nava, S.; Calzolai, G.; Lucarelli, F.; Nuviadenu, C. Elemental compositions of PM10–2.5 and PM2.5 aerosols of a Nigerian urban city using ion beam analytical techniques. Nucl. Instrum. Methods Phys. Res. Sect. B Beam Interact. Mater. At. 2014, 334, 28–33. [Google Scholar] [CrossRef]
  84. Liu, J.; Wu, D.; Fan, S.; Mao, X.; Chen, H. A one-year, on-line, multi-site observational study on water-soluble inorganic ions in PM2.5 over the Pearl River Delta region. China Sci. Total Environ. 2017, 601–602, 1720–1732. [Google Scholar] [CrossRef]
  85. Mohammed, G.; Karani, G.; Mitchell, D. Trace Elemental Composition in PM10 and PM2.5 Collected in Cardiff. Wales Energy Procedia 2017, 111, 540–547. [Google Scholar] [CrossRef]
  86. Quiterio, S.L.; Arbilla, G.; Escaleira, V.; Silva, C.R.S.; Wasserman, M.A. Characterization of Airborne Trace Metal Distribution in Baixada Fluminense, Rio de Janeiro, Brazil, by Operational Speciation. Bull. Environ. Con-Tami-Nation Toxicol. 2006, 77, 119–125. [Google Scholar] [CrossRef]
  87. El-Araby, E.; El-Wahab, M.A.; Diab, H.; El-Desouky, T.; Mohsen, M. Assessment of Atmospheric heavy metal depo-sition in North Egypt aerosols using neutron activation analysis and optical emission inductively coupled plasma. Appl. Radiat. Isot. 2011, 69, 1506–1511. [Google Scholar] [CrossRef] [PubMed]
  88. Moreno, T.; Oldroyd, A.; McDonald, I.; Gibbons, W. Preferential fractionation of trace metals–metalloids into PM 10 resuspended from contaminated gold mine tailings at Rodalquilar, Spain. Water Air Soil Pollut. 2007, 179, 93–105. [Google Scholar] [CrossRef]
  89. Gray, D.L.; Wallace, L.A.; Brinkman, M.C.; Buehler, S.S.; La Londe, C. Respiratory and Cardiovascular Effects of Metals in Ambient Particulate Matter: A Critical Review. Rev. Environ. Contam. Toxicol. 2014, 135–203. [Google Scholar] [CrossRef]
  90. Rosa, M.J.; Benedetti, C.; Peli, M.; Donna, F.; Nazzaro, M.; Fedrighi, C.; Lucchini, R. Association between personal exposure to ambient metals and respiratory disease in italian adolescents: A cross-sectional study. BMC Pulm. Med. 2016, 16, 6. [Google Scholar] [CrossRef] [Green Version]
  91. Chen, Y.H.; Wang, C.L.; Liu, J.; Wang, J.; Qi, J.Y.; Wu, Y.J. Environmental exposure and flux of thallium by industrial activities utilizing thallium-bearing pyrite. Sci. China Earth Sci. 2013, 56, 1502–1509. [Google Scholar] [CrossRef]
  92. Demiray, A.D.; Yolcubal, I.; Akyol, N.H.; Çobanoǧlu, G. Biomonitoring of airborne metals using the lichen Xanthoria parietina in Kocaeli Province, Turkey. Ecol. Indic 2012, 18, 632–643. [Google Scholar] [CrossRef]
  93. Kazantzis, G. Thallium in the environment and health effects. Environ. Geochem. Health 2000, 22, 275–280. [Google Scholar] [CrossRef]
  94. Bohdalkova, L.; Novak, M.; Voldrichova, P.; Prechova, E.; Veselovsky, F.; Erbanova, L.; Krachler, M.; Komarek, A.; Mikova, J. Atmospheric deposition of beryllium in Central Europe: Comparison of soluble and insoluble fractions in rime and snow across a pollution gradient. Sci. Total Environ. 2012, 439, 26–34. [Google Scholar] [CrossRef]
  95. Malandrino, M.; Casazza, M.; Abollino, O.; Minero, C.; Maurino, V. Size resolved metal distribution in the PM matter of the city of Turin (Italy). Chemosphere 2016, 147, 477–489. [Google Scholar] [CrossRef] [PubMed]
  96. Harper, C. Toxicological Profile for Tin; Agency for Toxic Substances and Disease Registry: Atlanta, GA, USA, 2005; pp. 249–250.
  97. Ledoux, F.; Kfoury, A.; Delmaire, G.; Roussel, G.; El Zein, A.; Courcot, D. Contributions of local and regional anthro-pogenic sources of metals in PM2.5 at an urban site in northern France. Chemosphere 2017, 181, 713–724. [Google Scholar] [CrossRef]
  98. Altıntas, Y.; Kaygısız, Y.; Öztürk, E.; Aksӧz, S.; Keşlioğlu, K.; Maraşli, N. The measurements of electrical and thermal conductivity variations with temperature and phonon component of the thermal conductivity in Sn-Cd-Sb, Sn-In-Cu, Sn-Ag-Bi and Sn-Bi-Zn alloys. Int. J. Therm. Sci. 2016, 100, 1–9. [Google Scholar] [CrossRef]
  99. Abkowitz, S.M.; Abkowitz, S.; Fisher, H. Breakthrough claimed for titanium PM. Met. Powder Rep. 2011, 66, 16–21. [Google Scholar] [CrossRef]
  100. Onishchenko, D.V.; Reva, V.P.; Kuryavy, V.G.; Petrov, V.V. Use of carbon compacts based on natural graphite for the mechanochemical synthesis of titanium carbide. Metallurgist 2012, 56, 456–461. [Google Scholar] [CrossRef]
  101. Sampad, G.; Balram, A. Characterization of PM10 in the ambient air during Deepawali festival of Rajnandgaon district, India. Nat. Hazards 2013, 69, 589–598. [Google Scholar] [CrossRef]
  102. Neckel, A.; Oliveira, M.L.; Maculan, L.S.; Bodah, B.W.; Gonçalves, A.C.; Silva, L.F. Air pollution in central European capital (Budapest) via self-made passive samplers and Sentinel-3B SYN satellite images. Urban Clim. 2023, 47, 101384. [Google Scholar] [CrossRef]
Figure 1. (a)Emission source and (b,c) Pollution in the city of Medellin.
Sustainability 15 04402 g001
Figure 2. Summary of the process to get the bibliographic portfolio.
Sustainability 15 04402 g002
Figure 3. (a) Type of filter, (b) Characterization technique, (c) Main metals characterized, (d) Main ions characterized vs. number of documents.
Sustainability 15 04402 g003
Figure 4. Venn diagram for (a) Analyzed substance and (b) Pollutant type vs. number of documents.
Sustainability 15 04402 g004
Table 1. Searching commands selected through the Proknow-C methodology.
TypeSearch Command
1(Characterization or analysis) and (PM10 or PM2.5) and (metals or ions)
2(Characterization or analysis) and (PM10 or PM2.5) and (AAS or ICP)
3(Characterization or analysis) and (PM10 or PM2.5) and (IC or chromatography)
4(Characterization or analysis) and (PM10 or PM2.5) and (Metals or trace elements)
5(Characterization or analysis) and (PM10 or PM2.5) and ((anion or cation) or WSIS)
AAS: Atomic absorption spectroscopy, ICP: induction plasma spectrometry, IC: ion chromatography, WSIS: Water-soluble ions.
Table 2. Filter physical characteristics.
FilterPoreBrandM or IPollutantReference
Fiber glass47 mmWhatmanMetalsPM10PM2.5[35]
47 mmWhatmanMetalsPM10-[76]
47 mmWhatmanIonPM10-[25]
-Whatman-PM10-[35]
PUF (Polyurethane foam)--MetalsPM10PM2.5[28]
Ion
Quartz fiber47 mmPallflexMetals-PM2.5[29]
Ion
150 mmSartoriousMetalsPM10-[77]
47 mmWhatmanIon-PM2.5[78]
47 mm-IonPM10PM2.5[26]
47 mmWhatmanIonPM10-[79]
Metals
47 mmWhatmanIon-PM2.5
Metals
---PM10PM2.5[80]
-TissuequartzIonPM10PM2.5[23]
--MetalsPM10-[81]
Teflon47 mmWhatmanIonPM10-[11]
37 mm-MetalsPM10PM2.5[82]
Alumium25 mm-Metals-PM2.5[21]
Tedlar bag--Metals-PM2.5[74]
Leaves-MalaleucaMetals-PM2.5[51]
Polycarbonate-EssqueMetalsPM10PM2.5[83]
---Ion-PM2.5[84]
37 mm-MetalsPM10PM2.5[85]
Table 3. Kind of sampling device and pollutant extraction according the filter.
FilterMeasuring DevicePollutant ExtractionReference
KindModelBrand
Fiber glassLow volumeLVS3.1-Microwave extraction[27]
PNS16T-3.1
High volume460NLEnvirotechAcidification with HNO3[76]
High volumeAPM 460 BLEnvirotechUltrasonication[25]
Respirable dust460NLEnvirotechAcidification with HNO3[35]
PUF (Polyurethane foam)MicroDust Pro Real HB3275-07Casellamethod IO-3.1, US-EPA[28]
Qartz fiberHigh volumeKB1000Jinshida-[29]
High volume-MCVAcidification with HNO3[77]
Four channel samplerTH-16ATisnhong-[78]
Mini-Vol portable-AirmetricsUltra pure-water[26]
High volume-Andersen SierraSonication and multiwave extraction[79]
Low volumePQ200BGI
High volumeGMB2360Thermo(USMW)[80]
Low volume2025Partisol
High volume-TishUltrasonication[23]
--AndersonAcidification with HNO3[81]
Med volumeTH-150FTianhong-[5]
TeflonFour channel samplerTH-16ATianhongUltrasonic agitation[78]
Dichotomous241AndersonAcidification with HNO3[82]
AlumiumLow P. impactorDLPIDekatiAcidification with HNO3[21]
Tedlar bag-EPAM 5000HazdustAcidification with HNO3[74]
Leaves---Acidification with HNO3[68]
-AutomaticMARGAMARGA-[84]
Dichotomous241-Acidification with HNO3[85]
Table 4. Characterization techniques and its characteristics.
TechniqueDeviceFollowed MethodSources DetectionChemical CompoundPollutantSampling PeriodRef.
AASZEEnit 700—Analytic Jena GmbHEN12341-Al, Mn, Fe, Ni, Cu, Zn, Sn, Pb, Si, Mg, Cr, As, Na, K, Ca, Sr, CdBothDecember 2017–November 2018[27]
Thermo AA, Solar-SeriesMethod IO-3.2, US-EPA-Pb, Cd, Ni, Zn, Fe, Cu, Mg, Na, Ca, KBothJune 2012–April 2013[28]
GBC-Avanta-USEPA PMF5.0AsPM10April 2010–December 2011[76]
SOLAAR 969--Ca, K, Mg, Na, Al, Pb, Cr, Ni, Zn, Cu, Cd, and FeBothDecember 2009–December 2010[85]
GBC, Avanta, Australia--Fe, Cu, Zn, Mn, Cr, Cd, Pb, NiPM10December 2008–January 2009[35]
ICIC Vario-940 Metrohom, Switzerland Ca+2, Mg+2, Na+, K+, NH4+, Cl, SO4−2, NO3,BothJune 2012–April 2013[28]
---Ca+2, Mg+2, Na+, K+, NH4+, Cl, SO4−2, NO3,PM2.5-[84]
881 Compact IC Pro, Switzerland--Ca+2, Na+, K+, NH4+, Cl, SO4−2, NO3, FPM2.5November 2015–April 2016[29]
Thermo Dionex; Sunnyvale, CAUS EPA protocols (Chow and Watson, 1998)-Na+, NH4+, Cl, SO4−2, NO3, NO2, F, PO4−3
BothJanuary 2018–October 2018[26]
AS12A, ASRS Ultra II CD20 Dionex--Cl, SO4−2, NO3
BothMarch and April 2009[79]
Dionex QIC CS12A--Ca+2, Mg+2, Na+, K+, NH4+
BothMarch and April 2009[79]
Thermo Fisher Scientific Inc., USA-USEPA PMF5.0Ca+2, Mg+2, Na+, K+, NH4+, Cl, SO4−2, NO3BothJune and December 2018[5]
Dionex--Ca+2, Mg+2, Na+, K+, NH4+, Cl, SO4−2, NO3BothDecember 2006–January 2007[23]
Metrohm 882 Professional IC--Ca+2, Mg+2, Na+, K+, NH4+, Cl, SO4−2, NO3PM10December 2010–October 2014[25]
ICP-MS-EN-UNE 14902-V, Mn, Fe, Ni, Cu, Zn, As, Mo, Cd, Sb, PbPM10January 2015–January 2016[77]
ICP-MS 7700× system (Agilent Technologies, USA)-PMF: Paatero and Tapper (1994)Ag, Al, As, B, Ba, Be, Bi, Cd, Co, Cu, Cr, Fe, Ga, Mg, Mn, Mo, Ni, Pb, Rb, Se, Sr, Te, Ti, U, V, ZnPM2.52016[21]
-Compendium Method IO 3.5-As, Be, Cd, Cr, Co, Pb, Mn, NiPM10July 2017[81]
ICP-MS, Agilent Technologies, model 7500 CE--As, Cd, Cr, Cu, Mn, Ni, Pb, Sb, VBoth-[82]
NexION-350, Perkin Elmer, Inc., USA--Pb, Ni, Cr, As, Cd, VPM2.5-[74]
Thermo X2 Series- Al, V, Cr, Mn, Co, Ni, Cu, Zn, As, Se, Sr, Cd, Ba, PbPM2.5November 2015–April 2016[29]
Thermo Finnigan, Bremen, Germany-USEPA PMF5.0Al, Ca, Fe, Mg, Zn, Ba, Cd, Cr, Cu, Mn, Pb, As, Ni, SeBothJune and December 2018[5]
Voltametry--USEPA PMF5.0Pb, Cu, CdPM10April 2010–December 2011[76]
ICP-AESJobin Yvon, Model ULTIMA 2-USEPA PMF5.0Al, Mn, Cr, V, Fe, Ni, ZnPM10April 2010–December 2011[76]
ICP-OESiCAP 6500 (Thermo Scientific) Ca, AlBothMarch and April 2009[79]
ICP-OESICP-OES, Termo Scientifc iCAP 7000 series--Al, Fe, Zn, Pb, Cu, Mg, Co, Ba Cr K Ca MnPM2.5October 2019[51]
iCAP 6000 Series (Thermo Scientific, Massachusetts, USA)--Al, As, Ca, Cd, Co, Cr, Cu, Dy, Er, Eu, Fe, K, Mg, Mn, Mo, Na, Ni, P, Pb, Pr, Sn, Tb, Ti, V, ZnBothOctober 2018 and January 2019[80]
LCLC20AD, Shimadzu Corp., Kyoto, Japan--Ca+2, Mg+2, Na+, K+, NH4+, Cl, SO4−2, NO3BothJanuary 2013[78]
HPLCWATERS IC-pakTM NH4+, Cl, SO4−2, NO3PM10June 2004–February 2005[86]
XASMRCAT As, PbPM10-[36]
SUV-VISHACH DR 5000 NH4+, Cl, SO4−2, NO3, NO2, PO4−3
PM10-[11]
NAA---Ba, Br, Co, Sb, Cr, Fe, Ca and ZnPM10-[87]
XRD---Fe AsPM10-[88]
Disclaimer/Publisher’s Note: The statements, opinions and data contained in all publications are solely those of the individual author(s) and contributor(s) and not of MDPI and/or the editor(s). MDPI and/or the editor(s) disclaim responsibility for any injury to people or property resulting from any ideas, methods, instructions or products referred to in the content.

