Article

Analysis of the Impact of Economic Policy Uncertainty on Environmental Sustainability in Developed and Developing Economies

by
Huafang Huang
1,2,*,
Sharafat Ali
3,4,* and
Yasir Ahmed Solangi
5,6
1
College of Economics and Management, Hefei Normal University, Hefei 230601, China
2
School of Geography and Tourism, Anhui Normal University, Wuhu 241002, China
3
Department of Economics, Government Graduate College Kot Sultan, Kot Sultan 31650, Pakistan
4
Department of Economics, University of Layyah, Layyah 31200, Pakistan
5
College of Economics and Management, Nanjing University of Aeronautics and Astronautics, Nanjing 210016, China
6
School of Management, Jiangsu University, Zhenjiang 212013, China
*
Authors to whom correspondence should be addressed.
Sustainability 2023, 15(7), 5860; https://doi.org/10.3390/su15075860
Submission received: 12 February 2023 / Revised: 21 March 2023 / Accepted: 23 March 2023 / Published: 28 March 2023
(This article belongs to the Special Issue Air Pollution Management and Environment Research)

Abstract

:
The literature on the impact of policy uncertainty on climate change has grown rapidly in recent years as policymakers and researchers have become increasingly concerned about the potential adverse effects of policy uncertainty on environmental sustainability. This study aims to investigate the impact of economic policy uncertainty (EPU), GDP per capita, renewable energy consumption (REC), and foreign direct investment (FDI) on environmental sustainability from the perspectives of the environmental Kuznets curve (EKC) and pollution halo/haven hypotheses. The research employs panel data analysis techniques, including panel corrected standard errors (PCSE) and generalized least squares (GLS), to analyze the data from a panel of 19 developed and developing countries from 2001 to 2019. The results reveal that EPU, GDP per capita, REC, and FDI significantly impact GHG emissions, contributing to climate change. The results of the study confirm a U-shaped EKC and pollution haven hypothesis in the selected economies. The findings of this study provide valuable insights for policymakers, as they highlight the need to consider the interplay between economic growth, foreign investment, and environmental policy in addressing climate change. The results also suggest that reducing policy uncertainty and promoting sustainable economic growth can mitigate the effects of climate change and ensure environmental sustainability.

1. Introduction

The urgent nature of climate change necessitates immediate attention and action [1]. The GHGs, primarily due to human activities like burning fossil fuels and deforestation, are significant in this problem [2]. Governments play a critical role in addressing climate change by implementing policies that reduce emissions and promote sustainable growth. But economic policy uncertainty (EPU) may prevent these regulations from being effective, impeding economic growth and aggravating climate change [3]. Policy uncertainty refers to the need for more clarity or predictability of government policies, which can create obstacles to making informed decisions and investments for businesses and individuals. EPU can lead to delays or cancellation of projects, reduced investment, and increased risk, negatively impacting economic growth. In the context of climate change, policy uncertainty can discourage businesses and individuals from investing in renewable energy [4] and energy efficiency and, instead, continue to rely on fossil fuels, a significant source of greenhouse gas emissions.
Moreover, EPU also has a negative impact on environmental innovations [5]. Additionally, GDP is a critical factor that policymakers consider when developing and executing policies and is frequently cited as an indicator of economic growth and progress. The detrimental externalities of economic activity, such as environmental deterioration and climate change, are not considered by GDP. It could result in a scenario where measures meant to cut emissions and advance sustainable development are only partially implemented, and economic growth precedes environmental concerns. Implementing effective policies to reduce emissions and promote sustainable development is frequently hampered by policy uncertainty and GDP-centered economic growth [6], despite the urgent need for action to combat climate change. This study analyzes the relationship between policy uncertainty, GDP, and climate change to limit the damaging effects of these factors on efforts to address climate change.
Because of their complex political and economic systems and the conflicting interests of various stakeholders, developed countries often have a larger capacity to implement laws and regulations to address climate change. Still, they may also experience more significant policy uncertainty [2]. For instance, wealthy nations might have more lobbying organizations that promote the interests of different companies and work to reduce restrictions. Policy changes or delays meant to lower emissions and advance sustainable development may arise from this. In certain industrialized nations, there may also be a need for more political will to put policies into place that could have immediate economic repercussions.
Conversely, developing countries may experience more difficulties combating climate change because of a lack of financial and technological resources [7]. They could also be more susceptible to climate change effects like rising sea levels and harsh weather. Policy uncertainty may be especially harmful in developing nations since it might deter investment and impede economic progress [8], hampered by a lack of resources.
Additionally, developing nations might need more tools to oversee, implement, and guarantee adherence to laws and policies [1].In both situations, economic policy uncertainties can make it challenging for people and companies to make well-informed choices and investments [9,10]. It may result in project delays, decreased investment, and greater risk, harming economic development and climate change. The empirical literature on the impact of EPU on economic growth, industrial output, green technology innovation (GTI), energy consumption, and carbon emissions has been growing. For instance, Wen et al. [11] analyzed how EPU affects economic growth in Pakistan. Pirgaip and Dinçergök [12] explored the EPU-energy consumption relationship in G7 economies. Zhu and Yu [13] examined the impact of EPU on output in Chinese industry, considering the regulatory role of technological progress. Yang et al. [14] explored how EPU affects GTI in Chinese-listed enterprises. In another study, Xu et al. [15] examined its impact on green innovation in Chinese cities. Khan et al. [16] showed how EPU affects carbon emissions in East-Asian economies. Fu et al. [3] provided evidence of how EPU impacts CO2 emissions in Chinese cities. Noailly et al. [17] examined how environmental and policy uncertainty influences investments in the US. In a recent study, Mahmoodi and Dahmardeh [18] examined the EKC hypotheses considering the ecological footprint as an indicator of environmental degradation and economic growth in European and Asian emerging economies. The authors took GDP per capita as an indicator of economic growth.
The existing literature needs to show more evidence of the impact of EPU on environmental sustainability in a larger group of developed and developing economies. Understanding the relationship between the economic and environmental components of the issue requires research on how policy uncertainty affects climate change and environmental sustainability. It can assist in guiding the creation of policies that balance the requirement to encourage sustainable development and economic growth while reducing emissions. By highlighting the obstacles that need to be overcome to achieve global collaboration on climate action, an understanding of how policy uncertainty affects climate change may also assist in guiding international climate discussions. In general, research on how policy uncertainty affects climate change is necessary to create effective laws and policies that cut emissions, support sustainable development, and eventually assist in lessening the effects of climate change on human health, the environment, and the world economy. The current study contributes to the empirical literature on the EPU-environmental sustainability relationship in a heterogeneous larger panel of 19 developed and developing economies. Since Mahmoodi and Dahmardeh [18] examined the EKC in selected European and Asian emerging economies, the current study also considers EPU in the model to examine environmental sustainability measured by the GHG emission and economic growth relationship in developed and developing countries not only in Europe and Asia but also North and South America.
Moreover, this study adds to the literature on this relationship while considering the environmental Kuznets curve hypothesis. Wang et al. [19] supported including EPU to examine its impact on environmental sustainability and the EKC relationship between emissions and economic growth. The present study aims to provide an extensive understanding of the insinuations of EPU on environmental sustainability. Further, it also provides deeper insight into the relationship between uncertainty, economic growth, energy, and environmental sustainability. The present study contributes to the literature on the impact of EPU on environmental sustainability in selected developed and developing economies using panel data from 19 developed and developing economies from 2001 to 2019.
Along with the EPU in the model, the study also examines the EKC and pollution halo/haven theories. Additionally, the study incorporates foreign direct investment and renewable energy (REC) into the model. The study first estimates the linear model using pooled OLS, generalized least squares (GLS), and panel-corrected standard errors (PCSE) models to evaluate the effect of EPU on environmental sustainability. The study then estimates the same model using the GDP per capita quadratic component to examine the validity of the EKC hypothesis using all three econometric techniques. By identifying and removing obstacles to global collaboration on climate action, assessing the impact of policy uncertainty on climate change can help in international climate discussions. The current evaluations offer an in-depth understanding of the effects of EPU on environmental sustainability.
Furthermore, it details how FDI, economic development, and the adoption of renewable energy affect environmental sustainability regarding GHG emission reductions in industrialized and developing nations. To guarantee that the aims outlined in the sustainable development goals are achieved, policymakers, governments, and multinational businesses would benefit from considering the views of environmental sustainability while making decisions (SDGs). The rest of the paper is structured as follows: Section 2 comprises of overview of the GHG emissions and EPU in developed and developing economies. Section 3 represents the literature review tracked by the Methodology in Section 4. Section 5 and Section 6 comprise the Results, Discussions, and Conclusions.

2. Overview of GHG Emissions and EPU in the Selected Countries

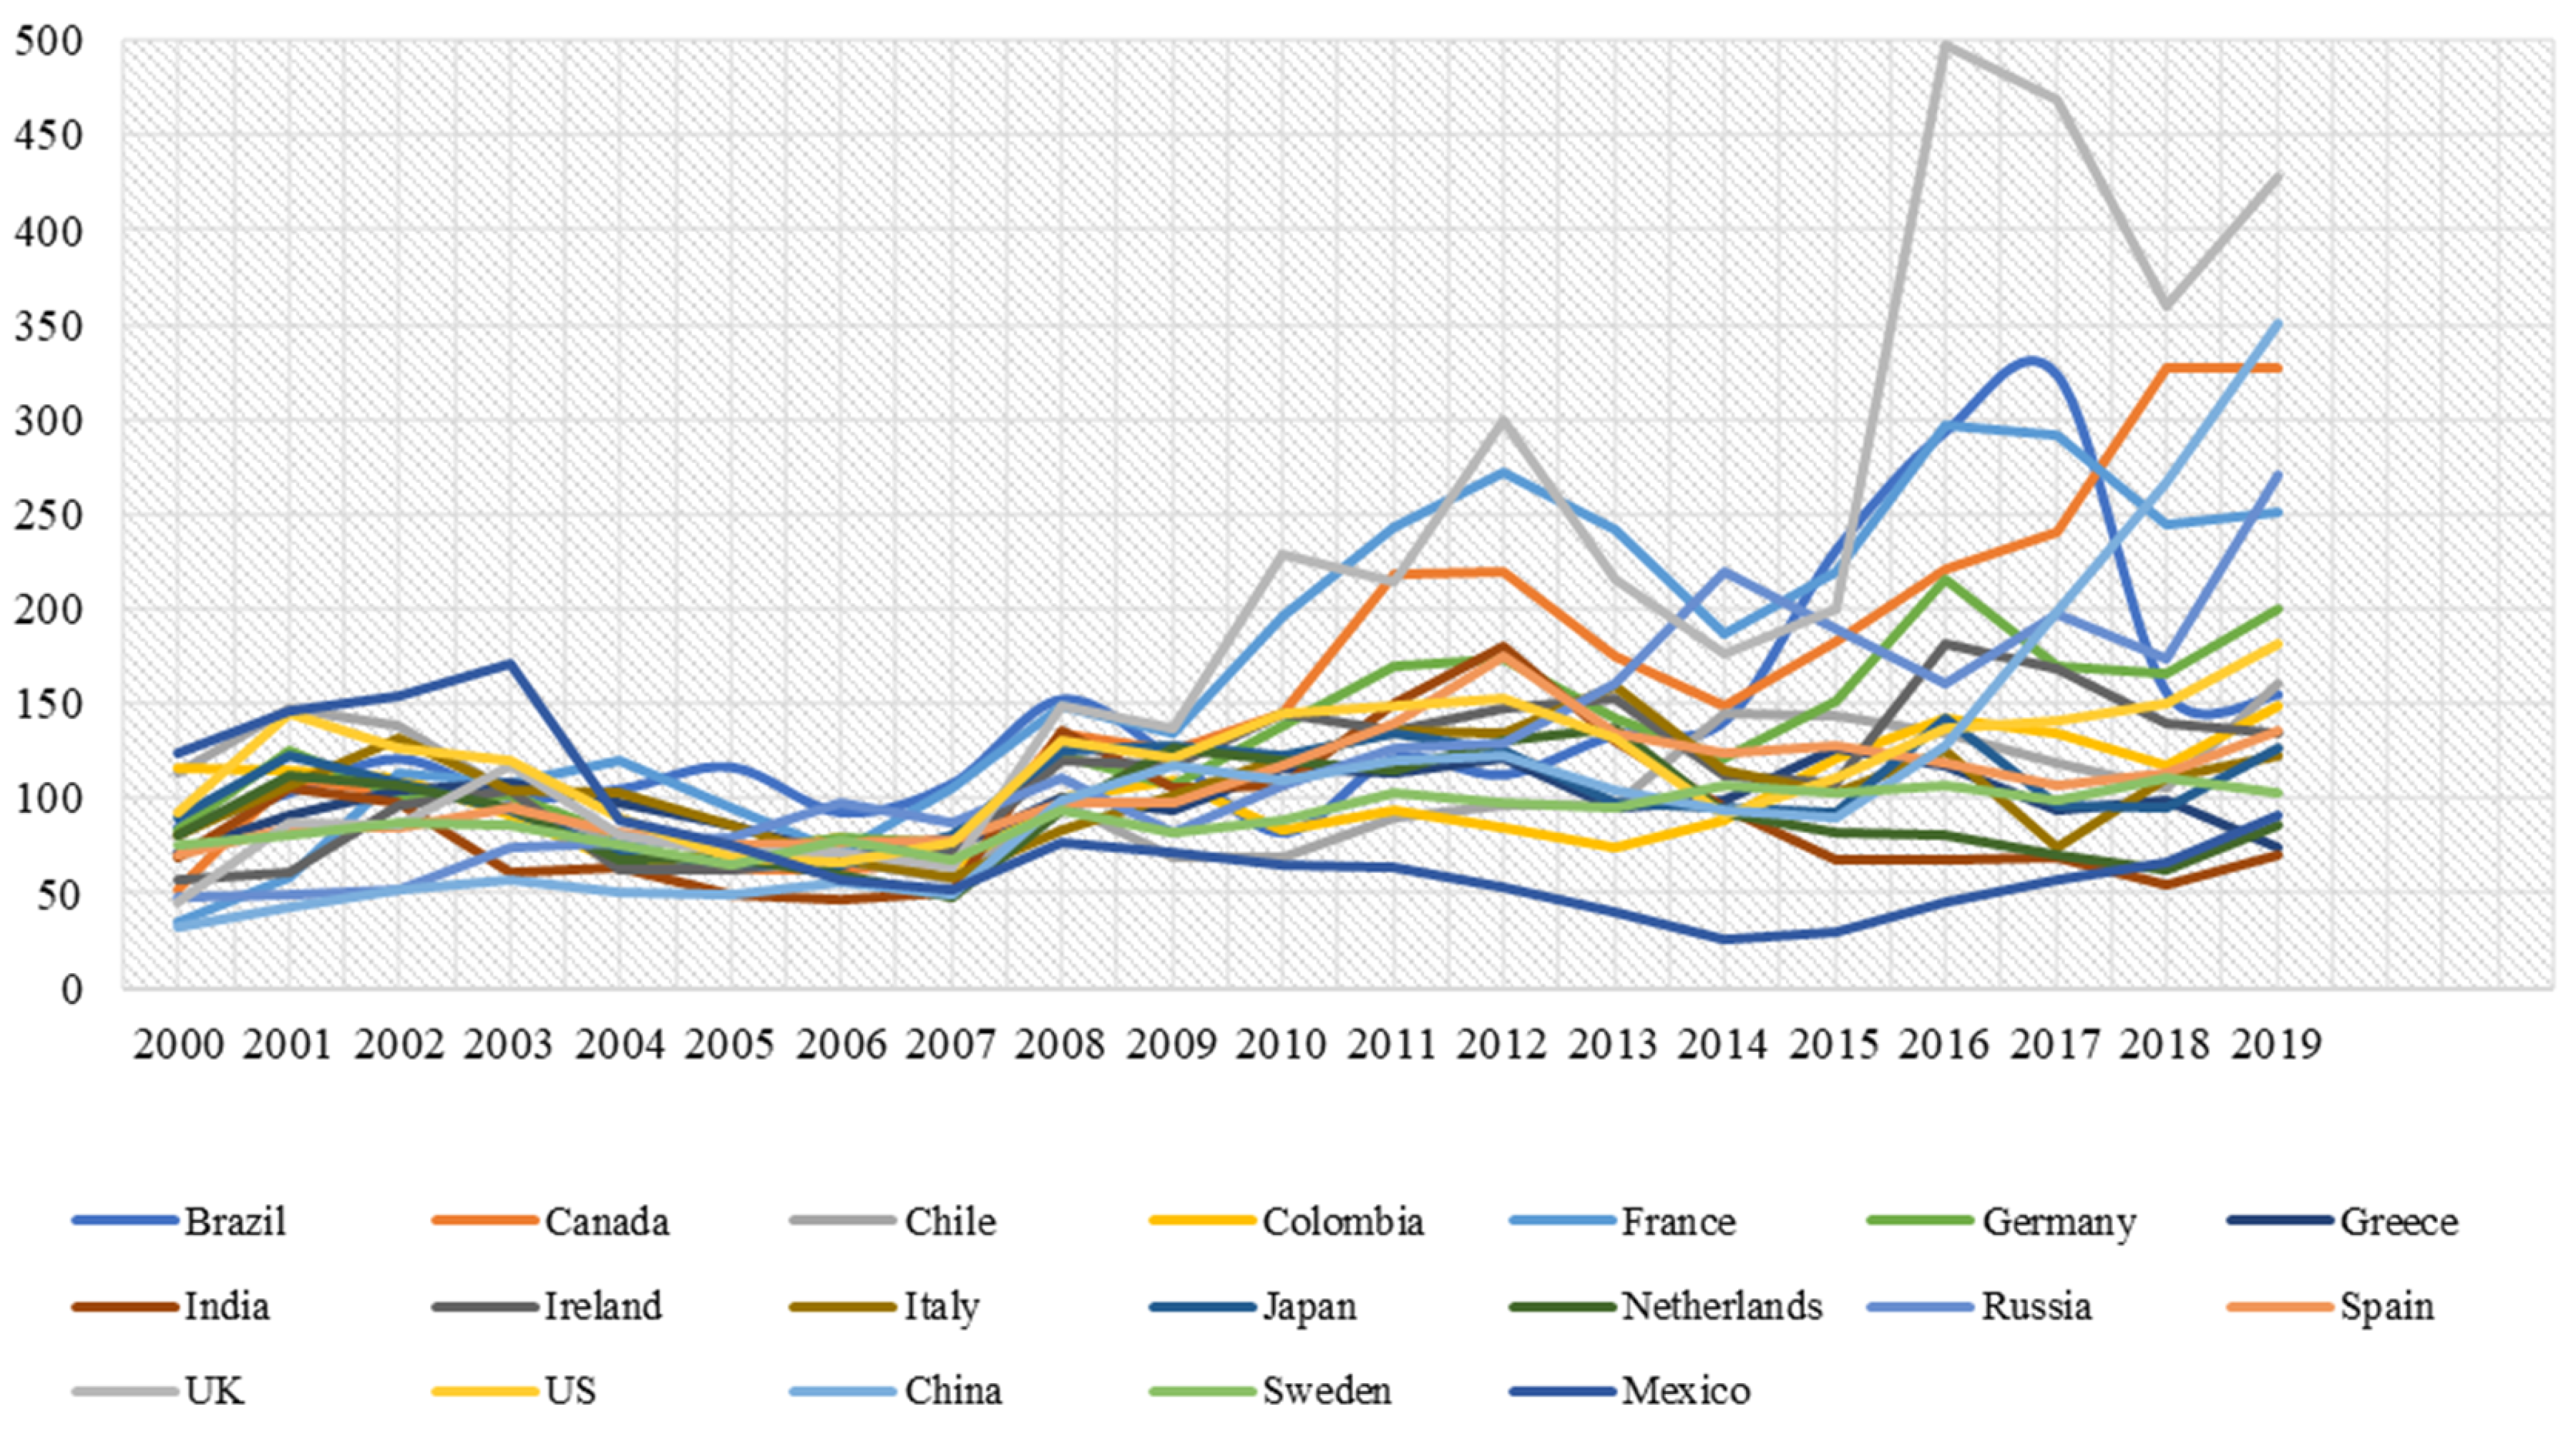
2.1. The Trends of GHG Emissions in Selected Developed and Developing Economies

The GHG emissions trends in Figure 1 show that emissions show ever-increasing trends in China and India. However, GHG emissions in China have been increasing faster than in any other economy. Moreover, the increasing trend slowed down after 2013. Many reasons have contributed to China’s higher growth in GHG emissions. One of the main reasons is the rapid industrialization and urbanization of the country, which has increased energy demand and dependence on coal for electricity production [20,21]. China’s vast population and a developing middle class have also contributed to increased consumption and transportation [22,23]. Another factor is China’s export-oriented and manufacturing-based economy, contributing to higher emissions.
Moreover, China has traditionally had weaker environmental regulations and enforcement than rich countries, which has enabled emissions to grow without restraint [24]. The data also indicate that GHG emissions have increased steadily in India after 2009. Several factors have contributed to the rise of India’s greenhouse gas emissions in the past decade. One of them is the country’s rapid industrialization and economic growth, which have raised the overall energy demand, especially for fossil fuels such as coal. The population and urbanization have also grown, which has enhanced consumption and transportation [25]. Additionally, fertilizer usage and animal emissions are influenced by the agricultural industry [26,27]. The government’s slow-moving campaign to expand the amount of electricity produced from renewable sources has yet to make up for the emissions from fossil fuels.
GHG emissions in the United States have been stable and slightly declining from 2001 to 2019. One of the main reasons is the increasing use of natural gas as an energy source, which has helped to replace coal as the primary source of power generation [28]. Due to the reduced carbon intensity of natural gas compared to coal, emissions have decreased. Furthermore, regulations like the Clean Power Plan and Clean Air Act have reduced emissions from power plants [29]. The reduction in industrial activity and outsourcing of heavy industries in the US also impacted the fall. Developing renewable energy sources—especially wind and solar—significantly reduced emissions [30]. Furthermore, several states have established regulations that have reduced emissions, such as energy efficiency standards and standards for renewable energy portfolios [30,31].
Sweden has the lowest GHG emissions levels in the current panel of selected developed and developing economies. For various reasons, Sweden has experienced fewer greenhouse gas emissions during the past 20 years. One of the main factors is the nation’s steadfast commitment to renewable energy sources [32], which has helped fossil fuels lose their dominance as the primary source of electricity generation. Examples of these sources include hydropower and bioenergy. Additionally, Sweden has enacted various laws and policies to encourage energy saving and efficiency, which has also assisted in lowering emissions [33]. The nation’s well-established public transportation system has also promoted public transportation usage in place of private vehicles. Sweden has also introduced a cap-and-trade system and carbon tax [34], which have given financial incentives for lowering emissions. Finally, compared to other nations, Sweden’s economy is less reliant on heavy industry and manufacturing, which has helped to keep emissions low.
However, different economies have shown other trends in GHG emissions. Due to various variables, distinct developing and industrialized economies exhibit varying greenhouse gas (GHG) emissions patterns. However, the levels of emissions across different sectors of the economy are also different across economies [35]. Developed economies often have more mature and diverse economies with less reliance on heavy industry and more attention paid to services and high-tech industries. Their emissions per person are typically lower as a result. Aside from that, industrialized economies usually have more robust legislative and regulatory frameworks in place to combat climate change, such as carbon pricing mechanisms, renewable energy objectives, and energy efficiency standards [32].
On the other hand, developing economies are more reliant on heavy industry, agriculture, and mining, and their populations and economies typically increase more quickly. Additionally, urbanization, as well as industrialization processes, are still underway in many emerging nations, which also contribute to more significant emissions [36]. As well as needing more financial resources to invest in low-carbon infrastructure [37], emerging economies might have different degrees of legal or legislative frameworks in place to address climate change. In conclusion, a diverse range of factors, including economic development, population growth, energy mix, and regulatory frameworks, influence the patterns in GHG emissions in various nations.

2.2. Economic Policy Uncertainty in Selected Developed and Developing Economies

EPU has risen over time in industrialized and developing nations over the past 20 years [38]. Figure 2 displays the trends in EPU in selected developed and developing economies. The trends show that EPU has been increasing across the countries in the current panel. One of the key causes is the growing interconnection of economies worldwide, which has increased sensitivity to outside political and economic shocks. The interconnectedness and growing complexity of the world’s financial markets have also raised uncertainty. Increasing political polarization and volatility in many nations is another factor that has contributed to increased policy uncertainty, particularly about topics like trade [39,40], immigration, and regulation. As a result, protectionist policies have become more prevalent, and financial markets are now more volatile [41]. Natural disasters’ growing frequency and intensity, as well as the effects of climate change, have increased uncertainty in some countries over decisions regarding energy, infrastructure, and climate change policies [42]. Finally, when governments adopted unheard-of policy measures to restore their economies and financial systems, the 2008 financial crisis and the subsequent global recession also contributed to economic policy uncertainty. Markets in Europe, China, and Japan suffer from policy uncertainty in the US [43].
EPU has also risen in emerging markets, with increased uncertainty surrounding trade, currency, and regulation [44]. The report cites instances where the spike in EPU has been attributed to factors including the tension brought on by the Brexit decision [45], the US-China trade war, and the shifting political landscape in some nations [40]. Heightened political polarization, more frequent and severe natural disasters, and the expanding interdependence of the world’s economies have caused economic uncertainty. Consequently, monetary policy uncertainty can harm investment [46], consumption, and growth [11]. Moreover, increased policy uncertainty impacts climate change mitigation and environmental sustainability [3,47,48].

3. Literature Review

The EPU and its possible impacts on environmental sustainability have attracted the attention of researchers and policymakers. Since climate change is a global issue, governments and other relevant stakeholders must work together to address it. Although businesses and individuals may experience uncertainty due to the need for clear and consistent legislative actions to address climate change, this can obstruct efforts to reduce GHG emissions and transition to a low-carbon economy. IEA [49] made the case that more clarity surrounding climate policy can prevent investments in low-carbon technology from being delayed, which would postpone the transition to a low-carbon economy. Lemoine [50] discovered that policy uncertainty increases the social cost of carbon, which is an estimate of the economic harm brought on by each additional ton of carbon dioxide emissions
A stream of studies has focused on the impact of EPU on carbon emissions. For instance, Iqbal et al. [2] indicated that, in both the short and long term, EPU significantly affects rising CO2 emissions for both industrialized and developing countries. Political stability may also contribute to lower EPU in certain nations. Another study [3], with the help of data from 325 prefecture-level cities between 2001 and 2017, determined the influence of EPU on carbon emissions in China. The findings indicate that a city’s carbon emission intensity rises by 4.28%, with a 1% increase in EPU and 0.244 tons per 10,000 yuan in absolute terms.
Uncertainty is one of the main barriers to investments in low-carbon technology, delaying the shift to a low-carbon economy [17]. Li et al. [51] demonstrate the relationship between policy uncertainty, the likelihood of successful mergers and acquisitions, and the subsequent company performance. Overall, the body of research indicates that policy uncertainty can obstruct efforts to combat climate change by delaying investments in low-carbon technology, raising the societal cost of carbon, and escalating the adverse effects of climate change. Therefore, a crucial element in combating climate change is lowering policy uncertainty. In the London Smart City case scenario context, one study [52] investigates the implications of economic and policy uncertainty on environmental sustainability. The authors employ a scenario analysis approach to assess the potential effects of various degrees of economic and political uncertainty on the implementation of renewable energy and energy efficiency measures in London. The findings suggest that the deployment of these measures can be significantly impacted by economic and policy uncertainty, with higher levels of uncertainty resulting in lower deployment rates. Overall, the study emphasizes the significance of resolving political and economic uncertainty in mitigating climate change. Wang et al. [19] also found a positive association between EPU and carbon emissions in the US.
Khan et al. [4] assessed the impact of EPU on RE in the G7 nations. The study’s findings imply that EPU has a detrimental effect on RE at all levels, showing that it disturbs the economy and causes a decline in RE. High EPU immediately impacts RE since the upper quantiles have the most influence. The results differ by nation, with the long-term impact of EPU rising in Italy, Japan, the UK, and the USA while decreasing in Germany. A stable economy is required to foster RE’s development, which may be accomplished through open and inclusive government. All interested parties and stakeholders should have access to information concerning the creation, execution, and change of policies. According to Gu et al. [53], there are several ways that EPU affects inclusive green growth (IGG), including direct effects on economic policy, and indirect effects through the “beggar-thy-neighbor” theory.
Additionally, the study reveals an inverted-U association between haze pollution and IGG. The study also discovered that media attention can lessen the damaging effects of EPU and haze pollution on IGG by encouraging a change from a “beggar-thy-neighbor” to a “neighbor-friendly” policy. The study offers a fresh viewpoint on comprehending the economic effects of EPU and offers local governments a framework to help them make climate governance decisions.
Economic policies and regulations that are uncertain can discourage companies from investing in environmental R&D or delay costly environmental projects, as they are reluctant to make such investments due to the potential risk of having to undo them later. Ir can lead to a decrease in environmental innovation by firms [5]. Atsu and Adams [54] examined the connection between climate change, energy use, and policy uncertainty using panel data for 36 industrialized and developing nations from 1980 to 2015. The findings show that policy uncertainty has a detrimental effect on energy use and emissions. The study also discovered that developing countries have a more considerable correlation between policy uncertainty and energy usage than wealthy nations. The study recommends encouraging sustainable energy usage and lower emissions, and policymakers should concentrate on eliminating policy uncertainty. The study also emphasizes how crucial it is to consider financial considerations when creating climate change strategies.
Economic uncertainty is a significant barrier to achieving decarburization and decentralization of the energy sector in developing countries. Rezaei et al. [55] analyze the economics of three grid-independent hybrid renewable-based systems designed to generate electricity and heat for small-scale loads. The study uses HOMER Pro software to find that a standalone solar/wind/electrolyze/hydrogen-based fuel cell integrated with a hydrogen-based boiler system is the most promising alternative. The study also analyzes the impact of economic uncertainty on the selected model and finds that the total net present cost (TNPC) varies symmetrically around the benchmark value, ranging from $478,704 to $814,905. Finally, the study proposes practical policies to address economic uncertainty in the energy sector of developing countries.
Ma et al. [56] propose a two-stage optimal scheduling method for active distribution networks (ADN), considering uncertainty risks such as distributed energy generation and system component failure. The approach investigates the optimal dispatching process of ADN with an energy storage system while taking into account the uncertainty risks associated with renewable resources, load, and electricity price. The first stage model is designed to minimize the cost of an ADN’s operation under normal conditions, and the second stage model aims to reduce load reduction during emergency operations. The proposed method uses the particle swarm optimization (PSO) algorithm for model optimization. The simulation results on the IEEE-33 bus system show that the proposed method is highly effective in dealing with uncertainty risks and optimizing the scheduling of ADN. In another study, Mohamed [57] presents a distributed energy management approach for microgrids and the smart grid, using a relaxed consensus + innovation method. The model includes renewable sources and storage units, with an IEEE 24-bus test system. The approach converges trading prices and transaction power between microgrids and the smart grid, and the paper analyzes the impact of uncertainty parameters. Comparing the proposed method with centralized ones demonstrates its effectiveness in energy management.
There is an unstable and dynamic relationship between EPU and carbon emission trading prices (CETP), which changes based on the frequency and amount of EPU [58]. The fact that this analysis considers the heterogeneity of EPU at various frequencies, various carbon emission markets, and the variable link between EPU and CETP to produce more accurate conclusions is one of its key contributions. These conclusions suggest that rules and regulations should be implemented to lessen the detrimental effects of EPU volatility on the carbon emission trading market. The government should develop platforms to encourage innovation and quicken the energy transition. Companies should assume responsibility for the environment and abide by environmental laws by actively engaging in the carbon emission trading market. Policy uncertainty causes behavioral changes in corporations and individuals and their decision-making in various economic activities [9]. In a recent study, Hu et al. [10] show that environmental policy uncertainty inhibits corporate green investments. The body of research implies that policy uncertainty may hinder attempts to mitigate and adapt to climate change by reducing spending on low-carbon technologies and slowing economic growth.
Further study is required to fully understand the relationship between policy uncertainty and environmental sustainability to develop effective policy responses and alleviate the detrimental consequences of policy uncertainty on environmental sustainability. For this purpose, this research develops an EPU-environmental sustainability model in the framework of EKC and pollution halo/haven hypotheses in major developed and developing economies. The study uses efficient and suitable econometric methods to estimate the proposed model and provides comparative analysis across different econometric estimation methods. The study results help understanding the insinuations of EPU on environmental sustainability in the panel of selected developed and developing economies.

4. Methodology

4.1. The Model

Since the current study is focused on examining the impact of EPU on environmental sustainability, the study considers the total GHG emissions as an indicator of CCM. Previous studies such as [2,3,47] considered CO2 as the dependent variable to assess the impact of EPU. Whereas Fu et al. [3] used urban economic policy uncertainty as an indicator of EPU. Liu and Zhang [47] used a weighted average of the news-based, tax, and forecaster disagreement components as an EPU indicator. However, the present study included the EPU index [59] to examine its impact on CCM. Following Liu and Zhang [47], this study also has GDP per capita in the model. Liu and Zhang [47] examined the impact of EPU on carbon emissions from the perspective of the EKC hypothesis in provincial-level data from 30 provinces of China from 2003 to 2017. Fu et al. [3] examined the impact of EPU on carbon emissions in 325 prefecture-level cities in China from 2001 to 2017. At the same time, Iqbal et al. [2] used data from the USA, the UK, China, Pakistan, and India to examine the impact of EPU on carbon emissions. The current study examines the effect of EPU on CCM in 19 developed and developing economies from 2001 to 2019. The panel includes the countries Brazil, Canada, Chile, China, Colombia, France, Germany, Greece, India, Ireland, Italy, Japan, Netherlands, Russia, Spain, the UK, the US, Sweden, and Mexico. These economies have been included in the panel due to the size of the economy in terms of economy, environmental pollution, geographic diversity, climate change conditions, growth patterns and structures, FDI flows, their contribution to global GHG emissions, and environmental governance policy regimes.
Moreover, these nations are distinguished by various economic, social, and political traits. It can guarantee that the findings apply to a more extensive range of situations. Moreover, data availability is one of the reasons to include these economies in the panel of developed and developing economies. The models to be estimated in this study are:
G H G = f ( E P U ,   G D P C ,   R E C ,   F D I )
ln ( G H G ) i t = β 1 ln ( E P U ) i t + β 2 ln ( G D P C ) i t + β 3 ln ( R E C ) i t + β 4 ln ( F D I ) i t + β 0 + μ i t
ln ( G H G ) i t = γ 1 ln ( E P U ) i t + γ 2 ln ( G D P C ) i t + γ 3 ln ( G D P C ) i t 2 + γ 4 ln ( R E C ) i t + γ 5 ln ( F D I ) i t + γ 0 + ε i t
In models (2) and (3), EPU is the economic policy uncertainty index. GHG is total GHG emissions (kt of CO2 equivalent), GDPC is GDP per capita, and REC is renewable energy consumption as a percentage of total final energy consumption. FDI is the net flow of foreign direct investment. GDPC was taken as constant prices in 2015. GDPC and FDI are in US dollars. GHG, GDPC, REC, and FDI data are obtained from the World Development Indicators (WDI) [60]. Moreover, the data for the EPU are taken from [59].

4.2. Econometric Methodology

4.2.1. Cross-Sectional Dependence

The presence of cross-sectional dependence (CSD) in panel data variables is likely. Breusch and Pagan [61] proposed an LM test for a seemingly unrelated regression estimation. Notably, the LM test [61] is valid for fixed N as T . It is estimated as:
L M = T i = 1 N 1 j = i + 1 N r ^ i j 2
In Equation (4), r ^ i j is the pairwise correlation of the residuals. r ^ i j is estimated as:
r ^ i j = r ^ j i = t = 1 T e ^ i t e ^ j t t = 1 T e ^ i t 2 t = 1 T e ^ j t 2
Equation (5) estimates e ^ i t as e i t in the standard panel-data model. LM is asymptotically distributed as χ 2   [ N ( N 1 ) 2   d f ] under the H 0 of interest. However, it is also notable that the LM test shows substantial size distortions if the N is large but T is finite. Pesaran [62] suggested Pesaran’s CD test to avoid such distortions. Pesaran CD estimates the statistics as:
P e s a r a n   C D = 2 T N ( N 1 ) ( i = 1 N 1 j = i + 1 N r ^ i j )
Pesaran’s CD test tests the H 0 of “no cross-sectional dependence” for N and sufficiently larger T.

4.2.2. Slope Homogeneity Test

Pesaran and Yamagata [63] developed a slope homogeneity test for the panels with large T and N based on a standardized version [64]. This test estimates the delta and adjusted delta values as:
D e l t a ^ = 1 N ( i = 1 N D ^ i k 2 2 k 2 )
In Equation (7), D e l t a ^ ~ N ( 0 ,   1 ) and D ^ i indicate the weighted difference between the cross-sectional unit-specific estimate and pooled estimate, as detailed in [65].
D e l t a ˜ a d j = N ( N 1 i = 1 N D ˜ i k 2 V a r ( Z ^ i , T i ) )
The delta and adjusted delta test if the H0 of “slope coefficients are homogenous” [63].

4.2.3. The Panel Serial Correlation, Heteroskedasticity, and Multicollinearity Tests

Due to fewer assumptions being made about individual effects, the Wooldridge serial correlation test [66,67] is robust because it can identify first-order serial correlation in panel data [67]. The Likelihood ratio (LR) test [68] and the heteroskedasticity-robust (HR) test [68] are used to assess heteroskedasticity. The variance inflating factor (VIF) is frequently employed to measure multicollinearity; however, pairwise correlation of the variables can also reveal whether it is present.

4.2.4. The Generalized Least Squares (GLS) and Panel Corrected Standard Errors (PCSE)

Generalized least squares (GLS) [69] estimate parameters in a linear regression model when the errors are not independently and identically distributed. It is a variant of the OLS technique employed to deal with the heteroskedasticity and autocorrelation in the errors problem, which is not present in the OLS approach [69]. The GLS estimator displays advantageous characteristics including unbiasedness and effectiveness when errors include heteroskedasticity and/or autocorrelation. It may also be used to estimate models that have errors that are both heteroskedastic and autocorrelated [69,70].
A statistical technique for estimating the standard errors of regression coefficients in panel data analysis is the PCSE model [70]. The model accounts for unobserved heterogeneity and temporal correlation in the data, which can result in inaccurate and ineffective standard error estimations. PCSE’s fundamental notion is to estimate the standard errors of the regression coefficients using the residuals from the regression model. Unobserved heterogeneity and temporal correlation in the data are then corrected for in these residuals using a panel-specific correction term. The “inside” estimator, a method for adjusting the residuals for the data’s individual- and time-specific effects, is used to produce this correction term. The problem of correlated errors in panel data is addressed by both PCSE and GLS, although there are differences in how they correct the connection. By measuring the covariances between the errors within groups and then changing the standard errors, PCSE corrects for correlation [71]. At the same time, GLS weights the residuals throughout the estimate procedure to account for the correlation.
Depending on the kind of dependence found in the data, PCSE or GLS should be used. The PCSE technique is a good option if cross-sectional dependency is the only type of dependence. GLS is a better approach if there is additional time dependency. Additionally, when the error terms are heteroscedastic, GLS is a better choice. In conclusion, both PCSE and GLS are helpful techniques for handling panel data, but they work best with specific kinds of dependencies. Cross-sectional dependency is corrected using PCSE, while cross-sectional, temporal, and heteroscedastic dependence are all corrected using GLS [70].

5. Econometric Analyses: Results

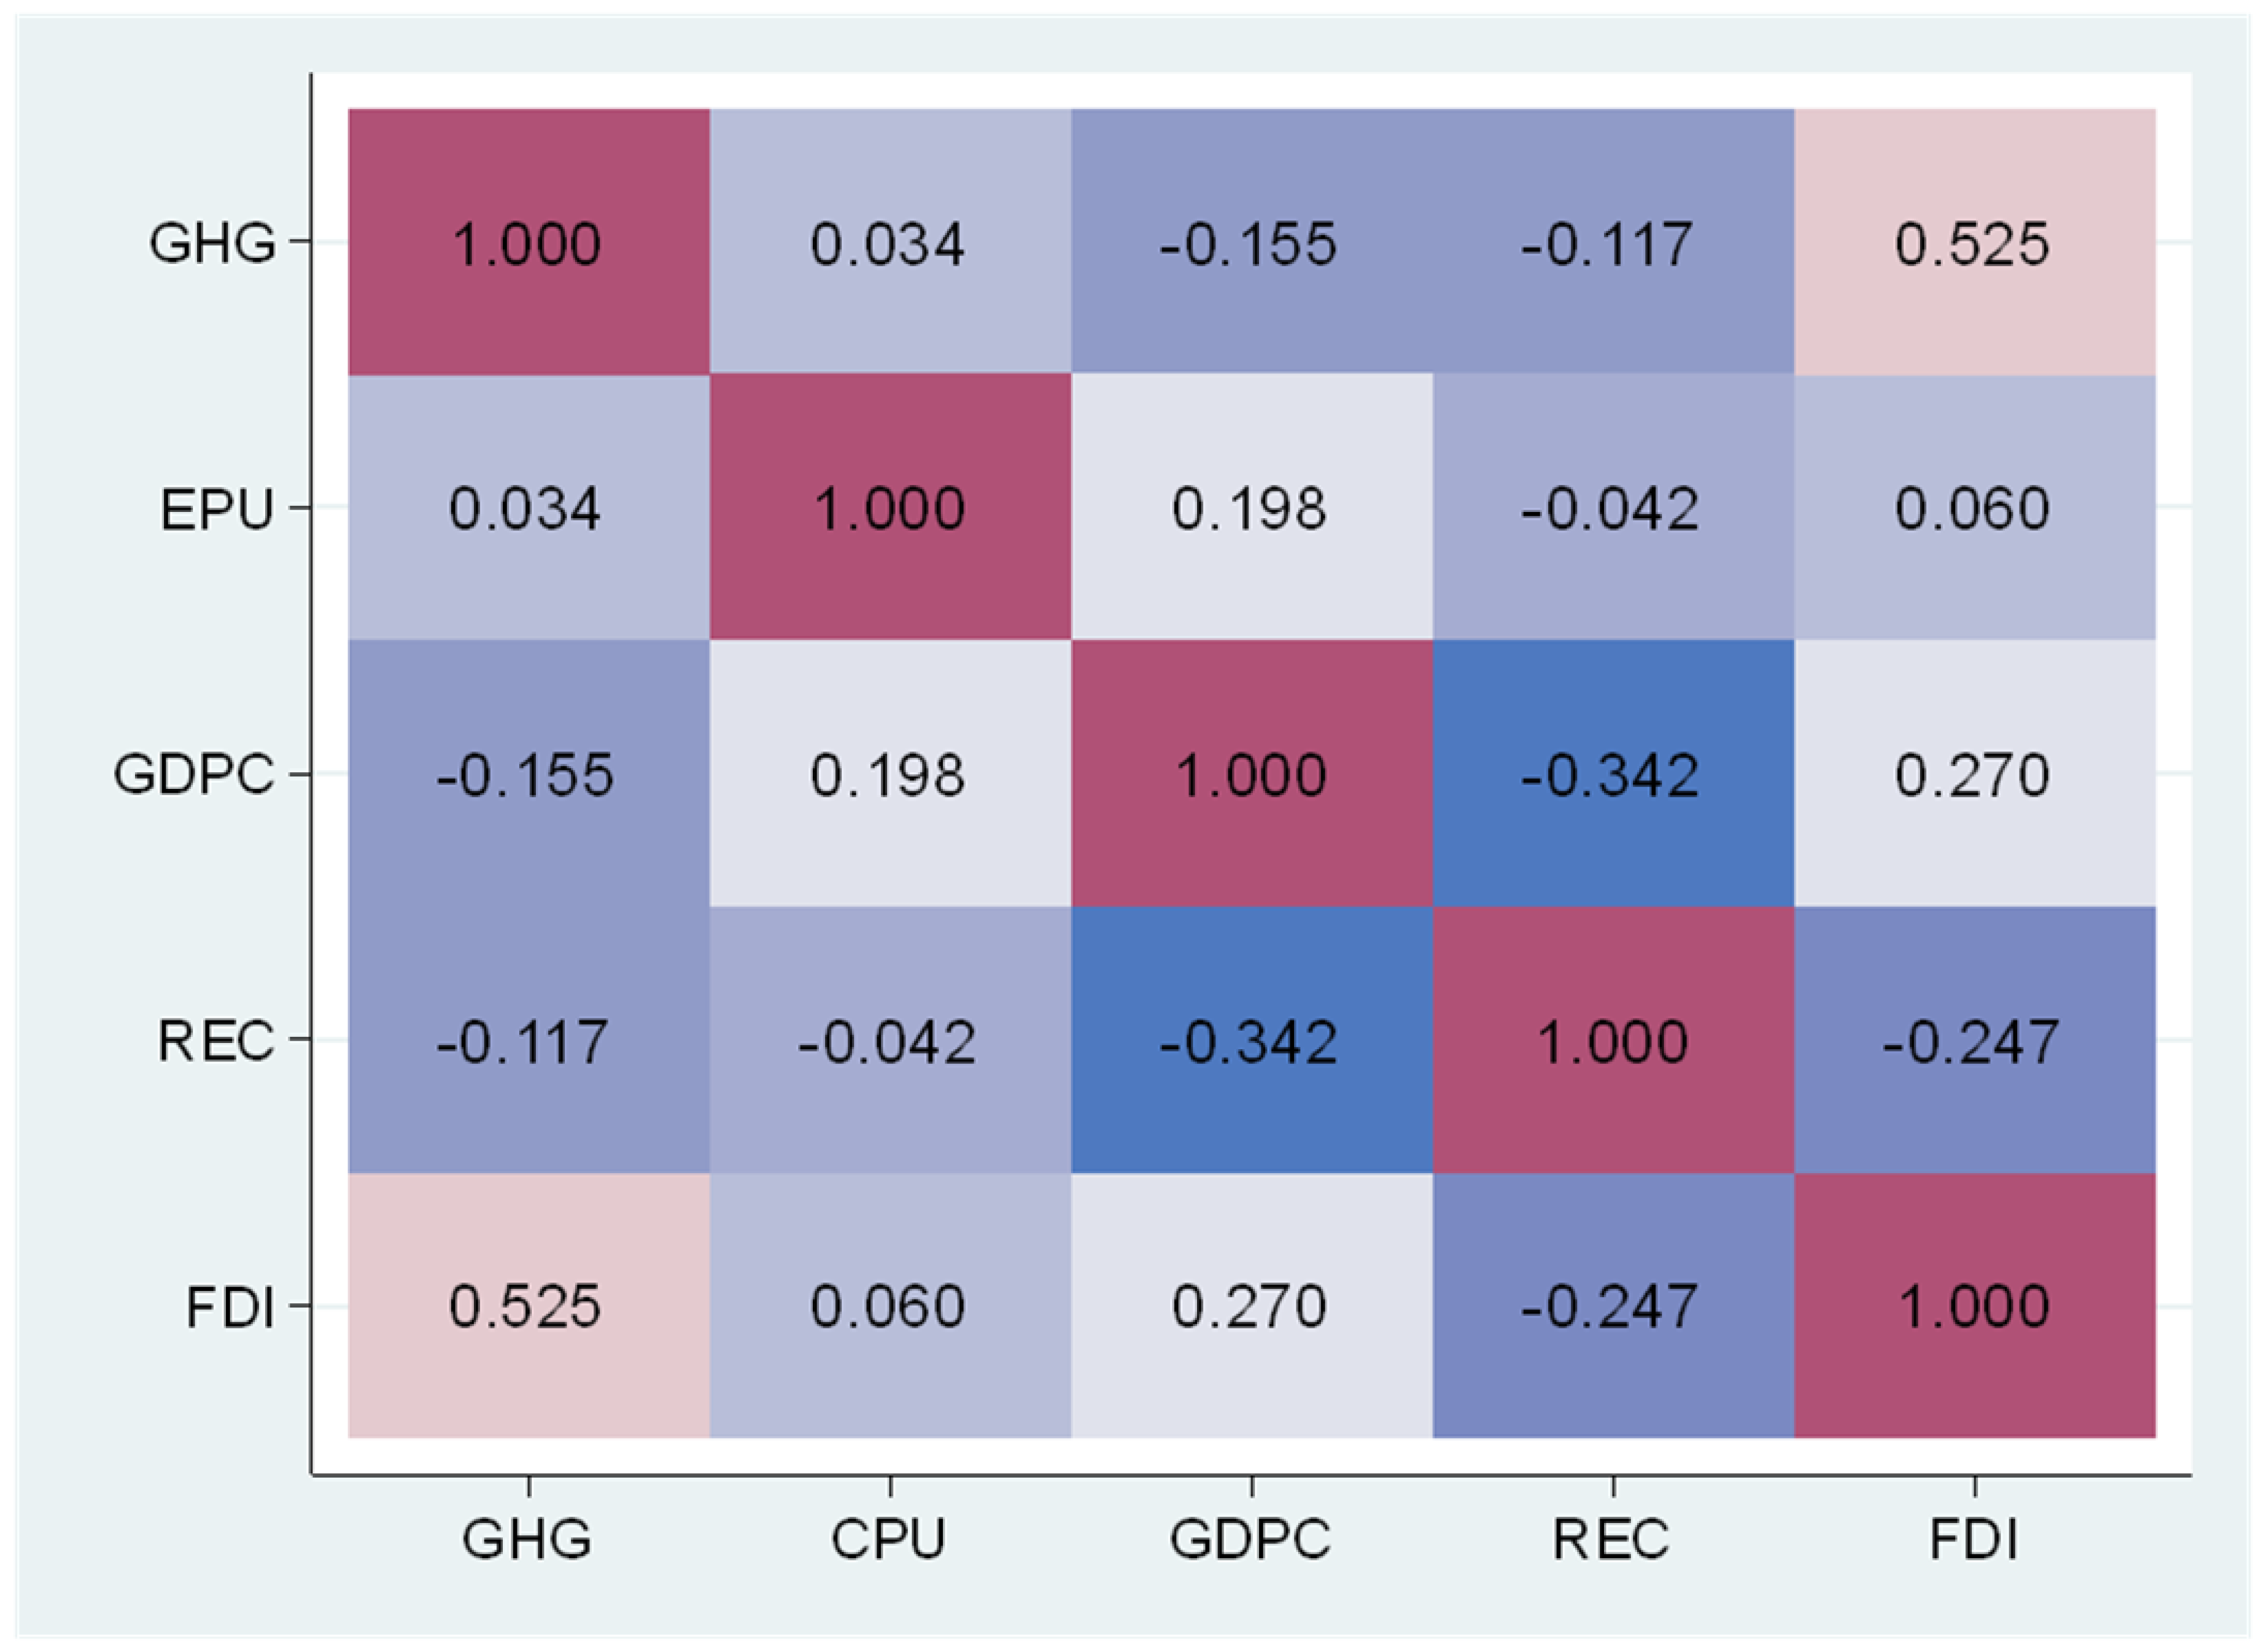
5.1. Cross-Sectional Dependence, Correlation, Heteroskedasticity, and Heterogeneity Tests Results

The Pesaran cross-sectional dependence test [62] values (Table 1) show that the null hypothesis of cross-sectional independence for LGHG could not be rejected as its p-value is more than 0.05. However, the null hypothesis of cross-sectional independence is rejected for the rest of the variables, which provides strong reasons to believe that there is cross-sectional dependence across the panel.
Bias-corrected-Q(p) test [68] results (Table 1) show that there might be a serial correlation as Q(p) test statistics are significant at lag 1. Similarly, the Q(k) test [68] is also significant, with a p-value < 0.00 for all variables at order 1, which confirms the presence of serial correlation. However, the heteroskedasticity-robust [68] HR test shows that the HR statistics for LGHG and LREC are significant but insignificant for LEPU. Moreover, the HR test values for LGDPC and LFDI are significant at the 0.10 level. The CIPS [72] values of LGHG, LEPU, LGDPC, LREC, and LFDI are −3.436, −2.75, −2.939, −2.956, and −3.214, respectively, which is less than the 5 percent critical value of −2.73, confirming that the second-generation test rejects the null hypothesis of a unit-root process for the variables. The results of the slope homogeneity test (Table 1) show that the null hypothesis could not be rejected for LGHG, LEPU, or LGDPC. However, the null hypothesis for the variables LREC and LFDI is the Delta and Adj. Delta values are significant at the 0.01 level. The Wooldridge test for serial correlation [66] strongly rejects the null hypothesis of no 1st order serial correlation. The LR χ2 test proved the existence of heteroskedasticity with a p-value of less than 0.01. The low correlation coefficients among the independent variables in the model, as shown by the correlation heat map in Figure 3, imply that multicollinearity is not an issue. Moreover, the Mean VIF is less than 5, proving that multicollinearity was not a problem.

5.2. Results of the GHG-EPU Model

The present study aimed to examine the impact of EPU on environmental sustainability measured by GHG emissions from the perspectives of the EKC and pollution halo/haven hypothesis in developed and developing economies. Three econometric methods were used for the models’ estimations to pursue the current research’s objective. Having confirmed the cross-sectional dependence, panel correlations, and heteroskedasticity in the dataset, the authors used the GLS and PCSE methods. The results of the econometric estimations summarized in Table 2 reveal that the EPU has positive and statistically significant signs in both linear and quadratic models. This result is the same across the different estimation techniques. Moreover, the significance level of the coefficients of ln ( E P U ) i t in all estimated models is very high. It confirms that, in developed and developing economies, EPU negatively affects environmental sustainability efforts as the increase in EPU causes an increase in GHG emissions.
The signs of ln ( G D P C ) i t in all linear models across different estimation methods are negative and significant with p v a l u e ( s ) < 0.01 . After confirming the significance of ln ( G D P C ) i t , the authors estimated the quadratic model to assess whether the EKC hypothesis is valid while considering the EPU in the models. The results show that the ln ( G D P C ) i t 2 GHG elasticities are positive and significant. The significance of ln ( G D P C ) i t and ln ( G D P C ) i t 2 confirm the existence of U-shaped EKC in the selected developed and developing economies. When it comes to renewable energy consumption, the ln ( R E C ) i t elasticities of GHG are negative both in linear and quadratic models and signs are the same across the estimation techniques. The elasticities are also significant at the 0.01 level. The elasticities of ln ( F D I ) i t have positive signs in linear and quadratic models estimated by three different econometric methods. It is also noteworthy that all these elasticities are highly significant with   p v a l u e ( s ) < 0.01 . The positive association between FDI and GHG emissions confirms the existence of the pollution haven hypothesis (PHH) in the selected developed and developing economies. This result is in agreement with the results of [73], which also confirms the PHH in PIIGS economies.

5.3. Discussion

The econometric analysis of this study has revealed that EPU has a negative effect on environmental sustainability as it raises GHG emissions. This positive link between EPU and GHG emissions may have different underlying reasons in developed and developing economies. For example, EPU may lead to higher GHG emissions in developed economies because of delayed and slower implementation of mitigation policies and measures. EPU may create uncertainty about economic policies as they can produce unforeseen future outcomes. In such cases, the decision-makers may put off implementing mitigation measures; consequently, higher emissions can prolong for an extended period. Moreover, heightened EPU may cause a reduction or slow the pace of the transition from traditional fossil fuels to renewable energy adoption. Further delays in climate policies hurt economic growth [74] and have ramifications on the transition to a greener future. The longer the country’s delay in transitioning the larger the cost would be [74]. It would hamper the progress to a low-carbon economic transition. Moreover, it provides strong reasons to believe governments and policymakers should introduce strategies to decrease EPU to speed up and promote an eco-friendly transformation process. Decreased EPU would be helpful in the economy’s structural transformation from fossil fuel to alternative renewable and clean energy in production and consumption. The findings of this study are also supported by the result of [19], which asserts that consumption and investment channels are how EPU affects environmental quality. EPU has a positive impact on environmental quality through the channel of reduction in the consumption of energy-intensive consumables products. Whereas it deteriorates environmental quality through investment channels by hampering technological innovation and development and causing a decrease in R&D [19]. Energy intensity, fossil fuel share, and innovation are three mechanisms that link EPU and environmental quality. Yu et al. [75] argue that EPU makes energy use more intensive, which worsens environmental quality. Furthermore, EPU increases the reliance on non-renewable energy sources, which leads to higher CO2 emissions [75]. Lastly, EPU lowers technological innovation and development, discourages capital investment in energy-efficient technology, and harms environmental quality. Additionally, EPU reduces R&D investment, slows technological innovation and progress, and raises CO2 emissions [75,76].
Moreover, it also impacts the investors’ decisions to invest in clean and renewable energy technology. Higher levels of EPU in the economy tend to incentivize emission-intensive activities in the economies. In such cases, the decision-makers, especially business decisions, may have emission-increasing economic impacts. Another source of the positive association between EPU and GHG emissions is that the amplified EPU may have caused a lack of regulatory clarity, primarily related to climate and environmental governance. Fu et al. [3] support this argument. This situation may cause businesses to be less inclined to adopt emissions-reducing technology due to unclear laws and their less stringent implementation. Other factors, such as fiscal decentralization, green energy, and green innovation, can amplify or mitigate the effect of EPU on environmental sustainability [77]. Udeaghan and Muchapondwa [76] also confirmed the presence of EKC. However, in this study, the authors used the scale effect and technique effect as proxies of economic growth and square of economic growth, respectively. The results of [76] confirm that environmental quality deteriorates with the increase in scale effect.
The positive association between EPU and GHG emissions may also be due to similar reasons. In developing economies with low renewable energy production and consumption levels, increased EPU can affect the investment in cleaner energy. EPU hampers the transition to a low-carbon economy by deterring investment in clean and renewable energy technology. The developing economies already dependent on traditional fossil fuels may also find it difficult and uncertain to speed up the transition to cleaner and eco-friendly production and consumption practices without clear economic policies. The emerging economies may find it comfortable to keep relying on fossil fuels and continue to increase GHG emissions. Our findings also corroborate the findings of [3].
In the linear models, the economic growth measured by GDP per capita has shown the GHG emission reduction impact, and these results are consistent across different estimation methods. However, the square of GDP per capita has a positive and significant sign across these estimation methodologies. Moreover, this confirms the U-shaped EKC in the selected developed and developing economies. The negative impact of economic growth on GHG emissions may be due to increased environmental regulations, stimulated technological progress, and a shift in energy production and consumption patterns. The adoption of renewable energy due to increased purchasing power and living standards might have this impact as households shift their energy use to cleaner energy [78].
Moreover, increased awareness of the household regarding climate change and global warming and their consequences might contribute to this behavior, especially in developed economies. Furthermore, in developed economies, many industrial processes need a lot of energy, and economic expansion may result in higher industrial production and GHG emissions. However, it is also valid for developing economies [1]. Notably, higher economic growth achievement and infrastructure development, such as the erection of new structures, highways, and transit networks, frequently follows more significant economic expansion [79]. Since the manufacturing and use of construction materials, such as cement and steel, are frequently energy-intensive and produce significant quantities of GHGs [80], this may lead to higher GHG emissions. Mahmoodi and Dahmardeh [18] also confirmed an inverted U-shaped EKC nexus between environmental degradation measured by ecological footprint and economic growth.
In pursuing rapid economic growth, developing economies may need more focus on GHG emission reductions. Moreover, developing economies are mostly capital starved and need more resources to contribute to achieving environmental sustainability by reducing GHG emissions. Another reason for the positive association between economic growth and GHG emissions may be the environmental regulations and policies pursued. While considering the objective of higher growth trajectories, developing and developed economies might compromise environmental quality. Moreover, developing and emerging economies depend more on natural resources while fueling their higher growth trajectories [81]. Because of their potential reliance on natural resources like forests and minerals, developing economies may experience significant environmental degradation due to resource exploitation and extraction.
Furthermore, energy consumption frequently rises with economic expansion, especially in fossil fuels like coal, oil, and natural gas. Higher GHG emissions may be the outcome of this rise in energy usage. Bekun et al. [82] agree that fossil fuels distort environmental sustainability. As more people and things are transported across the economy due to economic expansion, transportation needs may also rise. This increase in mobility may result in increased GHG emissions given that fossil fuels [83,84] frequently drive transportation.
Renewable energy reduces GHG emissions, confirming its positive role in achieving environmental sustainability efforts. Renewable energy sources, including wind, solar, hydropower, geothermal, and bioenergy, operate without emitting GHGs. Moreover, this contrasts with fossil fuels, such as coal, oil, and natural gas, which, when burned for energy, emit significant volumes of CO2 and other GHGs into the environment. The findings of the recent econometric analysis provide strong reasons to believe that reducing GHG emissions and lessening the impact of climate change is possible by using fossil fuels and more renewable energy sources. For instance, no direct GHG emissions are associated with energy production from solar and wind turbines. The low GHG emissions related to hydropower are due to the decomposition of organic materials in reservoirs.
Furthermore, using fossil fuels in other industries, including transportation and heating, may be replaced by renewable energy technology. For example, geothermal and biomass may replace fossil fuels used to heat houses and buildings, while electric cars driven by renewable energy can cut GHG emissions from the transportation sector. In general, switching to renewable energy is essential in lowering GHG emissions and building a sustainable, low-carbon future. The present study’s results agree with the results of [73,78] that renewable energy strongly inhibits carbon emissions. However, there is a dire need to address the issues related to EPU to promote REC in these economies.
FDI increases GHG emissions in selected developed and developing economies. The negative impact of FDI flows on environmental sustainability may be due to multiple factors. For instance, the FDI flows to developing new fossil fuel-based energy sources, such as coal mines and oil and gas drilling activities, which may be a part of FDI in the energy industry. The extraction, processing, and transportation of fossil fuels can cause significant GHG emissions due to these processes. In host economies, FDI may also increase industrial production. Increased GHG emissions may arise from this increased output, especially from industrial procedures that use much energy and emit pollutants into the atmosphere.
Moreover, FDI in consumer products and services can lead to greater consumption, which raises GHG emissions. For instance, FDI in the automotive sector may result in increased car production and use, which may raise transportation-related emissions. Furthermore, FDI in the agricultural, forestry, and other land-use sectors may cause changes in land use that increase greenhouse gas emissions. As an illustration, the conversion of forests to agricultural land may cause the release of carbon that has been stored in the soil and trees, increasing GHG emissions. Results are in agreement with that of [73,85,86]. The results of [86] show that the FDI from different economies has a different impact on GHG emissions in host economies. For instance, the FDI flows from Denmark and the UK were found to increase CO2 emissions in BRICS economies, confirming the PHH. Whereas the FDI flows from France, Germany, and Italy were found to reduce CO2 emissions in these groups of countries. Therefore, through various direct and indirect mechanisms, FDI can increase GHG emissions in host countries. Industrialized and developing countries must create laws encouraging sustainable and low-carbon investment, and investors must consider the GHG emissions associated with their investment decisions to mitigate these consequences.

6. Conclusions

This study has focused on the analysis of the impact of EPU on environmental sustainability while considering the EKC and pollution halo/pollution haven hypotheses in 19 developed and developing economies from 2001 to 2019. Moreover, the study also includes renewable energy consumption in the model to assess its impact on environmental sustainability in the presence of EPU. The results of the econometric analyses reveal that EPU negatively impacts environmental sustainability as it increases GHG emissions. Moreover, economic growth indicators have shown a beneficial impact on climate mitigation in a linear form. However, the square of the economic growth indicator increases GHG emissions confirming the U-shaped EKC. The findings also demonstrate a pollution haven hypothesis in the selected panel of countries. However, REC offers a positive impact on environmental sustainability as it reduces GHG emissions and helps in achieving the objective of environmental sustainability.
The findings imply that the economies should focus on reducing the EPU to promote environmental sustainability and encourage sustainable economic growth. Governments may lessen uncertainty in economic policy by stabilizing economic policy—such as tax, interest, and monetary policy—and preventing abrupt or unexpected changes. Such government actions would provide a predictable and stable corporate climate that promotes investment and economic expansion. Moreover, governments may make economic policymaking more transparent by creating their aims, objectives, and decision-making procedures apparent to the general public and the business sector. Moreover, this can aid in lowering uncertainty and boosting confidence in the formulation of policies. Governments may encourage long-term planning by enacting laws focusing on long-term solutions rather than quick remedies. Giving people and companies a transparent and predictable policy framework can aid in reducing uncertainty. To foster agreement and guarantee that policies represent the needs and objectives of the larger society, governments can encourage communication and cooperation between enterprises, people, and stakeholders. Governments may remove structural obstacles, such as regulatory red tape, that discourage investment and slow economic progress.
Additionally, this may be accomplished by simplifying rules and lowering bureaucracy to facilitate corporate operations and investment. The findings imply that wealthy nations may act as role models for developing countries regarding their policies for mitigating the effects of climate change. Developing nations can gain from transferring technology and knowledge from developed nations. This analysis offers insightful information on how climate mitigation, economic development, and economic policy uncertainty interact in established and emerging economies. The current study provides an extensive analysis of the EPU-environmental sustainability relationship from the perspectives of EKC and pollution halo/haven hypotheses. However, like all research, this research is also prone to some limitations. One of the significant limitations of the study is the availability of extensive and reliable data, especially on economic policy uncertainty. The EPU may not be the source of uncertainty. The latter may be due to other sources, such as political uncertainty and regional uncertainty; for instance, the uncertainty resulting in the wake of the Ukraine war, the US-China trade war, and the emergence of a pandemic.
Moreover, natural disasters such as unprecedented heat waves and unexpected downpours in Pakistan during the summer of 2022 can also be a source of uncertainty. Notably, the decrease in environmental sustainability is also a source of uncertainty. It makes this situation more complex. Moreover, the data on economic policy is limited as it is only available for some economies. Even though the data is available, the sources of economic policy uncertainty may be different in different economies depending on the size of the economy, natural resource endowment, economic structures, governance levels, levels of institutional quality and capability, sociocultural systems, and responses of these economies to the policy uncertainty. Multiple avenues are open to researchers and experts to dig deeper into environmental policy uncertainty and environmental sustainability in developed economies and underdeveloped and emerging ones.

Author Contributions

Conceptualization, H.H.; methodology, S.A. and Y.A.S.; validation, H.H. and S.A.; formal analysis, H.H.; investigation, H.H. and Y.A.S.; data collection, H.H.; writing—original draft reparation, H.H. and S.A.; writing—review and editing, Y.A.S. and S.A.; supervision, Y.A.S.; funding acquisition, H.H. All of the authors contributed significantly to the completion of this review, conceiving and designing the review, and writing and improving the paper. All authors have read and agreed to the published version of the manuscript.

Funding

This work was supported by a major project in Humanities and Social Science Research of Higher Education Institutions in Anhui Province (2022AH040286) and a key project in Humanities and Social Science Research of Higher Education Institutions in Anhui Province (SK2021A0506).

Institutional Review Board Statement

Not applicable.

Informed Consent Statement

Not applicable.

Data Availability Statement

The datasets used and/or analyzed during the current study are available on reasonable request.

Conflicts of Interest

The authors declare no conflict of interest.

References

  1. Ali, S.; Xu, H.; Yang, K.; Solangi, Y.A. Environment Management Policy Implementation for Sustainable Industrial Production under Power Asymmetry in the Graph Model. Sustain. Prod. Consum. 2022, 29, 636–648. [Google Scholar] [CrossRef]
  2. Iqbal, M.; Chand, S.; Ul Haq, Z. Economic Policy Uncertainty and CO2 Emissions: A Comparative Analysis of Developed and Developing Nations. Environ. Sci. Pollut. Res. Int. 2022, 30, 15034–15043. [Google Scholar] [CrossRef] [PubMed]
  3. Fu, L.; Chen, Y.; Xia, Q.; Miao, J. Impact of Economic Policy Uncertainty on Carbon Emissions: Evidence at China’s City Level. Front. Energy Res. 2022, 10, 504. [Google Scholar] [CrossRef]
  4. Khan, K.; Su, C.W. Does Policy Uncertainty Threaten Renewable Energy? Evidence from G7 Countries. Environ. Sci. Pollut. Res. 2022, 29, 34813–34829. [Google Scholar] [CrossRef] [PubMed]
  5. Kyaw, K. Effect of Policy Uncertainty on Environmental Innovation. J. Clean. Prod. 2022, 363, 132645. [Google Scholar] [CrossRef]
  6. Anser, M.K.; Syed, Q.R.; Lean, H.H.; Alola, A.A.; Ahmad, M. Do Economic Policy Uncertainty and Geopolitical Risk Lead to Environmental Degradation? Evidence from Emerging Economies. Sustainability 2021, 13, 5866. [Google Scholar] [CrossRef]
  7. Adger, W.N.; Huq, S.; Brown, K.; Declan, C.; Mike, H. Adaptation to Climate Change in the Developing World. Prog. Dev. Stud. 2003, 3, 179–195. [Google Scholar] [CrossRef]
  8. Xue, C.; Shahbaz, M.; Ahmed, Z.; Ahmad, M.; Sinha, A. Clean Energy Consumption, Economic Growth, and Environmental Sustainability: What Is the Role of Economic Policy Uncertainty? Renew. Energy 2022, 184, 899–907. [Google Scholar] [CrossRef]
  9. Dang, M.; Henry, D.; Thai, H.A.; Vo, X.V.; Mazur, M. Does Policy Uncertainty Predict the Death of M&A Deals? Finance Res. Lett. 2022, 46, 102489. [Google Scholar] [CrossRef]
  10. Hu, Y.; Bai, W.; Farrukh, M.; Koo, C.K. How Does Environmental Policy Uncertainty Influence Corporate Green Investments? Technol. Forecast. Soc. Change 2023, 189, 122330. [Google Scholar] [CrossRef]
  11. Wen, J.; Khalid, S.; Mahmood, H.; Yang, X. Economic Policy Uncertainty and Growth Nexus in Pakistan: A New Evidence Using NARDL Model. Econ. Change Restruct. 2022, 55, 1701–1715. [Google Scholar] [CrossRef]
  12. Pirgaip, B.; Dinçergök, B. Economic Policy Uncertainty, Energy Consumption and Carbon Emissions in G7 Countries: Evidence from a Panel Granger Causality Analysis. Environ. Sci. Pollut. Res. 2020, 27, 30050–30066. [Google Scholar] [CrossRef] [PubMed]
  13. Zhu, S.; Yu, G. The Impact of Economic Policy Uncertainty on Industrial Output: The Regulatory Role of Technological Progress. Sustainability 2022, 14, 10428. [Google Scholar] [CrossRef]
  14. Yang, X.; Mao, S.; Sun, L.; Feng, C.; Xia, Y. The Effect of Economic Policy Uncertainty on Green Technology Innovation: Evidence from China’s Enterprises. Sustainability 2022, 14, 11522. [Google Scholar] [CrossRef]
  15. Xu, Y.; Yang, Z. Economic Policy Uncertainty and Green Innovation Based on the Viewpoint of Resource Endowment. Technol. Anal. Strateg. Manag. 2021. [Google Scholar] [CrossRef]
  16. Khan, Y.; Hassan, T.; Kirikkaleli, D.; Xiuqin, Z.; Shukai, C. The Impact of Economic Policy Uncertainty on Carbon Emissions: Evaluating the Role of Foreign Capital Investment and Renewable Energy in East Asian Economies. Environ. Sci. Pollut. Res. 2022, 29, 18527–18545. [Google Scholar] [CrossRef]
  17. Noailly, J.; Nowzohour, L.; van den Heuvel, M. Does Environmental Policy Uncertainty Hinder Investments Towards a Low-Carbon Economy? NBER Working Paper Series; NBER: Cambridge, MA, USA, 2022. [Google Scholar]
  18. Mahmoodi, M.; Dahmardeh, N. Environmental Kuznets Curve Hypothesis With Considering Ecological Footprint and Governance Quality: Evidence From Emerging Countries. Front. Environ. Sci. 2022, 10, 114. [Google Scholar] [CrossRef]
  19. Wang, Q.; Xiao, K.; Lu, Z. Does Economic Policy Uncertainty Affect CO2 Emissions? Empirical Evidence from the United States. Sustainability 2020, 12, 9108. [Google Scholar] [CrossRef]
  20. Dong, K.Y.; Sun, R.J.; Li, H.; Jiang, H.D. A Review of China’s Energy Consumption Structure and Outlook Based on a Long-Range Energy Alternatives Modeling Tool. Pet. Sci. 2017, 14, 214–227. [Google Scholar] [CrossRef] [Green Version]
  21. Wu, W.; Lin, Y. The Impact of Rapid Urbanization on Residential Energy Consumption in China. PLoS ONE 2022, 17, e0270226. [Google Scholar] [CrossRef]
  22. Peng, S.; Wang, X.; Du, Q.; Wu, K.; Lv, T.; Tang, Z.; Wei, L.; Xue, J.; Wang, Z. Evolution of Household Carbon Emissions and Their Drivers from Both Income and Consumption Perspectives in China during 2010–2017. J. Environ. Manag. 2023, 326, 116624. [Google Scholar] [CrossRef] [PubMed]
  23. Wei, L.; Li, C.; Wang, J.; Wang, X.; Wang, Z.; Cui, C.; Peng, S.; Liu, Y.; Yu, S.; Wang, L.; et al. Rising Middle and Rich Classes Drove China’s Carbon Emissions. Resour. Conserv. Recycl. 2020, 159, 104839. [Google Scholar] [CrossRef]
  24. OECD. Environmental Compliance and Enforcement in China: An Assessment of Current Practices and Ways Forward; OECD: Hanoi, Vietnam, 2006. [Google Scholar]
  25. Wang, H.; Asif Amjad, M.; Arshed, N.; Mohamed, A.; Ali, S.; Haider Jafri, M.A.; Khan, Y.A. Fossil Energy Demand and Economic Development in BRICS Countries. Front. Energy Res. 2022, 10, 335. [Google Scholar] [CrossRef]
  26. Vetter, S.H.; Sapkota, T.B.; Hillier, J.; Stirling, C.M.; Macdiarmid, J.I.; Aleksandrowicz, L.; Green, R.; Joy, E.J.M.; Dangour, A.D.; Smith, P. Greenhouse Gas Emissions from Agricultural Food Production to Supply Indian Diets: Implications for Climate Change Mitigation. Agric. Ecosyst. Environ. 2017, 237, 234. [Google Scholar] [CrossRef] [Green Version]
  27. Sah, D.; Devakumar, A.S. The Carbon Footprint of Agricultural Crop Cultivation in India. Carbon Manag. 2018, 9, 213–225. [Google Scholar] [CrossRef]
  28. Popovich, N.; Plumer, B. How Does Your State Make Electricity? The New York Times. Available online: https://www.nytimes.com/interactive/2020/10/28/climate/how-electricity-generation-changed-in-your-state-election.html (accessed on 31 January 2023).
  29. US EPA. FACT SHEET: Overview of the Clean Power Plan; US EPA: Washington, DC, USA, 2017.
  30. Kabeyi, M.J.B.; Olanrewaju, O.A. Sustainable Energy Transition for Renewable and Low Carbon Grid Electricity Generation and Supply. Front. Energy Res. 2022, 9, 1032. [Google Scholar] [CrossRef]
  31. EESI US. Leads in Greenhouse Gas Reductions, but Some States Are Falling Behind. Available online: https://www.eesi.org/articles/view/u.s.-leads-in-greenhouse-gas-reductions-but-some-states-are-falling-behind (accessed on 31 January 2023).
  32. Jolien, N. Sweden: Progress in Teh Net Zero Transition. 2021. Available online: https://www.oecd.org/regional/RO2021%20Sweden.pdf (accessed on 6 January 2023).
  33. MOE Sweden. Sweden’s Long-Term Strategy for Reducing Greenhouse Gas Emissions; Ministry of Environment (MOE), Government Offices of Sweden: Stockholm, Sweden, 2020.
  34. Carl, J.; Fedor, D. Tracking Global Carbon Revenues: A Survey of Carbon Taxes versus Cap-and-Trade in the Real World. Energy Policy 2016, 96, 50–77. [Google Scholar] [CrossRef] [Green Version]
  35. Lamb, W.F.; Grubb, M.; Diluiso, F.; Minx, J.C. Countries with Sustained Greenhouse Gas Emissions Reductions: An Analysis of Trends and Progress by Sector. Clim. Policy 2022, 22, 1–17. [Google Scholar] [CrossRef]
  36. Cohen, B. Urban Growth in Developing Countries: A Review of Current Trends and a Caution Regarding Existing Forecasts. World Dev. 2004, 32, 23–51. [Google Scholar] [CrossRef]
  37. Kumar, A.; Luthra, S.; Mangla, S.K.; Garza-Reyes, J.A.; Kazancoglu, Y. Analysing the Adoption Barriers of Low-Carbon Operations: A Step Forward for Achieving Net-Zero Emissions. Resour. Policy 2023, 80, 103256. [Google Scholar] [CrossRef]
  38. Soni, R.K.; Nandan, T.; Chatnani, N.N. Dynamic Association of Economic Policy Uncertainty with Oil, Stock and Gold: A Wavelet-Based Approach. J. Econ. Stud. 2023; ahead-of-print. [Google Scholar]
  39. Yayi, C.L. Economic Policy Uncertainty and Trade: Does Export Sophistication Matter? Appl. Econ. 2023, 1–17. [Google Scholar] [CrossRef]
  40. Egan, M.; Raube, K.; Wouters, J.; Chaisse, J. Contestation and Polarization in Global Governance: European Responses; Edward Elgar Publishing: Cheltenham, UK, 2023. [Google Scholar]
  41. Zhu, Z.; Lin, H.; Chen, M.; Han, P. The Spillover Effect of Economic Policy Uncertainty: Evidence from Analyst Behaviors in Hong Kong. Finance Res. Lett. 2023, 52, 103570. [Google Scholar] [CrossRef]
  42. Noviello, A.; Menghani, S.; Choudhri, S.; Lee, I.; Mohanraj, B.; Noviello, A. Guiding Environmental Messaging by Quantifying the Effect of Extreme Weather Events on Public Discourse Surrounding Anthropogenic Climate Change. Weather Clim. Soc. 2022, 15, 17–30. [Google Scholar] [CrossRef]
  43. Chiang, T.C. US Policy Uncertainty and Stock Returns: Evidence in the US and Its Spillovers to the European Union, China and Japan. J. Risk Finance 2020, 21, 621–657. [Google Scholar] [CrossRef]
  44. Mbanyele, W. Economic Policy Uncertainty and Stock Liquidity: The Role of Board Networks in an Emerging Market. Int. J. Emerg. Mark. 2021, 18, 122–147. [Google Scholar] [CrossRef]
  45. Paterson, A.; Sakariyahu, R.; Lawal, R.; Alabi, A. The Impact of Government Policy Responses to the COVID-19 Pandemic and Brexit on the UK Financial Market: A Behavioural Perspective. Br. J. Manag. 2023, 1–20. [Google Scholar] [CrossRef]
  46. Farooq, U.; Tabash, M.I.; Anagreh, S.; Saleh Al-Faryan, M.A. Economic Policy Uncertainty and Corporate Investment: Does Quality of Governance Matter? Cogent Econ. Finance 2022, 10, 2157118. [Google Scholar] [CrossRef]
  47. Liu, Y.; Zhang, Z. How Does Economic Policy Uncertainty Affect CO2 Emissions? A Regional Analysis in China. Environ. Sci. Pollut. Res. 2022, 29, 4276–4290. [Google Scholar] [CrossRef]
  48. Chen, Y.; Shen, X.; Wang, L. The Heterogeneity Research of the Impact of EPU on Environmental Pollution: Empirical Evidence Based on 15 Countries. Sustainability 2021, 13, 4166. [Google Scholar] [CrossRef]
  49. IEA. Climate Policy Uncertainty and Investment Risk; IEA: Paris, France, 2007. [Google Scholar]
  50. Lemoine, D. The Climate Risk Premium: How Uncertainty Affects the Social Cost of Carbon. J. Assoc. Environ. Resour. Econ. 2021, 8, 27–57. [Google Scholar] [CrossRef]
  51. Li, C.; Lan, G.; Zhang, G.; Cheng, P.; Shi, Y.; Gao, Y. Policy Uncertainty, Social Responsibility and Corporate M&A. J. Bus. Ind. Mark. 2022; ahead-of-print. [Google Scholar]
  52. Contreras, G.; Platania, F. Economic and Policy Uncertainty in Climate Change Mitigation: The London Smart City Case Scenario. Technol. Forecast. Soc. Change 2019, 142, 384–393. [Google Scholar] [CrossRef]
  53. Gu, K.; Dong, F.; Sun, H.; Zhou, Y. How Economic Policy Uncertainty Processes Impact on Inclusive Green Growth in Emerging Industrialized Countries: A Case Study of China. J. Clean. Prod. 2021, 322, 128963. [Google Scholar] [CrossRef]
  54. Atsu, F.; Adams, S. Energy Consumption, Finance, and Climate Change: Does Policy Uncertainty Matter? Econ. Anal. Policy 2021, 70, 490–501. [Google Scholar] [CrossRef]
  55. Rezaei, M.; Dampage, U.; Das, B.K.; Nasif, O.; Borowski, P.F.; Mohamed, M.A. Investigating the Impact of Economic Uncertainty on Optimal Sizing of Grid-Independent Hybrid Renewable Energy Systems. Processes 2021, 9, 1468. [Google Scholar] [CrossRef]
  56. Ma, H.; Liu, Z.; Li, M.; Wang, B.; Si, Y.; Yang, Y.; Mohamed, M.A. A Two-Stage Optimal Scheduling Method for Active Distribution Networks Considering Uncertainty Risk. Energy Rep. 2021, 7, 4633–4641. [Google Scholar] [CrossRef]
  57. Mohamed, M.A. A Relaxed Consensus plus Innovation Based Effective Negotiation Approach for Energy Cooperation between Smart Grid and Microgrid. Energy 2022, 252, 123996. [Google Scholar] [CrossRef]
  58. Wang, K.H.; Liu, L.; Zhong, Y.; Lobonţ, O.R. Economic Policy Uncertainty and Carbon Emission Trading Market: A China’s Perspective. Energy Econ. 2022, 115, 106342. [Google Scholar] [CrossRef]
  59. EPU. Economic Policy Uncertainty Index. Available online: https://www.policyuncertainty.com (accessed on 26 January 2023).
  60. World Bank. World Development Indicators (WDI) 2022; World Bank: Washington, DC, USA, 2022. [Google Scholar]
  61. Breusch, T.S.; Pagan, A.R. The Lagrange Multiplier Test and Its Applications to Model Specification in Econometrics. Rev. Econ. Stud. 1980, 47, 239–253. [Google Scholar] [CrossRef]
  62. Pesaran, M.H. General Diagnostic Tests for Cross Section Dependence in Panels; IZA Discussion Paper Series; IZA: Bonn, Germany, 2004. [Google Scholar]
  63. Pesaran, M.H.; Yamagata, T. Testing Slope Homogeneity in Large Panels. J. Econom. 2008, 142, 50–93. [Google Scholar] [CrossRef] [Green Version]
  64. Swamy, P.A.V.B. Efficient Inference in a Random Coefficient Regression Model. Econometrica 1970, 38, 311–323. [Google Scholar] [CrossRef]
  65. Bersvendsen, T.; Ditzen, J. Testing for Slope Heterogeneity in Stata. Stata J. 2021, 21, 51–80. [Google Scholar] [CrossRef]
  66. Wooldridge, J.M. Econometric Analysis of Cross Section and Panel Data; MIT Press: Cambridge, MA, USA, 2010; ISBN 978-0-26229-435-5. [Google Scholar]
  67. Drukker, D.M. Testing for Serial Correlation in Linear Panel-Data Models. Stata J. 2003, 3, 168–177. [Google Scholar] [CrossRef]
  68. Born, B.; Breitung, J. Testing for Serial Correlation in Fixed-Effects Panel Data Models. Econom. Rev. 2016, 35, 1290–1316. [Google Scholar] [CrossRef] [Green Version]
  69. Greene, W.H. Econometric Analysis, 8th ed.; Prentice Hall: Hoboken, NJ, USA, 2018. [Google Scholar]
  70. De Hoyos, R.E.; Sarafidis, V. Testing for Cross-Sectional Dependence in Panel-Data Models. Stata J. 2006, 6, 482–496. [Google Scholar] [CrossRef] [Green Version]
  71. Kmenta, J. Elements of Econometrics; University of Michigan Press: Ann Arbor, MI, USA, 1997; ISBN 978-0-47210-886-2. [Google Scholar]
  72. Pesaran, M.H. A Simple Panel Unit Root Test in the Presence of Cross-Section Dependence. J. Appl. Econom. 2007, 22, 265–312. [Google Scholar] [CrossRef] [Green Version]
  73. Balsalobre-Lorente, D.; Ibáñez-Luzón, L.; Usman, M.; Shahbaz, M. The Environmental Kuznets Curve, Based on the Economic Complexity, and the Pollution Haven Hypothesis in PIIGS Countries. Renew. Energy 2022, 185, 1441–1455. [Google Scholar] [CrossRef]
  74. Carton, B.; Natal, J.-M. Further Delaying Climate Policies Will Hurt Economic Growth. Available online: https://www.imf.org/en/Blogs/Articles/2022/10/05/further-delaying-climate-policies-will-hurt-economic-growth (accessed on 8 February 2023).
  75. Yu, J.; Shi, X.; Guo, D.; Yang, L. Economic Policy Uncertainty (EPU) and Firm Carbon Emissions: Evidence Using a China Provincial EPU Index. Energy Econ. 2021, 94, 105071. [Google Scholar] [CrossRef]
  76. Udeagha, M.C.; Muchapondwa, E. Investigating the Moderating Role of Economic Policy Uncertainty in Environmental Kuznets Curve for South Africa: Evidence from the Novel Dynamic ARDL Simulations Approach. Environ. Sci. Pollut. Res. Int. 2022, 29, 77199–77237. [Google Scholar] [CrossRef]
  77. Guo, A.; Wei, H.; Zhong, F.; Liu, S.; Huang, C. Enterprise Sustainability: Economic Policy Uncertainty, Enterprise Investment, and Profitability. Sustainability 2020, 12, 3735. [Google Scholar] [CrossRef]
  78. Shang, Y.; Han, D.; Gozgor, G.; Mahalik, M.K.; Sahoo, B.K. The Impact of Climate Policy Uncertainty on Renewable and Non-Renewable Energy Demand in the United States. Renew. Energy 2022, 197, 654–667. [Google Scholar] [CrossRef]
  79. Khan, S.A.R.; Yu, Z.; Umar, M.; Zia-ul-haq, H.M.; Tanveer, M.; Janjua, L.R. Renewable Energy and Advanced Logistical Infrastructure: Carbon-Free Economic Development. Sustain. Dev. 2022, 30, 693–702. [Google Scholar] [CrossRef]
  80. Yi, J. Study on Carbon Emission Efficiency of China’s Industrial Industry and Analysis of Its Influencing Factors. Low Carbon Econ. 2017, 08, 20–30. [Google Scholar] [CrossRef] [Green Version]
  81. Danish; Baloch, M.A.; Mahmood, N.; Zhang, J.W. Effect of Natural Resources, Renewable Energy and Economic Development on CO2 Emissions in BRICS Countries. Sci. Total Environ. 2019, 678, 632–638. [Google Scholar] [CrossRef] [PubMed]
  82. Bekun, F.V.; Alola, A.A.; Sarkodie, S.A. Toward a Sustainable Environment: Nexus between CO2 Emissions, Resource Rent, Renewable and Nonrenewable Energy in 16-EU Countries. Sci. Total Environ. 2019, 657, 1023–1029. [Google Scholar] [CrossRef]
  83. Oladunni, O.J.; Mpofu, K.; Olanrewaju, O.A. Greenhouse Gas Emissions and Its Driving Forces in the Transport Sector of South Africa. Energy Rep. 2022, 8, 2052–2061. [Google Scholar] [CrossRef]
  84. Ankathi, S.; Lu, Z.; Zaimes, G.G.; Hawkins, T.; Gan, Y.; Wang, M. Greenhouse Gas Emissions from the Global Transportation of Crude Oil: Current Status and Mitigation Potential. J. Ind. Ecol. 2022, 26, 2045–2056. [Google Scholar] [CrossRef]
  85. Li, W.; Qiao, Y.; Li, X.; Wang, Y. Energy Consumption, Pollution Haven Hypothesis, and Environmental Kuznets Curve: Examining the Environment–Economy Link in Belt and Road Initiative Countries. Energy 2022, 239, 122559. [Google Scholar] [CrossRef]
  86. Apergis, N.; Pinar, M.; Unlu, E. How Do Foreign Direct Investment Flows Affect Carbon Emissions in BRICS Countries? Revisiting the Pollution Haven Hypothesis Using Bilateral FDI Flows from OECD to BRICS Countries. Environ. Sci. Pollut. Res. 2022, 30, 14680–14692. [Google Scholar] [CrossRef]
Figure 1. Total GHG emissions in selected countries.
Sustainability 15 05860 g001
Figure 2. EPU trends in selected countries.
Sustainability 15 05860 g002
Figure 3. Correlation Heat Plot.
Sustainability 15 05860 g003
Table 1. Pre-estimation test(s) results.
VariablesPesaran
CD Test
Q(p) TestQ(k) TestHR TestCIPSSlope Homogeneity Test
DeltaAdj. Delta
LGHG0.26210.36 ***3.21 ***−2.62 ***−3.436 **1.4141.549
LEPU26.643 ***27.92 ***5.30 ***0.88−2.750 **−0.840−0.920
LGDPC33.246 ***4.58 **2.12 ***−1.75 * −2.939 **−0.175−0.192
LREC9.243 ***7.61 ***2.76 ***−2.47 **−2.956 **2.914 ***3.192 ***
LFDI12.919 ***18.99 ***4.37 ***1.84 *−3.214 **3.697 ***4.050 ***
Wooldridge testLR testMean VIF
F(1, 18) = 71.798Chi2 (18) = 288.521.18
Prob > F = 0.0000Prob > Chi2 = 0.000
Note: *** p-value < 0.01, ** p-value < 0.05, * p-value < 0.10.
Table 2. Empirical Results of GHG-EPU Model.
Dependent Variable: LGHG
VariablesOLSGLSPCSE
ln ( E P U ) i t 0.5298 ***
(0.1244)
0.5401 ***
(0.1227)
0.1219 ***
(0.0404)
0.0977**
(0.0398)
0.2328 ***
(0.0538)
0.2067 ***
(0.0543)
ln ( G D P C ) i t −0.7008 ***
(0.0590)
−3.3081 ***
(0.7933)
−0.6702 ***
(0.0370)
−2.7406 ***
(0.5470)
−0.8367 ***
(0.0242)
−2.0329 ***
(0.6230)
ln ( G D P C ) i t 2 0.1399 ***
(0.0424)
0.1165 ***
(0.0296)
0.0690 **
(0.0334)
ln (REC)it−0.5278 ***
(0.0654)
−0.5455 ***
(0.0647)
−0.4466 ***
(0.0414)
−0.4882 ***
(0.0486)
−0.5752 ***
(0.0340)
−0.6251 ***
(0.0473)
ln (FDI)it0.4216 ***
(0.0297)
0.4183 ***
(0.0293)
0.0414 ***
(0.0122)
0.0424 ***
(0.0124)
0.1110 ***
(0.0257)
0.1036 ***
(0.0248)
Constant14.7171 ***
(0.7997)
26.7026 ***
(3.7214)
19.9728 ***
(0.4083)
29.1029 ***
(2.5672)
20.5307 ***
(0.3661)
25.8202 ***
(2.9551)
R20.51320.52760.99210.992
Adj. R20.50770.5210
F(4, 356)
(p-value)
93.81
(0.000)
79.30
(0.000)
382.00
(0.000)
298.05
(0.000)
1722
(0.000)
1536.14
(0.000)
Standard errors in parenthesis. *** indicate p-value < 0.01, ** indicate p-value < 0.05. Wald χ2 (p-value).
Disclaimer/Publisher’s Note: The statements, opinions and data contained in all publications are solely those of the individual author(s) and contributor(s) and not of MDPI and/or the editor(s). MDPI and/or the editor(s) disclaim responsibility for any injury to people or property resulting from any ideas, methods, instructions or products referred to in the content.

