Article

Date Fruit Production and Consumption: A Perspective on Global Trends and Drivers from a Multidimensional Footprint Assessment

by
Fabio Sporchia
1,2,
Nicoletta Patrizi
2,* and
Federico Maria Pulselli
2
1
Department of Science, Technology and Society, University School for Advanced Studies IUSS Pavia, 27100 Pavia, Italy
2
Ecodynamics Group, Department of Physical Sciences, Earth and Environment, University of Siena, 53100 Siena, Italy
*
Author to whom correspondence should be addressed.
Sustainability 2023, 15(5), 4358; https://doi.org/10.3390/su15054358
Submission received: 26 January 2023 / Revised: 23 February 2023 / Accepted: 25 February 2023 / Published: 28 February 2023

Abstract

:
Date production and consumption is mostly diffused in Middle East and Northern African countries. Date production is linked to the land and water footprint in countries where agricultural land and freshwater are scarce. We estimate the global land, green water, blue water, and water scarcity footprint at the country scale from a production perspective. We show that production trends are increasingly driven by foreign demand. By tracking the international trade dynamics of dates, we map the shift of environmental footprint from the producing to the consuming countries. We find that dates production and consumption are not yet decoupled from the associated environmental burden. Global dates consumption accounted for 1.4 million hectares of agricultural land, 5.8 Gm3 of green water, 7.5 Gm3 of blue water, and the related impact on water scarcity reached 358 Gm3 world equivalent in 2019. The primacy of the economic driver is revealed, indicating that in the case of dates, the environmental sustainability aspects are currently overlooked for the sake of the economic benefit. The time-series analysis provides informative results to support policymakers in the design of mitigation strategies that can help the achievement of the SDGs.

1. Introduction

The existence of food systems cannot prescind from the exploitation of freshwater resources [1]. Freshwater is so important globally that it is related to many Sustainable Development Goals (SDGs), besides SDG 6, which specifically refers to it. In addition to food systems, freshwater supports almost all human activities, such as energy sectors and industrial productions, and is sourced from superficial or groundwater basins, or derives from seawater desalination [2,3,4]. Such activities can significantly affect the global water cycles [5,6,7]. When the simultaneous demand for freshwater from multiple sectors exceeds availability, the water security of regions strongly relying on water exploitation can be jeopardized [4].
Around 80% of the global population already faces water security issues [8]. The growing population, together with the vulnerability of freshwater reservoirs to climate change [9], make water scarcity a topic of primary concern for policymakers to respond to future drought [10,11,12]. While technology can increase the efficiency of freshwater exploitation, for example, through more efficient irrigation practices, such interventions might negatively affect the existing water scarcity issue [13]. In addition, drought vulnerability can be increased due to intervention to raise water resources levels, such as dams [14].
Water scarcity is defined as an excess of water demand over available supply [15]. Furthermore, water scarcity can be divided into physical and economic components. The first occurs when there is not enough water to meet all demands, including environmental flows, whereas the latter occurs when there is a lack of investment in water or a lack of human capacity to satisfy the demand for water [15]. Climate change will increase the population exposed to water scarcity [16]. Water scarcity issues will be exacerbated where already present [17], and facing this future challenge requires a careful policy action and specific management practices for adaptation and mitigation [18]. Date fruit (or dates) is among the agricultural commodities requiring most blue water volumes per tonne globally [19]. Date palms’ high tolerance to saline soils and drought make their cultivation possible even in arid environments [20]. Accordingly, most date fruit producers are Middle-East or Northern African (MENA) countries [21] where precipitations and freshwater resources are limited, and brackish water is sometimes used for irrigation [22,23]. Climate change is expected to threaten date palm cultivation as well, despite its tolerance to commonly unsuitable conditions [24].
Date fruit has remarkable nutritional values [25] and provide nutrition for MENA countries [26]. As a cash crop, it is also a source of income for farmers [24]. Accordingly, its cultivation can be export-oriented, with export covering about half of the total production [27]. Date production constitutes the main source of remuneration and the basis of economy for the people living in the Sahara [28]; it plays a strategic role in their economies [29], and its cultivation covers up to half of the entire cultivated land in Oman [30]. However, since date production heavily relies on blue water use, compared to other commodities, export flows are linked with considerable amounts of virtual blue water [27], where virtual water refers to the water that is used to produce goods that are traded to be consumed elsewhere [6,31]. Furthermore, in other cases, date palm cultivation can imply half of a country’s agricultural land for domestic consumption [30]. Finally, since brackish water is sometimes used for date palm irrigation, soil salinity can grow and salt can leach to underground reservoirs, and to avoid that, elevated amounts of freshwater are required to dilute the salts, besides the fertilizers residuals, to normal levels (“salt gray water”) [32].
The high levels of blue water required by date palm cultivation, coupled with the water scarce freshwater basin commonly exploited for their irrigation leads, to questioning the sustainability of such production. In addition, being the top-producing countries affected by scarce land suitable for crop cultivation [33,34], it is important to provide a comprehensive picture of the past and current situation even in terms of land footprint to possibly support policymakers dealing with land scarcity issues.
Previous studies analyzed the water footprint of date production or trade focusing on single countries [27,30,32,35,36], whereas a more structured work was realized by the FAO focusing on few countries and with a general outlook [37]. However, no study analyzed the global dynamics of the date fruit sector from multiple environmental points of view, in time series, and with a country-level resolution. The aim of this paper is to fill this knowledge gap by performing a global multidimensional environmental footprint analysis (i.e., land and water footprint) including the production, trade and consumption of date fruit. Furthermore, a two-decades time-series analysis (2000–2019) of the global land footprint, water footprint, and water scarcity footprint of date fruit production and consumption at the country scale is also presented to reveal past and present trends and identify drivers of environmental burden to suggest possible entry points for policies aimed at mitigating future impacts of climate change.

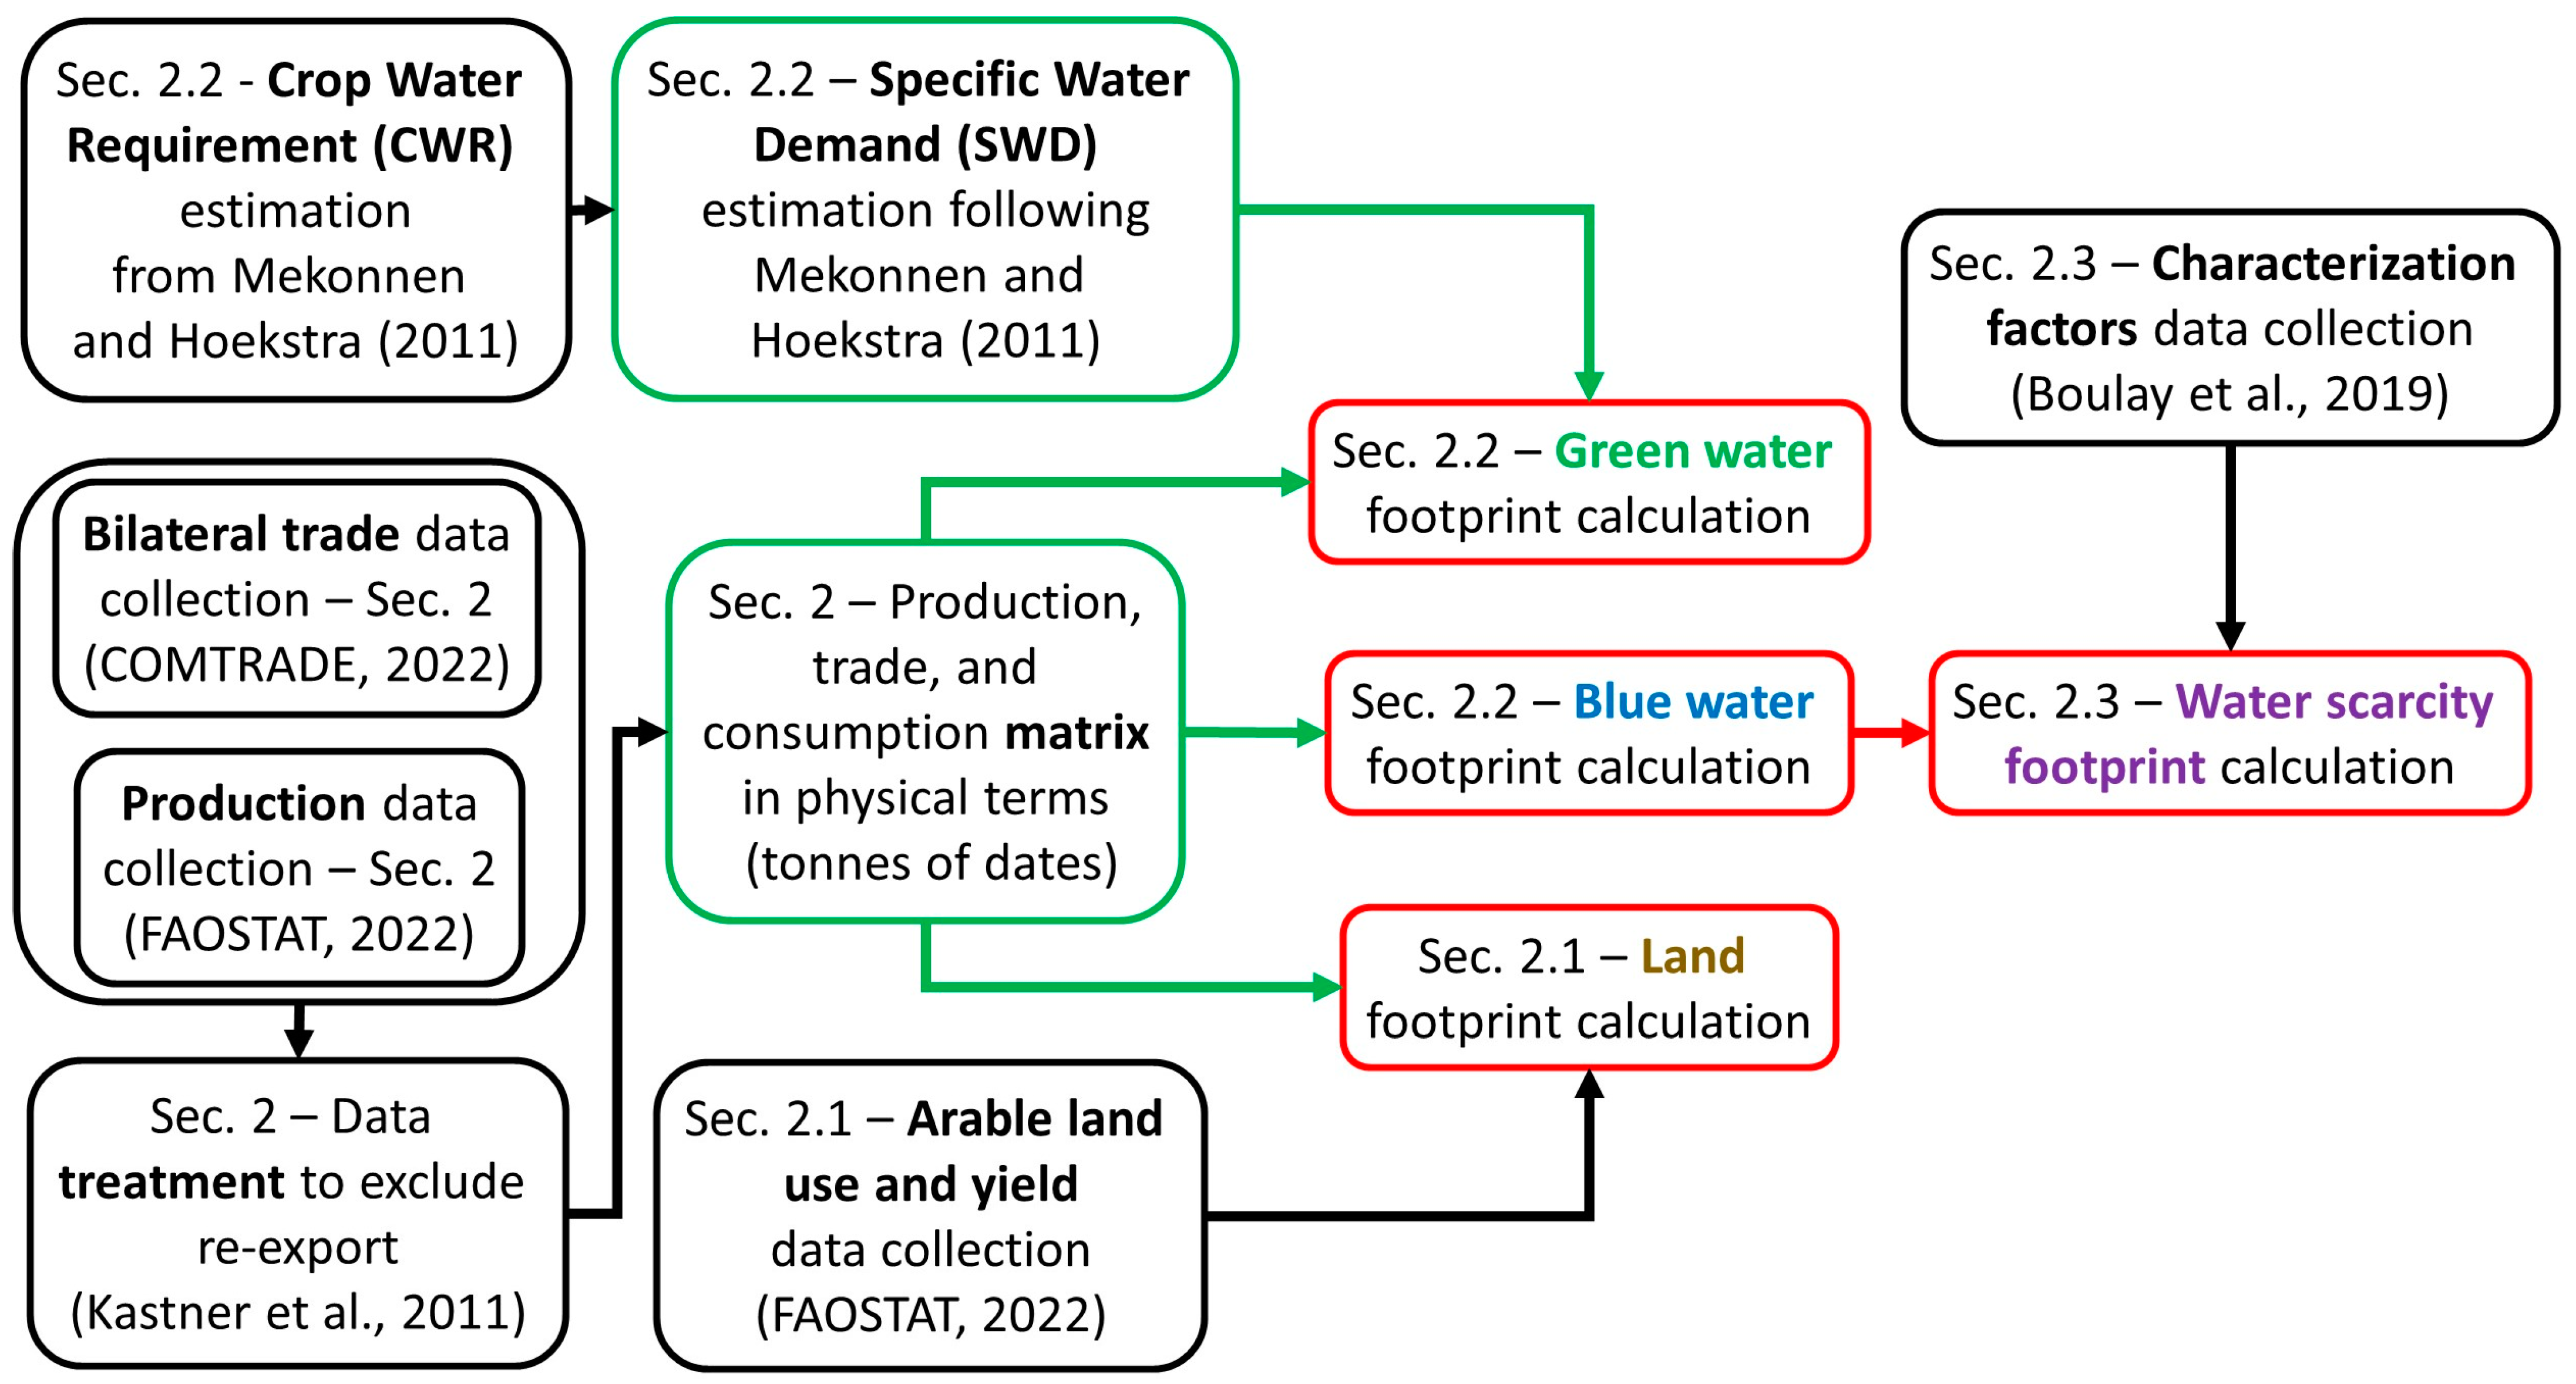
2. Materials and Methods

Date fruit production data for 254 countries were retrieved from the FAOSTAT database [21]. Trade data were retrieved from the UNCOMTRADE database [38] via [39]. Data refer to the unprocessed commodity, whether dried or not, excluding processed commodities containing date fruits or date fruits’ sub-products. Figure 1 provides a schematic representation of the methodology adopted highlighting all steps from data collection (and source) to results computation.

2.1. Land Footprint for Dates Production

Land footprint indicates the surface of agricultural land that is required to produce a determinate crop. Land footprint estimation associated with dates production is based on the harvested area values retrieved from FAOSTAT [21] as well as data on yield, following previous studies [42,43,44,45,46,47]. As we focus on dates, we considered the agricultural land specifically intended for dates production. While yield data express the amount of crop produced per unit of land area implied, its inverse indicates the land intensity—that is, the amount of land required to produce a unit of crop.

2.2. Water Footprint for Dates Production

The method proposed by the Water Footprint Network (WFN) [48] divided the volume of water required for crop cultivation into green water, blue water and gray water. Green water is defined as the rainfall that is stored in soil, whereas the blue water is defined as the freshwater abstracted from underground or surface water basins [48]. Finally, the gray water footprint is the freshwater required to dilute polluted effluents to comply with legal limits. Accordingly, we estimated the water footprint for dates production for each producing country, and for each year, calculating the Specific Water Demand (SWD, m3 tonne−1), as the ratio between the Crop Water Requirement (CWR, m3 ha−1), and the yield (Y, tonne ha−1), as represented in Equation (1):
S W D c , n , y = C W R c , n Y c , n , y
where SWD indicates the specific water demand for crop c in country n, in year y, CWR indicates the water requirement of crop c, in country n and Y indicates the yield of crop c, in country n, in year y. The CWR for both green and blue water was derived from [19]. CWR data were assumed as fixed, since it mainly relies on climatic factors which are assumed to be constant for the period considered. Accordingly, we derived CWR values by using the average yield of the same period considered by [19], as in previous studies [44,45,46,49] as shown in Equation (2):
C W R c , n = S W D c , n , 96 05 × Y c , n , 96 05
where SWD indicates the specific water demand in country n for the crop c, retrieved from [19], and Y refers to the average yield of country n during the period 1996–2005 for the crop c. Yield average data were estimated by using FAOSTAT data. Since CWR values are provided for both green and blue water, the adopted method allowed us to distinguish between green and blue water, as they are defined in the water footprint assessment manual [48]. Gray water footprint calculation requires specific data referred to the water body receiving the load of pollutants deriving from field run-off to the water body chemical characteristics and to local policy [48]. Although previous assessments adopted a fixed global or regional run-off rate and a fixed global acceptability limit for the concentration of pollutants, we chose to exclude gray water calculation from this study in order to maintain the country-specific approach. Indeed, by adopting a global fixed limit as in a previous study [19], to estimate the gray water, we would lose the country specificity of our analysis. Nevertheless, the gray water footprint for dates covers a marginal part of the total footprint [19]. Due to the diffused use of brackish water to irrigate date palms, soil salinity tends to grow, and elevated amounts of freshwater should be used to dilute the salts, besides nitrogen or other pollutants, to normal levels (for the receiving body), indicating a feature that might be overlooked by gray water calculation (“salt gray water”) [32]. While [48] provides values of the average SWD for the period 1996–2005 allowing to estimate the dates’ water footprint by simply multiplying the quantity of dates by the SWD values, the estimation would be static, failing to capture the changes that may occur over time in the production efficiency—for example in terms of yield—therefore hampering the possibility to identify the underlying drivers. Furthermore, while being certainly illustrative, the SWD values provided in such study are outdated, and their use in analyses for recent years would inevitably result in inaccurate estimates. For these reasons, our study stems from the estimation of the CWR.

2.3. Water Scarcity Footprint for Dates Production
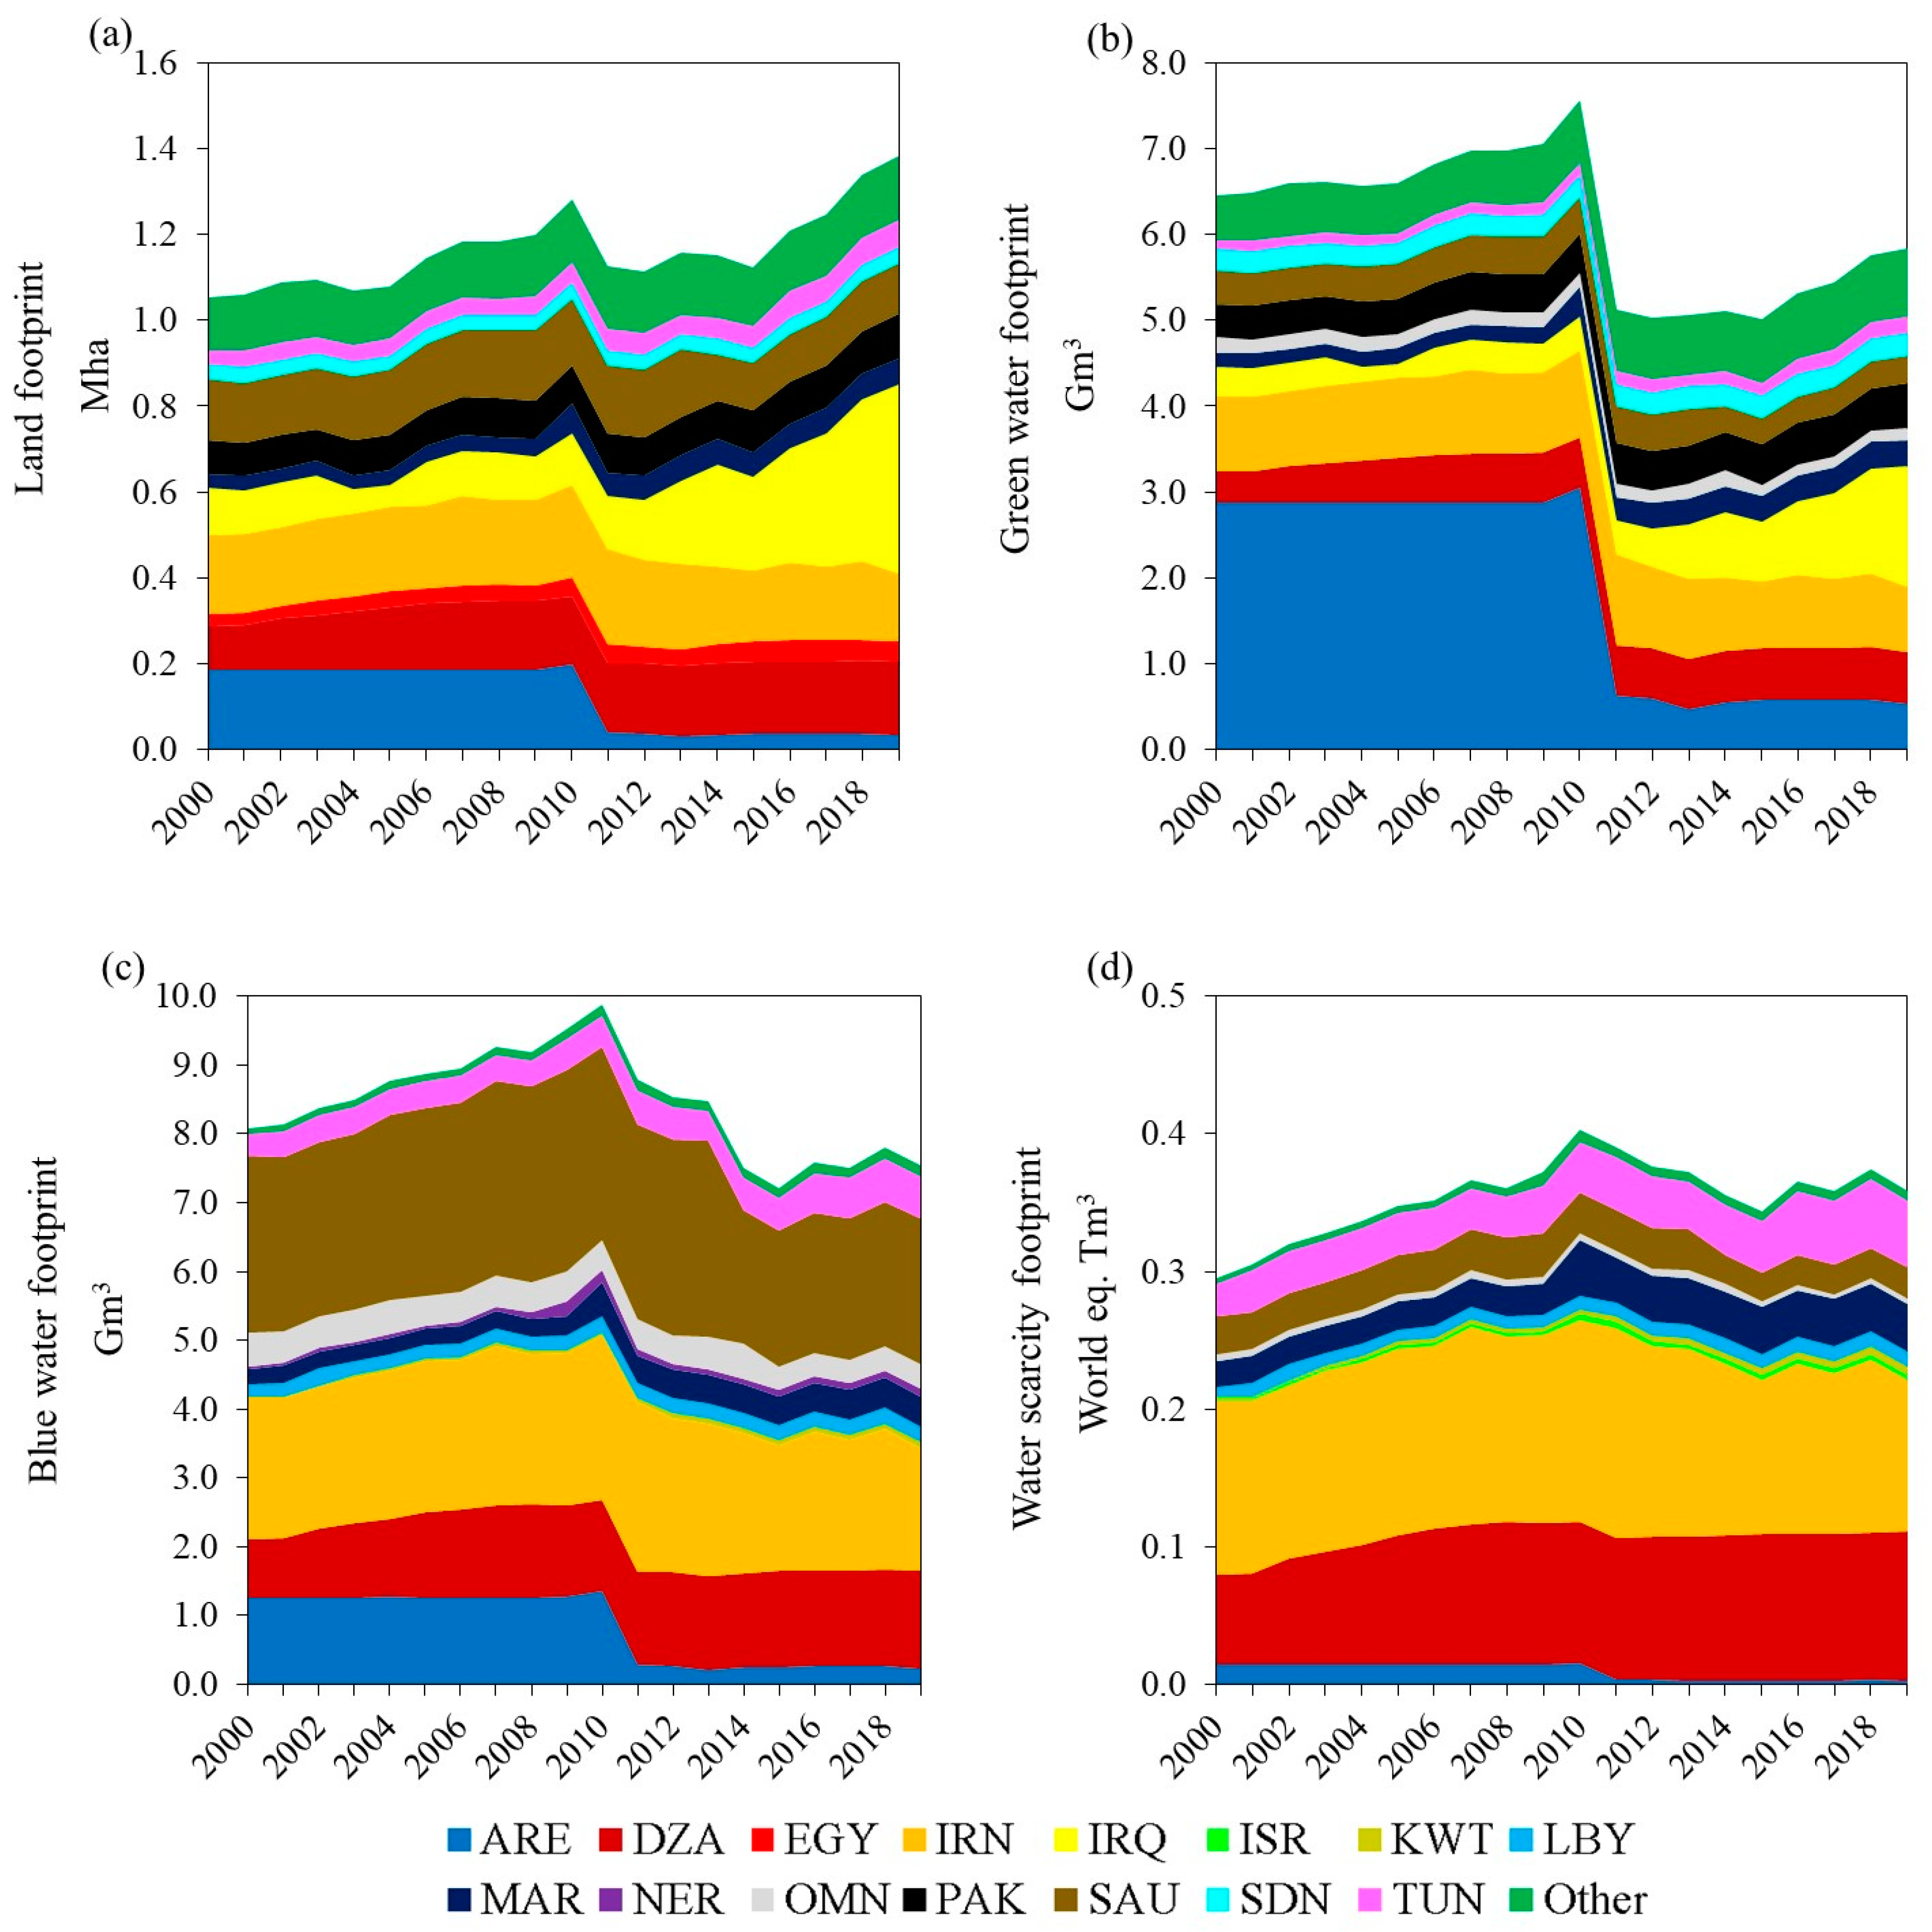
The various definitions of water scarcity led to the development of different approaches to assess the impact of water use on it. The advantages and limitations of the existing approaches have already been discussed [50]. After two years of elaboration, a method has been identified, and it is supported by a large group of experts. This approach is based on the concept of Available Water REmaining (AWARE), which is the water that remains available for further use after the human and ecosystem’s needs have been satisfied [51].
The AWARE method allows us to estimate the impacts on water scarcity linked to the use of blue water by country, depending on the average level of stress affecting the water basins exploited in such country’s territory. The calculation can be completed by applying a country-specific characterization factor (CF) to the volumes of blue water used. The latest advancement of the AWARE method [41] provides CFs that are not only country-specific, but also crop-specific, by linking crop-specific water requirements to the water basins from which blue water is sourced at the sub-national level. Therefore, the estimation of the water scarcity linked to date production is calculated as follows (Equation (3)):
W S P c = B W P c × C F c
where WSP is the water scarcity footprint for date production in country c (m3 world equivalent), BWP is the blue water footprint for dates production in country c for the analyzed year (m3 of blue water), and CF is the characterization factor for date production in country c, which is expressed in m3 world equivalent per m3 of blue water. The underlying idea is that there is competition among the ecosystemic need for water and the human’s one, either indirect—such as through irrigation—and the direct—such as for drinking [52].
By tracking the origin of the dates consumed worldwide, it is possible to estimate the total water scarcity linked to their consumption in each country for the year considered. Accordingly, it is necessary to link producers to consumers by accounting for the international trade flows and applying the CF according to the origin of the flows as follows (Equation (4)):
W S C c = W S P c ( B W E c × C F c ) + ( i c B W I c , i × C F i )
where WSC is the water scarcity linked to the consumption of dates in country c, WSP is described in Equation (1), BWE is the total blue water exported by country c linked to date palm cultivation, CFc is the same as in Equation (1), BWI is the volume of blue water linked to dates imported by country c from country i, and CFi is the characterization factor for dates production in country i. CF values were sourced from [41]. The available data covered around 93% of the global date production.
Due to the cash crop nature that dates can assume in some cases, trade can reach high relevance for some production contexts [27]. International trade might involve intermediary countries. After importing a commodity, such countries might, in turn, simply export the same commodity with minimal or no change. This creates a re-export flow. The existence of re-export flows hampers the possibility to unequivocally link primary producers to final consumers and can induce inaccuracies through double counting of trade flows. Therefore, raw trade data need a preliminary treatment to ensure their suitability for the calculations. Consequently, we applied the data treatment approach of [53] to link producers to final consumers, avoiding double counting of re-export. Data treatment assumes that only countries producing a certain crop can have direct export flows. Accordingly, by considering re-export flows composed by goods originated from producing countries proportionally to their share of global production, the re-export flows are re-allocated linking the original producer to the importers. Consequently, inconsistencies and discrepancies deriving from the misallocation of the environmental burden of the re-export flows to non-producing countries are avoided (see [40] for details on the method). This operation allows the application of the correct country-specific resource use intensities and water scarcity CF to trade flows [6,54].
For each year, we compiled a detailed bilateral trade matrix showing import and export quantities between 254 countries/territories, as described in detail in the Supplementary Material (Table S1). Finally, to allow a fair comparison of the countries’ level of water scarcity due to date consumption, we provided per capita results using [53] data on population.

3. Results

As shown in Figure 2, the date production footprints analyzed varied annually with heterogenous trends. Specifically, while the global date production grew by 41% overall (see Figures S1 and S2) [21], the land footprint showed an overall increase (24%) with a first period of growth until 2010, when the land footprint peaked (1.28 Mha), before falling (−12%) in 2011. Afterwards, the global land footprint value remained approximately constant until 2016, when the growth restarted, which was mainly driven by Iraq (Figure 2a). Such growth can be explained by the expansion policy undertaken by Iraq’s government, which aimed to increase the national production [55]; however, this will require a longer time to show its effect (Figures S1 and S2). Estimating the cropland required for date production is fundamental, since the main producers have scarce land available for agriculture due to either soil composition or climate [33,34].
The green water footprint showed a similar initial growing trend until 2010 (7.6 Gm3) before sharply falling (−32%) in 2011 (Figure 2b). However, differently from land, the green water footprint never reached pre-2010 levels. Only a slight growth from 2016, driven by Iraq, was recorded (Figure 2b). Overall, the green water footprint showed a decrease (−9%). Blue water showed an initial steady growth until 2010 too but then decreased, even after 2011, reaching a low peak in 2015 (7.2 Gm3) (Figure 2c). Afterwards, a slight but discontinuous growth led to an overall decrease (−7%) (Figure 2c). Finally, the water scarcity footprint grew until 2010 (0.4 world eq. Tm3) before showing a decrease until 2015, which was followed by a discontinuous trend (Figure 2d). Between 2000 and 2019, the water scarcity footprint grew around 21% (Figure 2d). These variations are linked to increasing production from areas with lower water intensity together with a lower land intensity, which are linked to better agricultural practices.
Figure 3 shows the footprint levels linked to dates consumption worldwide, highlighting some countries’ relevance in global terns and their effect in shaping the global trends. The case of India is particularly relevant, since its national production is marginal, whereas the consumption reaches global significance [21] (Figure 3). In fact, India’s land footprint linked to dates consumption assumed significant levels, especially in the second half of the period analyzed. Indeed, India’s land footprint increased from 50.1 kha in 2000 to 118.5 kha in 2019—which corresponded to 3% of the global land footprint in 2000 (1.05 Mha) and to 9% of the global land footprint in 2019 (1.38 Mha) (Figure 3a). Many of the top countries by land footprint for production were also among the top countries by land footprint for consumption. This suggests that a significant part of the production is stimulated by the domestic demand for dates (see Figure S3). The green water footprint of consumption indicates a partly similar situation, where some of the top countries by green water footprint of production are also among the top countries by green water footprint of consumption (Figure 3b). For example, India’s dates consumption was linked to a significant level of green water footprint too (3–9% of the global total) (Figure 3b). It is also evident that countries other than the top ten ones gradually gained relevance, passing from around 12% of the global blue water footprint of consumption in 2000 to around 22% in 2019 (Figure 3b). The blue water footprint from dates consumption was increasingly displaced among countries other than the top producers (6–13%) (Figure 3c). A similar trend was revealed for the water scarcity footprint of consumption, for which countries other than the top ten ones accounted between 9% and 14% over the study period (Figure 3d), indicating a gradual increase in responsibility for the impact on water scarcity from producer to consumers. Overall, both environmental pressures and impacts are growingly being displaced beyond the territory of origin. This is due to a growing demand from non-producing countries and from countries whose domestic production fails to cover the domestic demand—for instance, India and Morocco, respectively, or even the United Arab Emirates (ARE) in the most recent period [21].
Figure 4 and Figure 5 show that the worldwide displacement of the footprints linked to date consumption is significantly variable among the four footprints considered in the present analysis. In particular, the land footprint shows that date production and consumption was significantly diffused across all the continents in 2019 (Figure 4a). In the case of land footprint, it is noteworthy that the flows linking countries across the globe are marginal, compared to, for example, the flow from Iraq to India (Figure 4a). A similar behavior is shown for green water (Figure 4b). However, the differences between the flows of land and water footprint are significantly affected by the producing countries’ specific climatic conditions. For instance, the ARE have a higher land efficiency but a lower green water efficiency in producing dates compared to other countries. Indeed, the green water CWR for ARE is the highest among the producing countries and well above them, while the yield is right below the average of the top producers. This is reflected in a reduced significance of the flows of land embodied in the dates exported by ARE (Figure 4a) compared to the green water linked to the same export flow (Figure 4b). For example, it is evident that the export flow of dates from ARE to India is much larger considering the embodied land (4350 ha) if compared to the green water embodied in the same export flow—67 Mm3 of green water. This can be explained by considering that it accounts for a larger portion of the global land involved in dates production, meaning that ARE dates production has a lower land use efficiency compared with the top-producing countries. On the contrary, Iran’s export flows have comparable relevance, indicating that land and green water efficiencies for dates production in Iran rank similarly compared to other countries. The export flow of dates from Iran to India in 2019 corresponds to 4968 kha of embodied land and 23 Mm3 of green water embodied (Figure 4). Even from a consumer perspective, for some countries, the footprint values are affected by the consumption of dates domestically produced (see Figure S4).
The climatic conditions, together with the orientation of the cultivation (e.g., export-oriented or for domestic consumption) and the related agronomic practices, explain the remarkable differences between land, green water, and blue water footprint displacement (Figure 4 and Figure 5a). These practices might involve extensive irrigation. Some countries only (or almost only) rely on green water exploitation for date palm cultivation, whereas other countries exploit much higher volumes of blue water than green water for palm cultivation in order to boost or even just allow production (Figure 5). This is the case for Algeria, where the blue water requirement value is twice as high as the green water one. It is also the case for Iran, whose blue water requirement is 2.3-fold the green water one. Even more relevant is the case for Saudi Arabia, where the blue water requirement is 6.6 times greater than the green water one. Following the previous example, the 41 ktonnes of dates exported by ARE to India correspond to 30 Mm3 of blue water, while the same amount of dates exported by Iran to India consumes about 55 Mm3 of blue water due to a much lower blue water efficiency of Iran compared to ARE. Accordingly, a few major countries account for most of the overall blue water footprint (Figure 5a). Those ones are also responsible for a remarkable part of the water scarcity footprint (Figure 5b), which depends on the actual impact deriving from the exploitation of freshwater in the date palm plantation areas. Significant differences between blue water and water scarcity footprints (Figure 5a,b) may emerge. For example, Saudi Arabia in this case accounted for much less of the overall water stress footprint compared to the top countries in terms of blue water. The reason is that Saudi Arabia’s CF is just 14% compared to Algeria’s CF or just 17% compared to Iran’s CF. In addition, Iran and Tunisia account for major flows of water scarcity embedded in the dates they exported (Figure 5b). Considering the previous example, 342 Mm3 world equivalent of water was linked to dates exported to India from ARE. At the same time, a similar amount of dates exported by Iran to India was linked to 3.4 Gm3 world equivalent of water. This difference is due to Iran’s date production having a worse water scarcity characterization factor compared to India’s one. Furthermore, it is remarkable that France appears among the countries with the highest water scarcity from dates consumption, which are mostly imported from Algeria and Tunisia. Finally, a considerable portion of the blue water and water scarcity footprints was linked to internal demand for some countries such as Algeria and Libya (Figure S4).
Table 1 shows a general decrease in both per capita dates consumption and the related per capita footprints. A drastic fall of the footprints’ values is evident for the ARE between 2000 and 2019. Such a fall was mainly driven by the related sharp fall (−88%) in date consumption (Table 1). Specifically, the per capita land footprint decreased by around 91%, while the green and blue water as well as the per capita water scarcity footprint decreased by 95% (Table 1). Furthermore, Table 1 shows that some of the top countries by footprint of consumption almost only appear for blue water or water scarcity. This reveals the reliance of these countries on a significant exploitation of freshwater resources either domestically or abroad. This is the case of Kuwait, whose date consumption reaches the top levels only in 2019 but whose blue water and water scarcity per capita footprint levels have been among the top ones for all the three years (Table 1). It is also remarkable that a European country, Albania, is among the countries with the highest per capita footprints. Tunisia ranks high for water scarcity but comparatively lower for the other metrics, especially for dates consumption. This phenomenon becomes more evident over time, indicating that the Tunisian supply of dates is comparatively efficient in terms of land and green water use, while it is generally slightly less efficient in terms of blue water use and significantly less efficient in terms of water scarcity. This means that even low date consumption rates can be linked with high environmental burden.

4. Discussion

Date fruit consumption is linked to land and water use as well as to impact on water scarcity. This environmental burden occurs also beyond the borders of the countries of production. All the continents are involved in such displacement, but most of the environmental burden occurs in MENA countries (Figure 2 and Figure 3). Date palm cultivation is practiced in a large number of countries. In general, the production is aimed at satisfying the internal demand (90%) rather than foreign demand [37]. However, the global share of export on the total production is progressively growing, reaching 12% in 2019. Furthermore, in 2019, for some countries, the export assumed a noteworthy relevance on the total production. For instance, it reached 42% in ARE, 41% in Tunisia and 35% in Iraq, shaping a similar trend for the related exported footprint trend. For ARE [32] and Tunisia [27,37], date export assumes a high relevance thanks to the associated revenue, but date production and export assumes importance also for countries where export is less relevant, such as Iran (11% of total production) [36]. These export flows depend on three factors: the demand from other MENA countries as the main one; demand expressed by other countries such as India (mainly matched by Iraq’s export); and a rising European demand, with Albania being the European country where consumption grew the most (Table 1). This indicates that the demand from foreign markets is among the drivers of environmental burden. Consequently, these consumption patterns influence the displacement of the related footprints (Figure 4 and Figure 5). Such patterns were affected by the environmental efficiency of the trade partners chosen by the importing countries, namely the resource or impact intensities (i.e., the amount of resource or impact needed to produce a unit of product) linked to the production of such dates.
The global dates production and consumption levels have been steadily growing (Figures S1 and S2). Meanwhile, the related footprint recorded a different trend with a peak around 2010 followed by a decrease with a slow recovery (Figure 2 and Figure 3). This trend is directly linked to a sharp and long-lasting fall of ARE date production in 2011 (Figure S2). Such a fall shaped the consumption footprint of both ARE and the countries whose supply relied on ARE’s exports. While such a dates production gap only marginally affected the global trend, it had significant consequences in terms of footprint due to the particularly high intensity of Iraq’s dates production. Indeed, the subsequent increase in Iraq’s production footprints might be linked to the attempt of the countries to take advantage of the previous ARE’s market share by expanding the palm dates cultivation [55]. However, significantly lower environmental efficiencies are recorded for Iraq’s production for the immediately following years (Figure 2), which is due to the lag between the expansion of cultivation and the return in terms of production quantities—namely, the yield. In the following years, a similar phenomenon regarding Saudi Arabia’s dates production contraction was only recorded between 2013 and 2014. However, this had no significant effects on the footprints trend due to the lower levels of intensities of Saudi Arabia’s production compared to other producing countries.
On a global level, all the intensities considered showed a decrease during the study period, with the highest decrease for green (−36%) and blue (−34%) water, which was followed by water scarcity (−14%), and land (−7%). This result can be linked to a growth of the production from areas with lower water intensity as well as to an improvement of the land intensity (the inverse of the yield), which is due, in turn, to better agricultural practices. By looking at the country-scale situation, it is possible to compare the average intensity of the consumed dates. This metric captures the environmental efficiencies of all the trade partners. India’s example can be illustrative in this sense, since it is a significant consumer (Figure 3) without relevant date production [21]. The average intensities of the dates consumed in India [21] in 2000 were 0.18 ha/tonne for land, 1378 m3/tonne for green water, 1220 m3/tonne for blue water, and around 54,000 m3 world eq./tonne for water scarcity. These intensities reached 0.42 ha/tonne for land, 1623 m3/tonne for green water, 406 m3/tonne for blue water, and around 16,000 m3 world eq./tonne for water scarcity. This was mainly linked to a change in India’s main providers of dates, which were Pakistan (44%), Iran (31%) and ARE (19%) in 2000 and Iraq (53%), ARE (15%) and Iran (15%) in 2019. The reduction in land intensity is specifically linked to the shift from Pakistan and Iran (with a yield around 0.13 ha/tonne, and 0.23 ha/tonne, respectively, in 2000) to Iraq (0.68 ha/tonne in 2019) as the top providers. The same shift explains the change in terms of green water. Indeed, Pakistan and Iran had significantly lower intensities in 2000 (1084 m3/tonne and 639 m3/tonne, respectively) compared to Iraq in 2019 (2205 m3/tonne). Instead, since Pakistan and Iraq present no blue water use, the blue water intensity for both years was mostly linked to the imports from Iran and ARE. Iran’s and ARE’s export environmental profile changed according to the yield variation between the two years—from 2558 m3/tonne in 2000 to 1363 m3/tonne in 2019 for Iran and from 1668 m3/tonne in 2000 to 719 m3/tonne in 2019 in ARE.
Ultimately, the water scarcity intensity is linked to the same providers and to their CF for date palm cultivation, that is, 12 m3 world eq./m3 of blue water for the UAE and 67 m3 world eq./m3 of blue water for Iran. This example clearly explains how the consumption footprint’s variation is driven by a change in the trade partners and in their environmental efficiency. In this specific case, the changes resulted in a worsening in land and green water footprint However, they also resulted in an improvement in blue water and water scarcity footprints. The identification of such a trade-off reveals how a multidimensional footprint approach can provide complete and reliable information to support decision makers in the process of designing actions toward the achievement of the SDGs and, specifically, SDG 6. Following the case of India, we investigated the drivers acting on the choice of the trade partners. By using producer prices retrieved from [21], we reveal that the main trade partners were the ones with high CF and low producer price (e.g., Iran) in 2000. Instead, in 2019, Iraq had the lowest producer price and was the main supplier, while Iran (the top third supplier) had a producer price 2.5 times higher than Iraq. These results confirm the primacy of the economic driver to make any decision, which in many cases brings about unsustainable trends and behaviors. Producing complementary information may be of great help to overcome this problem. In particular, since the producer prices neglect the environmental externalities linked to date production, the estimation of the economic efficiency (e.g., USD/world eq. m3) linked to the exploitation of stressed water basins for date production could provide remarkable insights for a more sustainable management of water resources. Nevertheless, the fragmentation of the economic data currently available limits the possibility of performing a complete and consistent analysis.
In order to test the robustness of our calculations, we compared our results with the only previous study providing a time-series analysis estimation of the water footprint linked to dates at global level [56]. The results [56] can be compared for the years 2000–2016. The comparison revealed a slight discrepancy with our overall annual results being a little lower than theirs (−1.9%) in terms of total footprints. The average annual discrepancy with our annual total water embodied in traded dates is a little larger (−8%), which is possibly due to the use of different trade matrices (Ref. [21] in their case) and due to our data treatment, which excludes possible overestimations linked with re-export flows.

5. Conclusions

In 2019, global dates consumption accounted for 1.4 million hectares of agricultural land, 5.8 Gm3 of green water, 7.5 Gm3 of blue water, and the related impact on water scarcity reached 358 Gm3 world equivalent. The growing global dates demand drove an increase in the environmental footprint associated, indicating that dates production trends are not yet decoupled from environmental burden. The major dates-producing countries are often also among the largest consumers, meaning that the environmental footprint of dates production is often comparable with the environmental footprint of dates consumption. However, recent international trade dynamics are increasingly driving a shift of footprint from producers to consumers. The multidimensional footprint assessment performed in this analysis shows that the characteristics of such a shift are strictly driven by the trade partners of the importing countries. Indeed, we reveal that trade-offs exist among land, green water, blue water, and water scarcity, highlighting the necessity to carefully contemplate the broadest possible environmental features when selecting the origin of imported dates if the intention is to address sustainability issues. Moreover, an economic analysis suggests the existence of a possible linkage between the exploitation of increasingly stressed water basins and the economic benefit from the related environmental degradation. The present work shows the importance of the complementary information that results from multidimensional footprint analyses. Such information could be helpful in supporting policy action aimed at achieving national sustainability targets (such as the ones related to the SDGs) through mitigation strategies.
Future research could progressively refine the present analysis by including a gray water footprint assessment, the use of time-sensitive CFs, as well as a more detailed economic assessment coupled with a social sustainability assessment.

Supplementary Materials

The following supporting information can be downloaded at: https://www.mdpi.com/article/10.3390/su15054358/s1, Figure S1: Global date production between 2000 and 2019; Figure S2: Global date consumption between 2000 and 2019; Figure S3: The production, consumption, and international flows in which are embedded the land and green water footprint for 2019. Figure S4: The production, consumption, and international flows in which are embedded the blue water and water scarcity footprint. Table S1: List of countries included in the analysis with the related ISO3 code and the corresponding area.

Author Contributions

Conceptualization, F.S. and F.M.P.; methodology, F.S.; validation, F.S.; N.P. and F.M.P.; formal analysis, F.S.; investigation, F.S., N.P. and F.M.P.; data curation, F.S.; writing—original draft preparation, F.S.; N.P. and F.M.P.; writing—review and editing, F.S.; N.P. and F.M.P.; visualization, F.S.; N.P. and F.M.P.; supervision, F.M.P. All authors have read and agreed to the published version of the manuscript.

Funding

F. Sporchia was supported by the doctoral scholarship “A16” pertaining to the Italian National PhD program in Sustainable Development and Climate Change (PhD-SDC—37th Cycle).

Institutional Review Board Statement

Not applicable.

Informed Consent Statement

Not applicable.

Data Availability Statement

The data presented in this study are available on request from the corresponding author.

Acknowledgments

The authors are very grateful to Valentina Niccolucci (University of Siena) for her constructive feedback on this article.

Conflicts of Interest

The authors declare no conflict of interest.

References

  1. Djehdian, L.A.; Chini, C.M.; Marston, L.; Konar, M.; Stillwell, A.S. Exposure of Urban Food–Energy–Water (FEW) Systems to Water Scarcity. Sustain. Cities Soc. 2019, 50, 101621. [Google Scholar] [CrossRef]
  2. Bates, B.; Kundzewicz, Z.; Wu, S. Climate Change and Water; Intergovernmental Panel on Climate Change Secretariat: Geneva, Switzerland, 2008; ISBN 9291691232. [Google Scholar]
  3. Schewe, J.; Heinke, J.; Gerten, D.; Haddeland, I.; Arnell, N.W.; Clark, D.B.; Dankers, R.; Eisner, S.; Fekete, B.M.; Colón-González, F.J.; et al. Multimodel Assessment of Water Scarcity under Climate Change. Proc. Natl. Acad. Sci. USA 2014, 111, 3245–3250. [Google Scholar] [CrossRef] [PubMed] [Green Version]
  4. D’Odorico, P.; Davis, K.F.; Rosa, L.; Carr, J.A.; Chiarelli, D.; Dell’Angelo, J.; Gephart, J.; MacDonald, G.K.; Seekell, D.A.; Suweis, S.; et al. The Global Food-Energy-Water Nexus. Rev. Geophys. 2018, 56, 456–531. [Google Scholar] [CrossRef]
  5. Abbott, B.W.; Bishop, K.; Zarnetske, J.P.; Hannah, D.M.; Frei, R.J.; Minaudo, C.; Chapin, F.S., III; Krause, S.; Conner, L.; Ellison, D.; et al. A Water Cycle for the Anthropocene. Hydrol. Process. 2019, 33, 3046–3052. [Google Scholar] [CrossRef] [Green Version]
  6. Sporchia, F.; Caro, D.; Bruno, M.; Patrizi, N.; Marchettini, N.; Pulselli, F.M. Estimating the Impact on Water Scarcity Due to Coffee Production, Trade, and Consumption Worldwide and a Focus on EU. J. Environ. Manag. 2023, 327, 116881. [Google Scholar] [CrossRef] [PubMed]
  7. Steffen, W.; Richardson, K.; Rockström, J.; Cornell, S.E.; Fetzer, I.; Bennett, E.M.; Biggs, R.; Carpenter, S.R.; de Vries, W.; de Wit, C.A.; et al. Planetary Boundaries: Guiding Human Development on a Changing Planet. Science 2015, 347, 1259855. [Google Scholar] [CrossRef] [Green Version]
  8. Freshwater Resources. Climate Change 2014—Impacts, Adaptation and Vulnerability: Part A: Global and Sectoral Aspects: Working Group II Contribution to the IPCC Fifth Assessment Report: Volume 1: Global and Sectoral Aspects; Intergovernmental Panel on Climate Change, Ed.; Cambridge University Press: Cambridge, UK, 2014; Volume 1, pp. 229–270. ISBN 9781107058071. [Google Scholar]
  9. Hoegh-Guldberg, O.; Jacob, D.; Bindi, M.; Brown, S.; Camilloni, I.; Diedhiou, A.; Djalante, R.; Ebi, K.; Engelbrecht, F.; Guiot, J. Impacts of 1.5 C Global Warming on Natural and Human Systems. In Global Warming of 1.5 C; An IPCC Special Report; IPCC Secretariat: Geneva, Switzerland, 2018. [Google Scholar]
  10. AghaKouchak, A.; Feldman, D.; Hoerling, M.; Huxman, T.; Lund, J. Water and Climate: Recognize Anthropogenic Drought. Nature 2015, 524, 409–411. [Google Scholar] [CrossRef] [PubMed] [Green Version]
  11. Van Loon, A.F.; Gleeson, T.; Clark, J.; Van Dijk, A.I.J.M.; Stahl, K.; Hannaford, J.; Di Baldassarre, G.; Teuling, A.J.; Tallaksen, L.M.; Uijlenhoet, R.; et al. Drought in the Anthropocene. Nat. Geosci. 2016, 9, 89–91. [Google Scholar] [CrossRef] [Green Version]
  12. Pendergrass, A.G.; Meehl, G.A.; Pulwarty, R.; Hobbins, M.; Hoell, A.; AghaKouchak, A.; Bonfils, C.J.W.; Gallant, A.J.E.; Hoerling, M.; Hoffmann, D.; et al. Flash Droughts Present a New Challenge for Subseasonal-to-Seasonal Prediction. Nat. Clim. Chang. 2020, 10, 191–199. [Google Scholar] [CrossRef] [Green Version]
  13. Grafton, R.Q.; Williams, J.; Perry, C.J.; Molle, F.; Ringler, C.; Steduto, P.; Udall, B.; Wheeler, S.A.; Wang, Y.; Garrick, D.; et al. The Paradox of Irrigation Efficiency. Science 2018, 361, 748–750. [Google Scholar] [CrossRef] [Green Version]
  14. Di Baldassarre, G.; Wanders, N.; AghaKouchak, A.; Kuil, L.; Rangecroft, S.; Veldkamp, T.I.E.; Garcia, M.; van Oel, P.R.; Breinl, K.; Van Loon, A.F. Water Shortages Worsened by Reservoir Effects. Nat. Sustain. 2018, 1, 617–622. [Google Scholar] [CrossRef] [Green Version]
  15. Steduto, P.; Faurès, J.-M.; Hoogeveen, J.; Winpenny, J.; Burke, J. Coping with Water Scarcity: An Action Framework for Agriculture and Food Security; FAO Water Reports 38; Food and Agriculture Organization of the United Nations: Rome, Italy, 2012; Volume 16, p. 78. Available online: https://www.fao.org/3/I3015e/I3015e.Pdf (accessed on 16 December 2022).
  16. Gosling, S.N.; Arnell, N.W. A Global Assessment of the Impact of Climate Change on Water Scarcity. Clim. Chang. 2016, 134, 371–385. [Google Scholar] [CrossRef] [Green Version]
  17. Quosy, D.E.-D. El Mitigation and Adaptation Options of Climate Change in Irrigated Agriculture in Arab Countries BT—Climate Change and Food Security in West Asia and North Africa; Sivakumar, M.V.K., Lal, R., Selvaraju, R., Hamdan, I., Eds.; Springer: Dordrecht, The Netherlands, 2013; pp. 255–267. ISBN 978-94-007-6751-5. [Google Scholar]
  18. DeNicola, E.; Aburizaiza, O.S.; Siddique, A.; Khwaja, H.; Carpenter, D.O. Climate Change and Water Scarcity: The Case of Saudi Arabia. Ann. Glob. Health 2015, 81, 342–353. [Google Scholar] [CrossRef]
  19. Mekonnen, M.M.; Hoekstra, A. The Green, Blue and Grey Water Footprint of Crops and Derived Crop Products. Hydrol. Earth Syst. Sci. 2011, 15, 1577–1600. [Google Scholar] [CrossRef] [Green Version]
  20. Yaish, M.W.; Kumar, P.P. Salt Tolerance Research in Date Palm Tree (Phoenix dactylifera L.), Past, Present, and Future Perspectives. Front. Plant Sci. 2015, 6, 348. [Google Scholar] [CrossRef] [PubMed] [Green Version]
  21. FAOSTAT. 2022. Available online: http://www.Fao.Org/Faostat/En/#home (accessed on 15 December 2022).
  22. Askri, B.; Ahmed, A.T.; Abichou, T.; Bouhlila, R. Effects of Shallow Water Table, Salinity and Frequency of Irrigation Water on the Date Palm Water Use. J. Hydrol. 2014, 513, 81–90. [Google Scholar] [CrossRef]
  23. Carr, M.K. V The Water Relations and Irrigation Requirements of the Date Palm (Phoenix dactylifera L.): A Review. Exp. Agric. 2013, 49, 91–113. [Google Scholar] [CrossRef]
  24. Johannsen, I.M.; Hengst, J.C.; Goll, A.; Höllermann, B.; Diekkrüger, B. Future of Water Supply and Demand in the Middle Drâa Valley, Morocco, under Climate and Land Use Change. Water 2016, 8, 313. [Google Scholar] [CrossRef] [Green Version]
  25. Ibrahim, S.A.; Ayad, A.A.; Williams, L.L.; Ayivi, R.D.; Gyawali, R.; Krastanov, A.; Aljaloud, S.O. Date Fruit: A Review of the Chemical and Nutritional Compounds, Functional Effects and Food Application in Nutrition Bars for Athletes. Int. J. Food Sci. Technol. 2021, 56, 1503–1513. [Google Scholar] [CrossRef]
  26. Benmeziane-Derradji, F. Nutritional Value, Phytochemical Composition, and Biological Activities of Middle Eastern and North African Date Fruit: An Overview. Euro-Mediterr. J. Environ. Integr. 2019, 4, 39. [Google Scholar] [CrossRef]
  27. Benalaya, A.; Chebil, A.; Souissi, A.; Frija, A.; Makhlouf, M.; Stambouli, T. Quantification of Virtual Water Balance of Tunisia: Flows Embedded in the Main Produced, Consumed and Exchanged Agricultural Commodities. New Medit Mediterr. J. Econ. Agric. Environ. 2017, 16, 11. [Google Scholar]
  28. Mariod, A.A.; Saeed Mirghani, M.E.; Hussein, I. Phoenix Dactylifera Date Palm Kernel Oil. In Unconventional Oilseeds and Oil Sources; Elsevier: Amsterdam, The Netherlands, 2017; pp. 181–185. [Google Scholar]
  29. Benziouche, S.E. The Sector of Dates in Algeria, Role in National Economy and Position on the International Market. In Proceedings of the Acta Horticulturae; International Society for Horticultural Science (ISHS), Leuven, Belgium, 1 June 2013; pp. 155–162. [Google Scholar]
  30. Al Hinai, A.; Jayasuriya, H. Enhancing Economic Productivity of Irrigation Water by Product Value Addition: Case of Dates. J. Saudi Soc. Agric. Sci. 2021, 20, 553–558. [Google Scholar] [CrossRef]
  31. Taherzadeh, O.; Caro, D. Drivers of Water and Land Use Embodied in International Soybean Trade. J. Clean. Prod. 2019, 223, 83–93. [Google Scholar] [CrossRef]
  32. Al-Muaini, A.; Sallam, O.M.; Green, S.; Kennedy, L.; Kemp, P.; Clothier, B. The Blue and Grey Water Footprints of Date Production in the Saline and Hyper-Arid Deserts of United Arab Emirates. Irrig. Sci. 2019, 37, 657–667. [Google Scholar] [CrossRef]
  33. Sonneveld, B.G.J.S.; Marei, A.; Merbis, M.D.; Alfarra, A. The Future of Date Palm Cultivation in the Lower Jordan Valley of the West Bank. Appl. Water Sci. 2018, 8, 113. [Google Scholar] [CrossRef] [PubMed] [Green Version]
  34. Bertini, R.; Zouache, A. Agricultural Land Issues in the Middle East and North Africa. Am. J. Econ. Sociol. 2021, 80, 549–583. [Google Scholar] [CrossRef]
  35. Mohamed, A.S.; Ali, A.A.; El-Ghany, A.; Yosri, A. Irrigation Water Management of Date Palm under El-Baharia Oasis Conditions. Egypt. J. Soil Sci. 2018, 58, 27–44. [Google Scholar] [CrossRef] [Green Version]
  36. Bazrafshan, O.; Zamani, H.; Ramezani Etedali, H.; Gerkaninezhad Moshizi, Z.; Shamili, M.; Ismaelpour, Y.; Gholami, H. Improving Water Management in Date Palms Using Economic Value of Water Footprint and Virtual Water Trade Concepts in Iran. Agric. Water Manag. 2020, 229, 105941. [Google Scholar] [CrossRef]
  37. FAO. Workshop on “Irrigation of Date Palm and Associated Crops”; FAO: Rome, Italy, 2008. [Google Scholar]
  38. UN Statistics Division UN Comtrade. Available online: http://Comtrade.Un.Org/2022 (accessed on 15 December 2022).
  39. Chatham House. Available online: https://Resourcetrade.Earth/2022 (accessed on 15 December 2022).
  40. Kastner, T.; Kastner, M.; Nonhebel, S. Tracing Distant Environmental Impacts of Agricultural Products from a Consumer Perspective. Ecol. Econ. 2011, 70, 1032–1040. [Google Scholar] [CrossRef]
  41. Boulay, A.-M.; Lenoir, L.; Manzardo, A. Bridging the Data Gap in the Water Scarcity Footprint by Using Crop-Specific AWARE Factors. Water 2019, 11, 2634. [Google Scholar] [CrossRef] [Green Version]
  42. Zhang, J.; Zhao, N.; Liu, X.; Liu, Y. Global Virtual-Land Flow and Saving through International Cereal Trade. J. Geogr. Sci. 2016, 26, 619–639. [Google Scholar] [CrossRef] [Green Version]
  43. Qiang, W.; Liu, A.; Cheng, S.; Kastner, T.; Xie, G. Agricultural Trade and Virtual Land Use: The Case of China’s Crop Trade. Land Use Policy 2013, 33, 141–150. [Google Scholar] [CrossRef]
  44. Sporchia, F.; Thomsen, M.; Caro, D. Drivers and Trade-Offs of Multiple Environmental Stressors from Global Rice. Sustain. Prod. Consum. 2021, 26, 16–32. [Google Scholar] [CrossRef]
  45. Sporchia, F.; Taherzadeh, O.; Caro, D. Stimulating Environmental Degradation: A Global Study of Resource Use in Cocoa, Coffee, Tea and Tobacco Supply Chains. Curr. Res. Environ. Sustain. 2021, 3, 100029. [Google Scholar] [CrossRef]
  46. Sporchia, F.; Kebreab, E.; Caro, D. Assessing the Multiple Resource Use Associated with Pig Feed Consumption in the European Union. Sci. Total Environ. 2021, 759, 144306. [Google Scholar] [CrossRef] [PubMed]
  47. Multsch, S.; Alquwaizany, A.S.; Alharbi, O.A.; Pahlow, M.; Frede, H.-G.; Breuer, L. Water-Saving Strategies for Irrigation Agriculture in Saudi Arabia. Int. J. Water Resour. Dev. 2017, 33, 292–309. [Google Scholar] [CrossRef]
  48. Hoekstra, A.Y.; Chapagain, A.; Martinez-Aldaya, M.; Mekonnen, M. The Water Footprint Assessment Manual; Setting the Global Standard; Earthscan: London, UK, 2011; ISBN 9781849712798. [Google Scholar]
  49. Tuninetti, M.; Tamea, S.; Laio, F.; Ridolfi, L. A Fast Track Approach to Deal with the Temporal Dimension of Crop Water Footprint. Environ. Res. Lett. 2017, 12, 74010. [Google Scholar] [CrossRef]
  50. Boulay, A.-M.; Motoshita, M.; Pfister, S.; Bulle, C.; Muñoz, I.; Franceschini, H.; Margni, M. Analysis of Water Use Impact Assessment Methods (Part A): Evaluation of Modeling Choices Based on a Quantitative Comparison of Scarcity and Human Health Indicators. Int. J. Life Cycle Assess. 2015, 20, 139–160. [Google Scholar] [CrossRef]
  51. Boulay, A.-M.; Bare, J.; Benini, L.; Berger, M.; Lathuillière, M.J.; Manzardo, A.; Margni, M.; Motoshita, M.; Núñez, M.; Pastor, A.V.; et al. The WULCA Consensus Characterization Model for Water Scarcity Footprints: Assessing Impacts of Water Consumption Based on Available Water Remaining (AWARE). Int. J. Life Cycle Assess. 2018, 23, 368–378. [Google Scholar] [CrossRef] [Green Version]
  52. Niccolucci, V.; Botto, S.; Rugani, B.; Nicolardi, V.; Bastianoni, S.; Gaggi, C. The Real Water Consumption behind Drinking Water: The Case of Italy. J. Environ. Manag. 2011, 92, 2611–2618. [Google Scholar] [CrossRef]
  53. World Bank Population. Total—SP.POP.TOTL. 2022. Available online: https://Data.Worldbank.Org/Indicator/SP.POP.TOTL (accessed on 20 December 2022).
  54. Zucchinelli, M.; Sporchia, F.; Piva, M.; Thomsen, M.; Lamastra, L.; Caro, D. Effects of Different Danish Food Consumption Patterns on Water ScarcityFootprint. J. Environ. Manag. 2021, 300, 113713. [Google Scholar] [CrossRef] [PubMed]
  55. Ministry of Health and Environment of Iraq. United Nations Development Programme Sixth National Report to the Convention on Biodiversity; Ministry of Health and Environment of Iraq: Baghdad, Iraq, 2019. [Google Scholar]
  56. Tamea, S.; Tuninetti, M.; Soligno, I.; Laio, F. Virtual Water Trade and Water Footprint of Agricultural Goods: The 1961–2016 CWASI Database. Earth Syst. Sci. Data 2021, 13, 2025–2051. [Google Scholar] [CrossRef]
Figure 1. Schematic representation of the methodology adopted in this study. Black boxes indicate data collection, green boxes indicate data elaboration, and red boxes indicate the obtained results [19,21,38,40,41].
Sustainability 15 04358 g001
Figure 2. The (a) land, (b) green water, (c) blue water, and (d) water scarcity footprint linked with global date production between 2000 and 2019. For each chart, only the top 10 producer countries are shown based on their average overall footprint levels. ARE = United Arab Emirates, DZA = Algeria, EGY = Egypt, IRN = Iran, IRQ = Iraq, ISR = Israel, KWT = Kuwait, LBY = Libya, MAR = Morocco, NER = Niger, OMN = Oman, PAK = Pakistan, SAU = Saudi Arabia, SDN = Sudan, TUN = Tunisia.
Sustainability 15 04358 g002
Figure 3. The (a) land, (b) green water, (c) blue water, and (d) water scarcity footprint linked with global date consumption between 2000 and 2019. For each chart, only the top 10 consumer countries are shown based on their average overall footprint levels. ARE = United Arab Emirates, DZA = Algeria, EGY = Egypt, IND = India, IRN = Iran, IRQ = Iraq, MAR = Morocco, KWT = Kuwait, LBY = Libya, OMN = Oman, NER = Niger, PAK = Pakistan, SAU = Saudi Arabia, SDN = Sudan, TUN = Tunisia.
Sustainability 15 04358 g003
Figure 4. The (a) land and (b) green water embodied in the bilateral dates net trade flows in 2019. Only the flows accounting for at least 1% of the global extent of each footprint are shown. Flows are colored according to the country of origin. The countries from which the flows originate are listed on the left side, while the destination countries are listed on the right. For a more detailed and complete version, see Figure S3.
Sustainability 15 04358 g004
Figure 5. The (a) green water and (b) impact on water scarcity embodied in the bilateral dates net trade flows in 2019. Only the flows accounting for at least 1% of the global extent of each footprint are shown. Flows are colored according to the country of origin. The countries from which the flows originate are listed on the left side, while the destination countries are listed on the right. For a more detailed and complete version, see Figure S4.
Sustainability 15 04358 g005
Table 1. The 2000, 2010, and 2019 top 10 countries rankings based on the per capita (a) dates consumption and related (b) land, (c) green water, (d) blue water, and (e) water scarcity footprint and related values.
(a) Dates(b) Land(c) Green Water(d) Blue Water(e) Water Scarcity
2000
Areakg/capAream2/capAream3/capAream3/capAreaworld eq. m3/cap
ARE241ARE588ARE875ARE417ARE6477
OMN120OMN152OMN77OMN212QAT2561
IRQ40SAU66LBY19SAU120OMN2399
SAU34IRQ47SAU18QAT64DZA1982
QAT30LBY45IRQ15LBY32TUN1817
BHR25QAT39DZA11DZA26IRN1562
LBY22DZA31QAT11IRN25LBY1473
EGY15TUN24IRN11TUN23SAU1266
SDN12IRN23MRT10KWT14MAR631
DZA11MRT20SDN9MRT10KWT590
2010
Areakg/capAream2/capAream3/capAream3/capAreaworld eq. m3/cap
OMN92ARE216ARE326ARE152DZA2755
ARE91OMN109OMN64OMN146ARE2032
SAU34SAU53LBY21SAU95TUN1796
LBY27LBY50DZA16LBY36IRN1785
DZA17DZA43SAU15DZA36LBY1665
EGY16IRQ29MRT13IRN29OMN1664
QAT13MRT26IRN12QAT27MAR1399
IRQ13IRN26MAR12TUN23KWT1062
SDN12MAR25IRQ9KWT18QAT1055
IRN12TUN24ALB9MAR17SAU1007
2019
Areakg/capAream2/capAream3/capAream3/capAreaworld eq. m3/cap
OMN76IRQ72ARE44OMN72TUN2443
SAU40ARE57OMN29SAU55DZA2392
KWT30OMN56IRQ23LBY35LBY1607
ARE29LBY48LBY20DZA31KWT1470
LBY26DZA38DZA14TUN31IRN1158
DZA25TUN32ALB11KWT28MAR1129
EGY16SAU31MAR11IRN19OMN822
TUN15MRT22MRT11ARE19QAT703
IRN14MAR21TUN10QAT16MRT691
QAT12BHR17SAU8MAR15SAU583
Disclaimer/Publisher’s Note: The statements, opinions and data contained in all publications are solely those of the individual author(s) and contributor(s) and not of MDPI and/or the editor(s). MDPI and/or the editor(s) disclaim responsibility for any injury to people or property resulting from any ideas, methods, instructions or products referred to in the content.

