Article

Sustainability Assessment of Intensification Levels of Brazilian Smallholder Integrated Dairy-Crop Production Systems: An Emergy and Economic-Based Decision Approach

by
Vitória Toffolo Luiz
1,
Rafael Araújo Nacimento
1,*,
Vanessa Theodoro Rezende
1,
Taynara Freitas Avelar de Almeida
1,
Juliana Vieira Paz
1,
Biagio Fernando Giannetti
2 and
Augusto Hauber Gameiro
1
1
Department of Animal Science, University of São Paulo, Pirassununga 13635-900, Brazil
2
Laboratory of Production and Environment, Paulista University, São Paulo 04026-002, Brazil
*
Author to whom correspondence should be addressed.
Sustainability 2023, 15(5), 4674; https://doi.org/10.3390/su15054674
Submission received: 26 January 2023 / Revised: 22 February 2023 / Accepted: 28 February 2023 / Published: 6 March 2023

Abstract

:
This study aimed to evaluate the sustainability of integrated dairy–crop production systems by employing emergy and economic theory perspectives, and to identify strategies to improve the intensification of dairy production systems. A case study of a small Brazilian dairy production system (PROP) was created to assess dairy herd feed exchanges as a sustainability pathway. Three scenarios were proposed for the examination of a dairy production system: extensive (EXT); semi-intensive (SIS); and intensive (INT). The Interlink Decision Making Index (IDMI) was used to compare sustainability among them. The PROP demonstrated higher environmental performance than the other scenarios (ESI = 1.30, 0.65, 0.95, and 0.71, for PROP, INT, SIS, and EXT, respectively); however, PROP’s profitability was 1.6 times lower than that of SIS and INT, although PROP’s profitability was higher than that of the EXT scenario. Notably, the IDMI identified the SIS scenario as having the best sustainability among those studied. We concluded that the consideration of the energy contribution for feed ingredients yields a more equitable evaluation of environmental performance in integrated dairy–crop production systems, which leads us to propose the following suggestions: (i) target higher profit performance by changing extensive dairy systems to semi-intensive systems that utilize feed ingredients produced at the farm, and (ii) promote higher environmental performance by transforming intensive dairy systems to semi-intensive systems that are directed more toward maintaining environmental factors. In our view, public policies should focus on bonifications that upgrade dairy systems to promote and utilize best practices for dairy–crop integration.

1. Introduction

Dairy production, especially in developing countries, provides regular income for smallholders, thus contributing to rural development and decreasing rural exodus [1]. In Brazil, owner labour accounts for 73% of the total rural labour and 67% of the work of family farming. Furthermore, dairy farms are present in 98% of Brazilian cities, and these are predominantly small and medium proprieties that contribute locally to social and economic development [2]. Small and medium Brazilian dairy farmers are responsible for 58% of overall milk production (including cow and goat milk), which demonstrates its importance to the economy and Brazil’s milk market [3]. Brazilian dairy farms are mainly pasture-based systems, where 80% fit into the category of family farming [2,3,4]. Despite higher temporary unemployment that causes some instability and social risk to farm workers [5], small and medium Brazilian dairy production is still an important source for employment in rural zones.
Given the social and economic importance of milk production, keeping smallholders involved in dairy production is a challenge. According to the United States Department of Agriculture [6], thousands of farmers leave the business every year. In Brazil, rising rural production costs combined with milk price devaluation are listed as key reasons for dairy farmers to withdraw from the activity [7]. For this reason, the intensification of dairy systems is one of the most common strategies used to increase the income of dairies [7]. According to Powell et al. [8], the intensification of production systems and the closer integration of crop and livestock is a form of adaptation that can enable smallholders to make socioeconomic changes and adapt to market and trade circumstances. In this perspective, the integrated dairy–crop system is an evolutionary process [9] that aims to increase agricultural production per unit of land [10]. In addition, the integrated dairy–crop system is a strategy of intensification that increases milk output relative to inputs of feed, labour, land, or herd size, thus raising efficiency and revenue and aiding productivity gains [7].
Dairy system intensification commonly results in higher productivity and profitability [11]. In turn, dairy intensification is strictly linked to livestock feeding programmes. Thus, on the one hand, intensification is associated with higher levels of productivity and profitability, and on the other hand, this intensification drives the farm to be more dependent on external inputs [12,13]. This can cause higher pressure on the environment [14,15]. From an economic perspective, livestock feeding programmes can represent more than half of the economic [16,17] and environmental costs [14,15]. In Brazil, Agostinho et al. [12] analysed 92 Brazilian dairy farms and concluded that Brazilian dairy systems could be divided into five groups: group G1 and G2 (semi-intensive), G3 (extensive), and G4 and G5 (intensive). Among them, groups G2 and G3 were the most prevalent, representing 40 and 50%, respectively. Group G2 describes a small semi-intensive system of raising crossbred cows with low milk production (12 litresmilk/day) and is comprised of managed-pasture and the use of a concentrate diet. Group G3 represents an extensive system of raising crossbred cows with low milk production (5 litresmilk/day) without supplementary feeding during winter, and without pasture management in the livestock feed programme. The authors concluded that group G2 should be promoted, considering its efficiency and environmental results.
The same study considered corn and soybean as the only sources in the feed programme, which resulted in a total environmental cost of the feed that increased from 11 to 22% and from 34 to 42% for semi-intensive and intensive dairy production systems, respectively. Therefore, to our knowledge and despite the importance of feed in livestock systems and according to Odum’s macroscope concepts, the feed contribution as a pathway to the development of a more sustainable dairy farm has not been adequately exploited by these authors. The use of feed produced inside the farm’s boundaries can improve sustainability due to its higher use of local renewable resources and, consequently, its higher renewability fractions. Thus, using local feed ingredient sources in a dairy feed programme (i.e., silage and pasture-based feed programmes) can increase the sustainability level of dairy farms. In addition, the integrated dairy–crop production system can enhance dairy farm sustainability, which can help keep activity viable for smallholders.
According to Robinson and Tinker [18], the sustainability concept requires the (re)conciliations of the: (i) ecological imperative, regarding the biophysical carrying capacity of the planet; (ii) the economic imperative, to provide an adequate material standard of living for all; and (iii) the social imperative, to provide systems of governance that propagate the values that people want to live by. Although the socioeconomic aspects are inherently considered, the sustainability goals are not taken into great consideration in terms of the appropriation of natural resources and the necessary carrying capacity of a humane society [19,20]. In this context, considering emergy-based tools as an approach to assess carrying capacity can be an option if we are dealing with a problem of resource availability and its level of exploitation [21]. Thus, an emergy- and economic-based decision approach can help to achieve the goal of sustainability by highlighting production systems with lower environmental costs and a higher standard of living for all (i.e., SDG 12 [22]).
A few studies highlight the environmental and economic costs through assessing a holistic and integrated system view that aims to improve dairy farm sustainability [23,24]. Linking environmental and socioeconomic costs in a single perspective allows for the assessment of system sustainability from a holistic point of view, helping decision-makers to choose the most sustainable pathways in livestock systems; however, no studies have focused on the contribution of feed sources to the enhancement of dairy farm sustainability [15,25]. Given this, our study aimed to assess dairy farm sustainability from a holistic point-of-view by applying emergy and economic theory perspectives.
Furthermore, this study proposes an evolution from the study of Agostinho et al. [12] which considers the livestock feeding programme in a farm with low-intensity milk production (similar to group G2 from Agostinho et al. [12]). The novelties of this study were: (i) the study of the feed ingredients of the livestock feed programme by season (dry and rainy) using emergy synthesis; (ii) scenario simulations for intensive (INT), semi-intensive (SIS), and extensive (EXT) dairy systems from the livestock feed programme perspective; and (iii) a sustainability comparison of the scenarios using economic profits, efficiency, and the emergy sustainability index as an integrated graphical tool.

2. Materials and Methods

This study was approved by the Committee of Ethics in Use of Animals, School of Veterinary and Animal Science, University of São Paulo (FMVZ-USP), under protocol number 8143010221. Data were collected from August 2020 to January 2021 and then estimated for one year. A descriptive methodology was used for data collection. A case study was conducted using a semi-structured questionnaire and was applied in order to capture smallholder farmer’s perceptions. In addition, a complementary description of the observation, analysis, and interpretation of the data was used.

2.1. System Description and Primary Data Collection

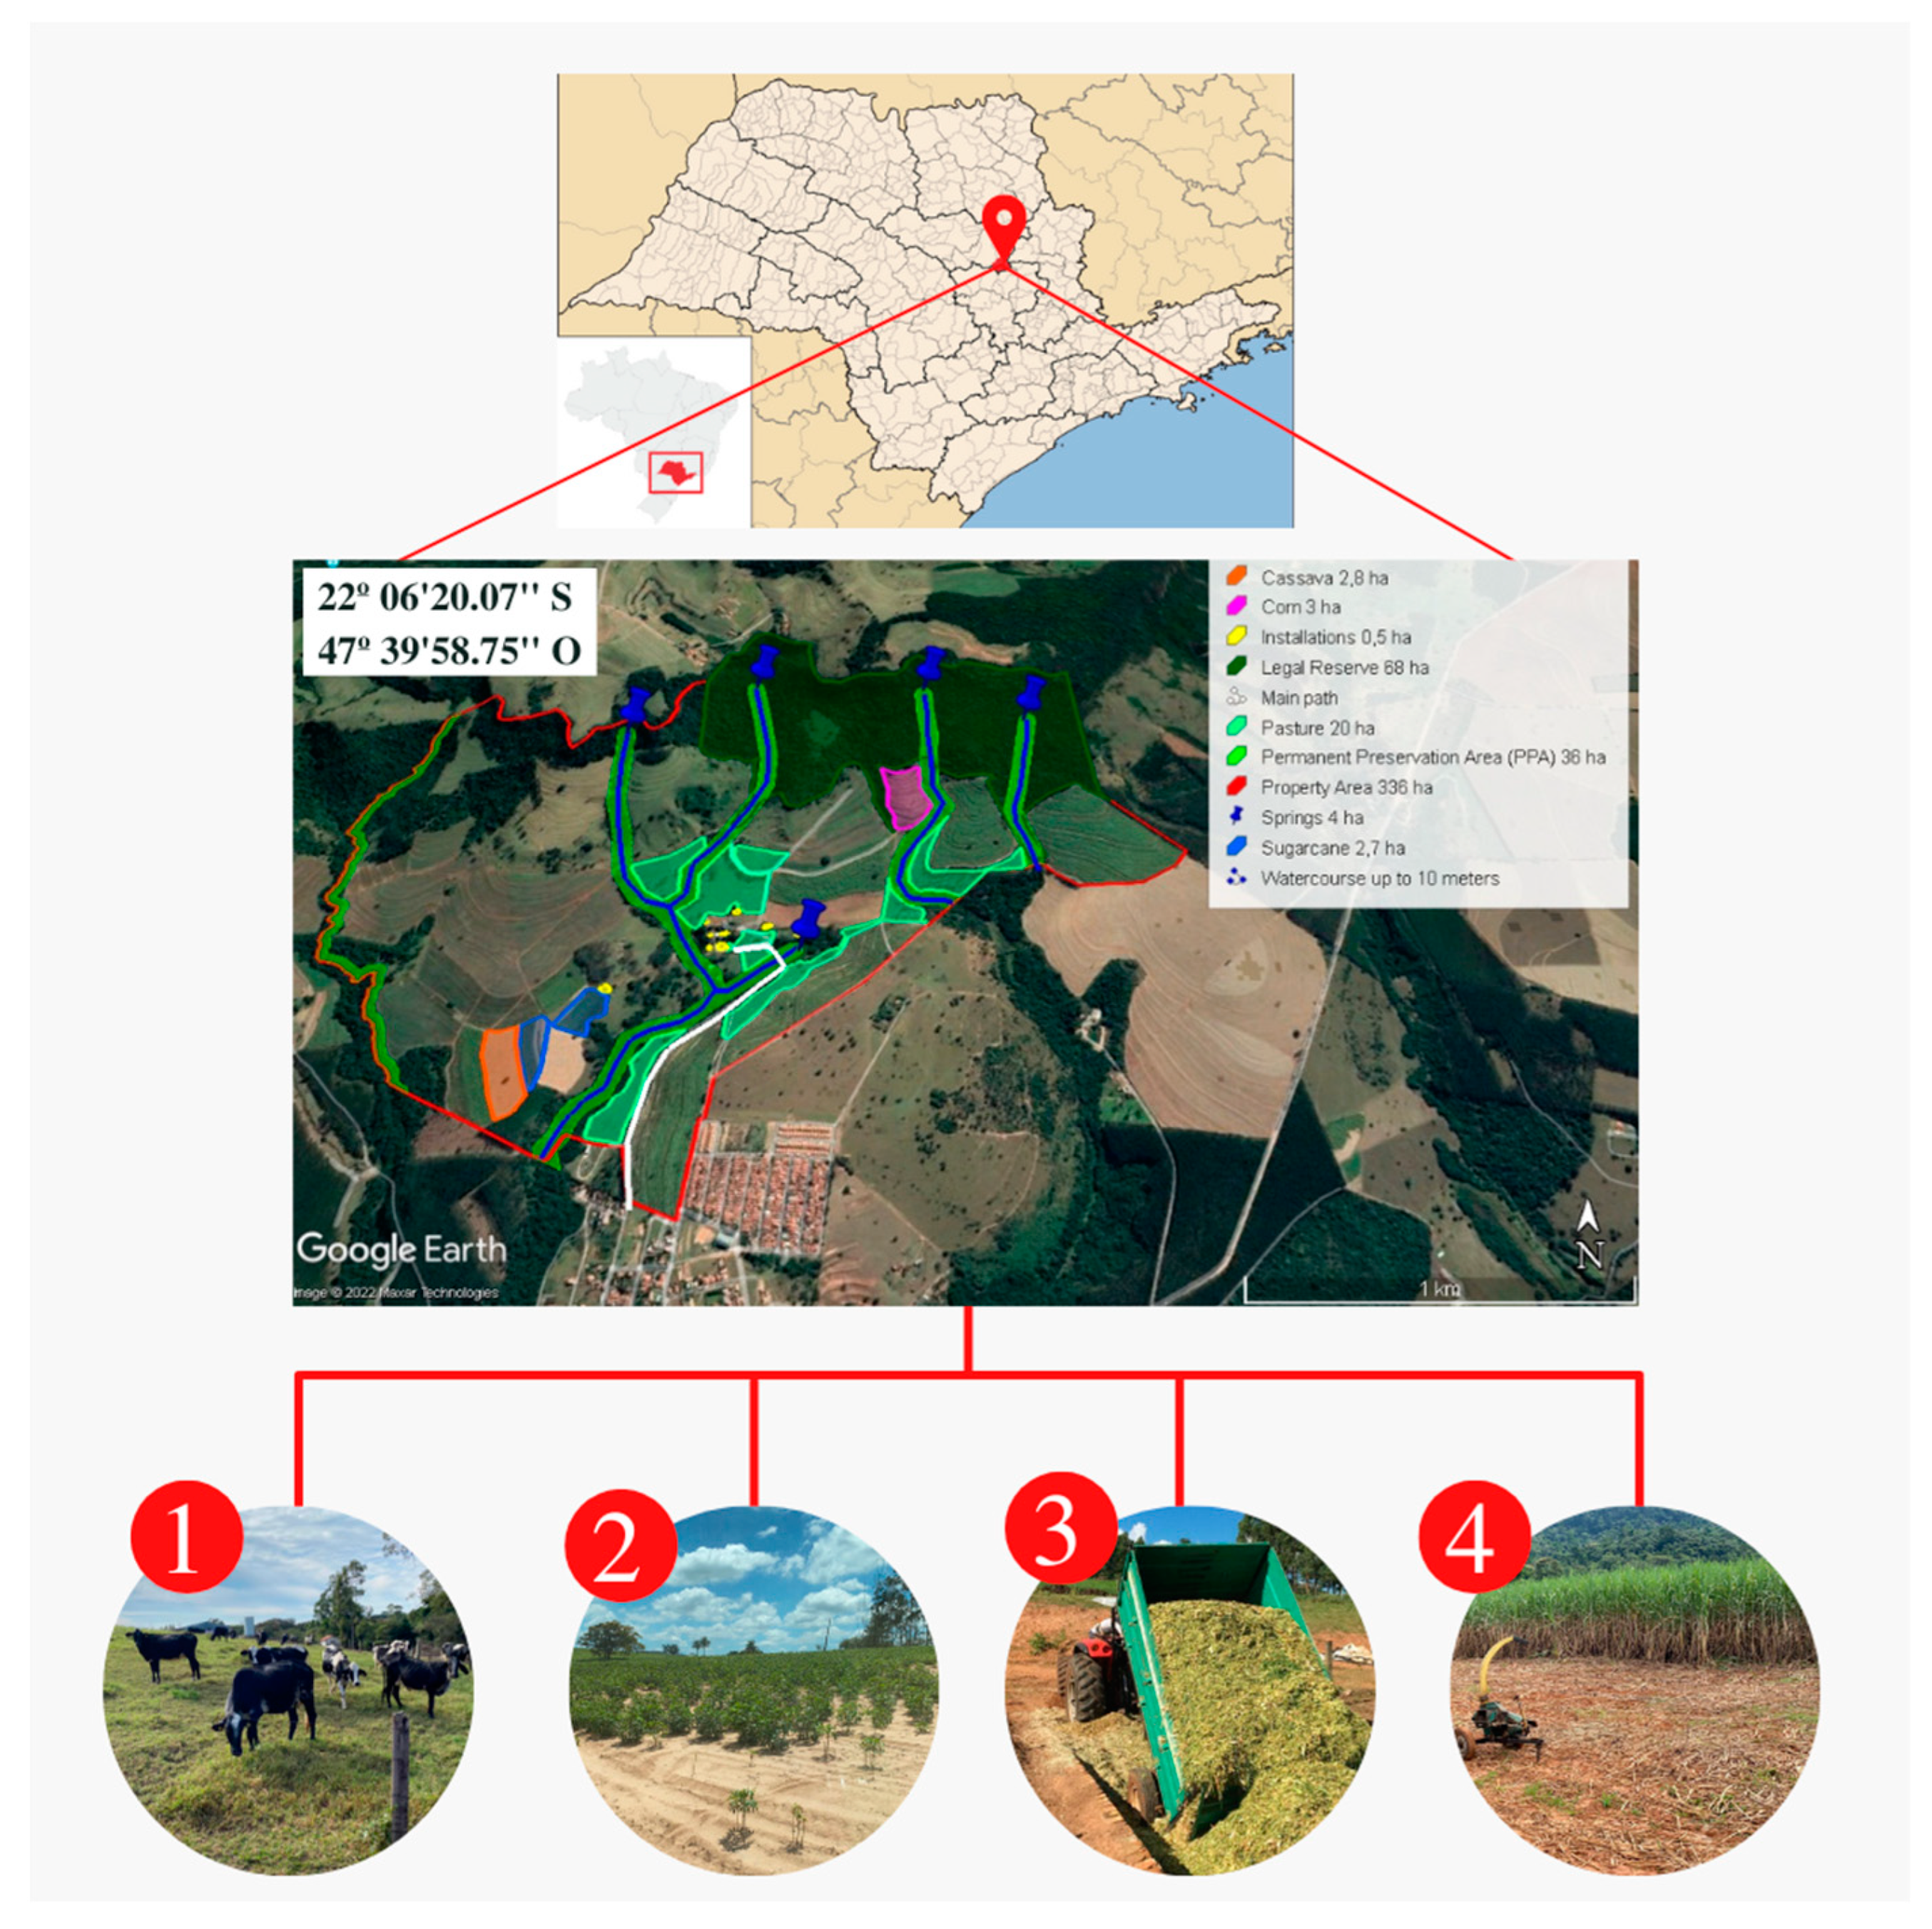
The small Brazilian dairy production system (PROP) studied is located in Analândia, São Paulo, Brazil (22°06′20.07″ S, 47°39′58.75″ W). The predominant biome is the transition between the Brazilian Savannah and the Atlantic Rainforest. The climate is hot and tropical, with an annual precipitation of 1648 mm. The driest months are from April to September (32–81 mm). The property has a Cadastro Ambiental Rural (CAR; Rural Environmental Registry) designation and has legalised forest preservation areas. Additionally, the PROP was included in the Programa Nacional para Fortalecimento da Agricultura Familiar (PRONAF; National Program for Strengthening Family Agriculture) according to the criteria of Decree No. 3.991 [26]. The farm presents a diversified production system, with dairy production as a main source of income. The agricultural land was divided into pasture area (20 ha), cassava area (2.8 ha), corn crop area (3 ha), and sugar cane crop area (2.7 ha) (Figure 1). Other areas were not considered in this study.
The dairy zootechnical performance indexes for the PROP were: (i) lactating cows with an average milk production of 15 litresmilk/cow.day (183,600 litresmilk/yr); (ii) familial labour as the main labour source; (iii) low financial investment in production, characterised by semi-automatic dairy milking; and (iv) buildings and equipment with a high service time (Table 1).

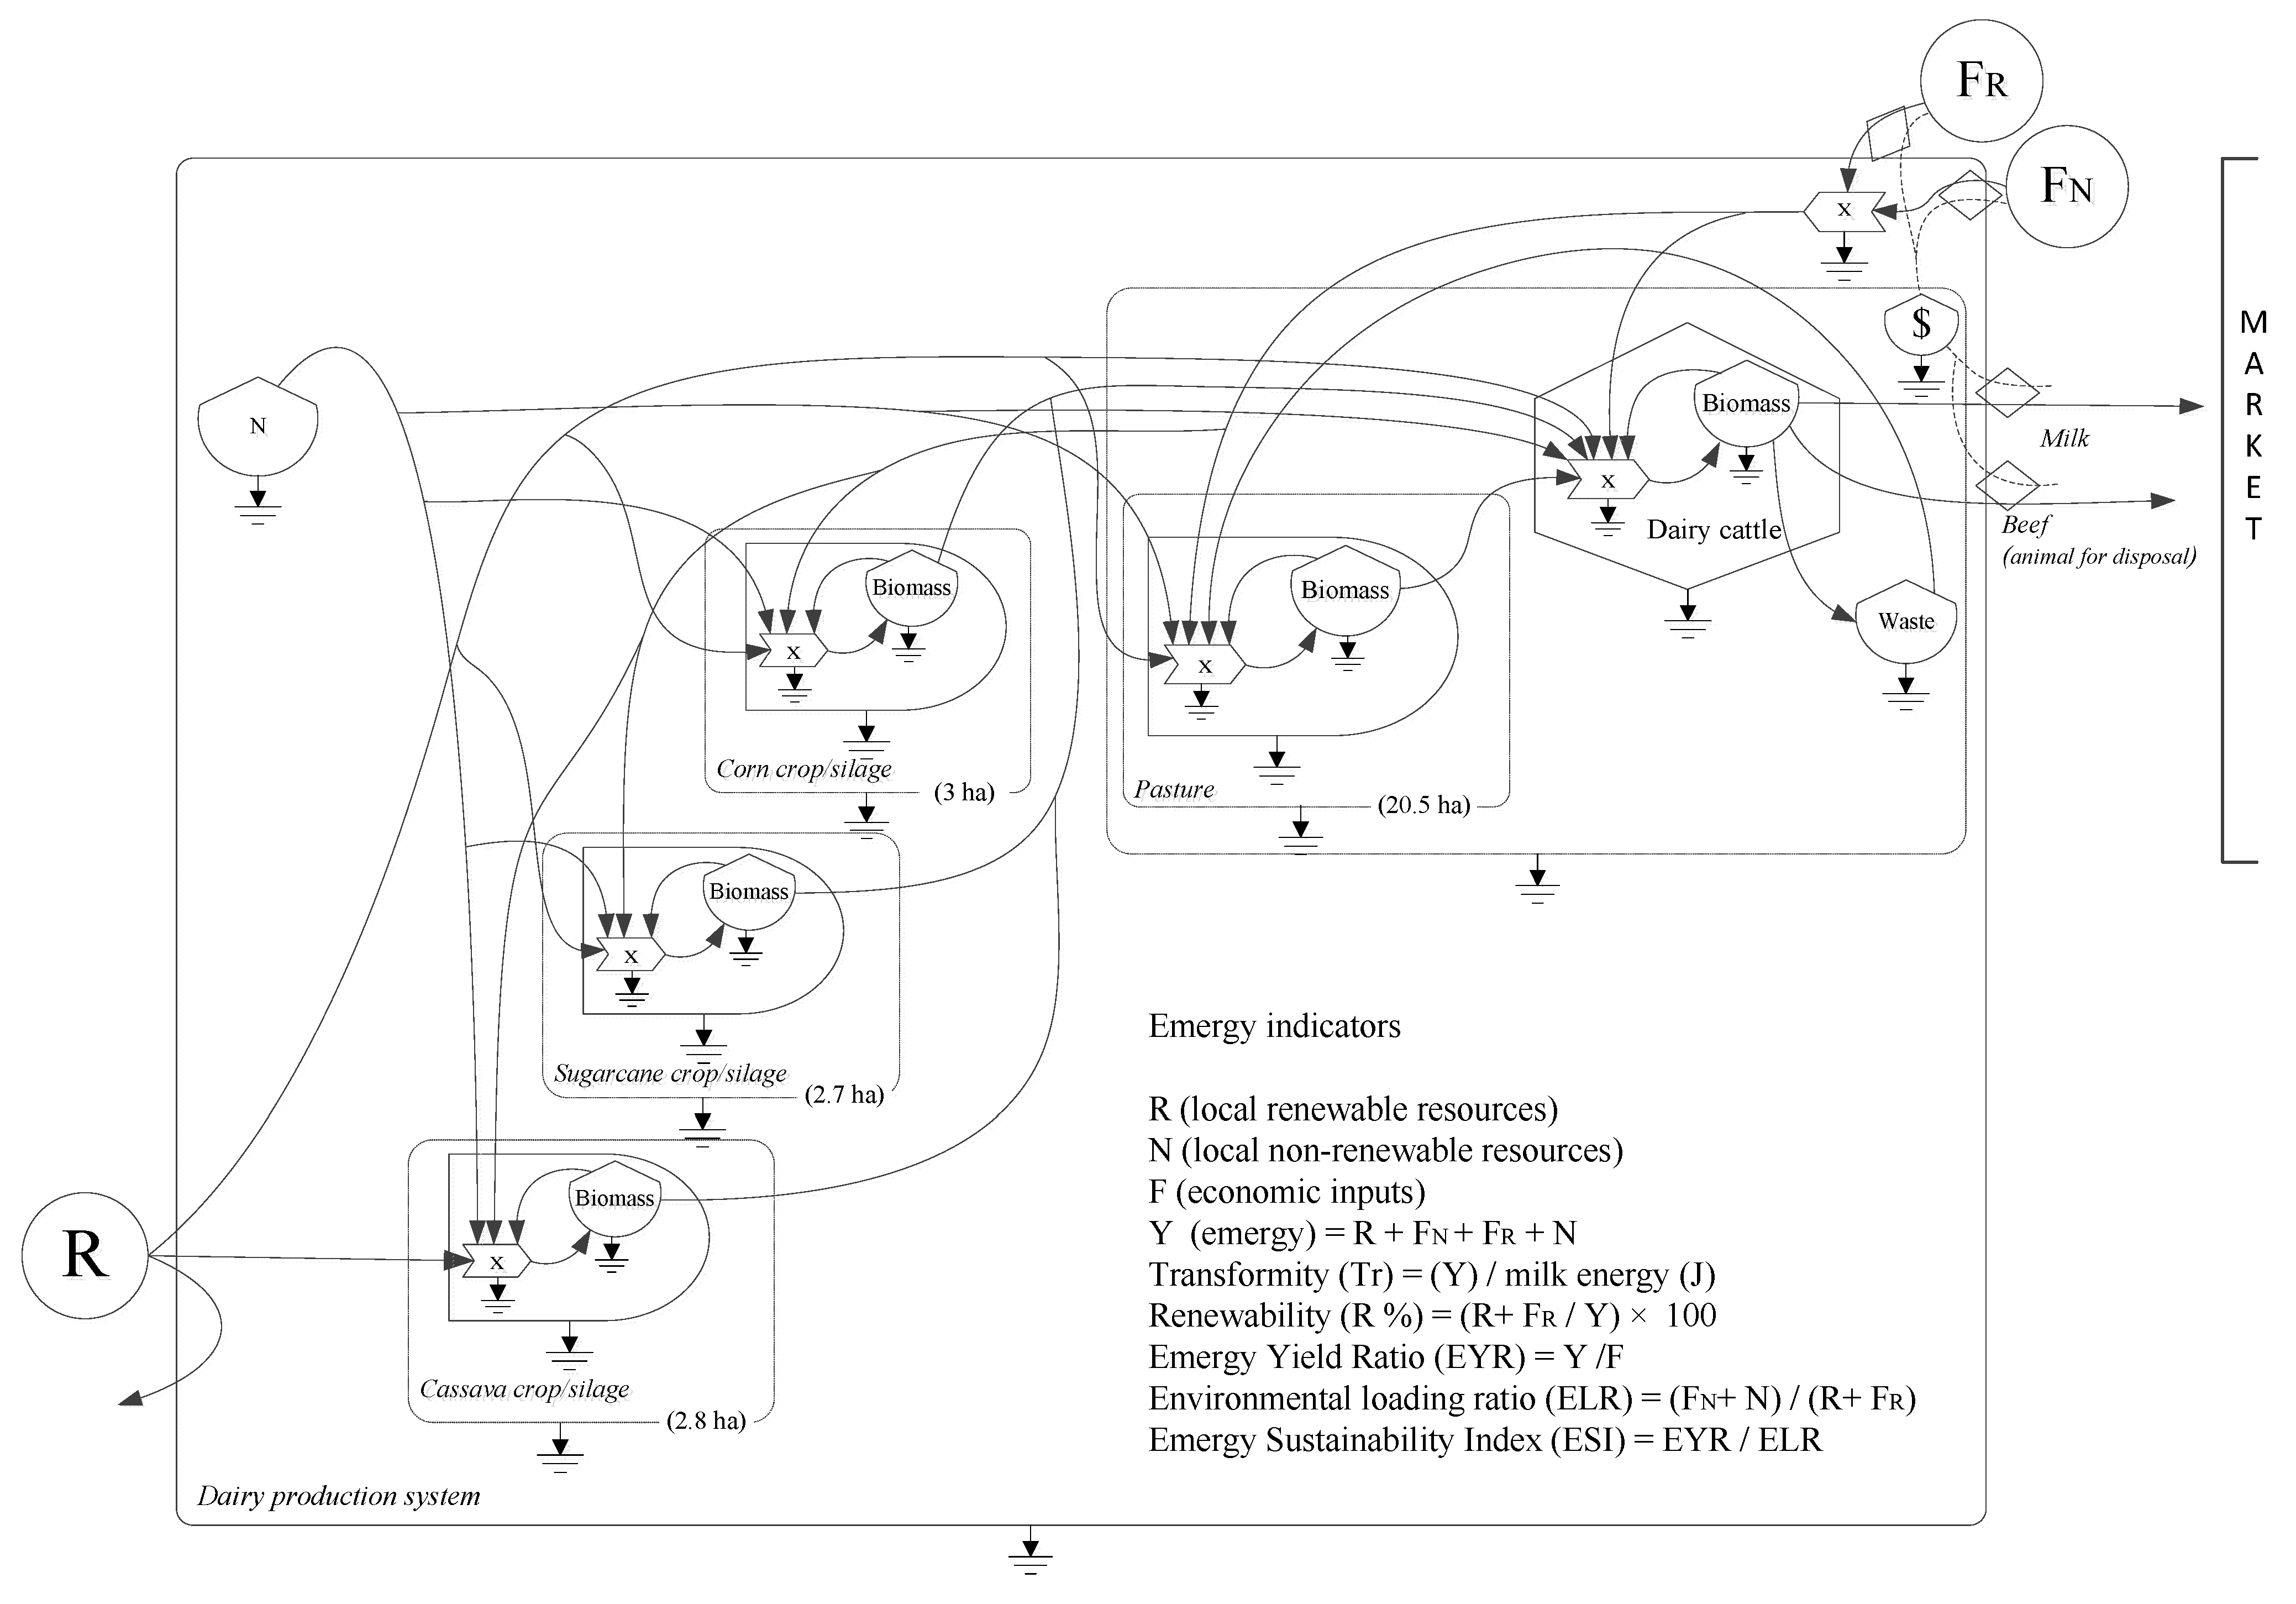
2.2. Emergy Synthesis Model Development

Emergy was proposed by Odum [27] as being the whole energy needed (economic, anthropic, and environmental resources) to produce goods and services in emergy flows with a universal unit of measurement (solar emjoules; sej). This methodology considers the importance of nature in production processes. The methodology depicts the systems, including their driving forces and interactions [28]. Emergy synthesis consisted of three steps: (i) design of the system diagram defining the temporal and spatial system boundaries and the input and output energy flows used in the process (
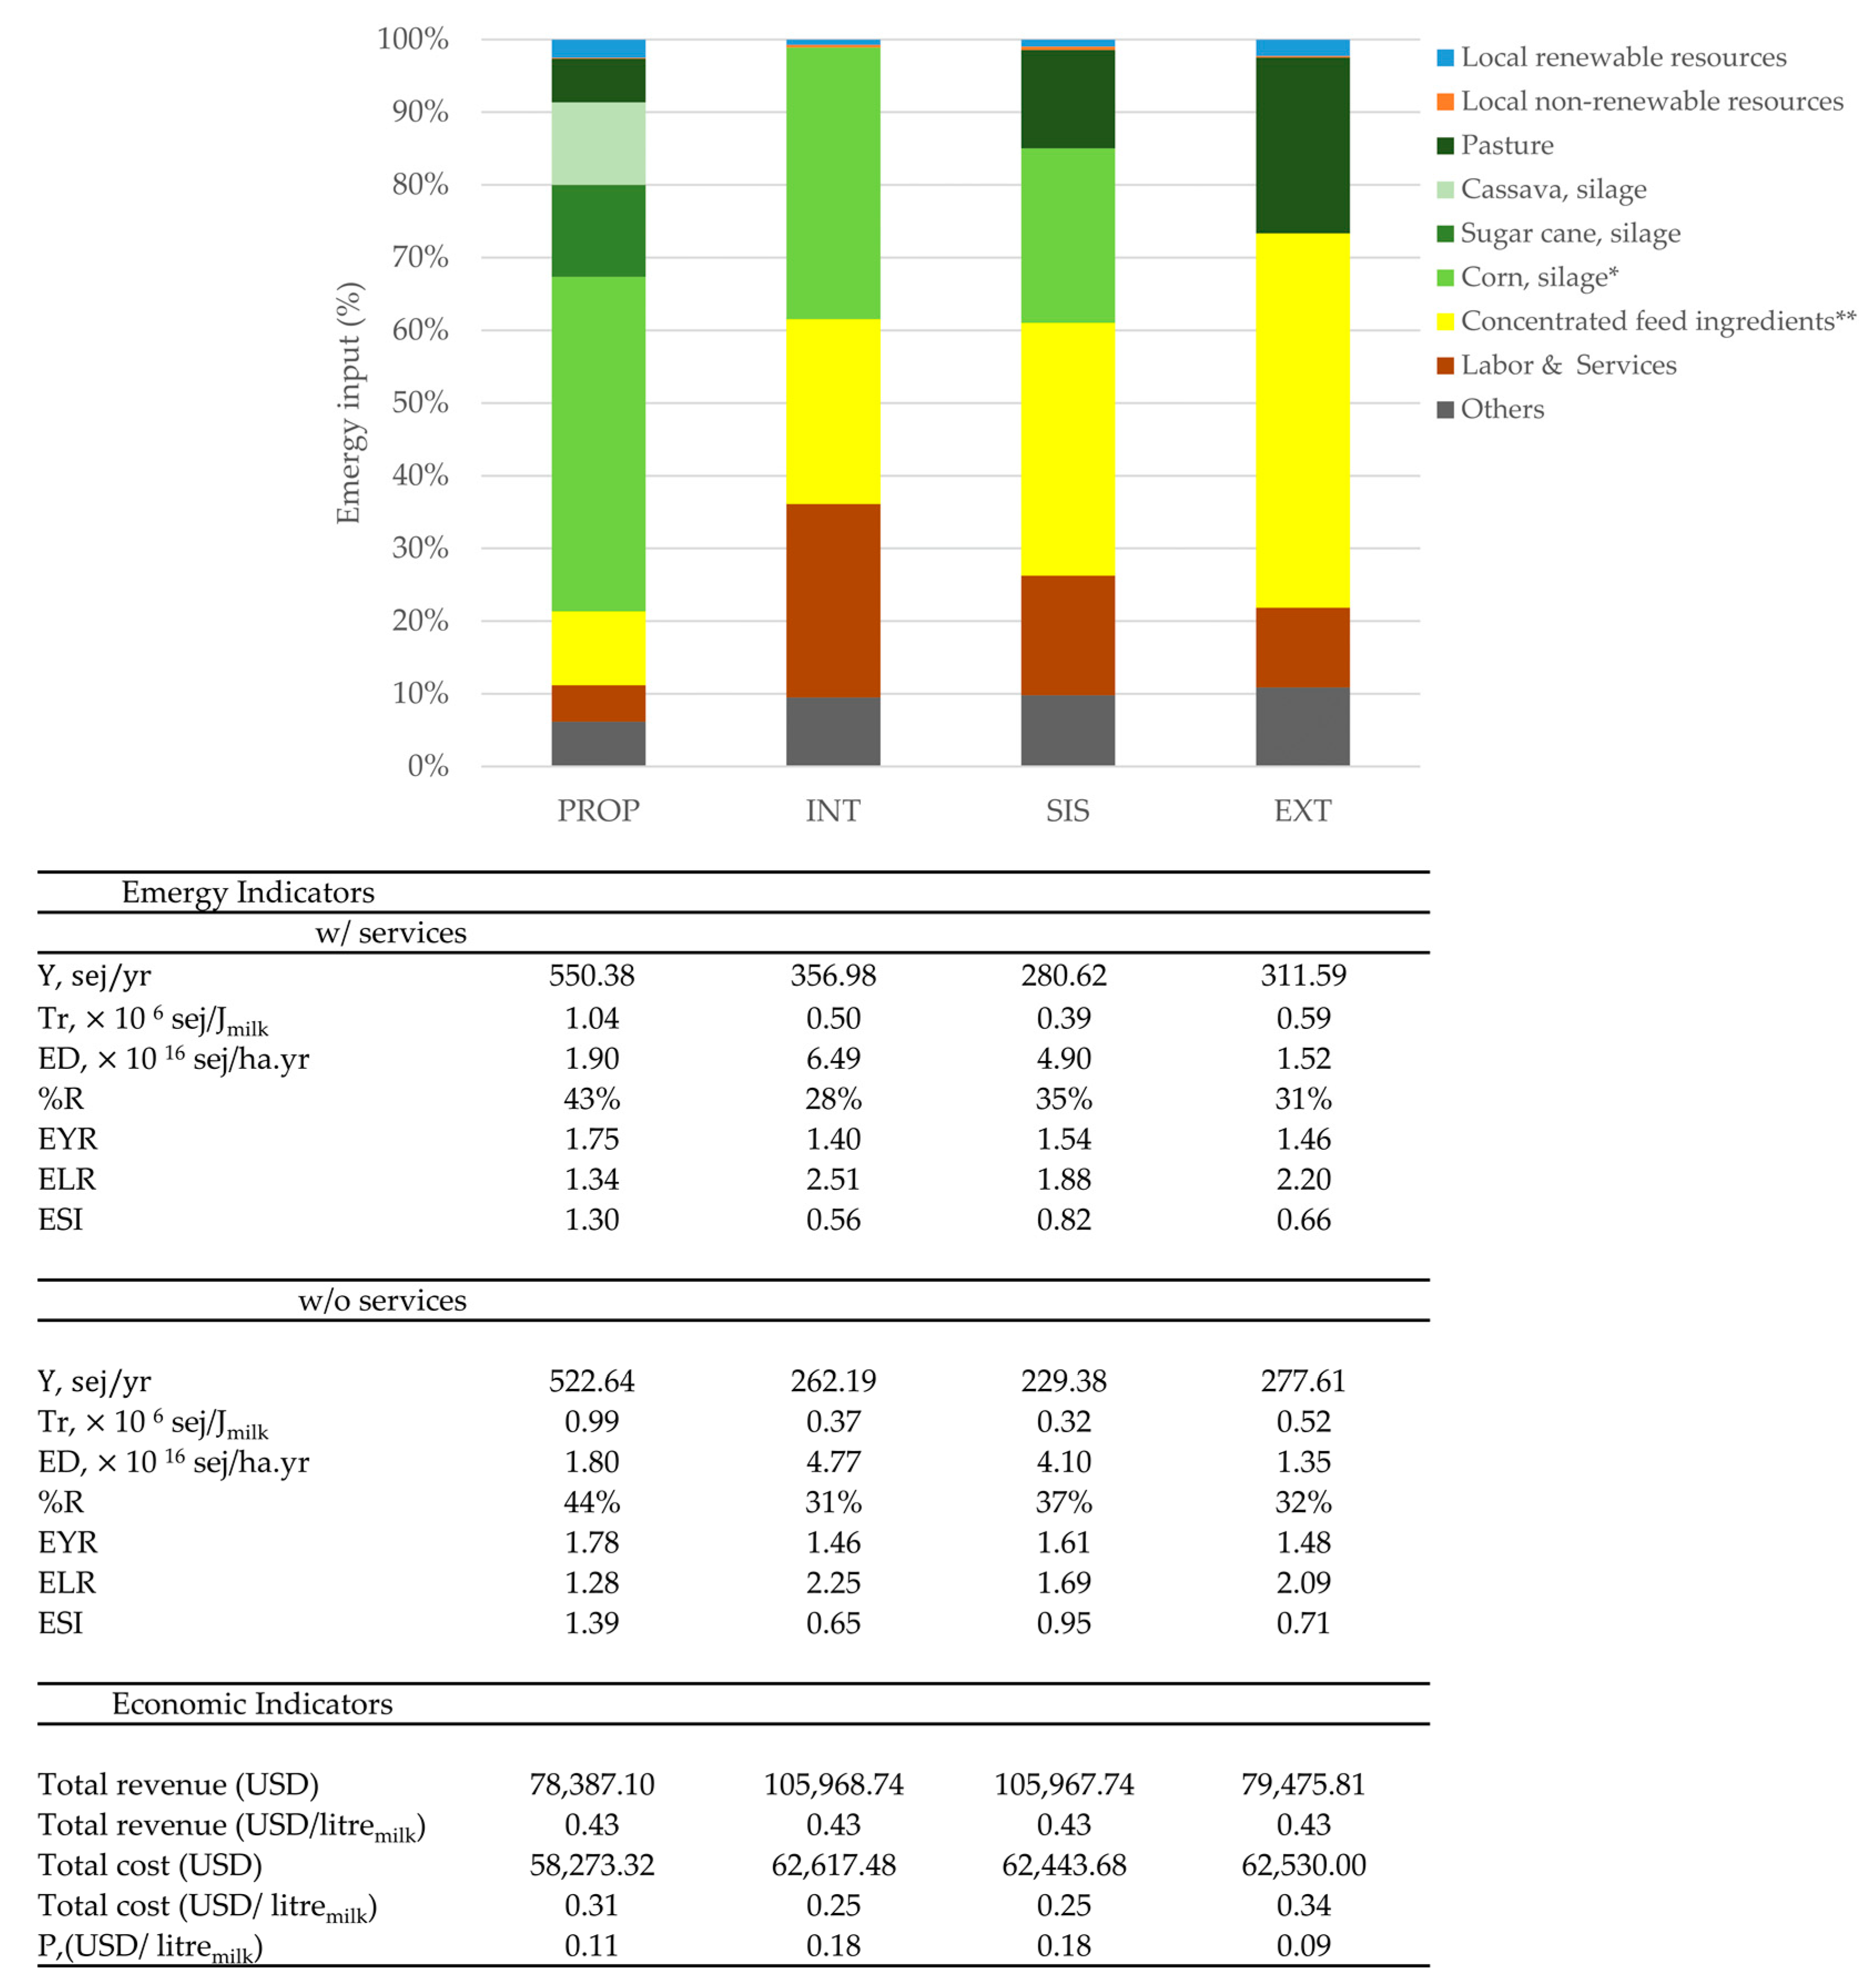
Figure 2); (ii) organisation and construction of tables for calculating emergy flows through transformities and renewability; and (iii) calculation of the emergy indices, followed by a discussion of the results for the system (Table 2). The use of local renewable (R) and non-renewable (N) resources were considered, as well as inputs from the economy (F), considering the renewable (FR) and non-renewable (FN) fraction of each source (Figure 2).
The transformities (Tr) of the Items listed in the calculation tables were obtained from the literature, except corn, cassava, sugar cane, and pasture grazing. The emergy synthesis of cassava, corn, and sugarcane was developed by considering the crop-to-silage process to obtain local transformity and renewability (%R). Detailed information on silage emergy synthesis is provided in Supplementary Material S2.
The Tr and Unit Emergy Values (UEVs) were standardised using the Geobiosphere emergy baseline (GEB) proposed by Brown et al. [32] in which the latest value for GEB is 12.0 × 1024 seJ yr−1. All detailed memory calculations for emergy synthesis are shown in Supplementary Material S3.

2.3. Economic Cost Development Model

The economic cost model was developed according to economic theory. The costs were allocated as variable (Vc) or fixed operational costs (oFc). The total cost (Tc) was considered to be the sum of variable and operational fixed costs. The variable costs were feed (corn and soybean meal, urea, vitamin-mineral supplement, corn silage, cassava silage, and sugar cane silage) and veterinary expenses (veterinary products and vaccines). The costs of pasture management were included as feed costs. The fixed operational costs were labour, depreciation (buildings and equipment), maintenance (buildings and equipment), and other fixed costs (energy and fuel).
The average prices of ingredients used in diet formulation were obtained from market prices reported in São Paulo state from August 2020 to January 2021 and converted at the prevailing exchange rate on the date of recording (USD:BRL = 1:4.73). The average prices per kg of ingredients were as follows: corn meal, USD 0.24; soybean meal, USD 0.52; urea, USD 0.60; vitamin-mineral supplement, USD 0.85; salt, USD 0.17; and corn silage, USD 0.05. The average price per litre of milk was USD 0.47 [33].
Thus, profitability follows according to Equation (1):
P = Rv − Tc
Tc = Vc + OFc
where P is the profitability (USD/litremilk); Rv is the revenue (USD/litremilk); Tc is the total cost for dairy production systems (USD/litremilk); Vc is the variable costs that include all components involved in the activity that only occur if there is production, and that are directly related to milk production (USD/litremilk) [34]; and OFc is the operational fixed costs that represent the elements of expenses that are borne by the farmer, regardless of the production volume [34].
Production costs and profitability are described carefully in Supplemental Material S4.

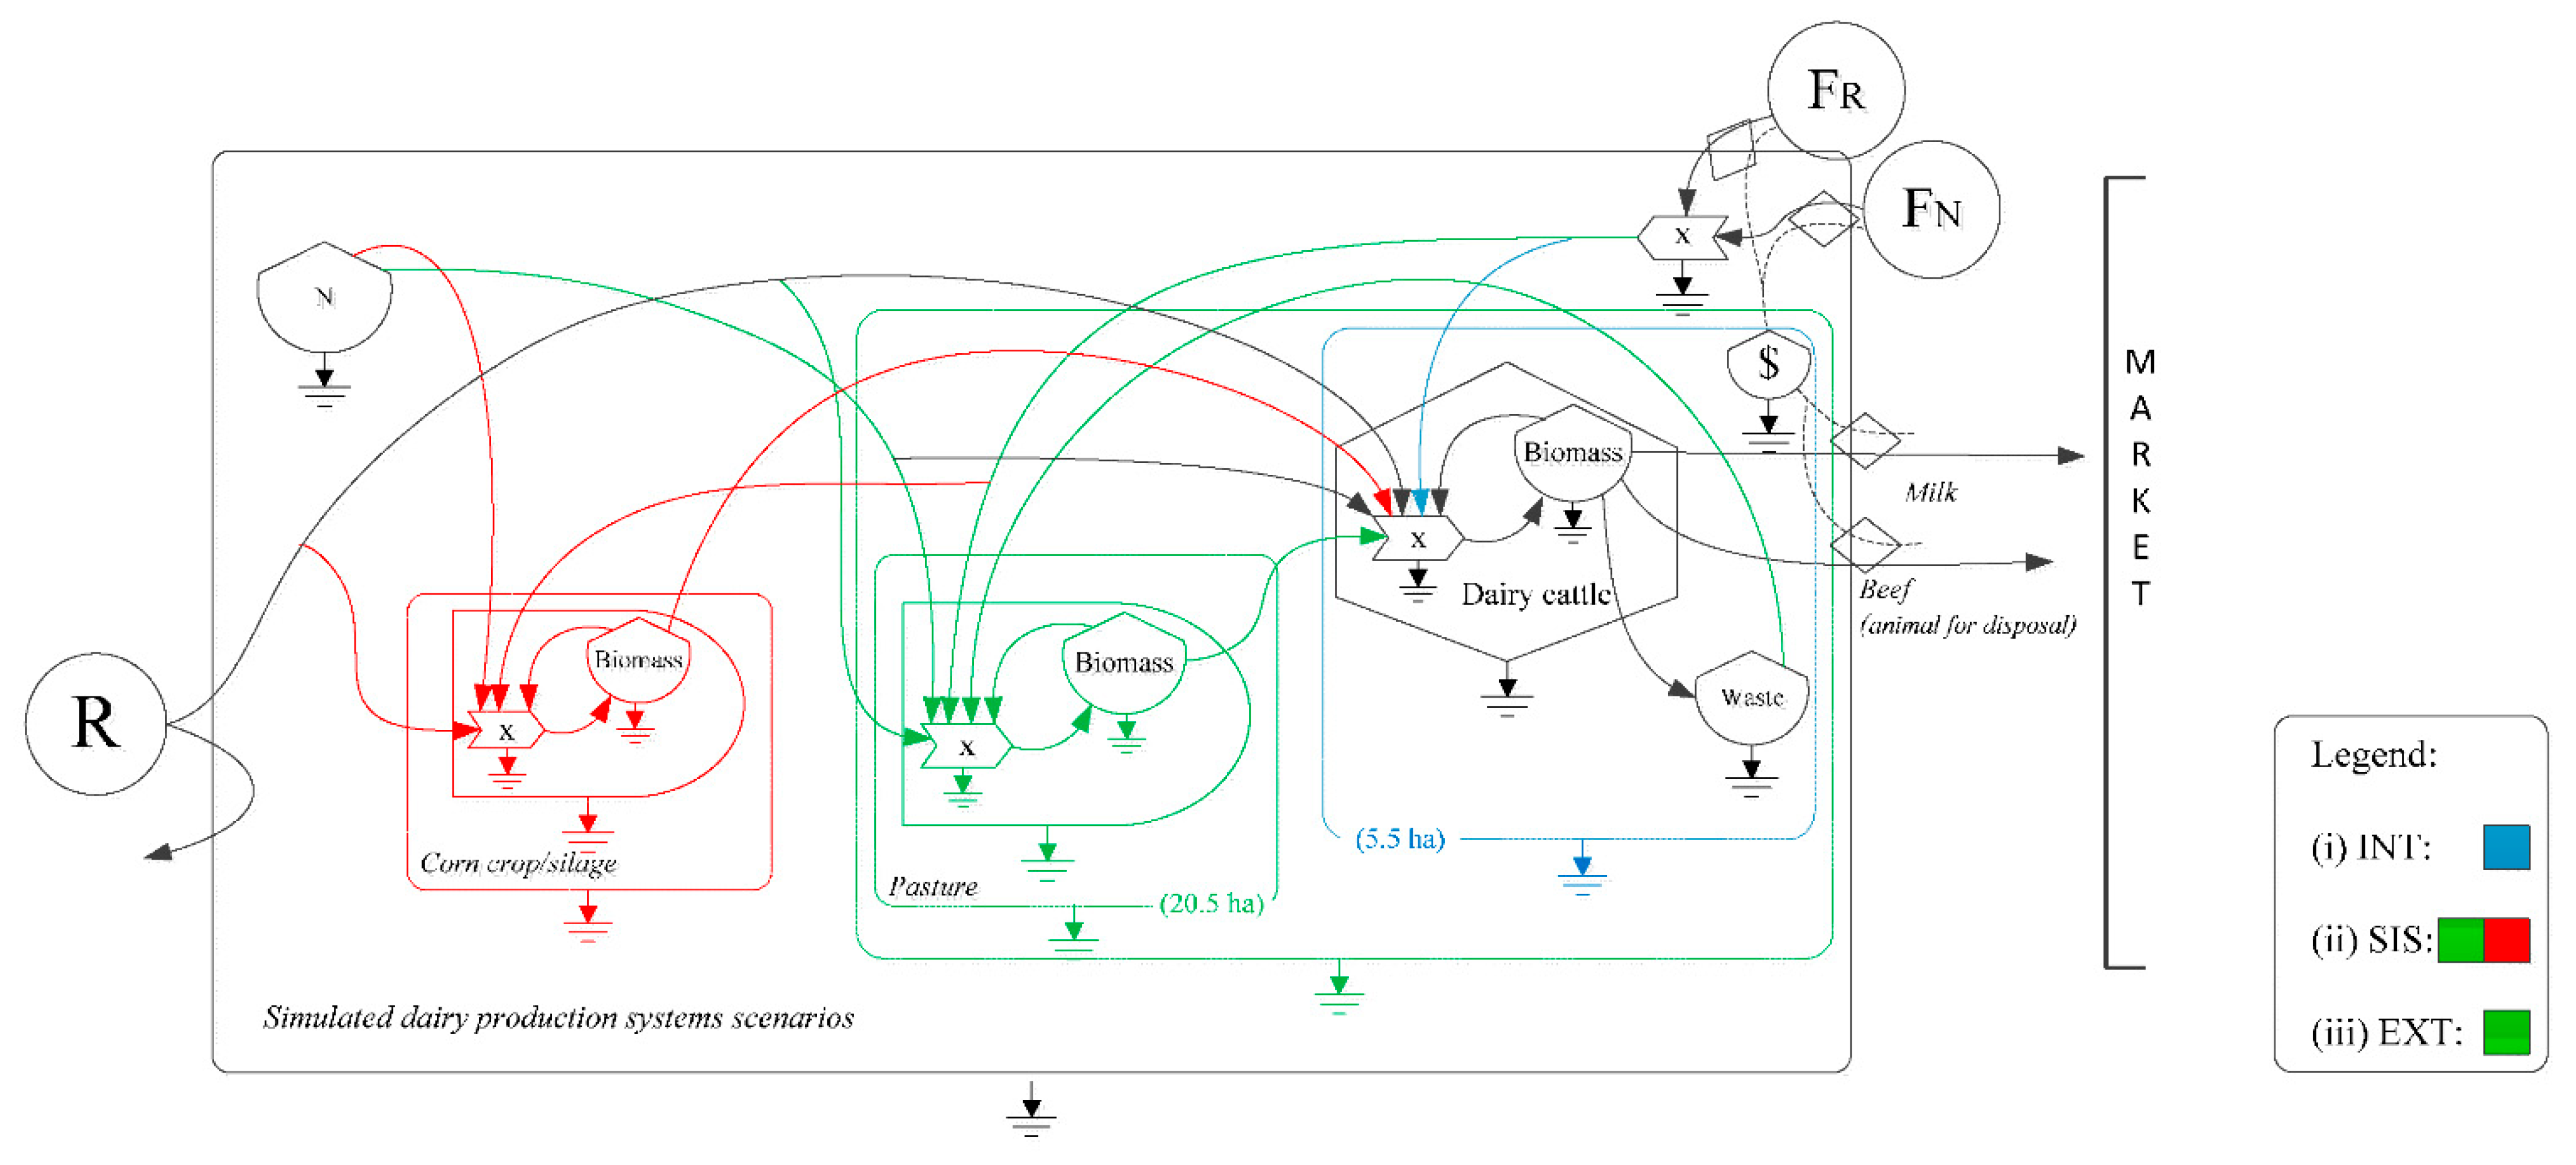
2.4. Comparison between the Most Common Brazilian Feed Programmes: Proposed Scenarios

The proposed scenarios were developed to investigate the economic and environmental costs of different dairy feed programmes, considering the most common feed programmes for dairy production systems (Figure 3).
INT (intensive dairy production system simulation) involves: feed concentrates (corn, soybean meal, minerals, urea, and salt) and corn silage are offered in the trough all year round. Intensive dairy production systems contribute 3% to Brazilian production (BNDES, 2018). This system can be pasture-intensive (2000 to 4500 litresmilk/cow.yr) or confinement-intensive (above 4500 litresmilk/cow.yr) [35]. Production can reach 14,000 litresmilk/cow.yr [36]. The increase in productivity is related to the use of technical knowledge and skills, a specialised herd, a concentrate to feed the animals, and the strict accounting control of production [12]. This system requires significant investment.
SIS (semi-intensive dairy production system simulation) involves: feed concentrates (corn, soybean meal minerals, urea, and salt), access to pasture that occurs during the rainy season (October to April), and corn silage in the trough during the dry season (April to October). Semi-intensive systems are often small and medium farms and family farms, and Brazilian dairy production is composed of over 60% of family farmers [37]. The herd’s feed depends on pasture areas, and forage supplementation is offered in periods of lower growth of tropical grass [35].
EXT (extensive dairy production system simulation) involves: feed concentrates (corn, soybean meal, minerals, urea, and salt) and access to pasture that occurs all year round. According to data from IBGE [38], 75% of Brazilian farmers use so-called extensive systems. Extensive systems are mostly small farms, especially in subsistence and family production. Cattle feed depends exclusively on pasture areas and supplementation only with white salt [35]. In these systems, it is common to have low production from cows (less than 1200 litresmilk/cow.yr) and use more rustic breeds (high-blooded Zebu) [35].
The diets of the proposed scenarios were formulated using the nutritional requirements and nutritive value of the food estimated by the NRC [39] for lactating cows, according to the body weight and expected production of 15 litresmilk/cow.day to meet energy and protein requirements, as suggested by Santos et al. [40]. From the formulation of the diet, the milk production of the scenarios was corrected by the NRC [39] from the stable energy balance (demand = offered), in which PROP was 15 litresmilk/cow.day, INT was 20 litresmilk/cow.day, SIS was 20 litresmilk/cow.day, and EXT was 15 litresmilk/cow.day (Table 3).
INT is the intensive dairy system scenario where the feed program is based on corn silage and protein concentrated feed ingredients in the whole year (365 days). SIS is the semi-intensive dairy system scenario where the feed program is provided according to the climate season features. In the dry season (from April to October), the feed program is based on concentrated feed ingredient intake and corn silage (180 days); in the rainy season (from November to May), the feed program is based on concentrated feed ingredient intake and pasture grazing (Urochloa brizantha; 180 days). EXT is the extensive dairy production system scenario where the feed program is based on pasture grazing (Urochloa brizantha) and protein concentrated feed ingredients during the whole year (365 days).
The livestock feed programme for each scenario is carefully laid out in Supplemental Material S5.

2.5. Interlink Decision Making Index: The Sustainability Evaluation under a Critical Criteria Perspective

The Interlink Decision Making Index (IDMI) is a multi-criteria decision-making tool that aims to simplify through less human interference in determining the best choice for a more sustainable pathway for any process. IDMI aims to integrate key criteria of different dimensions (environmental, economic, social, etc.), while allowing a few of these criteria to be chosen as critical criteria (CC) that are weighted to be more influential than the others in the decision-making process. IDMI proposes a comparison of the options of a particular case (i.e., new product, manufacturing process, or a construction process) under similar selection criteria [41].
Despite having no unit or physical meaning, IDMI can be understood as something similar to the area or volume (or other geometrical properties) that is constructed by all criteria in which the critical criteria (CC) are more influential and decisive to the IDMI value [41]. Mathematically, if there are n selection criteria in a decision-making case, the IDMI value area could be calculated as follows:
without CC                     IDMI = i = 1 n Ci
with one CC IDMI = 1 2 i = 1 n 1 Ci C n
where Ci are the variables, Cn is the (value of the) first critical criteria (CC), and n is the number of selection criteria.
The logic behind Equations (2) and (3) is such that in Equation (2), all criteria contribute to IDMI in a similar way. In Equation (3), all criteria contribute to IDMI, but CC is critical and contributes more. Thus, for this study, the higher the value of IDMI for a particular system, the better the option may be [41].
The criteria selected as CC must be directed towards more sensitive and contributing criteria in the IDMI value. The selection of criteria and CC can be done by a survey of managers or decision-makers in the industry or government or from the experience of the particular decision-making group [41]. In this study, the selected criteria were ESI, GP, and P. The rules chosen for the CC were: no CC, ESI as CC, and P as CC. The objective of CC selection was to identify changes in the sustainability ranking among the proposed scenarios, as far as the variable elected as CC was modified.
Since the values obtained for each criterion have different unities and magnitudes, it is difficult to compare them directly. Thus, it is essential to make the value dimensionless before IDMI calculation [41]. Index standardisation was defined by dividing the selected criteria by the reference values for each indicator. The reference values were selected according to the group G2 proposed by Agostinho et al. [12]. The profitability from G2 was assumed to be the same value obtained for the SIS scenario.

3. Results and Discussion

3.1. Pathway for a More Environmentally Friendly Dairy Production System from a Feed Programme Analytical Approach

Feed had the highest contribution to total emergy (86%; Table 4), whereas services represented 5% of the total emergy. Regarding only corn, soybean, and urea, the feed contributions for the total emergy fall to 39% and services increase to 22%. Compared to the results of Agostinho et al. [12], and only considering urea, corn, and soybean as feed in group G2, the feed contributed 19.5% of the total emergy, whereas services comprised 17% of the total emergy. Thus, considering the fodder ingredients in the emergy calculation, the feed contribution for total emergy was four times greater than the feed contribution for group G2.
Estimating the Tr of the main inputs could make the total emergy evaluation more accurate [48]. Thus, the transformity calculation of the main feed ingredients used on dairy farms is useful because feed is the most important flow in the total emergy. Vigne et al. [25] evaluated the emergy of a French dairy production system by considering a feed programme in a more analytical approach. According to the authors, for dairy system-level results, even considering the fodder ingredients, the feed concentrates showed the highest contribution to the total emergy (from 18 to 52%). Forage ingredients mentioned for dairy production levels (crop residue grazing and forages) contributed 9.7 to 14.7%. However, this percentage can increase when emergy for production and optimisation of the vegetal biomass is considered.
The strategy adopted by the authors to account for the energy present in forage ingredients can be the cause of the differences shown for emergy contribution in the studies on the subject. Vigne et al. [25] used the quantity offered (g or kg) per animal for the Tr calculation. This methodology is commonly used to account for the contribution of forage ingredients and feed concentrates on dairy systems [14,15,57,58]. However, this study opted to evaluate the supplied diet based on the energy contribution of each feed ingredient (in Mcal/kg). Additionally, considering the feed ingredients in a more analytical approach, this criterion helps to improve system sustainability when compared with other dairy systems (Table 5). The results showed a higher level of sustainability, both from %R and ESI, when compared to the study by Agostinho et al. [12]. According to Castellini et al. [48], when performing a Tr estimate, the non-renewable/renewable fraction of each economic input F must be considered since this feed ingredient could increase the sustainability of the production system. In this study, corn silage, sugar cane silage, cassava silage, and grazing pasture showed estimated %R of 46, 18, 73, and 85%, respectively. The sustainability results from this study were closer to the SM results proposed by Vigne et al. (2013). This suggests a better use of local emergy inputs with a lower environmental load when compared to the other dairy systems.
According to Giannetti et al. [59], the analyst’s decision to consider the renewable fraction for the main F resource can drastically impact the sustainability assessment of agricultural systems. As the feed programme is the most important input flow for dairy systems and is provided from F resources, the adoption of renewable fractions for the most important F resources must be considered. In addition, for the authors, it is justified to evaluate the supplied diet from the energy contribution of each feed ingredient for three reasons: (i) the form is routinely used in academic and technical studies in livestock science for the formulation of feeding programmes to meet the livestock requirements; (ii) to make the estimate and contribution of feed ingredients fairer in the renewable fractions (F_R); and (iii) to make the sustainability assessment fairer in livestock systems that use ingredients produced inside of the studied boundaries.

3.2. Pathway for a More Sustainable Dairy Production System: An Intensification System Simulation

According to the results previously shown, PROP was more environmentally friendly than the more intensified dairy systems described in the scientific literature [12,25]; however, decision making along paths that lead to more sustainable production must have a holistic scope that considers both environmental and socioeconomic characteristics [41]. If less-intensified milk production systems tend to be more environmentally friendly [12], this system can also be less economically viable. In recent years, the “sustainable intensification” approach has been proposed as a pathway to make food production more intensive in ways that place far less pressure on the environment and that do not undermine our capacity to continue producing food in the future [60]. In addition to intensification, some research claims that systems that are more environmentally friendly and less dependent on external resources can be more resilient [61]. The resilience of environmentally friendly systems has come into focus due to extreme situations observed in recent years, such as those observed during the coronavirus pandemic and also the climatic and biogeochemical changes that are already visible in several territories [62]. The more environmentally friendly systems have the ability to meet the demand for food of the growing society. However, public investments must be directed towards training and improving animal husbandry techniques with and improving access to technologies and technical assistance [62,63]. Additionally, the sustainable intensification approach is directly related to sustainable development from yield and farmer income improvement [7,60]. Thus, it is reasonable to simulate the impact of the PROP conversion for more or less intensified scenarios. For this, feed programme management, yield (litresmilk/cow), and higher density were changed to demonstrate sustainability in a holistic way.
As expected, higher intensification levels increased the dependence of the system on economic resources, as shown by services (Figure 4, PROP = 5%, INT = 27%, SIS = 16%, and EXT = 11%) guided by payment for feed that comes from an economic framework. With the increase in system intensification, the emergy contribution from services increased two to five times compared to PROP. This fact suggests that, in the more intensive scenarios, a quarter of whole emergy is designated for the payment of human services, whereas in the original scenario, the emergy services contribution was less than one-tenth. Given this, the more intensified scenarios showed lower environmental performance than PROP (for PROP: %R = 43%, ESI = 1.30; for INT: %R = 28%, ESI = 0.56; for SIS: %R = 35%, ESI = 0.82; for EXT: %R = 31%, ESI = 0.66). The use of renewable resources in PROP (R plus FR) was two times higher than in the simulated scenarios. Additionally, when compared with the simulated scenarios, PROP showed more effectiveness in the use of economic resource inputs through the exploitation of local renewable resources with lower environmental loading. According to Brown and Ulgiati [64], production systems or processes with a lower share of renewable emergy resources are likely to be less sustainable and less successful in economic competition in comparison with systems that use renewable emergy resources. In this context, the use of feed ingredients produced within dairy farms promoted a higher contribution of renewable resources. Thus, the higher use of local resources could improve the sustainability of livestock systems.
Despite PROP being the more sustainable scenario in emergy, its profitability was 1.6 times lower than the more intensive scenarios. This fact was related to the lower yield production from PROP compared to the more intensive scenarios. In this study, the simulated production yield for INT and SIS scenarios was 25% higher than the real production yield for PROP provided by a grain-rich diet that meets the nutritional requirements of the animals. Thus, despite the higher total economic costs for INT and SIS, the higher yield production would dilute the total economic cost and increase revenue in turn. In fact, high-grain diets have more energy and protein levels that support milk productivity and increase milk solids content [65], but the use of high-grain diets can increase feeding costs, as they tend to be more expensive than forage-rich diets [66]. If dairy cows fed a high-grain diet do not have the genetic ability to express this feed increment in litres of milk produced, this higher cost for feed will be converted into an increase in nutrient excretion or average daily gain [67].
In summary, the proposed feed programme scenarios showed a “trade-off” between profitability and environmental performance. On the one hand, the intensification that aims to increase yield production could increase the economic response for PROP; on the other hand, the suggested intensification could reduce the environmental performance and, potentially, the dairy production system’s sustainability. Thus, the best feed programme choice must be guided by multi-criteria decision-making tools that allow consideration of economic and environmental aspects in the same pathway.
Figure 4. Percentage of emergy input contribution (sej yr-1) and economic indicators for each dairy system scenario. Note: * external input only for INT scenario; produced within the boundaries for PROP and SIS scenario; ** considering the sum of corn meal, soybean meal, vitaminic-mineral supplement, urea, and salt (external input); Others: considering the sum of buildings and equipment, pesticides and vaccines, fuel, electricity, liquid nitrogen, and stainless steel. Where INT is the intensive dairy system scenario, the feed program was based on corn silage and protein concentrated feed ingredients during the whole year (365 days). SIS is the semi-intensive dairy system scenario where the feed program was provided according to the climate season features. In the dry season (from April to October), the feed program was based on concentrated feed ingredient intake and corn silage (180 days); in the rainy season (from November to May), the feed program was based on concentrated feed ingredient intake and pasture grazing (Urochloa brizantha; 180 days). EXT is the extensive dairy system scenario where the feed program was based on pasture grazing (Urochloa brizantha) and protein concentrated feed ingredients during the whole year (365 days).%R is the renewability, P is the profitability, and P is the profitability per litre of milk. A litre of milk was considered to be USD 0.427.
Sustainability 15 04674 g004

3.3. Selection of More Sustainable Dairy Production from a Multi-Criteria Perspective

Sustainability assessment is an important concern at several levels in the hierarchy of agricultural systems [68,69], particularly at the farm level [70]. Farming systems are dynamic, stochastic, and purposeful systems. The farm-level framework is the most important unit of decision analysis for economic and technological decision making [70]. In this context, the use of multi-criteria decision-making tools that integrate environmental and economic aspects is reasonable due to the necessity of analysing multifaceted problems in real time for farm-level decision making, as well as agricultural policymaking [71].
According to the results, the SIS scenario presented a high IDMI value (IDMIn = 8.21, IDMIP = 3.61, IDMIESI = 8.28) compared to PROP (IDMIn = 7.14, IDMIP = 2.01, IDMIESI = 5.15) and the other proposed scenarios independent of the adopted critical criteria (for INT (IDMIn = 6.06, IDMIP = 2.52, IDMIESI = 4.25; for EXT (IDMIn = 5.59, IDMIP = 1.32, IDMIESI = 3.88) (Table 6 and Figure 5). The IDMI value reinforced the results observed from the global productive graphical tool. Thus, SIS was more efficient, more sustainable, and more profitable than the others. The better results for SIS could be explained by the combination of the higher yield production and lower dependence on economic inputs. Agostinho et al. [12] observed similar results and concluded that semi-intensive dairy systems should be promoted, rather than extensive dairy systems, to provide more sustainability than the others.
Notably, the results of this study can be seen from another perspective. Extensive dairy systems represent the majority of Brazilian dairy systems [12]; thus, as a first step, public policies could support the conversion of extensive dairy systems into systems with PROP features. This strategy should aim to increase local and regional dairy sustainability that promotes financial, educational, and cooperative actions to increase the use of local renewable resources (i.e., local feed ingredients) and reduce the dependence on external economic inputs in the system. This strategy could be reasonable since the PROP system was more environmentally friendly and profitable than EXT systems. As an example of current Brazilian public policy, Act n° 12.188/2010 [72] aims to align familial smallholders with a holistic point of view focused on sustainable development, and to use a technological model guided by agroecological principles.
Additionally, public policies could be promoted for intensive dairy systems aimed at more environmentally friendly dairy farms. In this case, public policies should be targeted at the bonification of more sustainable systems that promote best practices for dairy–crop integration. As an example, Act n° 14.119/2021 [73] and Decree n° 11.075/2022 [74] are public policies that aim to subsidize producers for ecosystem services in carbon credits and other forms of payment.
In this context, further studies could investigate the impact of public support in the conversion of extensive dairy systems into systems with PROP features focusing on environmental and socioeconomic aspects.

3.4. Limitation of the Study

The main limitation of this study was the lack of specific transformities for some of the feed ingredients because of the local production features. To solve this limitation, the study proposed an estimate of the transformity for the feed ingredients that were the major participants in the feed program (i.e., on-farm produced feed ingredients). Thus, since dairy herd feeding programs are also composed of other feed ingredients, further studies should be conducted to evaluate the transformities of ingredients such as corn and soybean meal, as well as industrial supplements.

4. Conclusions

The primary conclusions are as follows:
(i)
In this study, evaluating the feed programme from a more analytical approach and the energy contribution of each feed ingredient (Mcal/kg) was chosen as a criterion due to its use in academic and animal science in the formulation of feeding programmes to meet the nutritional requirements of animals. For the authors, the updated emergy algebra procedure used to study the emergy feed contribution allows for a fairer evaluation of environmental performance for dairy systems by considering the possible benefits of feed ingredients in sustainability measurements. Future studies must, however, continually assess the implications of the assumptions and estimates required for the emergy linked to local primary data collection (renewable and non-renewable) and the UEVs to create a calculation of indicators that is more transparent and, consequently, provides a greater dissemination of the emergy methods.
(ii)
The results demonstrated the potential for multi-criteria decision assessment tools that integrate economic and emergy indicators to become management tools for public policies, supporting stakeholder and government decisions to promote sustainable processes for dairy systems. Additionally, sustainability assessments cannot only consider economic profitability, as obtained in intensive production systems. We therefore concluded that a broader multi-criteria approach is crucial for developing an appropriate policy framework to achieve a sustainable dairy production system.
(iii)
Based on the simulations and study of the original dairy system, it was possible to highlight a trade-off between profitability and environmental performance. Two suggestions should guide the decision-maker and government policies: (i) the conversion of extensive dairy systems into semi-intensive dairy systems with feed ingredients produced within the system and aimed at higher profitability and environmental performance. For this, public policies should be targeted at promoting financial, educational, and cooperative actions to promote internal feed production; and (ii) the conversion of intensive dairy systems to semi-intensive dairy systems aimed at higher environmental performance, and in this case, public policies should be targeted at the bonification of more sustainable dairy systems that promote best practices for crop–animal integration.
Furthermore, “to grow or to expand” does not mean the same thing as common sense would dictate and, here, suggests sustainable concepts. Considering the writings of Odum in his book A Prosperous Way Down [75], the idea that there are situations where it is necessary “to regress to progress” must be spread.

Supplementary Materials

The following supporting information can be downloaded at: https://www.mdpi.com/article/10.3390/su15054674/s1, Table S1: Description of the studied dairy production system in São Paulo state [76,77,78]; Table S2-1: Renewability fraction values of items considered in this study [55,56], Table S2-2: Unit emergy values (UEV) considered in this study [27,42,45,52,54,79,80,81], Table S2-3: Pasture (managed) emergy evaluation, Table S2-4: Sugar cane emergy evaluation, Table S2-5: Corn emergy evaluation, Table S2-6: Cassava emergy evaluation; Table S3-1: Renewability fraction values of items considered in this study [48,55,56], Table S3-2: Unit emergy values (UEV) considered in this study [27,42,43,44,45,46,47,48,49,50,51,52,53,54,81], Table S3-3: Property emergy evaluation (Original scenario; PROP), Table S3-4: Emergy evaluation of intensive dairy production system scenario (INT), Table S3-5: Emergy evaluation of semi-intensive dairy production system scenario (SIS), Table S3-6: Emergy evaluation of extensive dairy production system scenario (EXT), Table S3-7: Yearly basis emergy flows (in E+15 sej/yr) and indexes overview for the studied milk production system and the proposed scenarios, Table S3-7.1: Emergy indexes overview for the studied dairy production system and the proposed scenarios; Table S4: Costs and profitability for each scenario; TableS5-1: Description of the livestock feed program for each scenario, Table S5-2: Description of the livestock feed program for PROP scenario, Table S5-3: Description of the livestock feed program for INT scenario, Table S5-4: Description of the livestock feed program for SIS scenario, Table S5-5: Description of the livestock feed program for EXT scenario.

Author Contributions

Conceptualization, V.T.L., R.A.N., V.T.R., T.F.A.d.A. and J.V.P.; methodology, V.T.L., R.A.N., B.F.G. and A.H.G.; validation, R.A.N., B.F.G. and A.H.G.; formal analysis, V.T.L., R.A.N., B.F.G. and A.H.G.; investigation, V.T.L.; resources, R.A.N., B.F.G. and A.H.G.; data curation, R.A.N., B.F.G. and A.H.G.; writing—original draft preparation, V.T.L., R.A.N., V.T.R., T.F.A.d.A. and J.V.P.; visualization, R.A.N.; supervision, B.F.G. and A.H.G.; project administration, A.H.G. All authors have read and agreed to the published version of the manuscript.

Funding

This research received no external funding.

Institutional Review Board Statement

Not applicable.

Informed Consent Statement

Not applicable.

Data Availability Statement

The data presented in this study are available in the supplementary material.

Acknowledgments

We are grateful to Coordenação de Aperfeiçoamento de Pessoal de Nível Superior (CAPES) and the Universidade de São Paulo for all OF the support.

Conflicts of Interest

The authors declare no conflict of interest.

References

  1. Matte Júnior, A.A.; Jung, C.F. Produção Leiteira No Brasil e Características Da Bovinocultura Leiteira No Rio Grande Do Sul. Ágora 2017, 19, 34. [Google Scholar] [CrossRef] [Green Version]
  2. MAPA MAPA DO LEITE: Políticas Públicas e Privadas Para o Leite. Available online: https://www.gov.br/agricultura/pt-br/assuntos/producao-animal/mapa-do-leite (accessed on 7 December 2022).
  3. IBGE Número de Estabelecimentos Agropecuários, Quantidade Produzida e Valor Da Produção de Leite Por Agricultura Familiar e Não Familiar e Tipo de Leite. Available online: https://sidra.ibge.gov.br/tabela/1227 (accessed on 7 December 2022).
  4. Primavesi, O.; Berndt, A.; Lima, M.A.; Frighetto, R.T.S.; de Demarchi, J.J.A.A.; dos Pedreira, M.S. Greenhouse Gas Production in Agricultural Systems: Groundwork for an Inventory of Methane Emissions by Ruminants. In Carbon Stocks and Greenhouse Gas Emissions in Brazilian Agriculture; Lima, M.A., Boddey, R.M., Alves, B.J.R., Machado, P.L.O.A., Urquiaga, S., Eds.; Embrapa: Jaguariúna, Brasil, 2015; p. 347. [Google Scholar]
  5. IBGE Censo Agropecuário 2017. Available online: https://sidra.ibge.gov.br/tabela/6930 (accessed on 4 November 2019).
  6. USDA. Milk Production. 2018. Available online: https://downloads.usda.library.cornell.edu/usda-esmis/files/h989r321c/m326m310t/np193b59n/MilkProd-01-24-2018.pdf (accessed on 25 October 2022).
  7. Clay, N.; Garnett, T.; Lorimer, J. Dairy Intensification: Drivers, Impacts and Alternatives. Ambio 2020, 49, 35–48. [Google Scholar] [CrossRef] [PubMed] [Green Version]
  8. Powell, J.M.; Pearson, R.A.; Hiernaux, P.H. Crop-Livestock Interactions in the West African Drylands. Agron. J. 2004, 96, 469–483. [Google Scholar] [CrossRef]
  9. McIntire, J.; Bourzat, D.; Pingali, P. Crop-Livestock Interaction in Sub-Saharan Africa; Word Bank: Washington, DC, USA, 1992. [Google Scholar]
  10. Williams, T.O.; Hiernaux, P.; Fernández-Rivera, S. Crop-Livestock Systems in Sub-Saharan Africa: Determinants and Intensification Pathways. In Property Rights, Risk, and Livestock Development in Africa. International symposium on Property Rights, Risk and Livestock Development, Feldafing, Germany; McCarthy, N., Swallow, B., Kirk, M., Hazell, P., Eds.; International Food Policy Research Institute (IFPRI): Washington, DC, USA, 1999; pp. 132–151. ISBN 9780896293397. [Google Scholar]
  11. Ma, W.; Bicknell, K.; Renwick, A. Production Intensification and Animal Health Expenditure on Dairy Farms in New Zealand. J. Dairy Sci. 2020, 103, 1598–1607. [Google Scholar] [CrossRef] [PubMed]
  12. Agostinho, F.; Oliveira, M.W.; Pulselli, F.M.; Almeida, C.M.V.B.; Giannetti, B.F. Emergy Accounting as a Support for a Strategic Planning towards a Regional Sustainable Milk Production. Agric. Syst. 2019, 176, 102647. [Google Scholar] [CrossRef]
  13. Billen, G.; Aguilera, E.; Einarsson, R.; Garnier, J.; Gingrich, S.; Grizzetti, B.; Lassaletta, L.; Le Noë, J.; Sanz-Cobena, A. Reshaping the European Agro-Food System and Closing Its Nitrogen Cycle: The Potential of Combining Dietary Change, Agroecology, and Circularity. One Earth 2021, 4, 839–850. [Google Scholar] [CrossRef]
  14. Ghisellini, P.; Protano, G.; Viglia, S.; Gaworski, M.; Setti, M.; Ulgiati, S. Integrated Agricultural and Dairy Production within a Circular Economy Framework. A Comparison of Italian and Polish Farming Systems. J. Environ. Account. Manag. 2014, 2, 367–384. [Google Scholar] [CrossRef]
  15. Oliveira, M.; Zucaro, A.; Santagata, R.; Ulgiati, S. Environmental Assessment of Milk Production from Local to Regional Scales. Ecol. Modell. 2022, 463, 109795. [Google Scholar] [CrossRef]
  16. Alqaisi, O.; Hemme, T.; Latacz-Lohmann, U.; Susenbeth, A. Evaluation of Food Industry By-Products as Feed in Semi-Arid Dairy Farming Systems: The Case of Jordan. Sust. Sci. J. 2014, 9, 361–377. [Google Scholar] [CrossRef]
  17. Wolf, C.A. Understanding the Milk-to-Feed Price Ratio as a Proxy for Dairy Farm Profitability. J. Dairy Sci. 2010, 93, 4942–4948. [Google Scholar] [CrossRef]
  18. Robinson, J.; Tinker, J. Reconciling Ecological, Economic and Social Imperatives: A New Conceptual Framework. In Surving Globalism: The Social and Environmental Challanges; Schrecker, T., Ed.; MacMillan Press Ltd.: London, UK, 1997; pp. 71–94. ISBN 978-1-349-25650-1. [Google Scholar]
  19. Wackernagel, M.; Hanscom, L.; Lin, D. Making the Sustainable Development Goals Consistent with Sustainability. Front. Energy Res. 2017, 5, 1–5. [Google Scholar] [CrossRef] [Green Version]
  20. Gigliotti, M.; Niccolucci, V.; Marchi, M.; Gagliardi, F.; Pulselli, F.M. Relationship between the Sustainable Development Goals Framework and Emergy Evaluation for an Environmental Assessment of the 2030 Agenda. WIT Trans. Ecol. Environ. 2018, 217, 87–92. [Google Scholar] [CrossRef] [Green Version]
  21. Castellini, C.; Boggia, A.; Cortina, C.; Dal Bosco, A.; Paolotti, L.; Novelli, E.; Mugnai, C.; Bosco, A.D.; Paolotti, L.; Novelli, E.; et al. A Multicriteria Approach for Measuring the Sustainability of Different Poultry Production Systems. J. Clean. Prod. 2012, 37, 192–201. [Google Scholar] [CrossRef]
  22. ONU Sustainable Development Goals/United Nations Development Programme. Available online: https://www.undp.org/sustainable-development-goals (accessed on 5 January 2022).
  23. Chen, W.; Holden, N.M. Bridging Environmental and Financial Cost of Dairy Production: A Case Study of Irish Agricultural Policy. Sci. Total Environ. 2018, 615, 597–607. [Google Scholar] [CrossRef]
  24. Ramesh, B.; Ross, C.; Colombo, S. Estimating Values of Environmental Impacts of Dairy Farming in New Zealand. N. Z. J. Agric. Res. 2009, 52, 377–389. [Google Scholar] [CrossRef] [Green Version]
  25. Vigne, M.; Peyraud, J.-L.; Lecomte, P.; Corson, M.S.; Wilfart, A. Emergy Evaluation of Contrasting Dairy Systems at Multiple Levels. J. Environ. Manag. 2013, 129, 44–53. [Google Scholar] [CrossRef]
  26. Decree No 3.991, 30 October 2001. Assembleia da República: Brasilia, Brasil, 2001. Available online: http://www.planalto.gov.br/ccivil_03/decreto/2001/d3991.htm#:~:text=DECRETO%20N%C2%BA%203.991%2C%20DE%2030,que%20lhe%20confere%20o%20art (accessed on 25 January 2023).
  27. Odum, H.T. Environmental Accounting: Emergy and Environmental Decision Making; Wiley: Gainesville, FL, USA, 1996; ISBN 0471114421. [Google Scholar]
  28. Odum, H.T. Systems Ecology: An Introduction; John Wiley and Sons Inc.: New York, NY, USA, 1983. [Google Scholar]
  29. Ulgiati, S.; Brown, M.T. Quantifying the Environmental Support for Dilution and Abatement of Process Emissions: The Case of Electricity Production. J. Clean. Prod. 2002, 10, 335–348. [Google Scholar] [CrossRef]
  30. Ulgiati, S.; Brown, M.T. Monitoring Patterns of Sustainability in Natural and Man-Made Ecosystems. Ecol. Modell. 1998, 108, 23–36. [Google Scholar] [CrossRef]
  31. Brown, M.T.; Ulgiati, S. Emergy Analysis and Environmental Accounting. Encycl. Energy 2004, 2, 329–354. [Google Scholar] [CrossRef]
  32. Brown, M.T.; Campbell, D.E.; De Vilbiss, C.; Ulgiati, S. The Geobiosphere Emergy Baseline: A Synthesis. Ecol. Modell. 2016, 339, 92–95. [Google Scholar] [CrossRef]
  33. CEPEA/USP Price Paid to the Producer (R$/L). Available online: https://www.cepea.esalq.usp.br/br/indicador/leite.aspx (accessed on 20 August 2022).
  34. Williams, C.B.; Oltenacu, P.A.; Bratton, C.A.; Milligan, R.A. Effect of Business and Dairy Herd Management Practices on the Variable Cost of Producing Milk. J. Dairy Sci. 1987, 70, 1701–1709. [Google Scholar] [CrossRef]
  35. Assis, A.G.; Stock, L.A.; Campos, O.F.; Gomes, S.T.; Zoccal, R.; Silva, M.R. Sistemas de Produção de Leite No Brasil; Embrapa Gado de Leite: Juiz de Fora, Brasil, 2005; Volume 1996. [Google Scholar]
  36. BNDES. Produção Leiteira No Brasil, Banco Nacional de Desenvolvimento Econômico e Social: Brasilia, Brasil, 2018; Volume 37.
  37. Mendonça, B.S.; Bánkuti, F.I.; Pozza, M.S.D.S.; Perez, H.L.; Siqueira, T.T. A Typology of Corporate and Family Dairy Farms in Eastern Goiás, Brazil. Cienc. Rural 2020, 50, 1–10. [Google Scholar] [CrossRef]
  38. IBGE Produção Pecuária Municipal. Available online: http://www.ibge.gov.br/home/estatistica/pesquisas/pesquisa_resultados.php?id_pesquisa=21 (accessed on 13 August 2022).
  39. NRC. Nutrient Requirements of Dairy Cattle, 7th ed.; National Academy Press: Washington, DC, USA, 2001. [Google Scholar]
  40. Santos, A.R.M.; Cabral, C.H.A.; Cabral, C.E.A.; de Barros, L.V.; Pires, D.F.; Rosa, A.D.S.; Alves, G.R.; Coutinho, M.P.S. Energy Supplementation as Strategy of Pasture Management. Acta Sci. Anim. Sci. 2022, 44, 1–10. [Google Scholar] [CrossRef]
  41. Hu, E.; Zou, L.; Langston, C. A New Interlink Decision Making Index for Making Multi-Criteria Decisions. Aust. J. Constr. Econ. Build. 2004, 4, 33–42. [Google Scholar] [CrossRef] [Green Version]
  42. Giannetti, B.F.; Marcilio, M.D.F.D.F.B.F.B.; Coscieme, L.; Agostinho, F.; Liu, G.; Almeida, C.M.V.B.V.B. Howard Odum’s “Self-Organization, Transformity and Information”: Three Decades of Empirical Evidence. Ecol. Modell. 2019, 407, 108717. [Google Scholar] [CrossRef]
  43. Buenfil, A.A. Sustainable Use of Potable Water in Florida: An Emergy Analysis of Water Supply and Treatment Alternatives. In Proceedings of the First Biennial Emergy Analysis Research Conference, Gainesville, FL, USA, 22–24 January 2000; pp. 107–118. [Google Scholar]
  44. Odum, H.T.; Brown, M.T.; Brandt-Williams, S.L. Handbook of Emergy Evaluation. Folio #1. Introduction and Global Budget; Center for Environmental Policy, Environmental Engineering Sciences, University of Florida: Gainesville, FL, USA, 2000. [Google Scholar]
  45. Brandt-Williams, S.L. Handbook of Emergy Evaluation: A Compendium of Data for Emergy Computation Issued in a Series of Folios, Folio#4; University of Florida: Gainesville, FL, USA, 2001; Voluem 4. [Google Scholar]
  46. Mendes, E.E.B.; Arcaro, I.J.; Ambrosio, L.A. Sustainability of Milk and Orange Production Systems, Part I: Emergy Analysis in the Annual Cycles of Production. In Proceedings of the 8th Biennial Emergy Conference, Gainesville, FL, USA, 16–18 January 2014. [Google Scholar]
  47. Cavalett, O.; Ortega, E. Emergy, Nutrients Balance, and Economic Assessment of Soybean Production and Industrialization in Brazil. J. Clean. Prod. 2009, 17, 762–771. [Google Scholar] [CrossRef]
  48. Castellini, C.; Bastianoni, S.; Granai, C.; Bosco, A.D.; Brunetti, M. Sustainability of Poultry Production Using the Emergy Approach: Comparison of Conventional and Organic Rearing Systems. Agric. Ecosyst. Environ. 2006, 114, 343–350. [Google Scholar] [CrossRef] [Green Version]
  49. Santagata, R.; Ripa, M.; Viglia, S.; Ulgiati, S. Emergy Accounting Evaluation of Power Generation from Animal By-Products. In Proceedings of the 9th Biennial Emergy Conference, Gainesville, FL, USA, 6–9 January 2017. [Google Scholar]
  50. Bargigli, S.; Ulgiati, S. Emergy and Life-Cycle Assessment of Steel Production. In Proceedings of the 2nd Biennial Emergy Conference, Gainesville, FL, USA, 20–22 January 2003. [Google Scholar]
  51. Oliveira, M.W. Assessing the Sustainability of Milk Production in Southern Minas Gerais: Subsidies for Regional Strategic Planning; Paulista University: São Paulo, Brasil, 2017. [Google Scholar]
  52. Demetrio, F.J.C. Brazil’s Environmental Sustainability Assessment with Emergy Accounting; Paulista University: São Paulo, Brasil, 2011. [Google Scholar]
  53. Buranakarn, V. Evaluation of Recycling and Reuse of Building Materials Using the Emergy Analysis Method; University of Florida: Gainesville, FL, USA, 1998. [Google Scholar]
  54. Nacimento, R.A.; Rojas Moreno, D.A.; Luiz, V.T.; Avelar de Almeida, T.F.; Rezende, V.T.; Bazerla Andreta, J.M.; Ifuki Mendes, C.M.; Giannetti, B.F.; Gameiro, A.H. Sustainability Assessment of Commercial Brazilian Organic and Conventional Broiler Production Systems under an Emergy Analysis Perspective. J. Clean. Prod. 2022, 359, 132050. [Google Scholar] [CrossRef]
  55. Brown, M.T.; Ulgiati, S. Emergy Evaluations and Environmental Loading of Electricity Production Systems. J. Clean. Prod. 2002, 10, 321–334. [Google Scholar] [CrossRef]
  56. Giannetti, B.F.; Faria, L.; Almeida, C.M.V.B.; Agostinho, F.; Coscieme, L.; Liu, G. Human-Nature Nexuses in Brazil: Monitoring Production of Economic and Ecosystem Services in Historical Series. Ecosyst. Serv. 2018, 30, 248–256. [Google Scholar] [CrossRef]
  57. Jaklič, T.; Juvančič, L.; Kavčič, S.; Debeljak, M. Complementarity of Socio-Economic and Emergy Evaluation of Agricultural Production Systems: The Case of Slovenian Dairy Sector. Ecol. Econ. 2014, 107, 469–481. [Google Scholar] [CrossRef]
  58. Kocjančič, T.; Debeljak, M.; Žgajnar, J.; Juvančič, L. Incorporation of Emergy into Multiple-Criteria Decision Analysis for Sustainable and Resilient Structure of Dairy Farms in Slovenia. Agric. Syst. 2018, 164, 71–83. [Google Scholar] [CrossRef]
  59. Giannetti, B.F.; Almeida, C.M.V.B.; Agostinho, F.; Bonilla, S.H.; Ulgiati, S. Primary Evidences on the Robustness of Environmental Accounting Based on Emergy. J. Environ. Account. Manag. 2013, 1, 203–212. [Google Scholar] [CrossRef]
  60. Garnett, T.; Appleby, M.C.; Balmford, A.; Bateman, I.J.; Benton, T.G.; Bloomer, P.; Burlingame, B.; Dawkins, M.; Dolan, L.; Fraser, D.; et al. Sustainable Intensification in Agriculture: Premises and Policies. Science 2013, 341, 33–34. [Google Scholar] [CrossRef]
  61. Tacnet, J.M.; Forestier, E.; Mermet, E.; Curt, C.; Berger, F. Territorial Resilience: From Concept to Mountain Critical Infrastructures Analysis. Houille Blanche 2018, 2018, 20–28. [Google Scholar] [CrossRef]
  62. Rahman, M.T.; Islam, M.S.; Shehata, A.A.; Basiouni, S.; Hafez, H.M.; Azhar, E.I.; Khafaga, A.F.; Bovera, F.; Attia, Y.A. Influence of COVID-19 on the Sustainability of Livestock Performance and Welfare on a Global Scale. Trop. Anim. Health Prod. 2022, 54, 309. [Google Scholar] [CrossRef]
  63. Hashem, N.M.; Hassanein, E.M.; Hocquette, J.F.; Gonzalez-Bulnes, A.; Ahmed, F.A.; Attia, Y.A.; Asiry, K.A. Agro-Livestock Farming System Sustainability during the COVID-19 Era: A Cross-Sectional Study on the Role of Information and Communication Technologies. Sustainability 2021, 13, 6521. [Google Scholar] [CrossRef]
  64. Brown, M.T.; Ulgiati, S. Energy Quality, Emergy, and Transformity: H.T. Odum’s Contributions to Quantifying and Understanding Systems. Ecol. Modell. 2004, 178, 201–213. [Google Scholar] [CrossRef]
  65. Erickson, P.S.; Kalscheur, K.F. Nutrition and Feeding of Dairy Cattle. In Animal Agriculture: Sustainability, Challenges and Innovations; Bazer, F.W., Lamb, G.C., Wu, G., Eds.; Academic Press Ltd.: College Station, TX, USA, 2019; pp. 157–180. ISBN 9780128170526. [Google Scholar]
  66. Danes, M.A.C.; Chagas, L.J.; Pedroso, A.M.; Santos, F.A.P. Effect of Protein Supplementation on Milk Production and Metabolism of Dairy Cows Grazing Tropical Grass. J. Dairy Sci. 2013, 96, 407–419. [Google Scholar] [CrossRef]
  67. Kennedy, J.; Dillon, P.; Delaby, L.; Faverdin, P.; Stakelum, G.; Rath, M. Effect of Genetic Merit and Concentrate Supplementation on Grass Intake and Milk Production with Holstein Friesian Dairy Cows. J. Dairy Sci. 2003, 86, 610–621. [Google Scholar] [CrossRef] [Green Version]
  68. Lowrance, R.; Hendrix, P.F.; Odum, E.P. A Hierarchical Approach to Sustainable Agriculture. Am. J. Altern. Agric. 1986, 1, 169–173. [Google Scholar] [CrossRef]
  69. Lynam, J.K.; Herdt, R.W. Sense and Sustainability: Sustainability as an Objective in International Agricultural Research. Agric. Econ. 1989, 3, 381–398. [Google Scholar] [CrossRef]
  70. Hansen, J.W.; Jones, J.W. A Systems Framework for Characterizing Farm Sustainability. Agric. Syst. 1996, 51, 185–201. [Google Scholar] [CrossRef]
  71. Yazdani, M.; Gonzalez, E.D.R.S.; Chatterjee, P. A Multi-Criteria Decision-Making Framework for Agriculture Supply Chain Risk Management under a Circular Economy Context. Manag. Decis. 2019, 59, 1801–1826. [Google Scholar] [CrossRef]
  72. Act No 12.188, January 11, 2010; Assembleia da República: Brasilia, Brasil, 2010.
  73. Act No 14.119, January 13, 2021; Assembleia da República: Brasilia, Brasil, 2021.
  74. Decree No 11.075, May 19, 2022; Assembleia da República: Brasilia, Brasil, 2022.
  75. Odum, H.T.; Odum, E.C. A Prosperous Way Down: Principles and Policies; University Press of Colorado: Denver, CO, USA, 2001; ISBN 978-0870819087. [Google Scholar]
  76. CQBAL 4.0. 2021. Tabelas Brasileiras de Composição de Alimentos para Ruminantes. Available online: https://www.cqbal.com.br/ (accessed on 8 August 2022).
  77. Santos, F.G.; Chaves, M.A.; Silva, W.R.; Soares, R.D.; Franco, I.L.; Pinho, B.D. Índice climático de crescimento para os capins Brachiaria brizantha cv. Marandu, Cynodon dactylon cv. Tifton 85 e Panicum maximum. Ciênc. Anim. Bras. 2008, 9, 627–637. [Google Scholar]
  78. Sousa, B.M.; Saturnino, H.M.; Borges, A.L.C.C.; Lopes, F.C.F.; Silva, S.; Campos, M.M.; Pimenta, M.; Campos, W.E. Estimativa de consumo de matéria seca e de fibra em detergente neutro por vacas leiteiras sob pastejo, suplementadas com diferentes quantidades de alimento concentrado. Arq. Bras. Med. Vet. 2008, 60, 890–895. [Google Scholar] [CrossRef]
  79. Brown, M.T.; Bardi, E. Handbook of Emergy Evaluation: A Compendium of Data for Emergy Computation Issued in a Series of Folios, Folio#3—Emergy of Ecosystems; University of Florida: Gainesville, FL, USA, 2001. [Google Scholar]
  80. Rótolo, G.C.; Francis, C.; Craviotto, R.M.; Ulgiati, S. Environmental Assessment of Maize Production Alternatives: Traditional, Intensive and GMO-Based Cropping Patterns. Ecol. Indic. 2015, 57, 48–60. [Google Scholar] [CrossRef]
  81. Brown, M.T.; Ulgiati, S. Assessing the global environmental sources driving the geobiosphere: A revised emergy baseline. Ecol. Modell. 2016, 339, 126–132. [Google Scholar] [CrossRef] [Green Version]
Figure 1. Farm location (Analândia, São Paulo, Brazil) and description of areas involved in the dairy production: livestock grazing area (in light green); (1), cassava (in orange); (2), corn crop (and silage production; in purple); (3) and sugar cane crop (light blue); (4). Both the corn and cassava crops were used for silage production. Note: The circular images at the bottom of the figure represent the dairy livestock, the cassava crop, the corn silage production, and the sugar cane crop, from left to the right.
Sustainability 15 04674 g001
Figure 2. Aggregated emergy diagram demonstrating the studied dairy production system (PROP) and emergy indicators applied for a sustainability pathways assessment. The image was drawn according to emergy symbol language proposed by Odum [27]. The R corresponds to local renewable resources; N corresponds to local non-renewable resources; F corresponds to economic resources being divided in renewable (FR) and non-renewable fraction (FN). The dairy system was divided into four subsystems: (i) corn crop for silage (3.0 ha); (ii) sugar cane for silage (2.7 ha); (iii) cassava crop for silage (2.8 ha); and (iv) pasture for livestock grazing (20.5 ha; including building and equipment). The local environmental inputs (R + N) considered are sun, rain, evapotranspiration, wind, soil losses, and groundwater. Economic inputs F (i.e., energetics, equipment, labour, and services) considered are chemical fertilization management, silage production, concentrated feed ingredients, etc. The outputs considered are the produced milk and beef from animals for disposal. The waste was considered as a pasture fertilizer. The temporal boundary was considered to be one year (2020).
Sustainability 15 04674 g002
Figure 3. Aggregated emergy diagram demonstrating the proposed scenarios. From the feed program exchanging of PROP, the scenarios were simulated as if the original system was converted for intensive (INT), semi-intensive (SIS), or extensive (EXT) dairy systems. Regarding the feed ingredients, the (i) blue arrows and lines correspond to the INT scenario in which all feed ingredients come exclusively from economic inputs and the (ii) red arrows and lines correspond to the corn silage for the SIS scenario used in dry season. For SIS, the feed ingredients were composed of corn silage produced within the studied system and grazing pasture; and the (iii) green arrows and lines correspond to the EXT scenario in which the feed ingredients are composed only of pasture grazing and produced within the studied system. The image was drawn according to the emergy symbol language proposed by Odum [27]. For corn silage production, the economic inputs F considered chemical fertilization management in the silage manufacturing process. The economic inputs directly participating in the dairy production were energy, equipment, labour, and services, with a concentration on feed ingredients. The outputs considered are the produced milk and beef from animals for disposal. The waste was considered to be a pasture fertilizer. The temporal boundary was considered to be one year (2020).
Sustainability 15 04674 g003
Figure 5. ESI × global productivity chart (energy produced in J/sej). A rising arrow means good performance. Descending arrow indicates the direction of poor performance. The size of the circumference of the points indicates the profitability (USD/litremilk). The larger the girth, the greater the profitability. PROP represents the studied dairy system. Using the feed program exchanging of PROP, the results were simulated as if the original system was converted for intensive (INT), semi-intensive (SIS), or extensive (EXT) dairy systems. To make decisions clearer and prone to human interference, the IDMI index was implemented. It was considered without critical criteria (CC), as profitability as CC and ESI as CC in were used in different scenarios. ** GP is global productivity obtained from the inverse of transformity (GP=1/Tr). Note: where INT is the intensive dairy system scenario, the feed program was based on corn silage and protein concentrated feed ingredients for the whole year (365 days). SIS is the semi-intensive dairy system scenario where the feed program was provided according to the climate season features. In the dry season (from April to October), the feed program was based on concentrated feed ingredient intake and corn silage (180 days); in the rainy season (from November to May), the feed program was based on concentrated feed ingredient intake and pasture grazing (Urochloa brizantha; 180 days). EXT is the extensive dairy system scenario where the feed program was based on pasture grazing (Urochloa brizantha) and protein concentrated feed ingredients during the whole year (365 days). The IDMI make sense only when comparing two or more options using the same criteria (with the same CC) [41]; IDMIn is the Interlink Decision Making Index without critical criteria (CC); IDMIP is the Interlink Decision Making Index with profitability as CC; and IDMIESI is the Interlink Decision Making Index with the Emergy Sustainability Index as CC. * GP is the global productivity (×10−7); ESI is the emergy sustainability index; the higher the square area, the more efficient and sustainable the scenario is. The higher the circumference point size, the more profitable the system is (USD/litremilk). For the INT scenario, profitability = 0.17 USD/ litremilk; for the SIS scenario, profitability = 0.18 USD/ litremilk; for the EXT scenario, profitability = 0.09 USD/ litremilk; for the PROP, profitability = 0.11 USD/ litremilk. ** GP = 1/Tr; The index standardization was defined by dividing the index by the reference values for each indicator; The reference values were selected according to Agostinho et al. [12]. The profitability from G2 was assumed to be the same value obtained in this study (SIS).
Sustainability 15 04674 g005
Table 1. Zootechnical indicators of milk production system.
Zootechnical IndicatorsValue
Pregnancy rate, %70
Birth weight, kg 30
Calves weaning age, days90
Weaning weight, kg 120
Pre-weaning mortality, %6
Age for livestock interval replacement, month13
Lactation, days210
Average milk production, litresmilk/cow.day15
Production per area, litresmilk/ha.yr6331
Table 2. Description of emergy indicators.
IndicatorsEquationOverviewScope
Solar Transformity (Tr)Y/EpRatio between total emergy (Y) and good or serviceable energy (Ep).The higher the Tr values, the lower efficiency on using energy to affect a product or process.
Renewability (%R)R/(R+N+F)The ratio of renewable emergy to total emergy use. In the long run, only processes with high %R are sustainable.
Global Productivity (GP)1/TrEfficiency measure considering the inverse of the transformityHigher GP values indicate higher efficiency on using energy when compared to lower GP values. Commonly used for graphical tools.
Emergy Yield Ratio (EYR)Y/FRatio between total emergy (Y) and non-renewable inputs from economy. EYR < 5 indicates secondary energy sources, EYR < 2 indicate a products’consumption or transformation processes. Indices close to 1 indicate processes that do not promote a meaningful net emergy production and only transform resources that are made available from previous processes.
Environmental Load Ratio (ELR)(N + FN)/(R + FR)Ratio between input emergy flows and the renewable and non-renewable inputs ELR~2 suggests low environmental impact. ELR > 10 indicates environmental impact relatively concentrated; and 3 < ELR < 10 indicate moderate environmental impact.
Emergy Sustainability Index (ESI) EYR/ELRRatio between net emergy and environmental load ratio of the system. ESI < 1 indicates products or processes that do not possess long-term sustainability; 1 < ESI < 5 indicates medium-term sustainability; higher values indicate products and processes with longer sustainability.
Y is the total incorporated emergy; Ep is the energy of good or service; F is the emergy purchased from economy; FN is the non-renewable fraction from F; FR is the renewable fraction from F; R is the environmental renewable resources; N is the environmental non-renewable resources; and I is the local environmental inputs. Source: adapted from Odum [27]; Ulgiati and Brown [29,30]; and Brown and Ulgiati [31].
Table 3. Feed program composition based on dry matter (% in DM) for each scenario.
Feed Ingredients Scenarios
Dry seasonRainy season
PROPINTSISSISEXT
Corn meal, % DM16.011.511.515.215.0
Soybean meal, % DM511111212
Urea, % 1.00.70.71.01.0
Vitamin supplement, %0.01.51.51.51.5
Salt, %-0.30.30.30.3
Pasture, % DM 53.0--70.170.1
Corn silage, % DM *147575--
Cassava silage, % DM **14----
Sugar cane silage, % DM 21----
Total100100100100100
The feed intake in the original system (PROP) was divided as ‡ pasture: from November to March; * corn silage: from April to May; ** cassava silage: from June to July; † sugarcane silage: from August to October. INT is the intensive dairy system scenario where the feed program is based on corn silage and protein concentrated feed ingredients in the whole year (365 days). SIS is the semi-intensive dairy system scenario where the feed program is provided according to the climate season features. In the dry season (from April to October), the feed program is based on concentrated feed ingredient intake and corn silage (180 days); in the rainy season (from November to May), the feed program is based on concentrated feed ingredient intake and pasture grazing (Urochloa brizantha; 180 days). EXT is the extensive dairy production system scenario where the feed program is based on pasture grazing (Urochloa brizantha) and protein concentrated feed ingredients during the whole year (365 days).
Table 4. Emergy table for the studied dairy production system (PROP).
Emergy PerEmergy
Annual FlowUnit(E+13)Em$Dollar
NoteItemClass 1Unit(un/yr)(sej/un)(sej/yr)(sej/USD.yr)Reference
1.Sun 2RJ3.56 × 10810.000.00By definition
2.Rain, geopotential 2RJ9.48 × 10111.30 × 1041232.6520,273.87a
3.Rain, chemical potentialRJ1.42 × 10129.71 × 1031381.0422,714.53a
4.Evapotranspiration 2RJ1.77 × 10121.05 × 10218.59305.79a
5.Wind, kinetic energy 2RJ4.01 × 10111.16 × 1024.6676.59a
6.Groundwater recharges 2RJ5.93 × 10111.86 × 103110.231812.95b
7.Soil lossesNJ4.31 × 1091.30 × 10556.08922.44a
8.GroundwaterNJ7.42 × 1082.27 × 10516.86227.31c
Sum of the free inputs (wdc) 1453.9922,715.84
9.Fuel (gasoline)FJ6.59 × 10101.11 × 105730.1912,009.72a
10.Fuel (sugar cane bioethanol)FJ3.44 × 10101.59 × 105546.308985.25a
11.Electricity68%RJ4.23 × 10106.45 × 104272.634483.98a
12.Pesticides and vaccinesFg2.55 × 1051.88 × 1010478.937877.16d
13.Liquid nitrogenFg1.13 × 1051.48 × 1010167.242750.66e
14.Feed
14.1.Corn, meal22% RJ5.28 × 10115.10 × 1042693.2744,297.24a
14.2.Soybean, meal33% RJ7.76 × 10101.46 × 1051131.8018,615.18f
14.3.Vitamin-mineral supplementFg6.21 × 1051.12 × 1010697.9411,479.25g
14.4.UreaFJ1.74 × 10066.12 × 1091063.2917,488.30h
14.5.Corn, silage46% RJ4.82 × 10125.26 × 10425,312.78416,328.65**
14.6.Sugar cane, silage18% RJ6.69 × 10111.04 × 1056961.28114,494.71**
14.7.Cassava, silage73% RJ5.15 × 10111.21 × 1056236.47102,573.58**
14.8.Pasture85% RJ4.25 × 10117.82 × 1043323.2254,658.15**
15.Mechanical equipmentFg6.78 × 1041.82 × 10912.36203.32i
16.Stainless steel (cooling tank)Fg1.36 × 1058.68 × 10101183.6419,467.70j
17.Labor
17.1.Outsourced services (veterinarians, mechanics)22% RJ4.29 × 1083.12 × 1041.3422.03k
17.2.Owner manpower22% RJ2.53 × 1093.12 × 1047.88129.69k
17.3.Registered manpower 22% RJ1.19 × 1093.12 × 1043.7161.09k
18.BuildingsFg5.93 × 1033.84 × 1092.2837.43l
19.Services (USD per ha)
19.1.Nutrition22% R$2.26 × 1046.08 × 10111373.3622,588.24m
19.2.Animal health and cleaning22% R$1.05 × 1036.08 × 101164.011052.75
19.3.Fuel22% R$8.49 × 1026.08 × 101151.59848.58
19.4.Electricity22% R$1.10 × 1036.08 × 101167.091103.42
19.5.Labor22% R$1.53 × 1046.08 × 1011931.7315,324.48
19.6.External labor22% R$1.49 × 1036.08 × 101190.851494.31
19.7.Depreciation22% R$2.95 × 1036.08 × 1011179.382950.28
Milk energy J5.30 × 1011 55,038.56829,925.31
Beef (animals for disposal) J2.61 × 1010 55,038.56829,925.31
w/servicesw/o services
Y sej/yr5.50 × 10175.23 × 1017
Tr
Milk sej/J1.04 × 1069.86 × 105
Beef (animals for disposal) sej/J2.11 × 1072.00 × 107
** UEV’s estimated in this study (See Supplementary Material S2). 1 R: local renewable resources; N: local non-renewable resources; F: external economic resources; 2 Inputs that were not accounted for to avoid double accounting. a Giannetti et al. [42]; b Buenfil [43]; c Odum [44]; d Brandt-Williams [45]; e Mendes et al. [46]; f Cavalett and Ortega [47]; g Castellini et al. [48]; h Santagata et al. [49]; i Bargigli and Ulgiati [50]; j Oliveira [51]; k Demetrio [52]; l Buranakarn [53]; m Nacimento et al. [54]. Renewable fraction: electricity [55]; corn and soybean, meal [48]; labour and services [56].
Table 5. Yearly basis emergy flows and indexes overview for the studied dairy system compared to other systems from the scientific literature.
PROPG2SMRIPCBR
Y, sej/ha.yr18.9825.0571.72596.45122.31108.25
UEV, × 1012 sej/litremilk3.143.623.644.062.211.52
Emergy indexes
%R 43%18%44%21%21%24%
EYR 1.751.171.891.341.131.35
ELR 1.344.621.253.864.393.25
ESI 1.300.251.510.350.260.42
Y is the total incorporated emergy; UEV is the unit emergy value; %R is renewability; EYR is the emergy yield ratio; ELR is the emergy load ratio; ESI is the emergy sustainability index. PROP is a Brazilian smallholder and semi-intensive dairy system located at São Paulo state; the G2 is the semi-intensive dairy system adopted from Agostinho et al. [12]; SM is a traditional dairy system in western African Savannah (South Mali) with a low intensification of production [25]; RI is a dairy system located in the Reunion Island (French territory at Indian Ocean), characterized by high stocking density rate and high feed concentrate supplementation and mineral fertilizer [25]; PC is a dairy system located in Poitou-Charentes (western France) characterized by large farms with large dairy livestock, high milk production, and high feed concentrates input [25]; BR is a dairy system in Bretagne (western France) characterized by smaller specialized dairy farms and fewer animals, with relatively high milk production with low feed concentrate distribution and high grassland biomass production [25].
Table 6. Emergy indexes overview for the studied dairy system and the proposed scenarios. Emergy indexes standardization and Interlink Decision Making Index (IDMI) approach for each dairy production scenario.
G2PROPINTSISEXT
Tr (sej/J ha.yr)1.45 × 1061.04 × 1065.05 × 1053.97 × 1055.88 × 105
GP * (× 10−7 J/sej ha.yr)6.919.6319.8125.2017.01
ESI 0.251.300.560.910.66
Profitability0.180.110.180.180.09
Emergy indexes standardization
GP1.001.392.873.652.46
ESI 1.005.132.203.562.60
Profitability1.000.621.001.000.52
IDMI w/o CC 3.007.146.068.215.59
IDMI w/Profitability as CC1.002.012.523.611.32
IDMI w/ESI as CC1.005.154.258.283.88
Disclaimer/Publisher’s Note: The statements, opinions and data contained in all publications are solely those of the individual author(s) and contributor(s) and not of MDPI and/or the editor(s). MDPI and/or the editor(s) disclaim responsibility for any injury to people or property resulting from any ideas, methods, instructions or products referred to in the content.

