1. Introduction
The Yellow River Basin is a significant population and economic agglomeration in China, spanning nine provinces: Qinghai, Sichuan, Gansu, Ningxia, Inner Mongolia, Shaanxi, Shanxi, Henan and Shandong, with 30.3% of the country’s population and 26.5% of the country’s GDP within the basin. Compared to the other urban agglomerations, such as Beijing–Tianjin–Hebei and the Yangtze River Delta, the development of the Yellow River Basin is relatively lagging, and the differences in the urban development between the different regions are outstanding [
1,
2,
3]. In September 2019, at a symposium on the ecological protection and high-quality development of the Yellow River Basin, President Xi Jinping proposed a strategy for the ecological protection and high-quality development of the region. The introduction of this strategy pushed the basin’s development into the fast lane. There is currently no reasonable industrial structure to support the quality development in the basin. A high-quality industrial co-agglomeration is an important driving force for regional economic growth because it is directly related to the transformation of the development modes, the optimization of the economic structures, the conversion of the growth momentum and the other significant realities of economic development [
4]. Apart from attracting technology and resources, industrial agglomeration can also promote knowledge and technology spillover between enterprises, promoting the formation of economies of a larger scale. At the same time, it can produce radiation effects on neighboring regions, promote the economic growth of the surrounding cities and help promote the region’s coordinated development. It is of great practical significance to study the impact of the industrial agglomeration on the economic growth and spillover effects in the Yellow River Basin to solve the problems of the relatively lagging economic development and significant regional differences in the basin.
From the perspective of the agglomeration type, the “two-wheel” driving mode of the manufacturing and service industry is a typical industrial development and transformation path in many countries. Since the launch of the Yellow River Basin high-quality development strategy, how to realize the high-quality development of the manufacturing industry has attracted widespread attention. However, as a field separated from the manufacturing industry, the producer service industry affects and restricts the development of the manufacturing industry. On the one hand, the output of the producer service industry provides input for the manufacturing industry, and the reduction in the upstream product cost and the improvement of the production efficiency will be passed to the manufacturing industry through the value chain. The manufacturing industry can obtain a more significant cost advantage and, eventually, a larger agglomeration will form. On the other hand, guiding the manufacturing industry to extend to the producer service industry and service-oriented manufacturing is conducive for transforming the economic growth model from a reliance on the resource input to an efficiency improvement. The “manufacturing + producer service industry” mode provides a helpful reference for promoting the Yellow River Basin’s high-quality development.
This paper tries to answer the following questions. Is there a correlation between the economic development of the cities in the Yellow River Basin? If so, what kind of correlation exists? How does the overall industrial agglomeration in the Yellow River Basin affect the economic development? Is there a heterogeneity in the impact of the industrial agglomeration on the economic development in the upper, middle and lower reaches of the basin after considering the spatial factors? The answers to these questions will help government departments maximize the role of industrial agglomeration in the joint development of the Yellow River Basin.
The rest of this study is organized as follows.
Section 2 presents the related research.
Section 3 introduces how industrial agglomeration works to influence the regional economic development.
Section 4 introduces the methodology, variable selection and data sources.
Section 5 presents the empirical results.
Section 6 discusses the main findings of this study.
Section 7, concludes this study and provides policy recommendations. Finally,
Section 8, discusses the direction of future research.
2. Literature Review
2.1. Industrial Agglomeration and Industrial Co-Agglomeration
2.1.1. Definition of Industrial Agglomeration and Industrial Synergistic Agglomeration
The study of industrial agglomeration can be traced back to the late 19th century. Marshall’s study comprehensively analyzed the causes of industrial agglomeration [
5]. After Marshall, the industrial agglomeration theory developed considerably, and many schools of thought have emerged. There are currently many concepts similar to industrial agglomeration. For example, “industrial cluster” [
6,
7] and “industrial district” [
8,
9] etc. The core contents of the different concepts are the same. Only the geographical scope and focus differ.
The industrial agglomeration studied in this paper has a broader connotation. It includes the phenomenon of the industries concentrated within a specific space and the phenomenon of the geographic concentration formed by the transfer of industries across regions. In detail, this concept has two characteristics. Firstly, the concept is multi-layered in the space. It can refer to a city’s industrial agglomeration phenomenon or the agglomeration in a larger geographical scope, such as a province or the whole Yellow River Basin. Secondly, this concept notes the changes in the agglomeration and diffusion of industries. Centripetal or centrifugal forces influence the industrial agglomeration in a space. When centripetal forces influence a city’s industries in the early stages of development, industries form agglomerations. When the industrial agglomeration develops to a certain degree, it will be influenced by centrifugal forces, and the industry will spread to the surrounding areas.
Industrial co-agglomeration was first proposed by Ellison and Glaeser (1997) [
10]. They define industrial co-agglomeration as the agglomeration between different industries. Industrial co-agglomeration is a high spatial agglomeration of industries with upstream and downstream or horizontal linkages. Based on the previous research, this study defines industrial co-agglomeration as the concentrated distribution of related manufacturing and producer service industries in the same area.
2.1.2. Measurement of Industrial Agglomeration and Industrial Co-Agglomeration
- (1)
Measurement of Industrial Agglomeration
Common measures of industrial agglomeration include the concentration ratio, the Herfindahl–Hirschman index, the spatial Gini coefficient, the location quotient, etc. The Herfindahl–Hirschman index measures the industry concentration from a market share perspective. Han and Song (2021) [
11] selected the Herfindahl–Hirschman index to study the overall agglomeration of high-tech industries in Guangdong, a province of China. Wu et al. (2022) [
12] employed the location quotient, the Herfindahl–Hirschman coefficient, and the spatial Gini coefficient to measure the renewable energy industry in the Beijing–Tianjin–Hebei region. The results showed that the renewable energy industry is a low agglomeration industry in the Beijing–Tianjin–Hebei region. Keeble et al. (1991) [
13], Liu et al. (2020) [
14], Zhang et al. (2021) [
15], Chen et al. (2020) [
16], and Han et al. (2019) [
17] calculated the industrial agglomeration using the location quotient.
Overall, the concentration ratio can reflect the industry agglomeration at the market level to a certain extent. However, it cannot reflect the industry agglomeration at the geographical level. Furthermore, the concentration ratio is closely related to the number of the largest enterprises in the industry. There is no uniform standard for reference. The Herfindahl–Hirschman index requires relevant data from the companies. The change in the large enterprises’ market share significantly affects the calculation results. The location quotient measures the spatial distribution of the factors in a region. It eliminates the differences in the size and the other external factors across the study areas, and the data required by this method are easier to find. Our research employed the location quotient to measure the manufacturing agglomeration and the producer service industry agglomeration.
- (2)
Measurement of Industrial Co-agglomeration
In the existing research on synergistic agglomeration, the common indicators include the EG index constructed by Ellison and Glaeser, the K function and the modified EG index proposed by Chen et al. (2016) [
18]. Ellison and Glaeser (1997) [
10] first proposed the EG index to measure the industrial co-agglomeration. This index has a wide range of applications. The DO index was proposed by Duranton and Overman (2008) [
19]. Due to the requirement for more accurate manufacturer spatial location data, the DO index is less used in China. With reference to the EG index, Chen et al. (2016) [
18] constructed a new Θ index. Compared to the other indexes, the Θ index constructed by Chen et al. (2016) [
18] is more applicable to cities. Many researchers widely use this method [
20,
21,
22,
23]. In our research, the Θ index was used to measure the industrial co-agglomeration of the manufacturing and producer service industries.
2.1.3. Empirical Studies on Industrial Agglomeration and Industrial Co-Agglomeration
In the early stage, the studies on industrial agglomeration mainly focused on the manufacturing industry. Many manufacturing industries in the United States have significant concentrations of production and are not limited to high-tech industries [
24]. Using the data from the US manufacturing industry, Rosenthal and Strange (2001) [
25] found that the input–output linkages, labor availability and knowledge spillovers all contributed significantly to the manufacturing agglomeration. With the increasing importance of producer services in the economy, the producer services agglomeration has also become a popular research topic. Keeble et al. (1991) [
13] examined the characteristics of agglomeration development in the producer services sector. Producer services, as intermediate inputs to the capital and knowledge-intensive industries and manufacturing, can effectively contribute to the technological progress and energy efficiency [
26]. Ellison and Glaeser (1997) [
10] was the first to focus on the spatial agglomeration between the differentiated industries and proposed the synergistic agglomeration of the industries. By upgrading the industrial structure, the refinement of the social division of labor, the increase in the level of specialization and the transformation of the “industrial economy” into a “service economy”, the trend of the synergistic development of manufacturing and the producer services are becoming more and more prominent [
27]. The further agglomeration of the manufacturing and producer services industry provides additional possible advantages and forces for economic growth [
28,
29,
30]. The transformation of the economic development mode from “manufacturing agglomeration single-wheel driven” to “manufacturing and producer services synergistic agglomeration double-wheel driven” can effectively promote the high-quality development of the Yellow River Basin.
2.2. Industrial Agglomeration and Economic Growth
Numerous studies have investigated the industrial agglomeration and synergistic agglomeration effects on the national economy without reaching a consensus [
21]. Most studies conclude that industrial agglomeration can promote economic growth, while some studies still conclude that there is a negative or nonlinear relationship between industrial agglomeration and economic growth. The reservoir effect of labor, the economies of scale in the intermediate inputs and productive services and the spillover effect of expertise and knowledge are the main reasons for the economic benefits of industrial agglomeration [
5]. Industrial agglomeration is essential for regional economic growth [
4]. A positive impact of the industrial agglomeration on a new type of urbanization was found by Wu et al. (2022) [
31]. According to the research of Ke and Yu (2014) [
32] and Li et al. (2021) [
33], the total factor productivity can be promoted by industrial agglomeration and industrial co-agglomeration. Industrial agglomeration can promote green development by strengthening technological innovation, enhancing government intervention and optimizing the industrial structure. [
34]. A negative relationship between the energy efficiency and the industrial agglomeration in the cement sector was observed by Tanaka and Managi (2021) [
35]. Yuan et al. (2020) [
36] investigated the nonlinear impact of the manufacturing agglomeration on green economic efficiency. The results suggested the existence of a significant positive “U-shaped” relationship between the manufacturing agglomeration and green economic efficiency in 287 cities in China. The spillover effect of the industrial agglomeration and synergistic agglomeration has been captured in several pieces of research [
21,
22,
37,
38,
39,
40,
41,
42]. However, there are far fewer articles that consider the spatial factors.
2.3. Research Review
The previous research has noted many achievements, but there is still space for further study. Firstly, some studies only focused on single-industry agglomeration, such as manufacturing agglomeration, service agglomeration, tourism industry agglomeration, or the co-agglomeration between two industries. Diversified agglomeration and specialized agglomeration are also common topics in many studies. However, few studies have covered the manufacturing agglomeration, producer service agglomeration and synergistic agglomeration of the manufacturing and producer services simultaneously. Secondly, linear or nonlinear relationships are often discussed when it comes to the relationship between industrial agglomeration and economic growth. The spillover effect of agglomeration influenced by the spatial location has yet to be considered.
Last but not least, few studies research the industrial agglomeration within the Yellow River Basin. The main research area for industrial agglomeration includes the whole country or other city agglomerations, such as the Yangtze River Delta or Beijing–Tianjin–Hebei. The main research topics of the Yellow River Basin are the environment and water resources. As proposed by the Yellow River Basin’s high-quality development strategy, it is urgent to focus on the industry problem within the basin.
Given these deficiencies, we contributed to the following three aspects. (1) Different from the other studies, we focus on the 49 prefecture-level cities in the Yellow River Basin. Moreover, we also divided the whole basin into three regions, namely the upper, middle and lower reaches. In this way, we could analyze the regional heterogeneity of the different regions. (2) We included the manufacturing agglomeration, producer service agglomeration and synergistic agglomeration in this study. The impact of the individual industry agglomeration on the economic growth is analyzed in the study, and the role of the synergistic agglomeration is considered. (3) We incorporated the spatial location factors into the modeling process. The spatial weight matrix was further introduced to construct the spatial panel econometric model of the impact of industrial agglomeration on the economic growth so that we could investigate the impact intensity, direction and regional differences of the manufacturing agglomeration, producer service agglomeration and the synergistic agglomeration on the economic growth.
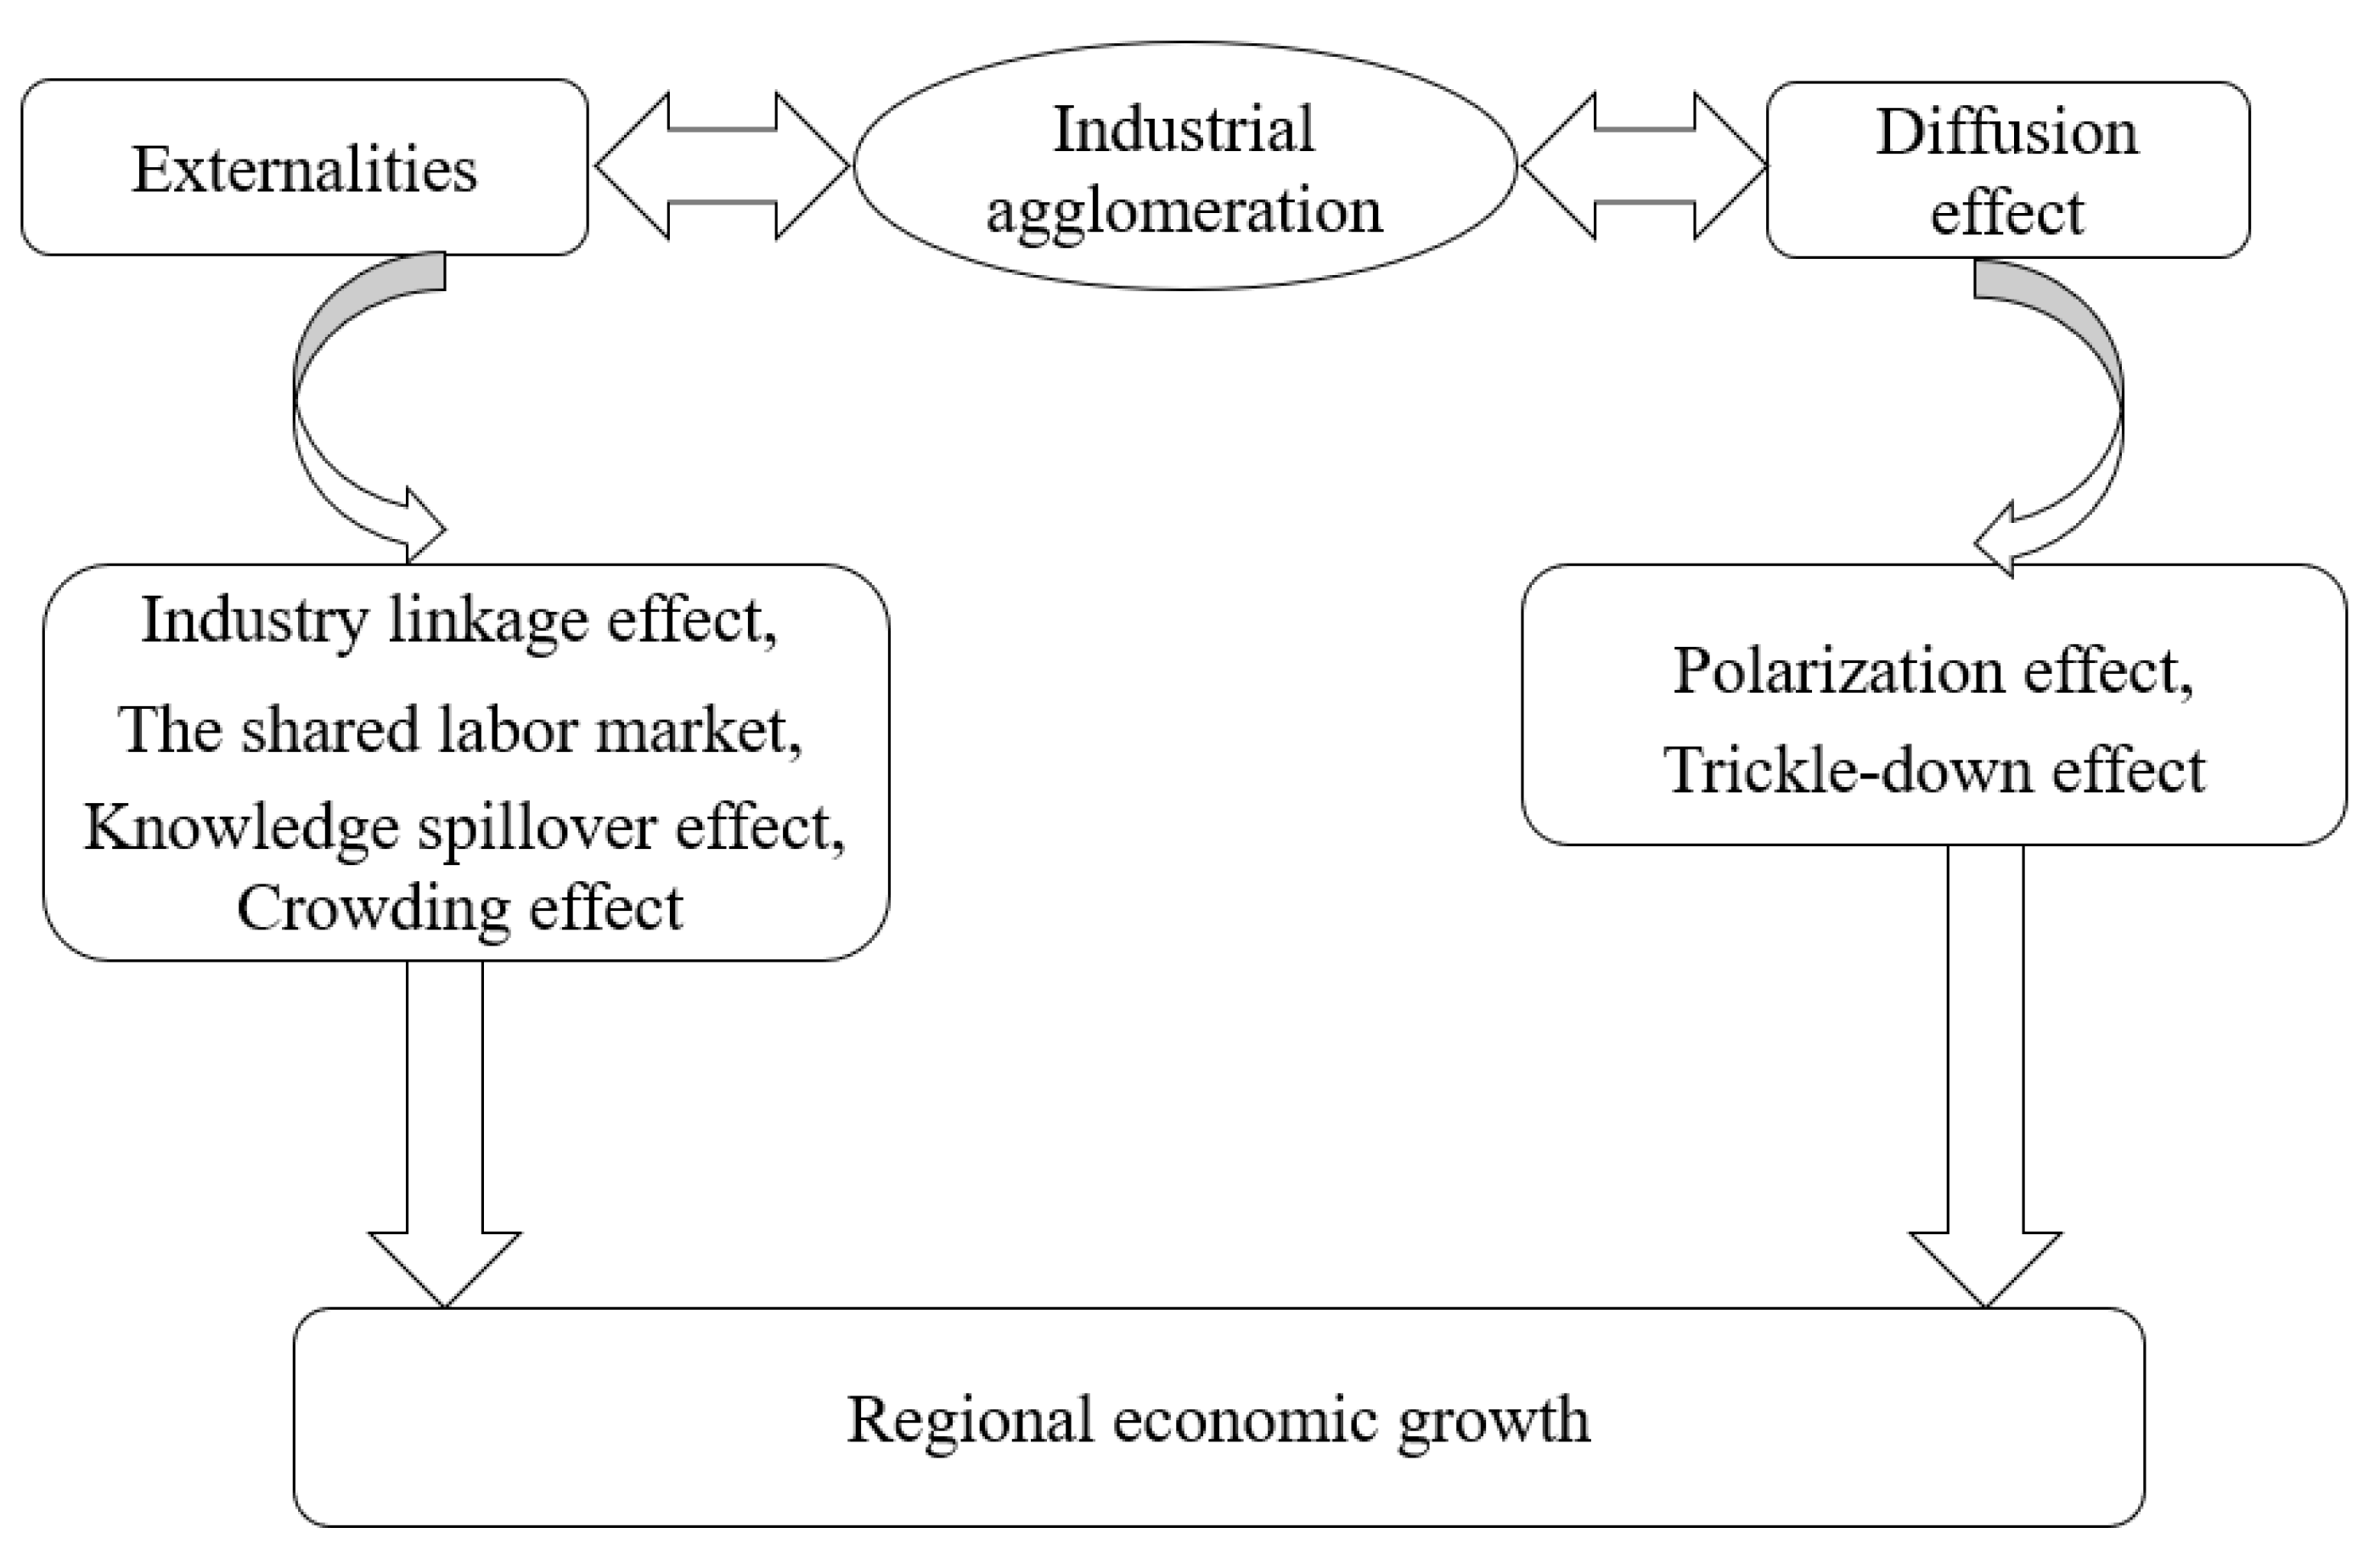
3. The Mechanism of the Role of Industrial Agglomeration in Promoting Regional Economic Growth
Based on the formation mechanism of the industrial agglomeration and related research, we identified the mechanism of the role of industrial agglomeration in promoting regional economic growth, as shown in
Figure 1.
Industrial agglomeration primarily exerts a positive or negative influence through its externalities and diffusion effects.
At the beginning of industrial agglomeration, capital, talents, technology and information are gathered in the same area. The aggregation of the elements leads to the industrial innovation and technological innovation. The related industries gradually develop to form the agglomeration centers. The industrial agglomeration externalities then begin to emerge.
The positive externalities include the industry linkage effect, the shared labor market and the knowledge spillover effect.
First, for the industry linkage effect, the concentration of the downstream manufacturers in the agglomeration area increases the demand for upstream industries and promotes the scale effect of the upstream enterprises. The upstream companies benefit from the scale of specialized production by obtaining a sufficient market demand. On the other hand, if downstream companies are located in areas where a large number of upstream companies are concentrated, then cost savings can be achieved due to the easy availability of intermediate inputs. The concentration of a large number of upstream and downstream-related enterprises in the same region further promotes the refinement of a specialized division of labor. In order to enhance their competitiveness, enterprises in the agglomeration area will make improvements to their production. As a result, the overall production efficiency and competitiveness of the region’s enterprises will be promoted.
Second, for the shared labor market, the existence of shared labor markets in the industrial agglomeration areas reduces the search costs for business owners and workers. It enhances the availability of the labor quantity and skills and facilitates the matching of workers with production companies. Workers also benefit from lower unemployment rates and higher average wages than in non-industrial agglomerations. Therefore, firms and workers tend to prefer the existing industrial agglomerations, further contributing to the deepening of industrial agglomerations.
Third, for the knowledge spillover effect, knowledge spillover has obvious spatial limitations, and industrial clustering provides a favorable spatial environment for the knowledge and technology spillover. Enterprises can realize the proximity and high frequency of communication and promote invisible knowledge sharing by strengthening the learning effect. The spatial proximity formed by industrial agglomeration enhances the opportunity for enterprises to acquire knowledge and technology from their surrounding subjects and also provides a channel for the technology exchange to speed up the learning and application of new technologies.
The negative externality of industrial agglomeration is the crowding effect. On the one hand, with the increase in the agglomeration in the region, the competition among enterprises intensifies and there is a shortage of resources, such as land and capital. The needs of enterprise production cannot be met, while the concentration of too many enterprises causes excessive competition in the product market. On the other hand, as more and more enterprises are clustered, the spatial environmental constraints of the city come to the fore. The urban environment and infrastructure all face tests.
Industrial agglomeration will affect the region’s economic development and influence the economic development of the surrounding areas through diffusion effects. The diffusion effect includes the polarization effect and the trickle-down effect. At the different stages of economic agglomeration, the spatial spillover effects on the surrounding areas are different. The polarization effect dominates in the early stage of agglomeration. In the early stage, resources pour into the central areas, such as big cities, exacerbating the regional differences. When the industrial agglomeration in the central area reaches a specific size, the trickle-down effect plays a dominant role. With the knowledge and technology spillover from the central region and the transfer of industries, the surrounding region’s economy will also be developed.
4. Materials and Methods
4.1. Research Approach and Model Building
4.1.1. Exploratory Data Analysis
The spatial correlation identification is the premise of the spatial econometric analysis. This paper used the global Moran’s I test for the spatial correlation. The global Moran’s I formula is
where
represents the observation value of the
i-th region,
n is the total number of regions and
is the spatial weight, which is used to define the mutual proximity relationship of the spatial objects. Moran’s I takes the value of [−1,1]. The larger the index, the stronger the spatial correlation, and the closer to 1, the stronger the agglomeration. A positive global Moran index indicates a positive spatial correlation, and a negative global Moran index indicates a negative spatial correlation. Approaching 0 means that the variables are not spatially correlated.
4.1.2. Spatial Weight
The spatial weight matrix reflects the structure and intensity of the spatial effect of the research object. In the existing spatial metrology literature, the spatial weight matrix
primarily includes the proximity weight matrix, the distance weight matrix and the other distance weight matrices. In this paper, the proximity weight was selected for calculation, and the spatial correlation test was assisted by the geographic distance weight matrix where
represents the distance between the centroids of the two cities, which were calculated from the latitude and longitude. The latitude and longitude data come from the map coordinate picking system.
4.1.3. Model Settings
The common spatial econometric models include the spatial lag model (SLM), the spatial error model (SEM) and the spatial Doberman model (SDM).
Among them, is the explained variable of the observation unit I at time t, i = 1, n, t = 1,…,T, is an exogenous variable of the order 1 × n, representing the i-th row of the explanatory variable matrix. is an exogenous spatial weight matrix of the order n × n, is a parameter vector of the order k × 1, k is the number of the explanatory variables, is the coefficient vector, indicates the influence coefficient of the independent variable of the neighboring area on the dependent variable of the local area, is an individual effect, is a time effect and is the error.
With further research, LeSage and Pace (2009) [
43] proposed that the changes in the variables in the different models affect the partial differential equations. Based on this, the partial differential method of the spatial regression model was proposed. By calculating the partial differential of the spatial model, the impact of variables in the different model settings can be explained, and the total impact can be divided into direct effects and indirect effects to analyze the influence of the explanatory variables more comprehensively.
4.2. Variable Selection
This paper studies the impact of industrial agglomeration on economic growth. Most studies have chosen the regional output as the explained variable. However, our study area has a large geographic and spatial span, with significant population differences between the eastern and western regions. In order to eliminate the effects of the differences in the urban population size, this paper uses the GDP per capita (
Agdp) indicator to characterize the urban economic growth [
44]. Referring to the research of Xu and Lin (2018) [
44], we chose the CPI of the first year of our research period (2006) as the baseline to convert the per capita GDP.
Explanatory variables. The manufacturing agglomeration (MA), producer service industry agglomeration (PSA), and manufacturing producer service industry synergistic agglomeration (CA) were the explanatory variables. According to existing research and national economic industry classifications and codes, the manufacturing industry includes the industry codes 13–43, with a total of 31 categories. The producer service industry covers transportation, warehousing, the postal industry, information transmission, computer services, the software industry and the financial industry. The five departments include leasing and business services, scientific research, geological services and exploration. We used the location quotient to calculate the manufacturing agglomeration and producer service agglomeration.
Among them,
LQ represents the degree of the industrial agglomeration,
represents the employment of the industry
i in the
t-th year in city
x,
represents all the employment in the year
t in city
x and
represents all the employment in the country in the year
t.
Due to the availability of the data and our research area, the modified EG index was used to calculate the synergistic aggregation degree [
18].
CA represents the degree of the industrial co-agglomeration,
represents the degree of the industrial agglomeration of manufacturing and
represents the degree of the industrial agglomeration of the producer services industry.
Control variables. The control variables in this study included the physical capital input, human capital, government intervention and imports and exports. The physical capital accumulation provided the material basis for the wealth growth, and the physical capital input was crucial for promoting the economic growth [
45,
46]. The physical capital accumulation (
cap) adopted the Zhang Jun et al. algorithm and used the perpetual inventory method to calculate the capital stock [
47]. The depreciation rate was 9.6%, and the total investment in fixed assets represented the new investment in fixed assets. The initial capital and fixed asset investment data were converted using the fixed asset investment price index based on the 2006 dataset. Human capital was an endogenous driver of the economic growth and an essential vehicle for generating the knowledge spillovers. The importance of human capital accumulation for economic growth was well established in the literature [
48,
49,
50]. The human capital (
HC) was measured by the number of college students per 100,000 people. In economic development, the regulatory role of the government and the market was equally important. Different government intervention levels may have different effects on the economic development [
51,
52]. In our paper, the government intervention (
gov) was measured by the proportion of the local government budgetary expenditure in the regional GDP. As one of the important ways to promote economic growth [
53,
54,
55], international trade drives employment through expanding the external demand, thus increasing the residents’ income. The increase in the residents’ income continuously stimulates domestic consumption. The economies of scale and knowledge spillover from the expanding domestic and foreign demand further contribute to regional economic growth. The import and export (
MX) was measured by the proportion of the total import and export of the regional GDP, and the total import and export (USD) over the years was converted using the average RMB exchange rate for each year.
4.3. Data Sources
This paper defines the Yellow River Basin as Qinghai, Ningxia, Gansu, Inner Mongolia, Shanxi, Shaanxi, Henan and Shandong. Concerning the «List of Cities and Counties in the Yellow River Basin» formulated by the Water Resources Commission, 49 prefecture-level cities were identified as the research objects, of which Laiwu City, Shandong Province, was merged into Jinan City in 2019. The research period of this paper was from 2006 to 2018, so Laiwu City was still listed separately. The list of cities is shown in
Table 1. The data used in this paper came from the National Basic Geographic Information System database, the «China Urban Statistical Yearbook», the «China Regional Economic Statistical Yearbook», the statistical bulletins of the prefecture-level cities and the EPS statistical database. Some of the missing data have been interpolated. In order to eliminate the data heteroscedasticity, all the data were processed logarithmically. The descriptive statistics of each variable are shown in
Table 2.
5. Results Analysis
5.1. Economic Spatial Correlation Test
Two spatial weight matrices were used to calculate the global Moran’s I of the economic growth (
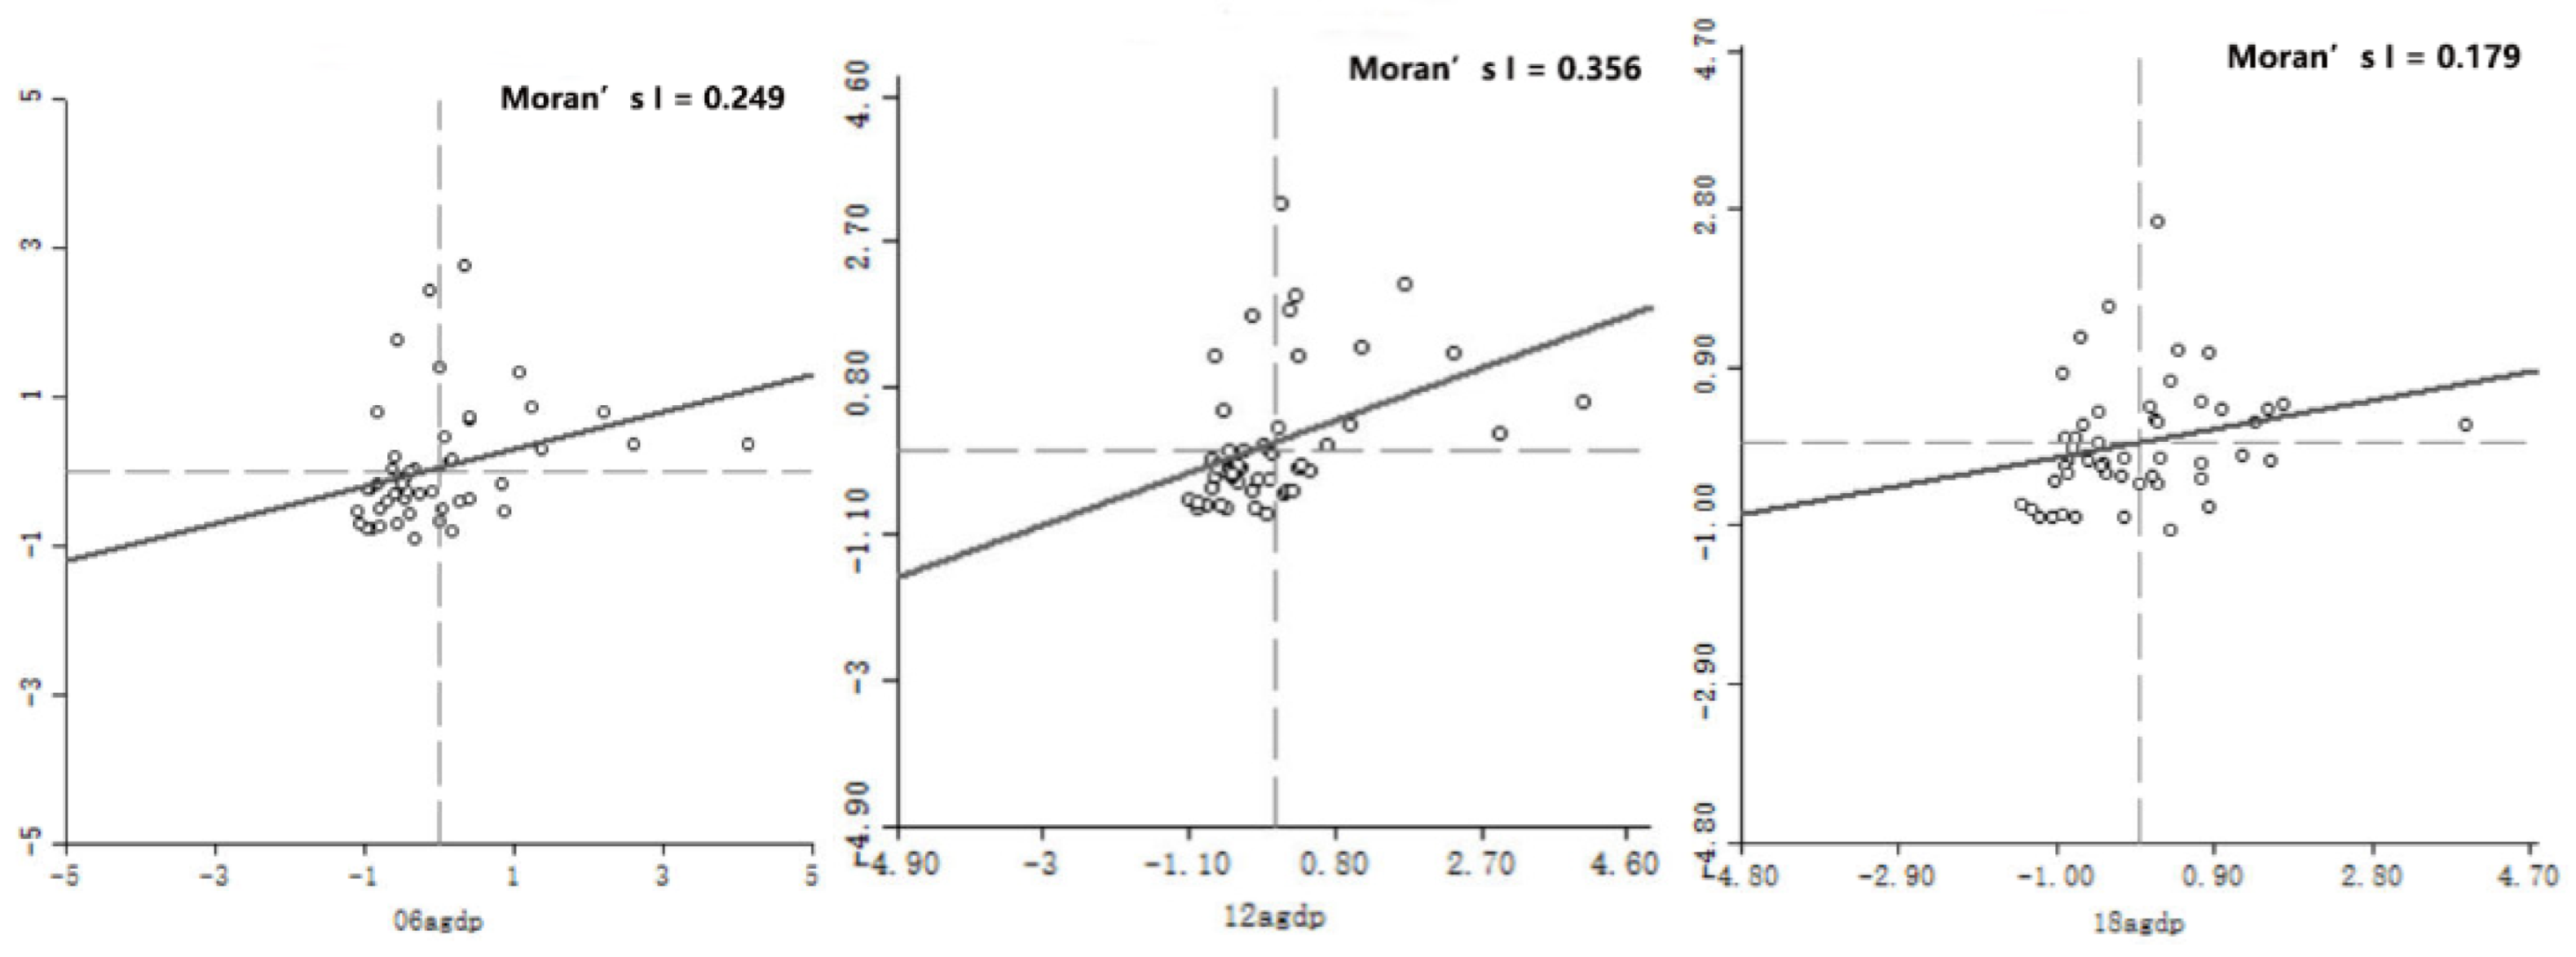
Table 3).
According to the results, the Moran’s I was significantly positive, between 0.2–0.4, and the overall trend was stable. It shows that the level of economic development within the region was not completely random. There was an apparent spatial dependence, and the level of economic development between the cities was related to each other. Therefore, the spatial factors need to be taken into account in the study. It can be seen from the Moran scatterplot chart (
Figure 2) that the cities were mostly located in the first and third quadrants. The low–low and high–high distribution characteristics are apparent, which confirm the positive spatial correlation of the economic development level of the Yellow River Basin. As shown in
Figure 2, there were more cities in quadrant three, while the cities in quadrant three were a low–low agglomeration, indicating that there were still a significant number of cities in the basin at low economic levels.
5.2. Data Validation and Model Setting
In order to avoid bias, the data stationarity needed to be checked before the regression. Based on the results, all the variables passed the test (
Table 4), rejecting the hypothesis that a unit root exists.
The model was then subjected to a Hausman test, based on the fixed effects that were used. At the same time, the random effects models required that the overall spatial units needed to be infinitely large. Studies have shown that the fixed-effect results were more robust and easy to calculate, so a fixed-effect analysis was used [
36]. The model was then performed using a joint non-significance test, an LM test, a Wald test and an LR test. According to the test results, the combined non-significance tests of time and the spatial fixed effects of the manufacturing agglomeration, producer service industry agglomeration and synergistic agglomeration models rejected the null hypothesis, indicating that both the spatial and temporal fixed effects should be constructed. Judging from the LM test results, the robust LM error failed the test, noting that the spatial error model should be used. The Wald and LR tests were significant at the 1% significance level, and both hypotheses were rejected simultaneously. Additionally, a spatial correlation between the variables existed, and the spatial Dubin model could reflect the spatial correlation caused by the explained variables, explanatory variables or error terms [
56]. The spatial Dubin model was used and, therefore, the dual-fixed space Dubin model was finally used for the analysis.
5.3. The Impact of Industrial Agglomeration on Economic Growth in the Yellow River Basin
The temporal and spatial dual-fixed Dubin model was used to analyze the impact of industrial agglomeration on the economic growth in 49 prefecture-level cities in the Yellow River Basin. The results are shown in
Table 5.
According to the regression results in
Table 5, the agglomeration of manufacturing in the Yellow River Basin significantly promoted the economic growth. The model was insignificant after, including the quadratic terms, indicating that no inverted “U” curve relationship existed. According to the Williamson hypothesis, the crowding effect gradually inhibits the economic growth as the industrial agglomeration increases. However, the overall manufacturing agglomeration level of the Yellow River Basin was low and far from the threshold, so the inverted “U” shape effect had not appeared. The agglomeration of the producer services industry promoted the economic growth (0.008), but the coefficient was small and insignificant. This showed that the knowledge and technology spillover effect caused by such agglomeration was small and had yet to produce significant economic promotion effects. The industrial co-agglomeration had a positive promotion effect (0.03), but the effect was insignificant. This reflected the lack of an effective coordination between the two types of industries, and there was still a “dislocation”. In the three models, ρ was significantly positive, indicating that the economic development in the basin was positively correlated. This was also consistent with the results of the spatial correlation analysis.
In terms of the spillover effects, we analyzed the spatial lag term. As we can see, the spatial lag terms of the four models were all negative, indicating that the agglomerations in the surrounding areas inhabited the local economies. Specifically, every 1% increase in the manufacturing agglomeration in the neighboring cities caused a 0.124% decrease in the local economy, and the coefficient was significant at the 5% level. The agglomeration of the producer service industries in the surrounding cities increased by 1%, and the local economy decreased by 0.03%. Each 1% increase in the synergistic agglomeration of the surrounding cities caused a 0.115% decrease in the local economy, which was significant at the 1% level. According to the spillover mechanism of the industrial agglomeration, the agglomeration in the Yellow River Basin is still in an early stage. In the early stage, there is a polarization effect, which means the elements needed for industrial development are attracted to more developed areas. Thus, the economic development in the surrounding areas limits the local development. This also reflects the low level of industrial agglomeration in the basin. When the industrial agglomeration develops to a certain level, according to the trickle-down effect, the surrounding industrial agglomeration will promote the local economic development.
Regarding the controlling variables, the input of physical capital (cap) was significant in promoting the economic growth. Capital drives economic growth by increasing the aggregate supply and promoting the refinement of the social division of labor, which remains a crucial element in promoting regional economic growth. Human capital (HC) had a facilitating effect, but it was not significant in the four models and the impact coefficient was approx. around 0.02. It may be due to the basin’s low overall level of human capital and the large difference in the level of human capital in each region. Government intervention (gov) was a significant inhibition of economic growth, highlighting the importance of reducing government intervention in promoting economic growth. Excessive government intervention will reduce the efficiency of resource allocation, inhibit the free competition of enterprises and market innovation and is not conducive to enhancing the market vitality. Imports and exports (MX) significantly promoted economic growth, and the impact coefficient was around 0.12. Shaanxi, Gansu, Ningxia and the other provinces in the Yellow River Basin were all covered by the “Belt and Road” Initiative. With the help of foreign cooperation, excess capacity in the region has been effectively exported, alleviating resource backlogs and waste, promoting the utilization rate of resources and improving the social labor productivity.
5.4. Regional Heterogeneity Analysis of the Impact of Industrial Agglomeration on Economic Growth in the Yellow River Basin
According to the demarcation point of the Yellow River, the river basin was divided into three areas: the upper, middle and lower reaches. Each model passed the Hausman test, so a fixed-effect model was used. The spatial Dubin model was applied according to the LM, LR and Wald test results. The regression results are shown in
Table 6,
Table 7 and
Table 8.
5.4.1. Regional Heterogeneity of the Impact of Manufacturing Agglomeration on Economic Growth
According to the decomposition results of the manufacturing agglomeration effect (
Table 6), the impact of the midstream and downstream manufacturing agglomeration on the economic growth showed an inverted “U” curve, which was significant at the 10% level. This validated the Williamson hypothesis that, in the early stage of industrial agglomeration, the increase in the agglomeration promotes urban economic growth, and when the manufacturing agglomeration reaches the threshold, it begins to inhibit the economic growth. The upstream was insignificant, mainly due to the low level of upstream manufacturing agglomeration. The underlying cause for the difference lies in the different stages of development of the manufacturing industry in each region. The downstream manufacturing industry had a good foundation, coupled with the need for urban development for the manufacturing industry. The continuous improvement of manufacturing technology and equipment has accelerated the agglomeration of the downstream manufacturing industry. The midstream cities benefitted from a better geographical location, and under the industrial transfer driven by the downstream, the manufacturing industry also achieved a certain development. The upstream city had a relatively weak manufacturing base, and urban development had yet to generate a high demand for the manufacturing industry, resulting in the slow development of the manufacturing industry in the region.
The indirect effect of the upper and lower reaches was not significant. The indirect effect of the manufacturing agglomeration in the midstream region was significantly negative, indicating the existence of a polarization effect.
5.4.2. Regional Heterogeneity of the Impact of the Agglomeration of Productive Services on Economic Growth
According to the results on the regression of the agglomeration in the producer service industry (
Table 7), it was found that the overall effect of such agglomeration on the local economy was positive, which is consistent with the overall research results. That is, the agglomeration and upgrading of the productive service industry can promote the economic growth. However, the degree of significance varied from region to region, with the midstream being significantly below the 5% level and the upstream and downstream being insignificant. From the coefficient view, the midstream contribution coefficient was the largest (0.123), followed by the downstream (0.061) and upstream (0.049). The upstream catalytic effect at this stage was still limited. However, the indirect effect of the producer service industry agglomeration was insignificant. This indicates that the surrounding area’s producer service agglomeration had little impact on the local region’s economy.
5.4.3. Regional Heterogeneity of the Impact of Synergistic Agglomeration on Economic Growth
According to the decomposition results of the synergistic agglomeration effect in
Table 8, the promotion effect of the downstream synergistic agglomeration was the greatest. Regarding the direction of action and the degree of significance, the synergistic agglomeration of the middle and downstream significantly affected the promotion. However, the upstream synergistic agglomeration inhibited the economic growth (−0.077). The possible reason is that the upstream manufacturing industry had a low level of agglomeration and a weak foundation. Due to the uneconomic agglomeration, the improvement of the synergistic agglomeration was not conducive to improving the economic efficiency, inhibiting the economic growth.
On the other hand, according to the study of Dou and Liu (2016) [
57], when the size of the city is less than 230,040 people, the synergistic agglomeration will have a significant inhibitory effect on the urban economy. In 2018, only six of the 20 cities in the upper reaches of the Yellow River Basin were larger than 230,040, confirming the conclusion that the upstream synergistic agglomeration inhibits the economic growth. Judging by the decomposition results, the direct effect of the middle and downstream synergistic agglomeration was significantly positive, and the promotion of the downstream was significantly more vigorous. The upstream’ s direct effect was negative. The improvement of the upstream synergistic agglomeration was not conducive to local economic growth. Similar to the producer service industries, the indirect effects of the industrial co-agglomeration were also insignificant, and there was no significant negative overflow (−0.012) in the downstream area. For the downstream cities, improving the synergistic agglomeration of surrounding cities inhibited local economic growth.
Regarding the control variables, the physical capital (cap) input significantly drove the economic growth. The coefficient was large. The direct, indirect and total effects were positive, indicating that the input of physical capital promotes local economic growth and the economy of the surrounding cities. The economic contribution of human capital was not significant. Human capital was a stronger economic contributor downstream than in the middle and upstream. The knowledge and technology spillover of the downstream human capital elements emerged. The middle and upper reaches should still accelerate the improvement of the level of human capital. Government intervention (gov) has always significantly dampened the economic growth. Government intervention in the upper and middle reaches showed a robust inhibitory effect on the economic growth. The downstream was slightly weaker, which still highlighted the significance of promoting government decentralization for the upper and middle reaches. The direct effects were significantly negative, and the indirect effects were mostly insignificant, indicating that local government intervention was much more inhibiting. The imports and exports (MX) showed different degrees of economic promotion, and the economic promotion effect in the downstream region was the most significant.
6. Discussion
In this paper, we comprehensively studied the impact of industrial agglomeration on the economic growth and spillover effects in the Yellow River Basin. We studied the whole basin and divided it into the upper, middle and lower reaches to obtain more insightful conclusions. Compared to the previous studies on the industrial agglomeration of the Yellow River Basin [
58,
59], we considered the spatial factors. In terms of the entire basin, the Moran scatter plot showed that the cities with low economic development dominated the basin. This was consistent with the current state of the economic development in the Yellow River Basin. All three kinds of agglomeration can promote the economy. However, the impact of the producer service industry agglomeration and the industrial co-agglomeration were insignificant. This may be related to the slight increase in the specialization of the productive services and the differences between the different regions. Thus, the contribution to the economy was limited [
60]. There was a “misalignment” between the manufacturing and productive services industries in the basin, and the economic effect of the synergistic agglomeration was not fully reflected. Especially in the downstream areas, the large share of manufacturing industries and the high degree of agglomeration was prominent, while the development of the productive service industries was relatively lagging. This led to a lack of effective coordination between the two; therefore, the economic impact was not outstanding.
Regarding the different regions of the basin, the impact of the middle and downstream manufacturing agglomeration on the economic growth showed an inverted “U” curve, and both were significant at the 10% level. This verified the Williamson hypothesis [
61]. Initially, agglomeration can promote economic growth, but as the agglomeration increases, the crowding effect becomes more apparent and inhibits economic growth. This also reflected the low level of the upstream manufacturing agglomeration at the current stage. It is worth noting that, in the downstream areas, the productive services industry agglomeration was less effective in promoting economic growth than the synergistic agglomeration. This was consistent with the slow and weak development of the productive service industries in the downstream areas. Only the agglomeration of the midstream producer services industries significantly contributed to the economy.
Regarding the spillover effect of the agglomerations, it was clear that there was a negative spillover effect in the whole basin. The industrial agglomeration of the basin was still in its early stage. The elements needed for industrial development were attracted to the more developed areas. Due to the trickle-down effect, the spillover effect will change from negative to positive with the increase in the industrial agglomeration.
7. Conclusions and Policy Recommendations
7.1. Conclusions
- (1)
There was a significant spatial correlation and spatial spillover in the economic development. The overall Moran’s I index of the economic development was significantly positive, with an evident spatial dependence and agglomeration. The cities with high economic levels were located nearby, and the cities with low economic levels were also close to each other. In the regression model, the spatial effect parameter ρ was significantly positive. There was a positive overflow between the regional economies. The economic growth of the neighboring regions will promote the local economy. Combined with the reality that the economic center of gravity is eastward, the cities in the central and western regions should make full use of the economic spillover effect of the surrounding high-level cities to promote economic growth in their respective regions.
- (2)
There was regional heterogeneity in the impact of industrial agglomeration on the economic growth. From the perspective of the whole basin, the three types of agglomeration all promoted economic development, but the manufacturing agglomeration was more significant. From the perspective of the different regions, the middle and lower reaches of the manufacturing industry agglomeration and the economy showed a significant inverted “U” shape relationship, and the upstream was not significant, primarily due to its low agglomeration. The agglomeration of the productive service industries in the middle reaches significantly promoted the economy. In contrast, the agglomeration of the productive services in the other two regions did not significantly promote the economy. The upstream synergistic agglomeration inhibited the economic growth, while the midstream and downstream synergistic agglomerations significantly promoted economic growth. The downstream synergistic agglomeration had the most significant impact coefficient. The synergistic agglomeration of the midstream had the strongest effect on the economic promotion.
- (3)
The negative spillover effect in the whole basin showed that the industrial agglomeration was still low. At present, the polarization effect is dominating the basin. In the producer services industries, the positive externalities, such as the knowledge and technology spillover effects, are not yet fully functional. The industrial co-agglomeration had a weak effect on the economic growth. There was a mismatch of the industrial resources and a lack of a synergistic sharing mechanism between the manufacturing and producer service industries. The “two-wheel drive” industrial pattern has not yet been formed.
- (4)
Physical capital investment can significantly contribute to regional economic growth. Investment is still an essential driver of economic growth in the Yellow River Basin. Physical capital investment promotes the city’s own development and generates positive spillover effects to promote regional development. Human capital does not contribute significantly to the basin’s economy. Government intervention consistently and significantly inhibits economic growth. Imports and exports have shown to boost economic growth to varying degrees, with the downstream regions being the most prominent.
7.2. Policy Recommendations
The results show that the impact of industrial agglomeration on economic growth in the Yellow River Basin showed an evident regional heterogeneity. The three types of agglomeration all promoted the economic growth, while the effect of the manufacturing agglomeration was much more significant. Based on the above analysis, relevant suggestions for promoting industrial agglomeration in the Yellow River Basin are put forward.
- (1)
Urban agglomeration should be considered as the main spatial form to promote industrial agglomeration in the Yellow River Basin. The formation of the central city–peripheral cities synergistic development pattern should be promoted. Economic development has a positive spatial correlation, and low–low agglomeration occupies the majority of the agglomeration areas. On the one hand, Zhengzhou, Xi’an and the other cities should be considered as the central cities, and full play should be given to Zhengzhou’s strategic position in leading the Central Plains’ cities and driving the development of the middle and lower reaches of the region. At the same time, Xi’an will become a strategic pivot point for opening up to the west, thus forming a new growth pole in the upper and middle regions. On the other hand, regional central cities should be created, such as Jinan, Taiyuan, Luoyang, Huhehaote, etc., and the industrial agglomeration in these regional central cities should be enhanced.
- (2)
Industrial agglomeration should be enhanced and the “two-wheel drive” industrial development model should be promoted. Overall, industrial agglomeration in the Yellow River Basin is still low. It is necessary to adopt a differentiated development path according to the different industrial development stages of the different regions. The middle and lower reaches of the Yellow River Basin are more advanced in manufacturing and should focus on developing producer service industries. At the same time, policymakers should promote the integration of new technologies and traditional manufacturing and upgrade the manufacturing industries from labor-intensive to capital-intensive and technology-intensive. Upstream cities are poorly developed in both manufacturing and productive services. In this situation, backward and forward industrial cooperations should be established with midstream central cities. Full use of the industry linkage effect and knowledge spillover effects should be established.
- (3)
The role of human capital should be valued. Overall, human capital in the Yellow River Basin contributes little to economic growth. There are slightly bigger human capital economic contributions in the downstream regions than in the other regions. Upstream and midstream cities should increase the training and introduction of talents to form a local training and introduction mechanism. At the same time, the corporate talent attraction mechanism should be fully utilized to drive the flow of talent elements through the presence of outstanding enterprises. For downstream cities, human resources in the region should be further integrated and guided to achieve a better allocation.
8. Future Research
Starting from two types of single-industry agglomeration and synergistic agglomeration, this study analyzes the spatial spillover effects of industrial agglomeration. However, due to the constraints of the information available and the authors’ knowledge structure, there are still some improvements and refinements that need to be conducted in this study.
- (1)
Due to the limitations of the data, the research subjects selected for the study were the 49 prefecture-level cities in the Yellow River Basin from 2006 to 2018, and the conclusions obtained can support the relevant research in the Yellow River Basin. The research subjects are prefecture-level rather than county-level cities, which causes the policy recommendations to have certain limitations. Therefore, future studies can further increase the period and contain more detailed analyses from county-level cities to make the recommendations more scientific.
- (2)
In this study, the proximity relationship between the cities was the primary consideration in setting the spatial weights, so a more widely used spatial weight proximity matrix was employed. In the future, the construction of a weight matrix that incorporates other factors, such as social development, can be explored to reflect the spatial influence between the cities more comprehensively.
Author Contributions
Conceptualization, M.S.; Methodology, M.S. and Y.G.; Software, Y.F.; Writing—original draft, Y.G., F.D. and Y.F.; Writing—review & editing, M.S.; Visualization, Y.G. and F.D.; Supervision, M.S.; Project administration, M.S. All authors have read and agreed to the published version of the manuscript.
Funding
This research was funded by the Key Laboratory of Carrying Capacity Assessment for Resource and Environment, Ministry of Natural Resources (No. CCA2019.16), China Academy of Engineering (No. 2017-ZD-03), the Program for New Century Excellent Talents in University (No. NCET-11-0731) and the Fundamental Research Funds for the Central Universities (No. 2022YJSGL08).
Data Availability Statement
The data used in this paper comecame from the National Basic Geographic Infor-mation System database, the «China Urban Statistical Yearbook», the «China Regional Economic Statistical Yearbook», the statistical bulletins of the prefecture-level cities, and the EPS statistical database.
Conflicts of Interest
The authors declare no conflict of interest.
References
- Xin, Y.; Liu, X.Y. Coupling driving factors of eco-environmental protection and high-quality development in the yellow river basin. Front. Environ. Sci. 2022, 10, 1237. [Google Scholar] [CrossRef]
- Zhang, S.R.; Zhang, G.H.; Ju, H.R. The spatial pattern and influencing factors of tourism development in the Yellow River Basin of China. PLoS ONE 2020, 15, e0242029. [Google Scholar] [CrossRef] [PubMed]
- Yuan, X.L.; Chen, L.P.; Sheng, X.R.; Li, Y.; Liu, M.Y.; Zhang, Y.J.; Jia, Y.S.; Qiu, D.F.; Wang, Q.S.; Ma, Q.; et al. Evaluation of regional sustainability through emergy analysis: A case study of nine cities in the Yellow River Basin of China. Environ. Sci. Pollut. Res. 2022, 29, 40213–40225. [Google Scholar] [CrossRef] [PubMed]
- Gonzalez, A.V.; Mack, E.A.; Flores, M. Industrial complexes in Mexico: Implications for regional industrial policy based on related variety and smart specialization. Reg. Stud. 2017, 51, 537–547. [Google Scholar] [CrossRef]
- Marshall, M.G. Principles of Economics; Macmillan and Co., Ltd.: New York, NY, USA, 1920. [Google Scholar]
- Xiao, W.W.; Zhao, B.X.; Wang, L.L. Marine industrial cluster structure and its coupling relationship with urban development: A case of Shandong province. Pol. Marit. Res. 2016, 23, 115–122. [Google Scholar] [CrossRef] [Green Version]
- Zheng, J.L.; Peng, X.T. Does an ecological industry chain improve the eco-efficiency of an industrial cluster? Based on rmpirical study of an energy-intensive industrial cluster in China. Sustainability 2019, 11, 1651. [Google Scholar] [CrossRef] [Green Version]
- Belussi, F.; Caldari, K. At the origin of the industrial district: Alfred Marshall and the Cambridge school. Camb. J. Econ. 2009, 33, 335–355. [Google Scholar] [CrossRef] [Green Version]
- Ottati, G.D. Marshallian industrial districts in Italy: The end of a model or adaptation to the global economy? Camb. J. Econ. 2018, 42, 259–284. [Google Scholar] [CrossRef] [Green Version]
- Ellison, G.; Glaeser, E.L. Geographic concentration in US manufacturing industries: A dartboard approach. J. Political Econ. 1997, 105, 889–927. [Google Scholar] [CrossRef] [Green Version]
- Han, L.; Song, Y. The method of measuring the agglomeration degree of high-tech industries and its influence mechanism: Taking Guangdong province as an example. Math. Probl. Eng. 2021, 2021, 5585398. [Google Scholar] [CrossRef]
- Wu, X.T.; Zhou, Y.; Cheng, C.C.; Yang, S.L. Industrial characteristics of renewable energy and spatial aggregation correlations in Beijing-Tianjin-Hebei. Sci. Technol. Energy Transit. 2022, 77, 3. [Google Scholar] [CrossRef]
- Keeble, D.; Bryson, J.; Wood, P. Small firms, business services growth and regional development in the United Kingdom: Some empirical findings. Reg. Stud. 1991, 25, 439–457. [Google Scholar] [CrossRef]
- Liu, Z.; Cai, Y.; Hao, X. The agglomeration of manufacturing industry, innovation and haze pollution in China: Theory and evidence. Int. J. Environ. Res. Public Health 2020, 17, 1670. [Google Scholar] [CrossRef] [PubMed] [Green Version]
- Zhang, M.D.; Wu, Q.B.; Li, W.L.; Sun, D.Q.; Huang, F. Intensifier of urban economic resilience: Specialized or diversified agglomeration? PLoS ONE 2021, 16, e0260214. [Google Scholar] [CrossRef] [PubMed]
- Chen, C.F.; Sun, Y.W.; Lan, Q.X.; Jiang, F. Impacts of industrial agglomeration on pollution and ecological efficiency-A spatial econometric analysis based on a big panel dataset of China’s 259 cities. J. Clean. Prod. 2020, 258, 120721. [Google Scholar] [CrossRef]
- Han, W.; Zhang, Y.; Cai, J.; Ma, E. Does urban industrial agglomeration lead to the improvement of land use efficiency in China? An empirical study from a spatial perspective. Sustainability 2019, 11, 986. [Google Scholar] [CrossRef] [Green Version]
- Chen, J.; Liu, Y.; Zou, M. The improvement of city productivity based on synergy and co-agglomeration of industries:under the background of integrated innovation and conversion of driving force for economic development in China. J. Zhejiang Univ. Humanit. Soc. Sci. 2016, 46, 150–163. [Google Scholar]
- Duranton, G.; Overman, H.G. Exploring the detailed location patterns of UK manufacturing industries using microgeographic data. J. Reg. Sci. 2008, 48, 213–243. [Google Scholar] [CrossRef] [Green Version]
- Hao, Y.; Song, J.; Shen, Z. Does industrial agglomeration affect the regional environment? Evidence from Chinese cities. Environ. Sci. Pollut. Res. 2022, 29, 7811–7826. [Google Scholar] [CrossRef]
- Zheng, H.; He, Y. How does industrial co-agglomeration affect high-quality economic development? Evidence from Chengdu-Chongqing Economic Circle in China. J. Clean. Prod. 2022, 371, 133485. [Google Scholar] [CrossRef]
- Zhu, Y.; Du, W.; Zhang, J. Does industrial collaborative agglomeration improve environmental efficiency? Insights from China’s population structure. Environ. Sci. Pollut. Res. 2022, 29, 5072–5091. [Google Scholar] [CrossRef] [PubMed]
- Zhuang, R.; Mi, K.; Feng, Z. Industrial co-agglomeration and air pollution reduction: An empirical evidence based on provincial panel data. Int. J. Environ. Res. Public Health 2021, 18, 12097. [Google Scholar] [CrossRef] [PubMed]
- Krugman, P. Geography and Trade; MIT Press: Cambridge, MA, USA, 1992. [Google Scholar]
- Rosenthal, S.S.; Strange, W.C. The determinants of agglomeration. J. Urban Econ. 2001, 50, 191–229. [Google Scholar] [CrossRef] [Green Version]
- Grubel, H.; Walker, M. Service Industry Growth: Causes and Effects; Fraser Institute: Vancouver, BC, Canada, 1989. [Google Scholar]
- Ke, S.; He, M.; Yuan, C. Synergy and co-agglomeration of producer services and manufacturing: A panel data analysis of Chinese cities. Reg. Stud. 2014, 48, 1829–1841. [Google Scholar] [CrossRef]
- Eswaran, M.; Kotwal, A. The role of the service sector in the process of industrialization. J. Dev. Econ. 2002, 68, 401–420. [Google Scholar] [CrossRef]
- Gao, J.; Li, X. Theoretical and empirical study on the interactive mechanism between producer services and manufacturing. China Ind. Econ. 2011, 6, 34–52. [Google Scholar]
- Guerrieri, P.; Meliciani, V. Technology and international competitiveness: The interdependence between manufacturing and producer services. Struct. Chang. Econ. Dyn. 2005, 16, 489–502. [Google Scholar] [CrossRef]
- Wu, X.; Huang, Y.; Gao, J. Impact of industrial agglomeration on new-type urbanization: Evidence from Pearl River Delta urban agglomeration of China. Int. Rev. Econ. Financ. 2022, 77, 312–325. [Google Scholar] [CrossRef]
- Ke, S.; Yu, Y. The pathways from industrial agglomeration to TFP growth–the experience of Chinese cities for 2001–2010. J. Asia Pac. Econ. 2014, 19, 310–332. [Google Scholar] [CrossRef]
- Li, J.-F.; Xu, H.-C.; Liu, W.-W.; Wang, D.-F.; Zheng, W.-L. Influence of collaborative agglomeration between logistics industry and manufacturing on green total factor productivity based on panel data of China’s 284 cities. IEEE Access 2021, 9, 109196–109213. [Google Scholar] [CrossRef]
- Xie, W.C.; Li, X. Can industrial agglomeration facilitate green development? Evidence from China. Front. Environ. Sci. 2021, 9, 745465. [Google Scholar] [CrossRef]
- Tanaka, K.; Managi, S. Industrial agglomeration effect for energy efficiency in Japanese production plants. Energy Policy 2021, 156, 112442. [Google Scholar] [CrossRef]
- Yuan, H.X.; Feng, Y.D.; Lee, C.C.; Cen, Y. How does manufacturing agglomeration affect green economic efficiency? Energy Econ. 2020, 92, 104944. [Google Scholar] [CrossRef]
- Han, F.; Xie, R.; Fang, J. Urban agglomeration economies and industrial energy efficiency. Energy 2018, 162, 45–59. [Google Scholar] [CrossRef]
- Wang, M.X.; Li, Y.L.; Liao, G.K. Spatial spillover and interaction between high-tech industrial agglomeration and urban ecological efficiency. Front. Environ. Sci. 2022, 10. [Google Scholar] [CrossRef]
- Yang, H.C.; Zhang, F.M.; He, Y.X. Exploring the effect of producer services and manufacturing industrial co-agglomeration on the ecological environment pollution control in China. Environ. Dev. Sustain. 2021, 23, 16119–16144. [Google Scholar] [CrossRef]
- Zhao, Y.H.; Liang, C.; Zhang, X.L. Positive or negative externalities? Exploring the spatial spillover and industrial agglomeration threshold effects of environmental regulation on haze pollution in China. Environ. Dev. Sustain. 2021, 23, 11335–11356. [Google Scholar] [CrossRef]
- Shen, N.; Peng, H. Can industrial agglomeration achieve the emission-reduction effect? Socio-Econ. Plan. Sci. 2021, 75, 100867. [Google Scholar] [CrossRef]
- Liu, J.; Qian, Y.; Song, S.; Duan, R. Industrial symbiotic agglomeration and green economic growth: A spatial difference-in-differences approach. J. Clean. Prod. 2022, 364, 132560. [Google Scholar] [CrossRef]
- LeSage, J.; Pace, R.K. Introduction to Spatial Econometrics; Chapman and Hall/CRC: Boca Raton, FL, USA, 2009. [Google Scholar]
- Xu, B.; Lin, B.Q. Investigating the role of high-tech industry in reducing China’s CO2 emissions: A regional perspective. J. Clean. Prod. 2018, 177, 169–177. [Google Scholar] [CrossRef]
- Foldvari, P.; van Leeuwen, B.; Didenko, D. Capital formation and economic growth under central planning and transition: A theoretical and empirical analysis, CA, 1920–2008. Acta Oeconomica 2015, 65, 27–50. [Google Scholar] [CrossRef] [Green Version]
- Li, Y.; Wang, X.; Westlund, H.; Liu, Y. Physical capital, human capital, and social capital: The changing roles in China’s economic growth. Growth Chang. 2015, 46, 133–149. [Google Scholar] [CrossRef]
- Zhang, J.; Wu, G.; Zhang, J. The estimation of China’s provincial capital stock:1952–2000. Econ. Res. J. 2004, 10, 35–44. [Google Scholar]
- Baharumshah, A.Z.; Almasaied, S.W. Foreign direct investment and economic growth in Malaysia: Interactions with human capital and financial deepening. Emerg. Mark. Financ. Trade 2009, 45, 90–102. [Google Scholar] [CrossRef]
- Han, J.-S.; Lee, J.-W. Demographic change, human capital, and economic growth in Korea. Jpn. World Econ. 2020, 53, 100984. [Google Scholar] [CrossRef]
- Lucas, R.E., Jr. On the mechanics of economic development. J. Monet. Econ. 1988, 22, 3–42. [Google Scholar] [CrossRef]
- Afonso, A.; Jalles, J.T. Fiscal composition and long-term growth. Appl. Econ. 2014, 46, 349–358. [Google Scholar] [CrossRef] [Green Version]
- Butkiewicz, J.L.; Yanikkaya, H. Institutions and the impact of government spending on growth. J. Appl. Econ. 2011, 14, 319–341. [Google Scholar] [CrossRef] [Green Version]
- Ji, X.P.; Dong, F.R.; Zheng, C.; Bu, N.P. The Influences of International Trade on Sustainable Economic Growth: An Economic Policy Perspective. Sustainability 2022, 14, 2781. [Google Scholar] [CrossRef]
- Liu, X.; Shu, C.; Sinclair, P. Trade, foreign direct investment and economic growth in Asian economies. Appl. Econ. 2009, 41, 1603–1612. [Google Scholar] [CrossRef] [Green Version]
- Nguyen, H.H. Impact of foreign direct investment and international trade on economic growth: Empirical study in Vietnam. J. Asian Financ. Econ. Bus. 2020, 7, 323–331. [Google Scholar] [CrossRef]
- Elhorst, J.P. Spatial Econometrics from Cross-Sectional Data to Spatial Panels; Springer: Berlin/Heidelberg, Germany, 2014. [Google Scholar]
- Dou, J.; Liu, Y. Can co-agglomeration between producer services and manufactures promote the urban economic growth?—Based on the panel data of China’s 285 cities. Mod. Financ. Econ. J. Tianjin Univ. Financ. Econ. 2016, 36, 92–102. [Google Scholar]
- Dong, X.; Chen, Y.; Zhuang, Q.Q.; Yang, Y.L.; Zhao, X.M. Agglomeration of productive services, industrial structure upgrading and green total factor productivity: An empirical analysis based on 68 prefectural-level-and-above cities in the Yellow River Basin of China. Int. J. Environ. Res. Public Health 2022, 19, 11643. [Google Scholar] [CrossRef] [PubMed]
- Guo, S.L.; Ma, H. Does industrial agglomeration promote high-quality development of the Yellow River Basin in China? Empirical test from the moderating effect of environmental regulation. Growth Chang. 2021, 52, 2040–2070. [Google Scholar] [CrossRef]
- Zhao, R.; Shen, Y. An analysis of high-quality development of service industry in the Yellow River Basin. Econ. Geogr. 2020, 40, 21–29. [Google Scholar] [CrossRef]
- Williamson, J.G. Regional inequality and the process of national development: A description of the patterns. Econ. Dev. Cult. Change 1965, 13 Pt 2, 1–84. [Google Scholar] [CrossRef]
| Disclaimer/Publisher’s Note: The statements, opinions and data contained in all publications are solely those of the individual author(s) and contributor(s) and not of MDPI and/or the editor(s). MDPI and/or the editor(s) disclaim responsibility for any injury to people or property resulting from any ideas, methods, instructions or products referred to in the content. |
© 2023 by the authors. Licensee MDPI, Basel, Switzerland. This article is an open access article distributed under the terms and conditions of the Creative Commons Attribution (CC BY) license (https://creativecommons.org/licenses/by/4.0/).


