
Spatial-Temporal Evolution and Cross-Industry Synergy of Carbon Emissions: Evidence from Key Industries in the City in Jiangsu Province, China

Abstract
:1. Introduction
2. Literature Review
3. Methodology and Data
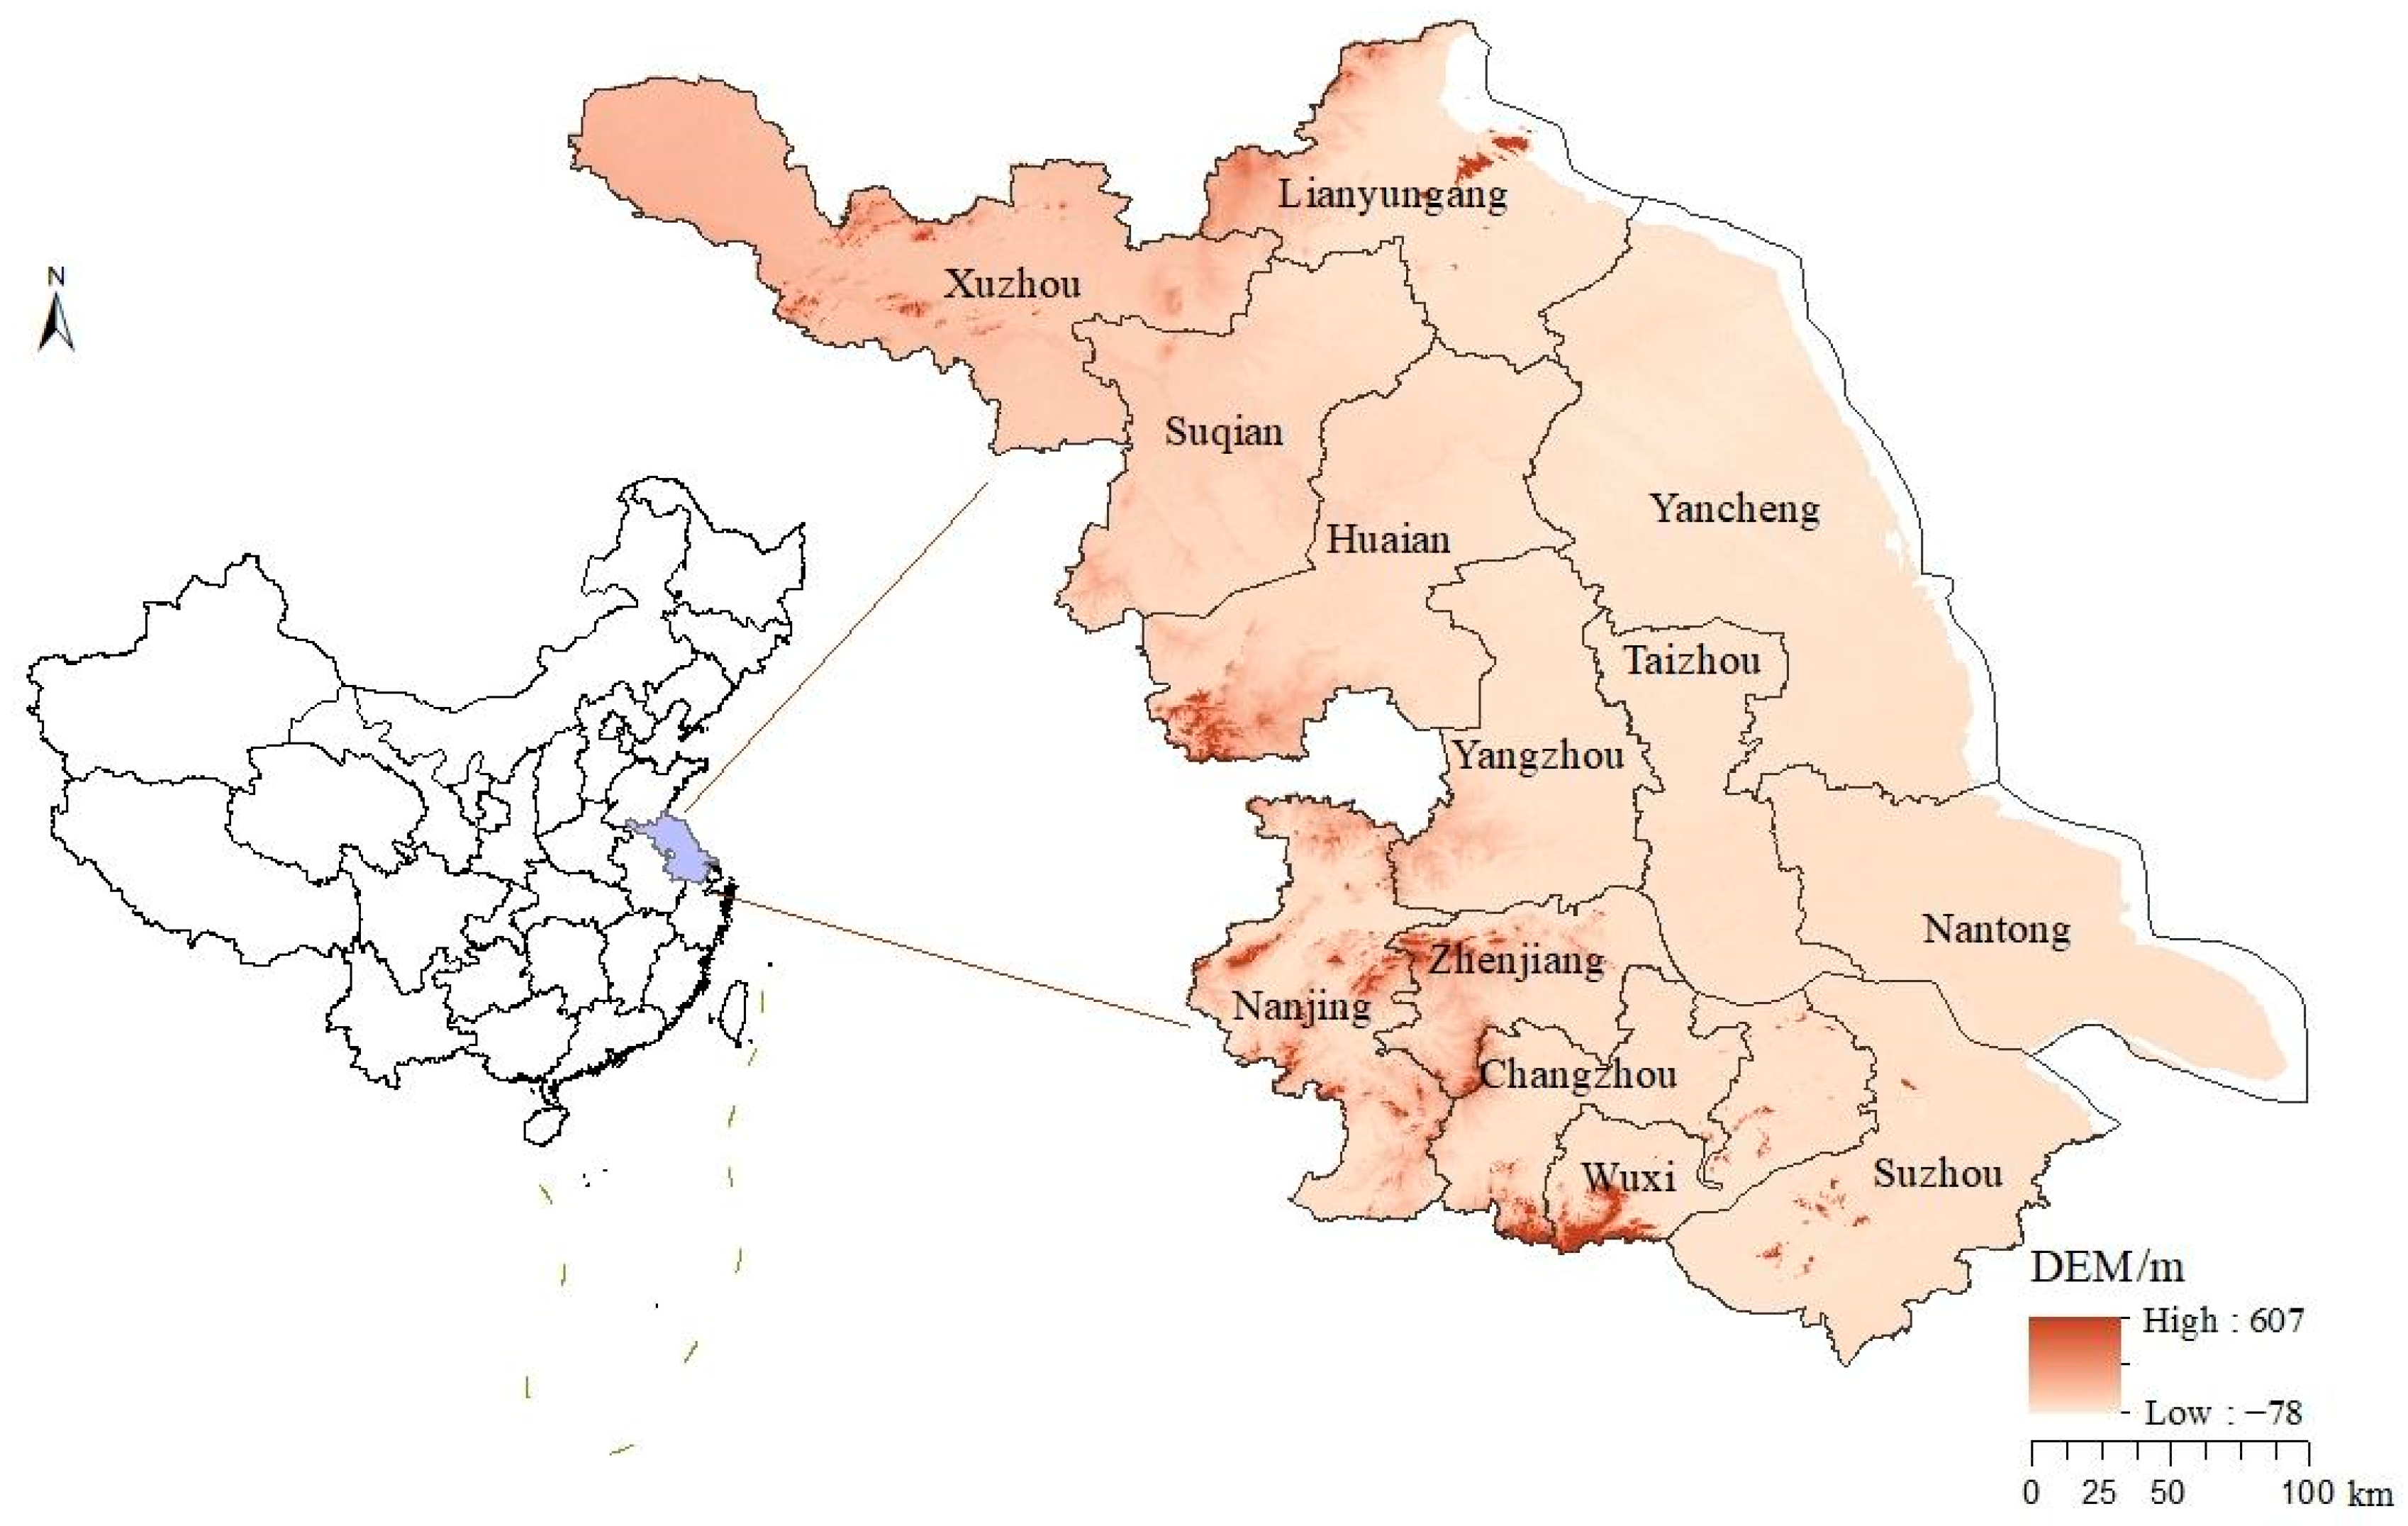
3.1. Study Area
3.2. Method
3.2.1. Empirical Orthogonal Function
3.2.2. PVAR Model
3.3. Data Sources
4. Results and Discussion
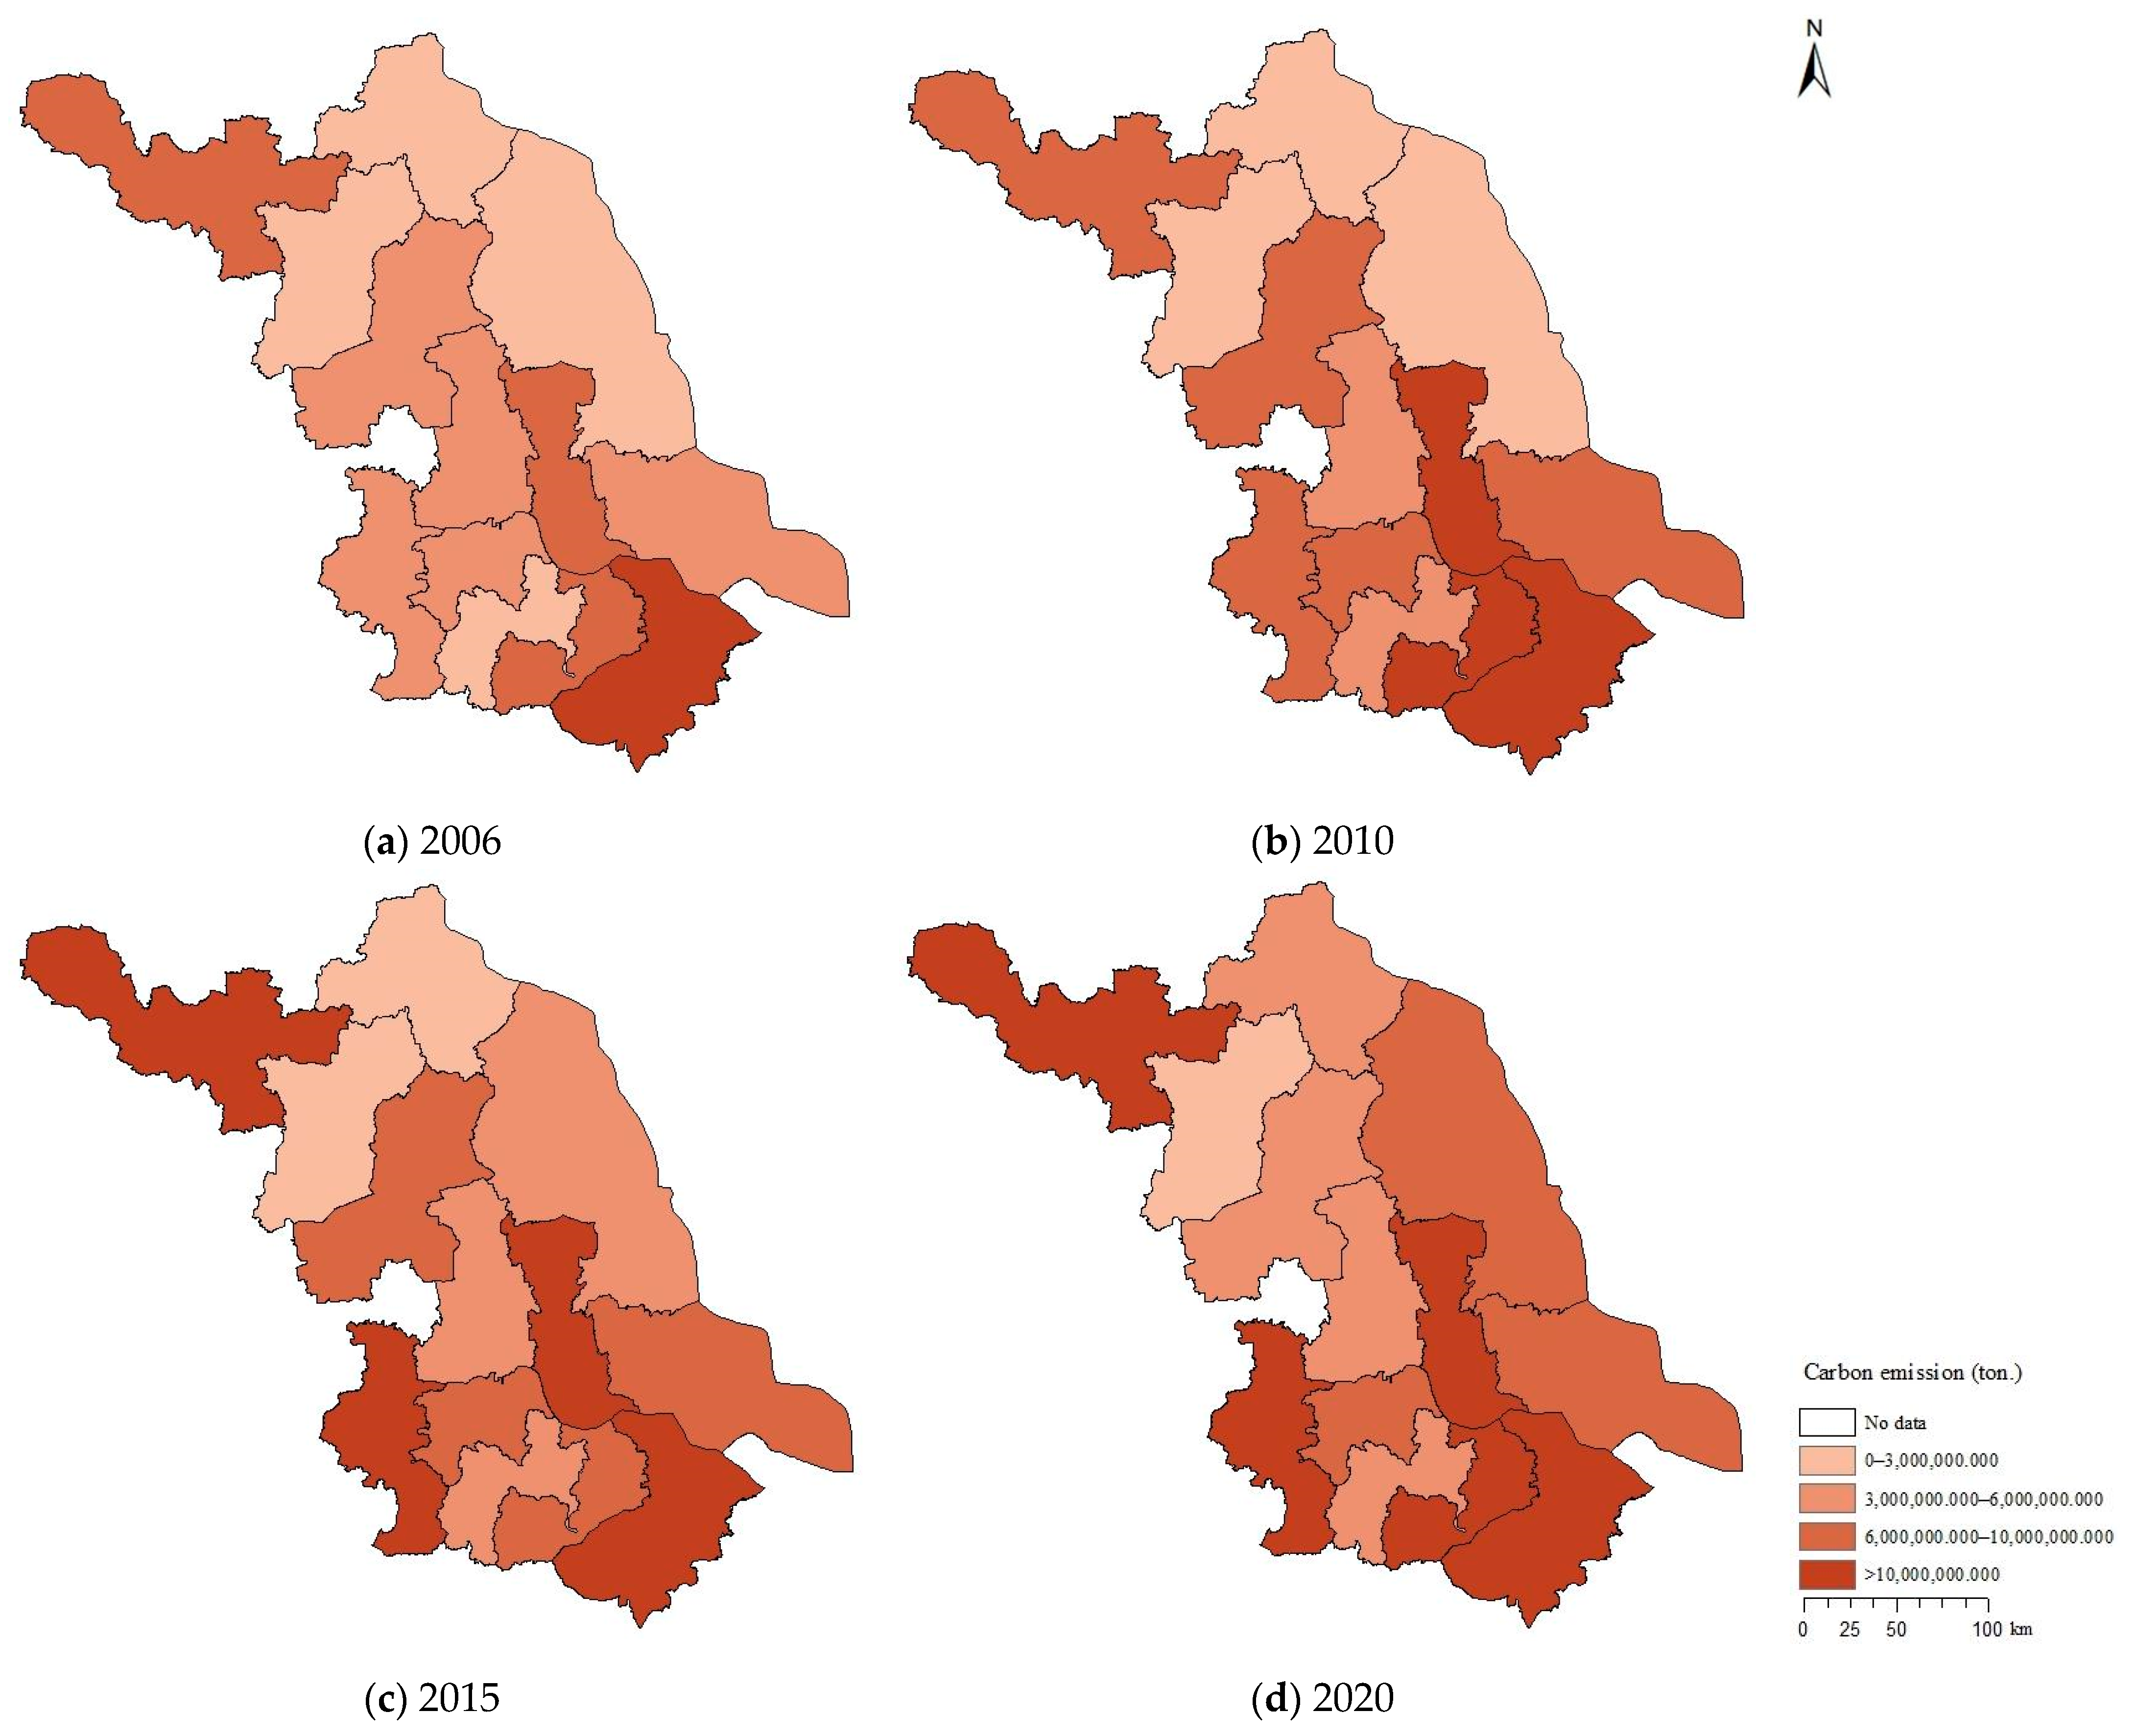
4.1. Results of Carbon Emission Measurement
4.2. The Evolution of the Spatial-Temporal Pattern
4.3. Analysis of Carbon Emission Synergies
4.3.1. Panel Data Stationarity and Co-Integration Test
4.3.2. Estimation Results of the PVAR Model
- The first-period lag of economic development has a significant positive effect on itself in both non-resource-based cities and resource-based cities, with elasticity coefficients of 0.6378 and 0.5962, respectively. The first-period lag of carbon emissions from the coal industry has a significant positive effect on itself, with elasticity coefficients of 0.0504. These findings imply that there is a general cumulative effect of time on economic development and carbon emissions from the coal industry. Therefore, cities with a stronger economic foundation and development will continue to be more resilient to external economic shocks, so economic development planning should be long-term in order to maximize the positive cumulative effect. In terms of carbon emissions, the work of reducing them will take time. It is necessary to pay close attention to the trend of carbon emission changes, break the cumulative effect of carbon emissions, and be wary of the potential rebound effect in the process of carbon emission reduction.
- The first-period lags of carbon emissions from the coal industry in resource-based cities will have a significant positive effect on economic development, with an elasticity coefficient of 0.0024, indicating that the economic development of resource-based cities has resource characteristics and their coal resource endowment is conducive to the formation of an energy-dependent industrial structure [83]. Carbon emission reduction policies will have a negative impact on economic development. However, resource-based economic development is unsustainable, so it is crucial for cities to transform their development strategies. The government should encourage the development of diverse industries in order to optimize the industrial structure and gradually reduce the reliance of economic development on energy source.
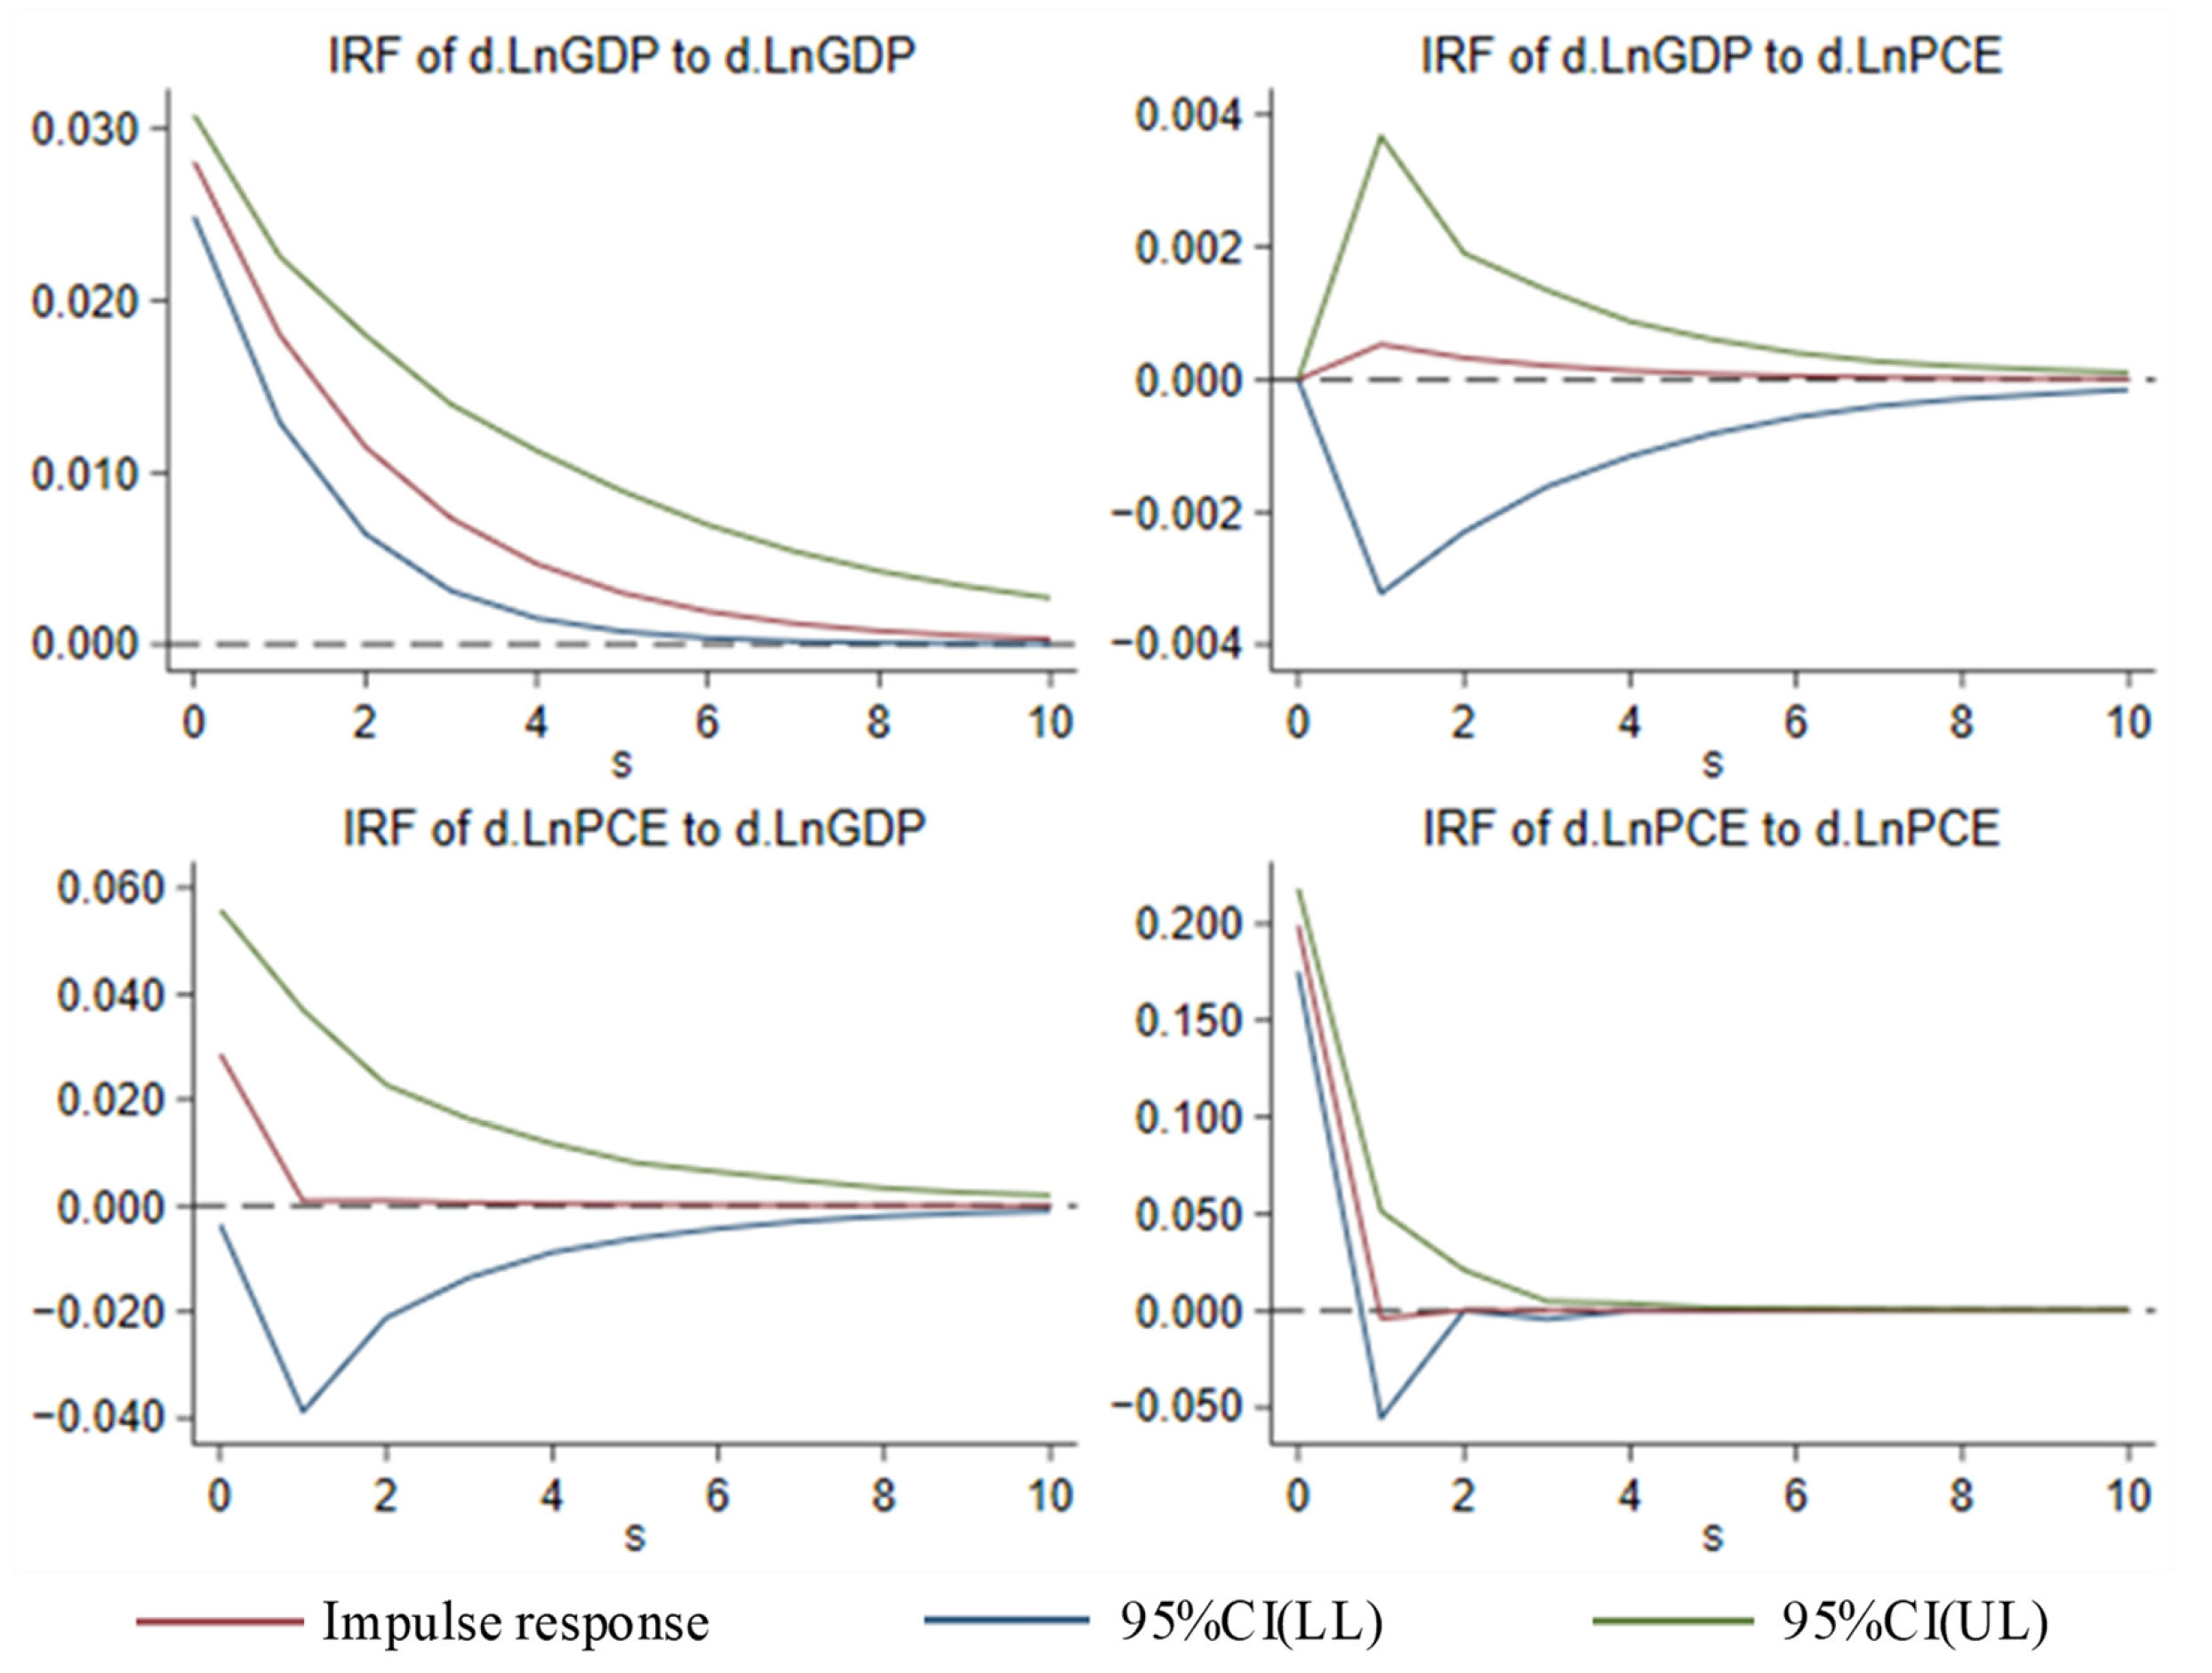
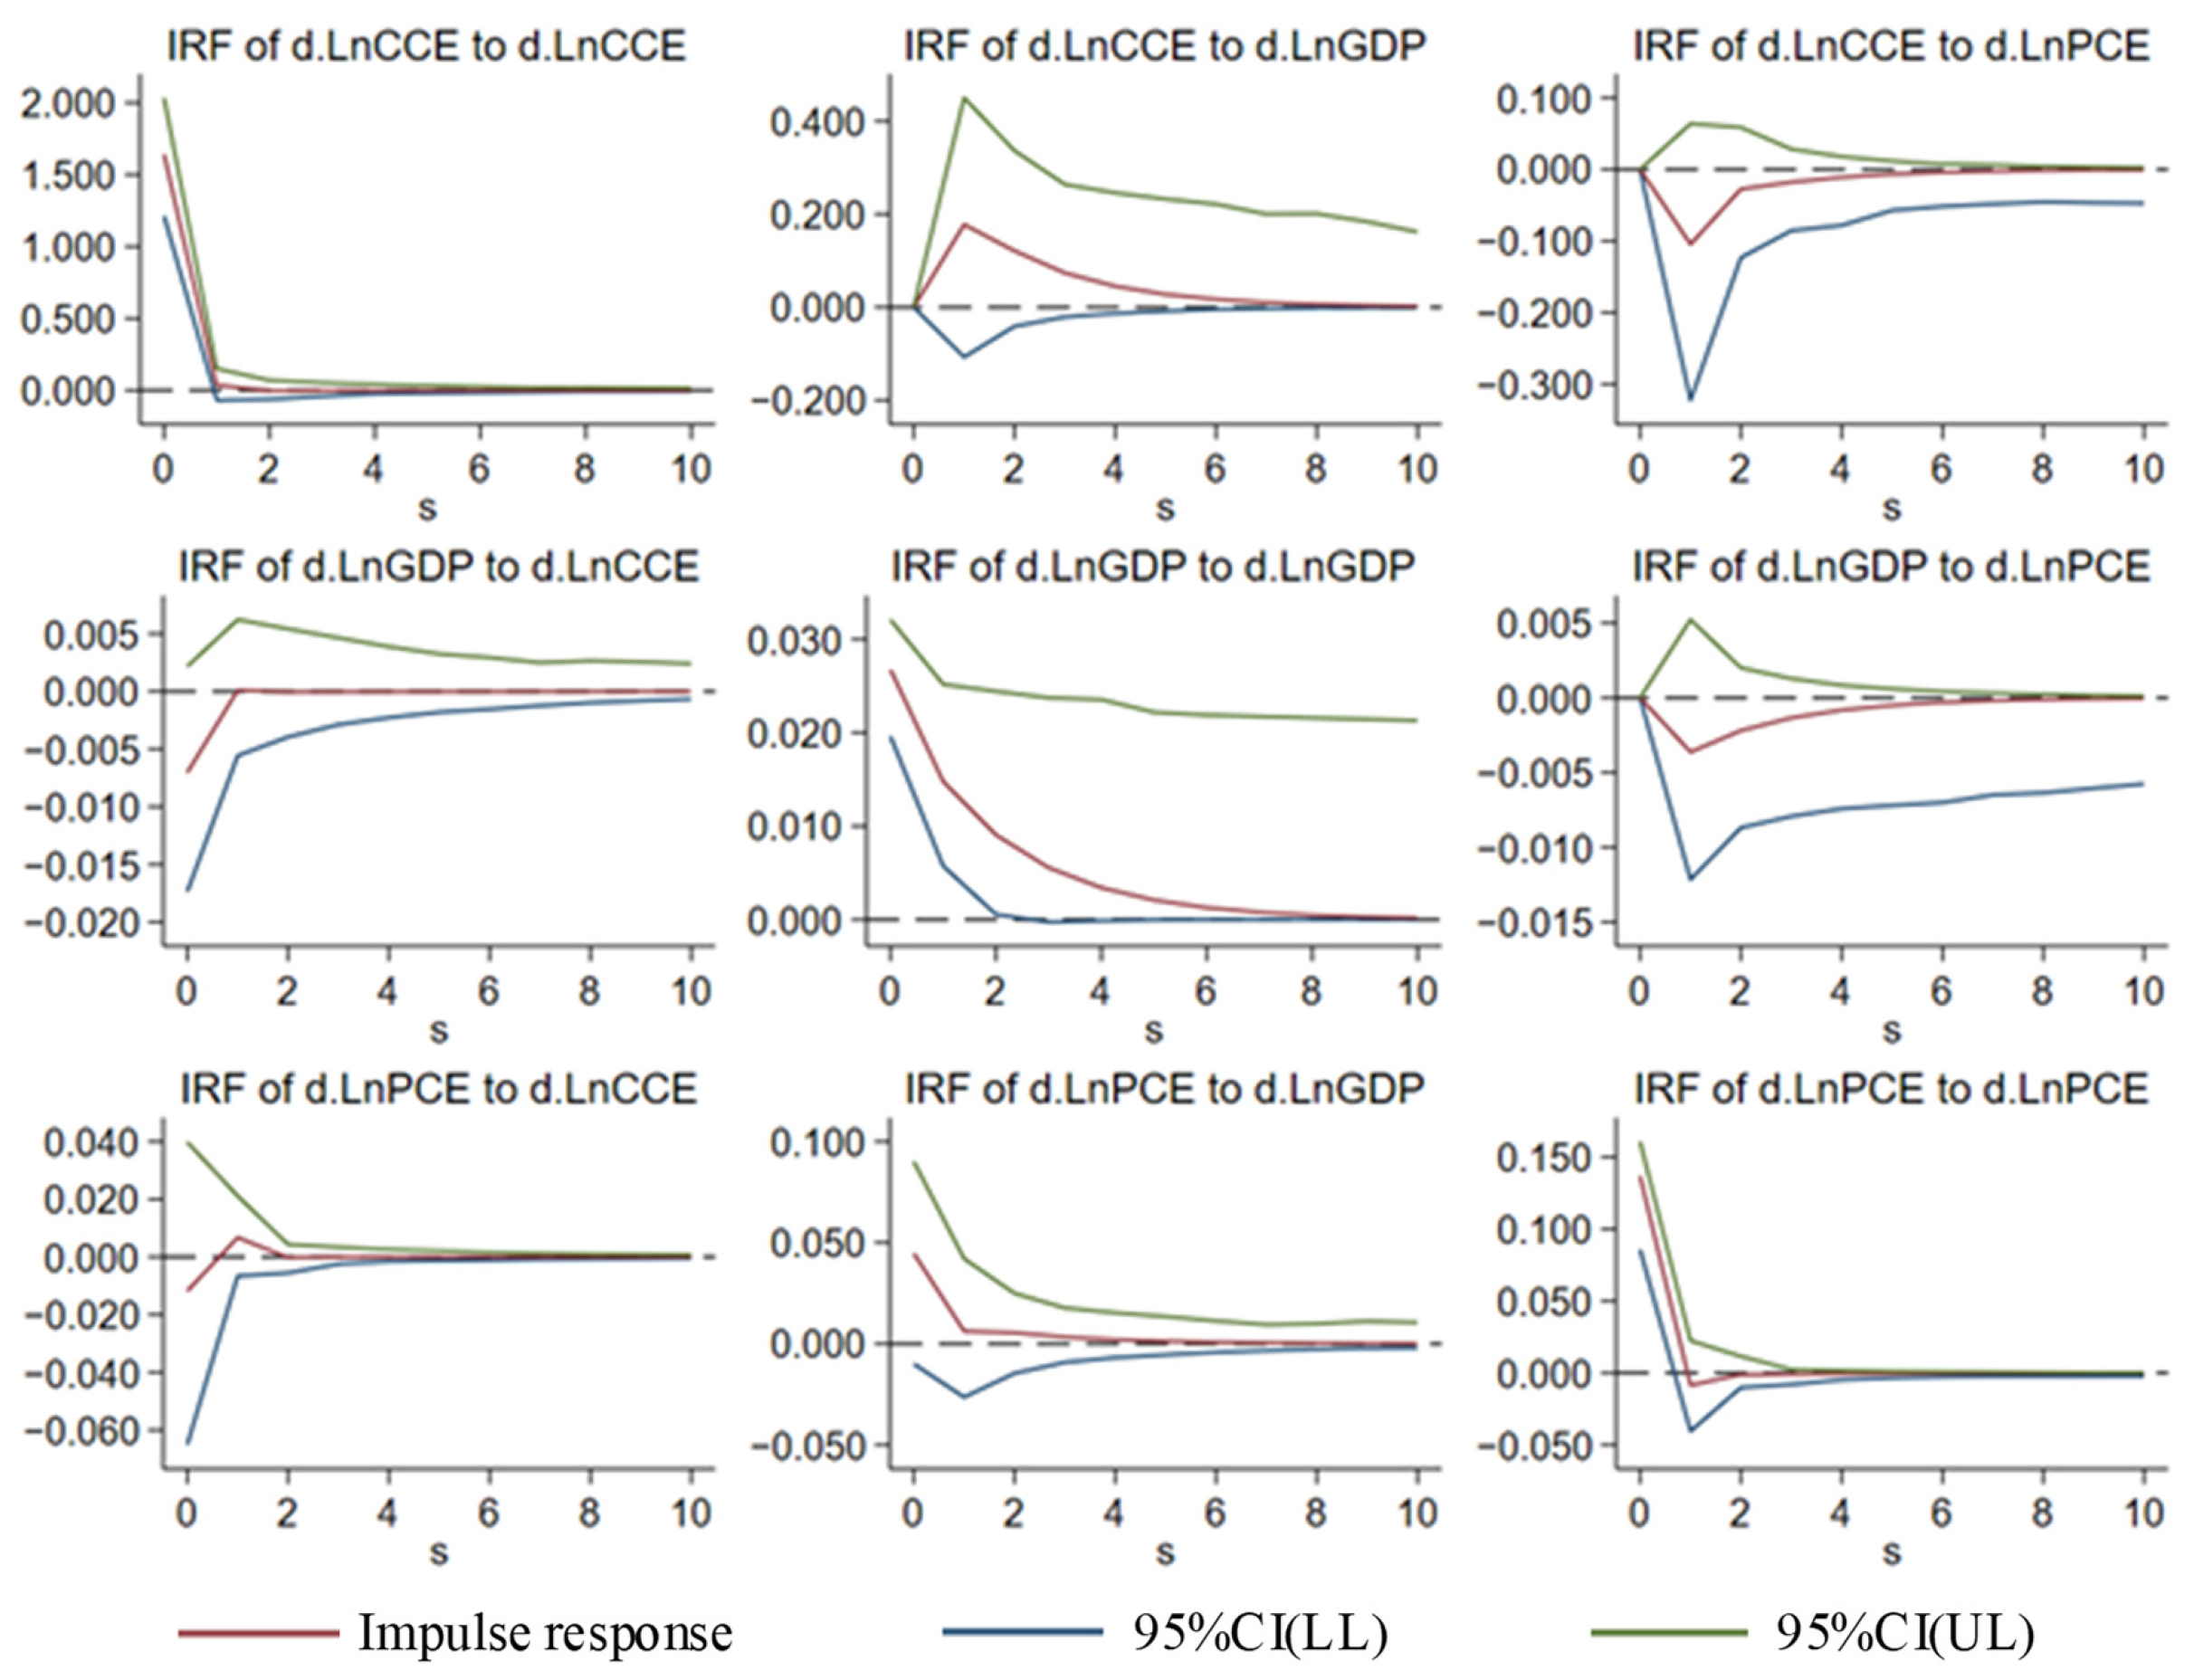
4.3.3. Impulse Response Analysis
- Carbon emissions from the power industry respond negatively to shocks in the coal industry, with the highest response in the first period, and then gradually converge to 0 after several periods. Although coal is the primary energy source and electricity is the secondary energy source, there is a certain energy substitution between coal and electricity as energy supply sources [84]. When deciding on an energy supply method, the energy consumption side of the equation will consider the cost of supplying coal versus electricity and adjust the demand for different energy types [85]. Carbon emissions from the coal industry are primarily caused by the mining and washing of coal, so an increase in carbon emissions from the coal industry implies an increase in the scale of coal production. The increase in coal supply will cause the price of coal to fall, and energy consumers may choose coal to supply energy to pursue higher corporate interests and reduce the electricity demand. In brief, because of energy substitution, the increase in carbon emissions from the coal industry may reduce carbon emissions from the electricity industry. Some studies have shown that the increase of coal price can more effectively convey the negative externalities associated with coal consumption and indirectly influence the energy consumption patterns of downstream enterprises through the industrial chain [86,87]. The production and consumption cost of coal can be raised through the regulating effect of taxes such as resource tax and environmental tax, which is an effective way to reduce coal consumption in the short term. It will promote the enterprises to actively alter the development strategies and decrease their consumption and production of coal in order to lessen the carbon emissions released throughout the coal production process.
- The impulse response of carbon emissions from the coal industry to carbon emissions from the power industry is a negative feedback in the current period and shifts to a positive direction in the first period. However, the degree of the impulse response is low. The main reason for this shift is a lag in the coal industry’s reflection of coal demand in the power industry. Coal production is not a fully market-based behavior but rather is more influenced by pre-planning and macro-regulation. In addition, the coal industry and the power industry are in the upstream and downstream of the coal supply chain, respectively, so the energy demand is not transmitted in real-time. In addition, because coal for power generation can be imported and transferred from other provinces [15], the impact of carbon emissions from the power industry on local carbon emissions from coal industry is relatively weak. In the long term, there is a positive synergy between carbon emissions from the power industry and the coal industry, which means an increase in carbon emissions from the power industry will boost carbon emissions from the coal industry. It is primarily due to the advancement of electrification in the transportation, construction, and industrial industries, which has increased the demand for electricity in each industry, and the continued development of the economy also necessitates adequate electricity supply. To meet society’s electricity demand, the coal-based electricity mix must consume more coal [88]. Therefore, lowering coal consumption and providing alternatives should be the main priorities for reducing carbon emissions from the coal production process [87]. Electrification of energy use becomes an important path to decarbonization, resulting in a large demand for electricity [89]. If the structure of the electricity supply is not changed, it will promote an increase in carbon emissions from the power industry and the coal industry. We must recognize that investment in renewable energy is a fundamental way to replace coal consumption in thermal power grids [89,90]. While promoting the electrification of the industries, it is necessary to accelerate the development of a new type of power system based primarily on clean energy and to promote the low-carbon transformation of the power structure. However, many studies show that renewable energy substitution is a long-term and slow process [87,91]. In the initial stage, a large capital investment is required, and the emission reduction and substitution effect is relatively limited, which needs time to accumulate before showing a sufficient effect. However, using renewable energy to replace coal is beneficial to the economy in the long run [90]. It is necessary to have a long-term plan for promoting clean power substitution for coal, and to provide guarantee measures for stable energy substitution through financial subsidies and R&D investment.
- The shock effect of carbon emissions from the power industry on economic development is positive. The effect of the shock caused by carbon emissions from the coal industry on economic development is positive in the first period. The results support the findings of Acheampong [92] and Menyah and Wolde-Rufael [93]: that carbon emissions promote economic growth. However, they contradict the findings of Lu [94]. They indicate that carbon emissions in key industries have not yet decoupled from economic development. The coal and power industries are characterized by extensive development, and we should pay attention to the critical role of fossil energy in economic growth. It is important to be wary of the deregulation of carbon emissions in some regions in pursuit of rapid economic growth and to rein the behavior of some enterprises in creating higher economic benefits by sacrificing the environment. Currently, we need to develop advanced energy conversion and production technologies to improve energy utilization efficiency and the level of economic growth per unit of carbon emissions [95]. Then, in order to promote the decoupling of economic development from carbon emissions, we should focus on the development of clean energy. Upgrading industrial structure through green technological innovation and increasing the proportion of tertiary industries are good ways to promote lighter and cleaner industry, which not only promote an energy-driven economy into a technology-driven and innovation-driven economy, but also facilitate the decoupling of the economy from carbon emissions [96].
- In resource-based cities, economic development has a negative shock effect on carbon emissions from the coal industry and power industry. Because people’s demand for environmental quality rises as their income rises and coal resources become scarcer, resource-based cities are actively seeking the path to green transformation, so economic development represents a suppressive effect on carbon emissions. If economic development is considered as an intrinsic motivation in the process of carbon emission reduction, it will greatly improve the efficiency of carbon emission reduction. In non-resource-based cities, the effect of the shock caused by economic development on carbon emissions from the power industry is positive in the first period. This is mainly because the increase in demand for electricity caused by economic development has resulted in an increase in the power industry capacity, which in turn has led to an increase in carbon emissions in the power generation process. This is consistent with the findings of He et al. [97]: that economic growth is the dominant driver of increased carbon emissions in the power industry. Therefore, we should continue to explore mechanisms for the coordinated and healthy development of clean energy generation and coal-fired power, and improve clean energy supply technologies to reduce the increase in carbon emissions in the power industry caused by economic development.
4.3.4. Variance Decomposition
- In resource-based cities, the contribution of carbon emissions from the coal industry to the change in carbon emissions from the power industry is greater than the contribution of carbon emissions from the power industry to the change in carbon emissions from the coal industry. This could be because local coal resources are mainly used to meet local coal demand, while the coal demand of the power industry can also be met by resources from outside the province.
- Economic development contributes more to variation in carbon emissions from the power sector than it does to carbon emissions from the coal industry. This is probably because economic growth is more likely to be reflected in an increase in electricity demand. In comparison to the coal industry, the power industry has stronger and more extensive links with other industries, as electricity is the main mode of energy supply for many industries. Economic development is the main driver of increased electricity consumption, which also provides financial security for the transformation of the electricity structure. It is essential to actively promote the development of a low-carbon economy. By increasing the demand for clean electricity, the low-carbon economy can facilitate a shift in the electricity structure from thermal generation to clean energy generation [98]. The low-carbon economy could also provide sufficient funds for the transformation of green power generation technologies. It is not only conducive to increasing investment in renewable energy generation, but it also supports the research and development of core technologies for carbon reduction [99].
- I contribution of carbon emissions from the coal industry to changes in economic development is decreasing, while the contribution of the power industry is gradually increasing, but the former is always higher than the latter. This indicates that although the green transformation of cities has gradually reduced the reliance on coal resources for economic growth, coal resources remain the main driver of economic growth. As electrification has strengthened the linkages between the power industry and other industries, which increases the importance of the power industry, the power industry has a growing impact on economic development. Resource-based cities should improve the urban industrial system and plan the regional industrial layout in an integrated manner. By extending the coal industry chain and developing coal substitution industries, they can transform traditional industries and develop new leading industries, which is beneficial to reducing the over-dependence of regional economic and industrial development on resources and accelerating the transformation of old and new dynamics of economic development [100]. The construction of new electric power systems in non-resource-based cities should take the economic development goals as constraints while ensuring energy supply security. To realize deep decarbonization of economic development, non-resource-based cities should strictly control new coal power projects, enhance the capacity of renewable energy consumption, and establish a green power trading market [101].
4.3.5. Granger Causality Test
5. Conclusions and Recommendations
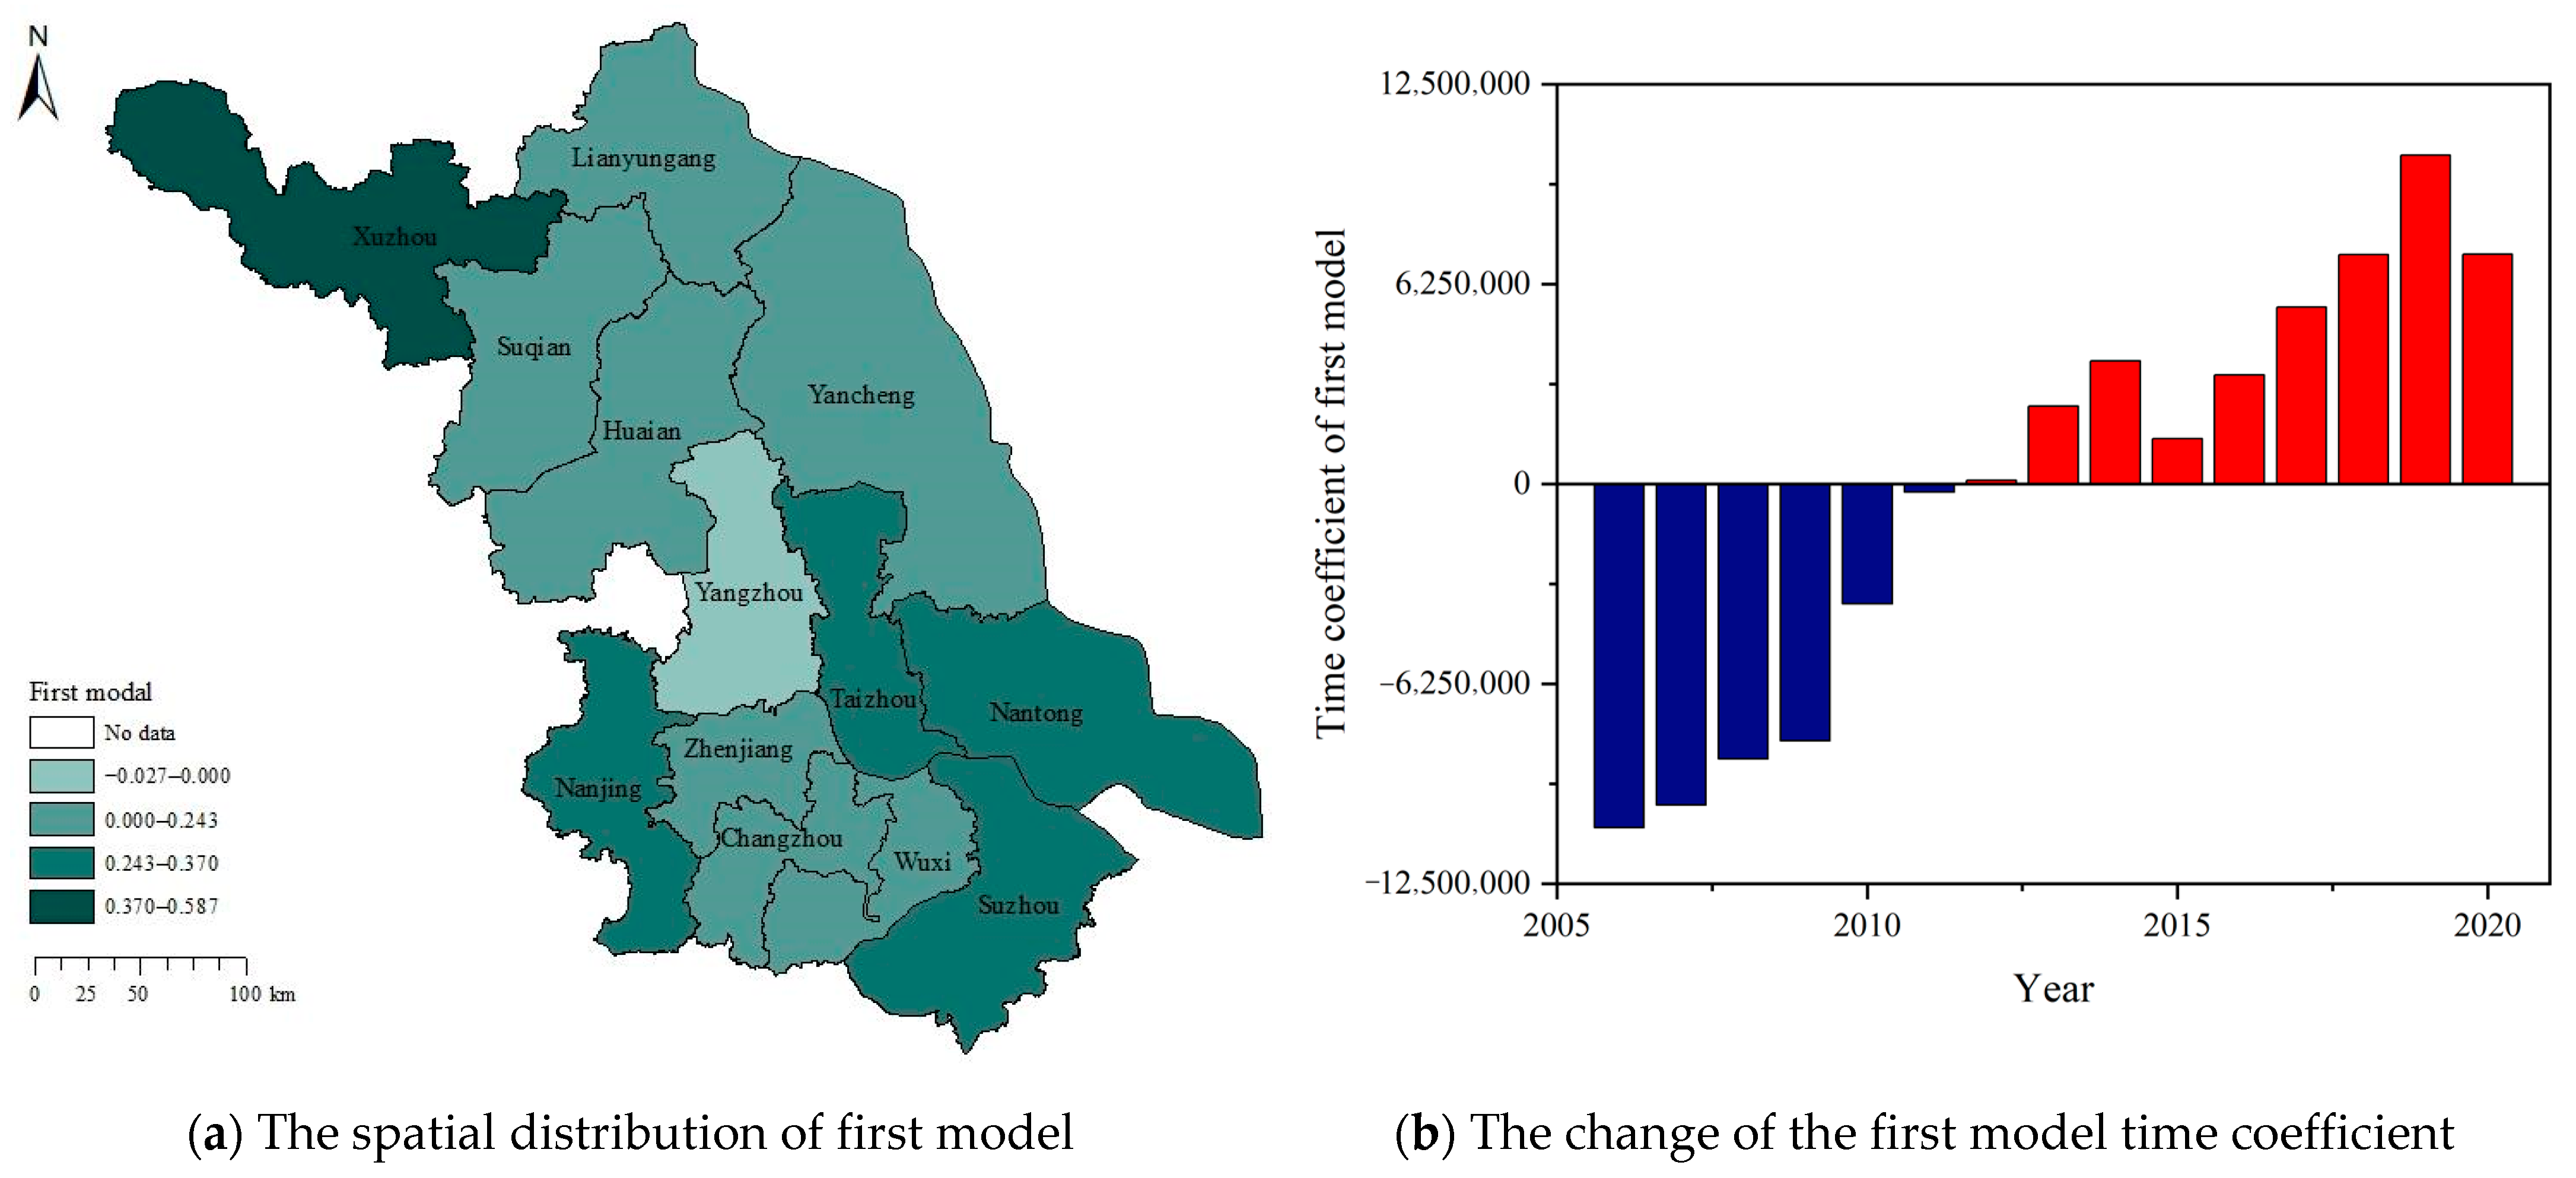
- From the perspective of spatial distribution, there is a close relationship between carbon emissions and coal resource distribution in the coal industry, and the time coefficients of EOF decomposition show an “N”-shaped variation, with the type of spatial distribution varying with the positive and negative values of temporal coefficients. In the power industry, the first model of the EOF shows a consistent trend of carbon emissions across the entire region, with the time coefficients showing a continuous upward trend and the typicality of the spatial distribution showing weakening firstly and then strengthening in the opposite direction. The second model of the EOF is characterized by a “south-north” inverse phase distribution, with a “U-shaped” change in time coefficients, which is characterized by interannual variability, and the typicality of spatial distribution undergoes three changes.
- In terms of long-term development, there is a synergistic effect from carbon emissions of the power industry to carbon emissions of the coal industry, which is closely related to the supply and demand of coal. However, the results of the variance decomposition and causality test indicate that the synergistic relationship between the carbon emissions of the coal industry and power industry is relatively weak. We should improve the degree of synergy between carbon emissions of key industries through technological innovation and cross-industry materials development. It is essential to start from the energy consumption side to reduce emissions, which can reduce coal production by reducing the demand for coal, thereby reducing carbon emissions on the production side.
- The increase in carbon emissions will promote economic development; the economic development of resource-based cities in particular has resource characteristics. There is a unidirectional causal relationship between carbon emissions from the coal industry to economic development. However, the improvement of economic development in resource-based cities will suppress carbon emissions from the coal and power industries. Thus, resource-based cities should use economic development as an internal impetus to promote urban green transformation, and non-resource-based cities should focus on promoting the decoupling of the economy from carbon emissions.
- Promote differentiated carbon emission reduction efforts, taking into account the characteristics of urban development. The typical spatial distribution of carbon emissions in the coal industry and power industry side-by-side reflects some irrationality in dividing regions and implementing carbon emission reduction policies based on traditional geographical locations. Therefore, when developing carbon-reduction strategies, we should adhere to formulating and implementing policies in accordance with local conditions, taking into account the local economic development and resource endowment. For example, non-resource-based cities should prioritize the quality of economic development and adjust the supply structure of power industry. They could mitigate the impact of economic development on the promotion of carbon emissions from the power industry by pursuing a clean energy supply aggressively. The energy-rich regions are constrained by resource endowment and industrial base. Natural resources underpin their economic development. In order to accelerate the transition between old and new economic dynamics and break the “lock-in effect” of energy-driven economic development, they should optimize their industrial structure by encouraging energy-saving technological innovation and increasing the proportion of tertiary industries.
- Identify ideas to reduce carbon emissions through cross-industry synergies. The results of the study show that there is a synergistic effect of carbon emissions between key industries, from the energy consumption side to the energy production side. Therefore, it is important to start from the energy consumption side when formulating cross-industry synergistic carbon emission reduction policies. First of all, we must reduce the reliance on fossil energy on the consumption side. Then, we must reduce the production of fossil energy at the production side by lowering demand, thereby promoting the green and low-carbon transformation of the entire energy supply chain. For example, enhance the substitution of electricity for fossil energy by increasing the electrification of the energy consumption side of the industry. Next, develop clean energy vigorously and establish a new power system with new energy as the mainstay to promote the low-carbon transformation of the energy and power structure, which will help to reduce the overall demand for fossil energy for social development.
- Strengthen the synergy of carbon emissions reduction among key industries. To promote the expansion of energy conservation and emission reduction policies from individual industries to multiple industries, it is crucial to thoroughly comprehend the synergistic effect of carbon emissions among key industries and establish a coordinated and complementary mechanism for reducing pollution and carbon emissions in key industries first. Secondly, an innovation system of energy-saving and carbon-reducing should be built. In order to fully exploit and improve the synergistic effect between industries, it will help to break down industry barriers through research and development and the promotion of low-carbon and green technologies such as energy substitution, energy gradient utilization and optimization, and resource recycling.
- Facilitate the harmonious development of environmental protection and economy. Stable economic development is a prerequisite for carbon emission reduction; it is essential to consider economic development as an endogenous driving force for carbon emission reduction. With the construction of the carbon emission trading market, the market-based mechanism will mobilize the enthusiasm of enterprises to save energy and reduce carbon emissions, lowering the cost of emission reduction and achieving both economic and social benefits. Furthermore, in order to break the cumulative effect of carbon emissions, a monitoring and verification platform of carbon emissions based on the carbon emission trading market can be established to grasp the carbon emission dynamics in real-time, allowing problems to be detected and carbon emission reduction policies to be optimized and adjusted in time.
Author Contributions
Funding
Institutional Review Board Statement
Informed Consent Statement
Data Availability Statement
Acknowledgments
Conflicts of Interest
References
- Liu, J.; Li, S.; Ji, Q. Regional differences and driving factors analysis of carbon emission intensity from transport sector in China. Energy 2021, 224, 120178. [Google Scholar] [CrossRef]
- Dong, F.; Bian, Z.; Yu, B.; Wang, Y.; Zhang, S.; Li, J.; Su, B.; Long, R. Can land urbanization help to achieve CO2 intensity reduction target or hinder it? Evidence from China. Resour. Conserv. Recycl. 2018, 134, 206–215. [Google Scholar] [CrossRef]
- Liu, Z.; Deng, Z.; He, G.; Wang, H.L.; Zhang, X.; Lin, J.; Qi, Y.; Liang, X. Challenges and opportunities for carbon neutrality in China. Nat. Rev. Earth Environ. 2022, 3, 141–155. [Google Scholar] [CrossRef]
- Zhou, D.; Huang, Q.; Chong, Z. Analysis on the effect and mechanism of land misallocation on carbon emissions efficiency: Evidence from China. Land Use Policy 2022, 121, 106336. [Google Scholar] [CrossRef]
- Cai, B.; Guo, H.; Ma, Z.; Wang, Z.; Dhakal, S.; Cao, L. Benchmarking carbon emissions efficiency in Chinese cities: A comparative study based on high-resolution gridded data. Appl. Energy 2019, 242, 994–1009. [Google Scholar] [CrossRef]
- Wang, X.; Cai, Y.; Liu, G.; Zhang, M.; Bai, Y.; Zhang, F. Carbon emission accounting and spatial distribution of industrial entities in Beijing—Combining nighttime light data and urban functional areas. Ecol. Inform. 2022, 70, 101759. [Google Scholar] [CrossRef]
- Xia, D.; Zhang, L. Coupling coordination degree between coal production reduction and CO2 emission reduction in coal industry. Energy 2022, 258, 124902. [Google Scholar] [CrossRef]
- Yan, D.; Lei, Y.; Li, L.; Song, W. Carbon emission efficiency and spatial clustering analyses in China’s thermal power industry: Evidence from the provincial level. J. Clean. Prod. 2017, 156, 518–527. [Google Scholar] [CrossRef]
- Sun, J.; Dong, F. Decomposition of carbon emission reduction efficiency and potential for clean energy power: Evidence from 58 countries. J. Clean. Prod. 2022, 363, 132312. [Google Scholar] [CrossRef]
- Jiang, P.; Khishgee, S.; Alimujiang, A.; Dong, H. Cost-effective approaches for reducing carbon and air pollution emissions in the power industry in China. J. Environ. Manag. 2020, 264, 110452. [Google Scholar] [CrossRef]
- Wu, C.B.; Guan, P.B.; Zhong, L.N.; Lv, J.; Hu, X.F.; Huang, G.H.; Li, C.C. An optimized low-carbon production planning model for power industry in coal-dependent regions—A case study of Shandong, China. Energy 2020, 192, 116636. [Google Scholar] [CrossRef]
- Jiang, H.; Wu, J.; Lv, L.H. Analysis and suggestions for achieving carbon peaking in a coordinated and orderly manner across the country. Environ. Prot. 2022, 50, 40–44. (In Chinese) [Google Scholar] [CrossRef]
- Jiang, L.; Zhou, H.; He, S. Does energy efficiency increase at the expense of output performance: Evidence from manufacturing firms in Jiangsu province, China. Energy 2021, 220, 119704. [Google Scholar] [CrossRef]
- Wang, S.; Ma, Y. Influencing factors and regional discrepancies of the efficiency of carbon dioxide emissions in Jiangsu, China. Ecol. Indic. 2018, 90, 460–468. [Google Scholar] [CrossRef]
- He, Z.; Xu, S.; Shen, W.; Long, R.; Yang, H. Overview of the development of the Chinese Jiangsu coastal wind-power industry cluster. Renew. Sustain. Energy Rev. 2016, 57, 59–71. [Google Scholar] [CrossRef]
- Wu, S.; Hu, S.; Frazier, A.E.; Hu, Z. China’s urban and rural residential carbon emissions: Past and future scenarios. Resour. Conserv. Recycl. 2023, 190, 106802. [Google Scholar] [CrossRef]
- Yang, J.; Deng, Z.; Guo, S.; Chen, Y. Development of bottom-up model to estimate dynamic carbon emission for city-scale buildings. Appl. Energy 2023, 331, 120410. [Google Scholar] [CrossRef]
- Zhou, H.; Wei, L.; Wang, D.; Zhang, W. Environmental impacts and optimizing strategies of municipal sludge treatment and disposal routes in China based on life cycle analysis. Environ. Int. 2022, 166, 107378. [Google Scholar] [CrossRef]
- Cao, H.; Li, H.; Cheng, H.; Luo, Y.; Yin, R.; Chen, Y. A carbon efficiency approach for life-cycle carbon emission characteristics of machine tools. J. Clean. Prod. 2012, 37, 19–28. [Google Scholar] [CrossRef]
- Guo, Z.; Li, T.; Peng, S.; Wang, X.; Zhang, H. When will China’s passenger vehicle sector reach CO2 emissions peak? A life cycle approach based on system dynamics. Sustain. Prod. Consum. 2022, 33, 508–519. [Google Scholar] [CrossRef]
- Jordaan, S.M.; Ruttinger, A.W.; Surana, K.; Nock, D.; Miller, S.M.; Ravikumar, A.P. Global mitigation opportunities for the life cycle of natural gas-fired power. Nat. Clim. Chang. 2022, 12, 1059–1067. [Google Scholar] [CrossRef]
- Li, X.-J.; Xie, W.-J.; Xu, L.; Li, L.-L.; Jim, C.Y.; Wei, T.-B. Holistic life-cycle accounting of carbon emissions of prefabricated buildings using LCA and BIM. Energy Build. 2022, 266, 112136. [Google Scholar] [CrossRef]
- Xu, X.; You, J.; Wang, Y.; Luo, Y. Analysis and assessment of life-cycle carbon emissions of space frame structures. J. Clean. Prod. 2023, 385, 135521. [Google Scholar] [CrossRef]
- Alam, M.K.; Bell, R.W.; Biswas, W.K. Increases in soil sequestered carbon under conservation agriculture cropping decrease the estimated greenhouse gas emissions of wetland rice using life cycle assessment. J. Clean. Prod. 2019, 224, 72–87. [Google Scholar] [CrossRef]
- Kolb, S.; Plankenbühler, T.; Hofmann, K.; Bergerson, J.; Karl, J. Life cycle greenhouse gas emissions of renewable gas technologies: A comparative review. Renew. Sustain. Energy Rev. 2021, 146, 111147. [Google Scholar] [CrossRef]
- Ling, Y.; Xia, S.; Cao, M.; He, K.; Lim, M.K.; Sukumar, A.; Yi, H.; Qian, X. Carbon emissions in China’s thermal electricity and heating industry: An input-output structural decomposition analysis. J. Clean. Prod. 2021, 329, 129608. [Google Scholar] [CrossRef]
- Bruckner, B.; Hubacek, K.; Shan, Y.L.; Zhong, H.L.; Feng, K.S. Impacts of poverty alleviation on national and global carbon emissions. Nat. Sustain. 2022, 5, 311–320. [Google Scholar] [CrossRef]
- Ma, R.; Zheng, X.; Zhang, C.; Li, J.; Ma, Y. Distribution of CO2 emissions in China’s supply chains: A sub-national MRIO analysis. J. Clean. Prod. 2022, 345, 130986. [Google Scholar] [CrossRef]
- Wang, G.; Peng, W.; Xiang, J.; Ning, L.; Yu, Y. Modelling spatiotemporal carbon dioxide emission at the urban scale based on DMSP-OLS and NPP-VIIRS data: A case study in China. Urban Clim. 2022, 46, 101326. [Google Scholar] [CrossRef]
- Yang, S.; Yang, X.; Gao, X.; Zhang, J. Spatial and temporal distribution characteristics of carbon emissions and their drivers in shrinking cities in China: Empirical evidence based on the NPP/VIIRS nighttime lighting index. J. Environ. Manag. 2022, 322, 116082. [Google Scholar] [CrossRef]
- Zhou, K.; Yang, J.; Yang, T.; Ding, T. Spatial and temporal evolution characteristics and spillover effects of China’s regional carbon emissions. J. Environ. Manag. 2023, 325, 116423. [Google Scholar] [CrossRef]
- Li, L.; Mi, Y.; Lei, Y.; Wu, S.; Li, L.; Hua, E.; Yang, J. The spatial differences of the synergy between CO2 and air pollutant emissions in China’s 296 cities. Sci. Total Environ. 2022, 846, 157323. [Google Scholar] [CrossRef]
- Zhu, E.; Qi, Q.; Chen, L.; Wu, X. The spatial-temporal patterns and multiple driving mechanisms of carbon emissions in the process of urbanization: A case study in Zhejiang, China. J. Clean. Prod. 2022, 358, 131954. [Google Scholar] [CrossRef]
- Xu, C. Economic inequality and carbon inequality: Multi-evidence from China’s cities and counties. J. Environ. Manag. 2023, 327, 116871. [Google Scholar] [CrossRef]
- Wang, J.; Wei, J.; Zhang, W.; Liu, Z.; Du, X.; Liu, W.; Pan, K. High-resolution temporal and spatial evolution of carbon emissions from building operations in Beijing. J. Clean. Prod. 2022, 376, 134272. [Google Scholar] [CrossRef]
- Liu, Q.; Song, J.; Dai, T.; Shi, A.; Xu, J.; Wang, E. Spatio-temporal dynamic evolution of carbon emission intensity and the effectiveness of carbon emission reduction at county level based on nighttime light data. J. Clean. Prod. 2022, 362, 132301. [Google Scholar] [CrossRef]
- Yang, D.; Luan, W.; Qiao, L.; Pratama, M. Modeling and spatio-temporal analysis of city-level carbon emissions based on nighttime light satellite imagery. Appl. Energy 2020, 268, 114696. [Google Scholar] [CrossRef]
- Chen, L.; Xu, L.; Cai, Y.; Yang, Z. Spatiotemporal patterns of industrial carbon emissions at the city level. Resour. Conserv. Recycl. 2021, 169, 105499. [Google Scholar] [CrossRef]
- Zhang, H.; Li, S. Carbon emissions’ spatial-temporal heterogeneity and identification from rural energy consumption in China. J. Environ. Manag. 2022, 304, 114286. [Google Scholar] [CrossRef]
- Liu, X.-J.; Jin, X.-B.; Luo, X.-L.; Zhou, Y.-K. Multi-scale variations and impact factors of carbon emission intensity in China. Sci. Total Environ. 2023, 857, 159403. [Google Scholar] [CrossRef]
- Han, X.; Yu, J.; Xia, Y.; Wang, J. Spatiotemporal characteristics of carbon emissions in energy-enriched areas and the evolution of regional types. Energy Rep. 2021, 7, 7224–7237. [Google Scholar] [CrossRef]
- Li, W.; Ji, Z.; Dong, F. Spatio-temporal evolution relationships between provincial CO2 emissions and driving factors using geographically and temporally weighted regression model. Sustain. Cities Soc. 2022, 81, 103836. [Google Scholar] [CrossRef]
- Ke, N.; Lu, X.; Kuang, B.; Zhang, X. Regional disparities and evolution trend of city-level carbon emission intensity in China. Sustain. Cities Soc. 2023, 88, 104288. [Google Scholar] [CrossRef]
- Dong, F.; Yu, B.; Pan, Y. Examining the synergistic effect of CO2 emissions on PM2.5 emissions reduction: Evidence from China. J. Clean. Prod. 2019, 223, 759–771. [Google Scholar] [CrossRef]
- Dong, F.; Hu, M.; Gao, Y.; Liu, Y.; Zhu, J.; Pan, Y. How does digital economy affect carbon emissions? Evidence from global 60 countries. Sci. Total Environ. 2022, 852, 158401. [Google Scholar] [CrossRef]
- Dong, F.; Li, Y.; Qin, C.; Zhang, X.; Chen, Y.; Zhao, X.; Wang, C. Information infrastructure and greenhouse gas emission performance in urban China: A difference-in-differences analysis. J. Environ. Manag. 2022, 316, 115252. [Google Scholar] [CrossRef]
- Zhang, L.; Shen, Q.; Wang, M.; Sun, N.; Wei, W.; Lei, Y.; Wang, Y. Driving factors and predictions of CO2 emission in China’s coal chemical industry. J. Clean. Prod. 2019, 210, 1131–1140. [Google Scholar] [CrossRef]
- He, J.; Yue, Q.; Li, Y.; Zhao, F.; Wang, H. Driving force analysis of carbon emissions in China’s building industry: 2000–2015. Sustain. Cities Soc. 2020, 60, 102268. [Google Scholar] [CrossRef]
- Jiang, T.; Yang, J.; Huang, S. Evolution and driving factors of CO2 emissions structure in China’s heating and power industries: The supply-side and demand-side dual perspectives. J. Clean. Prod. 2020, 264, 121507. [Google Scholar] [CrossRef]
- Quan, C.; Cheng, X.; Yu, S.; Ye, X. Analysis on the influencing factors of carbon emission in China’s logistics industry based on LMDI method. Sci. Total Environ. 2020, 734, 138473. [Google Scholar] [CrossRef]
- Wei, W.D.; Li, J.S.; Chen, B.; Wang, M.; Zhang, P.F.; Guan, D.B.; Meng, J.; Qian, H.Q.; Cheng, Y.H.; Kang, C.Q.; et al. Embodied greenhouse gas emissions from building China’s large-scale power transmission infrastructure. Nat. Sustain. 2021, 4, 739–747. [Google Scholar] [CrossRef]
- Dong, B.; Ma, X.; Zhang, Z.; Zhang, H.; Chen, R.; Song, Y.; Shen, M.; Xiang, R. Carbon emissions, the industrial structure and economic growth: Evidence from heterogeneous industries in China. Environ. Pollut. 2020, 262, 114322. [Google Scholar] [CrossRef]
- Liu, J.; Wei, D.; Wu, L.; Yang, H.; Song, X. Synergy and heterogeneity of driving factors of carbon emissions in China’s energy-intensive industries. Ecol. Indic. 2022, 142, 109161. [Google Scholar] [CrossRef]
- Gao, P.; Yue, S.; Chen, H. Carbon emission efficiency of China’s industry sectors: From the perspective of embodied carbon emissions. J. Clean. Prod. 2021, 283, 124655. [Google Scholar] [CrossRef]
- Shapiro, J.S. The environmental bias of trade policy. Q. J. Econ. 2021, 136, 831–886. [Google Scholar] [CrossRef]
- Liu, J.; Yang, Q.; Ou, S.; Liu, J. Factor decomposition and the decoupling effect of carbon emissions in China’s manufacturing high-emission subsectors. Energy 2022, 248, 123568. [Google Scholar] [CrossRef]
- Yan, M.; Sun, H.; Gu, K. Driving factors and key emission reduction paths of Xinjiang industries carbon emissions: An industry chain perspective. J. Clean. Prod. 2022, 374, 133879. [Google Scholar] [CrossRef]
- Wang, Y.; Niu, Y.; Li, M.; Yu, Q.; Chen, W. Spatial structure and carbon emission of urban agglomerations: Spatiotemporal characteristics and driving forces. Sustain. Cities Soc. 2022, 78, 103600. [Google Scholar] [CrossRef]
- Zhu, C.; Chang, Y.; Li, X.; Shan, M. Factors influencing embodied carbon emissions of China’s building sector: An analysis based on extended STIRPAT modeling. Energy Build. 2022, 255, 111607. [Google Scholar] [CrossRef]
- Fujimori, S.; Krey, V.; van Vuuren, D.; Oshiro, K.; Sugiyama, M.; Chunark, P.; Limmeechokchai, B.; Mittal, S.; Nishiura, O.; Park, C.; et al. A framework for national scenarios with varying emission reductions. Nat. Clim. Chang. 2021, 11, 472–480. [Google Scholar] [CrossRef]
- Li, J.; Zhang, Y.; Tian, Y.; Cheng, W.; Yang, J.; Xu, D.; Wang, Y.; Xie, K.; Ku, A.Y. Reduction of carbon emissions from China’s coal-fired power industry: Insights from the province-level data. J. Clean. Prod. 2020, 242, 118518. [Google Scholar] [CrossRef]
- Zhou, Y.; Zou, S.; Duan, W.; Chen, Y.; Takara, K.; Di, Y. Analysis of energy carbon emissions from agroecosystems in Tarim River Basin, China: A pathway to achieve carbon neutrality. Appl. Energy 2022, 325, 119842. [Google Scholar] [CrossRef]
- Wang, X.; Yu, B.; An, R.; Sun, F.; Xu, S. An integrated analysis of China’s iron and steel industry towards carbon neutrality. Appl. Energy 2022, 322, 119453. [Google Scholar] [CrossRef]
- Wei, N.; Liu, S.; Jiao, Z.; Li, X.-C. A possible contribution of carbon capture, geological utilization, and storage in the Chinese crude steel industry for carbon neutrality. J. Clean. Prod. 2022, 374, 133793. [Google Scholar] [CrossRef]
- Zhang, H.; Sun, W.; Li, W.; Ma, G. A carbon flow tracing and carbon accounting method for exploring CO2 emissions of the iron and steel industry: An integrated material–energy–carbon hub. Appl. Energy 2022, 309, 118485. [Google Scholar] [CrossRef]
- Isik, M.; Dodder, R.; Kaplan, P.O. Transportation emissions scenarios for New York City under different carbon intensities of electricity and electric vehicle adoption rates. Nat. Energy 2021, 6, 92–104. [Google Scholar] [CrossRef]
- Zhang, X.; Dong, F. What affects residents’ behavioral intentions to ban gasoline vehicles? Evidence from an emerging economy. Energy 2023, 263, 125716. [Google Scholar] [CrossRef]
- Dinga, C.D.; Wen, Z. China’s green deal: Can China’s cement industry achieve carbon neutral emissions by 2060? Renew. Sustain. Energy Rev. 2022, 155, 111931. [Google Scholar] [CrossRef]
- Tan, C.; Yu, X.; Guan, Y. A technology-driven pathway to net-zero carbon emissions for China’s cement industry. Appl. Energy 2022, 325, 119804. [Google Scholar] [CrossRef]
- Bertram, C.; Luderer, G.; Creutzig, F.; Bauer, N.; Ueckerdt, F.; Malik, A.; Edenhofer, O. COVID-19-induced low power demand and market forces starkly reduce CO2 emissions. Nat. Clim. Chang. 2021, 11, 193–196. [Google Scholar] [CrossRef]
- Ma, H. Prediction of industrial power consumption in Jiangsu Province by regression model of time variable. Energy 2022, 239, 122093. [Google Scholar] [CrossRef]
- Dong, J.; Li, C. Scenario prediction and decoupling analysis of carbon emission in Jiangsu Province, China. Technol. Forecast. Soc. Chang. 2022, 185, 122074. [Google Scholar] [CrossRef]
- Ma, Q.; Zhang, Q.; Wang, Q.; Yuan, X.; Yuan, R.; Luo, C. A comparative study of EOF and NMF analysis on downward trend of AOD over China from 2011 to 2019. Environ. Pollut. 2021, 288, 117713. [Google Scholar] [CrossRef]
- Yu, S.; Wu, W.; Xie, B.; Wang, S.; Naess, A. Extreme value prediction of current profiles in the South China Sea based on EOFs and the ACER method. Appl. Ocean Res. 2020, 105, 102408. [Google Scholar] [CrossRef]
- Zhang, H.; Zhang, L.L.; Li, J.; An, R.D.; Deng, Y. Monitoring the spatiotemporal terrestrial water storage changes in the Yarlung Zangbo River Basin by applying the P-LSA and EOF methods to GRACE data. Sci. Total Environ. 2020, 713, 136274. [Google Scholar] [CrossRef]
- Jawson, S.D.; Niemann, J.D. Spatial patterns from EOF analysis of soil moisture at a large scale and their dependence on soil, land-use, and topographic properties. Adv. Water Resour. 2007, 30, 366–381. [Google Scholar] [CrossRef]
- Charfeddine, L.; Kahia, M. Impact of renewable energy consumption and financial development on CO2 emissions and economic growth in the MENA region: A panel vector autoregressive (PVAR) analysis. Renew. Energy 2019, 139, 198–213. [Google Scholar] [CrossRef]
- Kazemzadeh, E.; Fuinhas, J.A.; Koengkan, M.; Shadmehri, M.T.A. Relationship between the share of renewable electricity consumption, economic complexity, financial development, and oil price: A two-step club convergence and PVAR model approach. Int. Econ. 2023, 173, 260–275. [Google Scholar] [CrossRef]
- Pan, X.; Wang, Y.; Tian, M.; Feng, S.; Ai, B. Spatio-temporal impulse effect of foreign direct investment on intra- and inter-regional carbon emissions. Energy 2023, 262, 125438. [Google Scholar] [CrossRef]
- Lian, Y. A Study on Investment Efficiency of Chinese Listed Companies; Economic Management Press: Beijing, China, 2009; pp. 80–81. (In Chinese) [Google Scholar]
- Liang, X.; Min, F.; Xiao, Y.; Yao, J. Temporal-spatial characteristics of energy-based carbon dioxide emissions and driving factors during 2004–2019, China. Energy 2022, 261, 124965. [Google Scholar] [CrossRef]
- Liu, H.; Peng, C.; Chen, L. The impact of OFDI on the energy efficiency in Chinese provinces: Based on PVAR model. Energy Rep. 2022, 8, 84–96. [Google Scholar] [CrossRef]
- Wu, L.; Sun, L.; Qi, P.; Ren, X.; Sun, X. Energy endowment, industrial structure upgrading, and CO2 emissions in China: Revisiting resource curse in the context of carbon emissions. Resour. Policy 2021, 74, 102329. [Google Scholar] [CrossRef]
- Niu, D.X.; Song, Z.Y.; Xiao, X.L. Electric power substitution for coal in China: Status quo and SWOT analysis. Renew. Sustain. Energy Rev. 2017, 70, 610–622. [Google Scholar] [CrossRef]
- Tan, R.; Lin, B. The influence of carbon tax on the ecological efficiency of China’s energy intensive industries—A inter-fuel and inter-factor substitution perspective. J. Environ. Manag. 2020, 261, 110252. [Google Scholar] [CrossRef] [PubMed]
- Xu, X.; Xu, X.; Chen, Q.; Che, Y. The impacts on CO2 emission reduction and haze by coal resource tax reform based on dynamic CGE model. Resour. Policy 2018, 58, 268–276. [Google Scholar] [CrossRef]
- Jia, Z.; Lin, B. How to achieve the first step of the carbon-neutrality 2060 target in China: The coal substitution perspective. Energy 2021, 233, 121179. [Google Scholar] [CrossRef]
- Zuo, J.; Zhong, Y.; Yang, Y.; Fu, C.; He, X.; Bao, B.; Qian, F. Analysis of carbon emission, carbon displacement and heterogeneity of Guangdong power industry. Energy Rep. 2022, 8, 438–450. [Google Scholar] [CrossRef]
- Fadly, D. Low-carbon transition: Private sector investment in renewable energy projects in developing countries. World Dev. 2019, 122, 552–569. [Google Scholar] [CrossRef]
- Bloch, H.; Rafiq, S.; Salim, R. Economic growth with coal, oil and renewable energy consumption in China: Prospects for fuel substitution. Econ. Model. 2015, 44, 104–115. [Google Scholar] [CrossRef] [Green Version]
- Luz, T.; Moura, P. 100% Renewable energy planning with complementarity and flexibility based on a multi-objective assessment. Appl. Energy 2019, 255, 113819. [Google Scholar] [CrossRef]
- Acheampong, A.O. Economic growth, CO2 emissions and energy consumption: What causes what and where? Energy Econ. 2018, 74, 677–692. [Google Scholar] [CrossRef]
- Menyah, K.; Wolde-Rufael, Y. Energy consumption, pollutant emissions and economic growth in South Africa. Energy Econ. 2010, 32, 1374–1382. [Google Scholar] [CrossRef]
- Lu, W.C. Renewable energy, carbon emissions, and economic growth in 24 Asian countries: Evidence from panel cointegration analysis. Environ. Sci. Pollut. Res. 2017, 24, 26006–26015. [Google Scholar] [CrossRef]
- Chen, W.; Yan, S. The decoupling relationship between CO2 emissions and economic growth in the Chinese mining industry under the context of carbon neutrality. J. Clean. Prod. 2022, 379, 134692. [Google Scholar] [CrossRef]
- Hao, J.; Gao, F.; Fang, X.; Nong, X.; Zhang, Y.; Hong, F. Multi-factor decomposition and multi-scenario prediction decoupling analysis of China’s carbon emission under dual carbon goal. Sci. Total Environ. 2022, 841, 156788. [Google Scholar] [CrossRef]
- He, Y.; Xing, Y.; Zeng, X.; Ji, Y.; Hou, H.; Zhang, Y.; Zhu, Z. Factors influencing carbon emissions from China’s electricity industry: Analysis using the combination of LMDI and K-means clustering. Environ. Impact Assess. Rev. 2022, 93, 106724. [Google Scholar] [CrossRef]
- Xu, G.; Yang, H.; Schwarz, P. A strengthened relationship between electricity and economic growth in China: An empirical study with a structural equation model. Energy 2022, 241, 122905. [Google Scholar] [CrossRef]
- Li, Y.; Zhao, K.; Zhang, F. Identification of key influencing factors to Chinese coal power enterprises transition in the context of carbon neutrality: A modified fuzzy DEMATEL approach. Energy 2023, 263, 125427. [Google Scholar] [CrossRef]
- He, S.Y.; Lee, J.; Zhou, T.; Wu, D. Shrinking cities and resource-based economy: The economic restructuring in China’s mining cities. Cities 2017, 60, 75–83. [Google Scholar] [CrossRef]
- Haldar, A.; Sucharita, S.; Dash, D.P.; Sethi, N.; Chandra Padhan, P. The effects of ICT, electricity consumption, innovation and renewable power generation on economic growth: An income level analysis for the emerging economies. J. Clean. Prod. 2023, 384, 135607. [Google Scholar] [CrossRef]


| Literature | Region/Industry | Period | Method | Influencing Factors |
|---|---|---|---|---|
| Liu, Jian et al. [56] | The high-emission sectors in China’s manufacturing industry | 1995–2019 | GDIM | Output scale, energy consumption scale, innovation input scale, output carbon intensity, energy consumption carbon intensity, innovation input carbon intensity, innovation input efficiency, energy intensity |
| Quan et al. [50] | The total carbon emissions of the logistics industry in China | 2000–2016 | LMDI | Carbon emission coefficient, energy intensity, energy structure, economic level, population size |
| Yan et al. [57] | Xinjiang industries’ carbon emissions | 1997–2017 | SDA | The intensity of energy consumption, the structure of energy consumption, the structure of industrial linkages, the structure of demand industries, the structure of demand categories, the size of the economy, the size of the population |
| Wang, Y. et al. [58] | Beijing-Tianjin- Hebei, Yangtze River Delta, Pearl River Delta, Chengdu-Chongqing, middle reaches of Yangtze River, Central Plains region | 2005–2019 | GTWR | Spatial structure, per capita GDP, industrial structure, energy intensity |
| Zhu, C. et al. [59] | Carbon emissions of China’s building sector | 1996–2017 | STIRPAT | Building construction area, value of the building unit area, Indirect emissions intensity, carbon emissions per unit energy consumed, energy intensity, total factor productivity |
| Types of Energy | Carbon Emission Factor | Standard Coal Conversion Factor | Unit of Measurement |
|---|---|---|---|
| Raw Coal | 0.7559 | 0.7143 | kg of standard coal/kg |
| Washing of refined coal | 0.7559 | 0.9000 | kg of standard coal/kg |
| Other coal washing | 0.7559 | 0.2857 | kg of standard coal/kg |
| Coke | 0.855 | 0.9714 | kg of standard coal/kg |
| Coke oven gas | 0.3548 | 0.5714 | kg standard coal/m3 |
| Blast furnace gas | 0.4602 | 0.1286 | kg standard coal/m3 |
| Other gas | 0.3548 | 0.1786 | kg standard coal/m3 |
| Other Coking Products | 0.6449 | 1.1000 | kg of standard coal/kg |
| Refinery dry gas | 0.4602 | 1.5714 | kg of standard coal/kg |
| Crude Oil | 0.5857 | 1.4286 | kg of standard coal/kg |
| Petrol | 0.5538 | 1.4714 | kg of standard coal/kg |
| Paraffin | 0.5714 | 1.4714 | kg of standard coal/kg |
| Diesel | 0.5921 | 1.4571 | kg of standard coal/kg |
| Fuel oil | 0.6185 | 1.4286 | kg of standard coal/kg |
| Liquefied Petroleum Gas | 0.5042 | 1.7143 | kg of standard coal/kg |
| Other petroleum products | 0.586 | 1.4286 | kg of standard coal/kg |
| Natural gas | 0.4483 | 1.2143 | kg standard coal/m3 |
| Heat | 0.2600 | 0.0341 | kg of standard coal/million joules |
| Electricity | 2.5255 | 0.1229 | kg of standard coal/kWh |
| Industry | Model | Variance Contribution Rate | Cumulative Variance Contribution Rate |
|---|---|---|---|
| The coal industry | 1 | 100 | 100 |
| The power industry | 1 | 75.6443 | 75.6443 |
| 2 | 11.0931 | 86.7374 |
| Area Name | Coverage |
|---|---|
| Resource-based cities | Xuzhou, Yangzhou |
| Non-resource-based cities | Taizhou, Nantong, Nanjing, Suzhou, Wuxi, Changzhou, Zhenjiang, Lianyungang, Suqian, Huai’an, Yancheng |
| Region | Variables | LLC Statistics | IPS Statistic | PP-Fisher Test Statistics | Conclusion | |||
|---|---|---|---|---|---|---|---|---|
| P | Z | L * | Pm | |||||
| Non-resource-based cities | LnGDP | −1.0521 (0.1464) | 0.8841 (0.8117) | 13.7713 (0.9094) | 1.3684 (0.9144) | 1.5128 (0.9322) | −1.2405 (0.8926) | Unstable |
| LnPCE | −5.1595 *** (0.0000) | −2.4004 *** (0.0082) | 15.4110 (0.8440) | 1.1599 (0.8769) | 1.1122 (0.8647) | −0.9933 (0.8397) | Unstable | |
| d.LnGDP | −4.9516 *** (0.0000) | −3.4454 *** (0.0003) | 93.5328 *** (0.0000) | −6.6462 *** (0.0000) | −7.7216 *** (0.0000) | 10.7840 *** (0.0000) | Stable | |
| d.LnPCE | −8.9316 *** (0.0000) | −6.1930 *** (0.0000) | 214.1378 *** (0.0000) | −10.9395 *** (0.0000) | −17.8714 *** (0.0000) | 28.9659 *** (0.0000) | Stable | |
| Resource-based cities | LnGDP | 0.5935 (0.7236) | 2.4454 (0.9928) | 0.7203 (0.9488) | 1.3788 (0.9160) | 1.3171 (0.8955) | −1.1596 (0.8769) | Unstable |
| LnPCE | −5.0582 *** (0.0000) | −4.0616 *** (0.0000) | 0.3900 (0.9833) | 1.8712 (0.9693) | 1.8494 (0.9572) | −1.2763 (0.8991) | Unstable | |
| LnCCE | −1.2845 * (0.0995) | 0.7122 (0.7618) | 0.3733 (0.9846) | 1.9040 (0.9715) | 1.8866 (0.9599) | −1.2822 (0.9001) | Unstable | |
| d.LnGDP | −3.0639 *** (0.0011) | −1.6644 ** (0.0480) | 8.6517 * (0.0704) | −1.6977 ** (0.0448) | −1.6562 * (0.0600) | 1.6446 ** (0.0500) | Stable | |
| d.LnPCE | −6.6418 *** (0.0000) | −4.9239 *** (0.0000) | 94.6602 *** (0.0000) | −9.1341 *** (0.0000) | −19.2050 *** (0.0000) | 32.0532 *** (0.0000) | Stable | |
| d.LnCCE | −3.8637 *** (0.0001) | −2.1646 ** (0.0152) | 20.0436 *** (0.0005) | −3.4999 *** (0.0002) | −4.0611 *** (0.0006) | 5.6723 *** (0.0000) | Stable | |
| Inspection Standards | Non-Resource-Based Cities | Resource-Based Cities | |
|---|---|---|---|
| Kao test | Modified Dickey-Fuller t | 0.3373 (0.3679) | −0.9774 (0.1642) |
| Dickey-Fuller t | −0.8716 (0.1917) | −2.8257 *** (0.0024) | |
| Augmented Dickey-Fuller t | −0.9519 (0.1706) | −2.3679 *** (0.0089) | |
| Unadjusted modified Dickey-Fuller t | 0.3980 (0.3453) | −0.9774 (0.1642) | |
| Unadjusted Dickey-Fuller t | −0.8259 (0.2044) | −2.8257 *** (0.0024) | |
| Pedroni test | Modified Phillips-Perron t | 2.2186 ** (0.0133) | 1.3543 * (0.0878) |
| Phillips-Perron t | 0.0889 (0.4646) | 0.6321 (0.2637) | |
| Augmented Dickey-Fuller t | −0.4215 (0.3367) | 0.5963 (0.2755) | |
| Westerlund test | Variance ratio | 0.6786 (0.2487) | −0.2179 (0.4138) |
| Region | Lag | AIC | BIC | HQIC |
|---|---|---|---|---|
| Non-resource-based cities | 1 | −4.2956 | −3.7278 * | −4.0649 * |
| 2 | −4.3412 * | −3.6480 | −4.0597 | |
| 3 | −4.2279 | −3.3932 | −3.8893 | |
| Resource-based cities | 1 | −0.4591 * | 0.2772 * | −0.2638 * |
| 2 | 0.0126 | 1.2029 | 0.2930 | |
| 3 | 17.1257 | 18.7687 | 17.4464 |
| Region | Impulse Variables | Response Variables | ||
|---|---|---|---|---|
| h_ d.LnGDP | h_ d.LnPCE | h_ d.LnCCE | ||
| Non-resource-based cities | L1. H_ d.LnPCE | 0.0027 (0.789) | −0.0217 (0.883) | − |
| L1. H_ d.LnGDP | 0.6378 *** (0.000) | 0.0537 (0.940) | − | |
| Resource-based cities | L1. H_d.LnCCE | 0.0024 * (0.053) | 0.0051 (0.284) | 0.0504 * (0.084) |
| L1. H_ d.LnPCE | −0.0265 (0.509) | −0.0624 (0.667) | −0.7628 (0.388) | |
| L1. H_ d.LnGDP | 0.5962 *** (0.004) | 0.3350 (0.647) | 7.9199 (0.198) | |
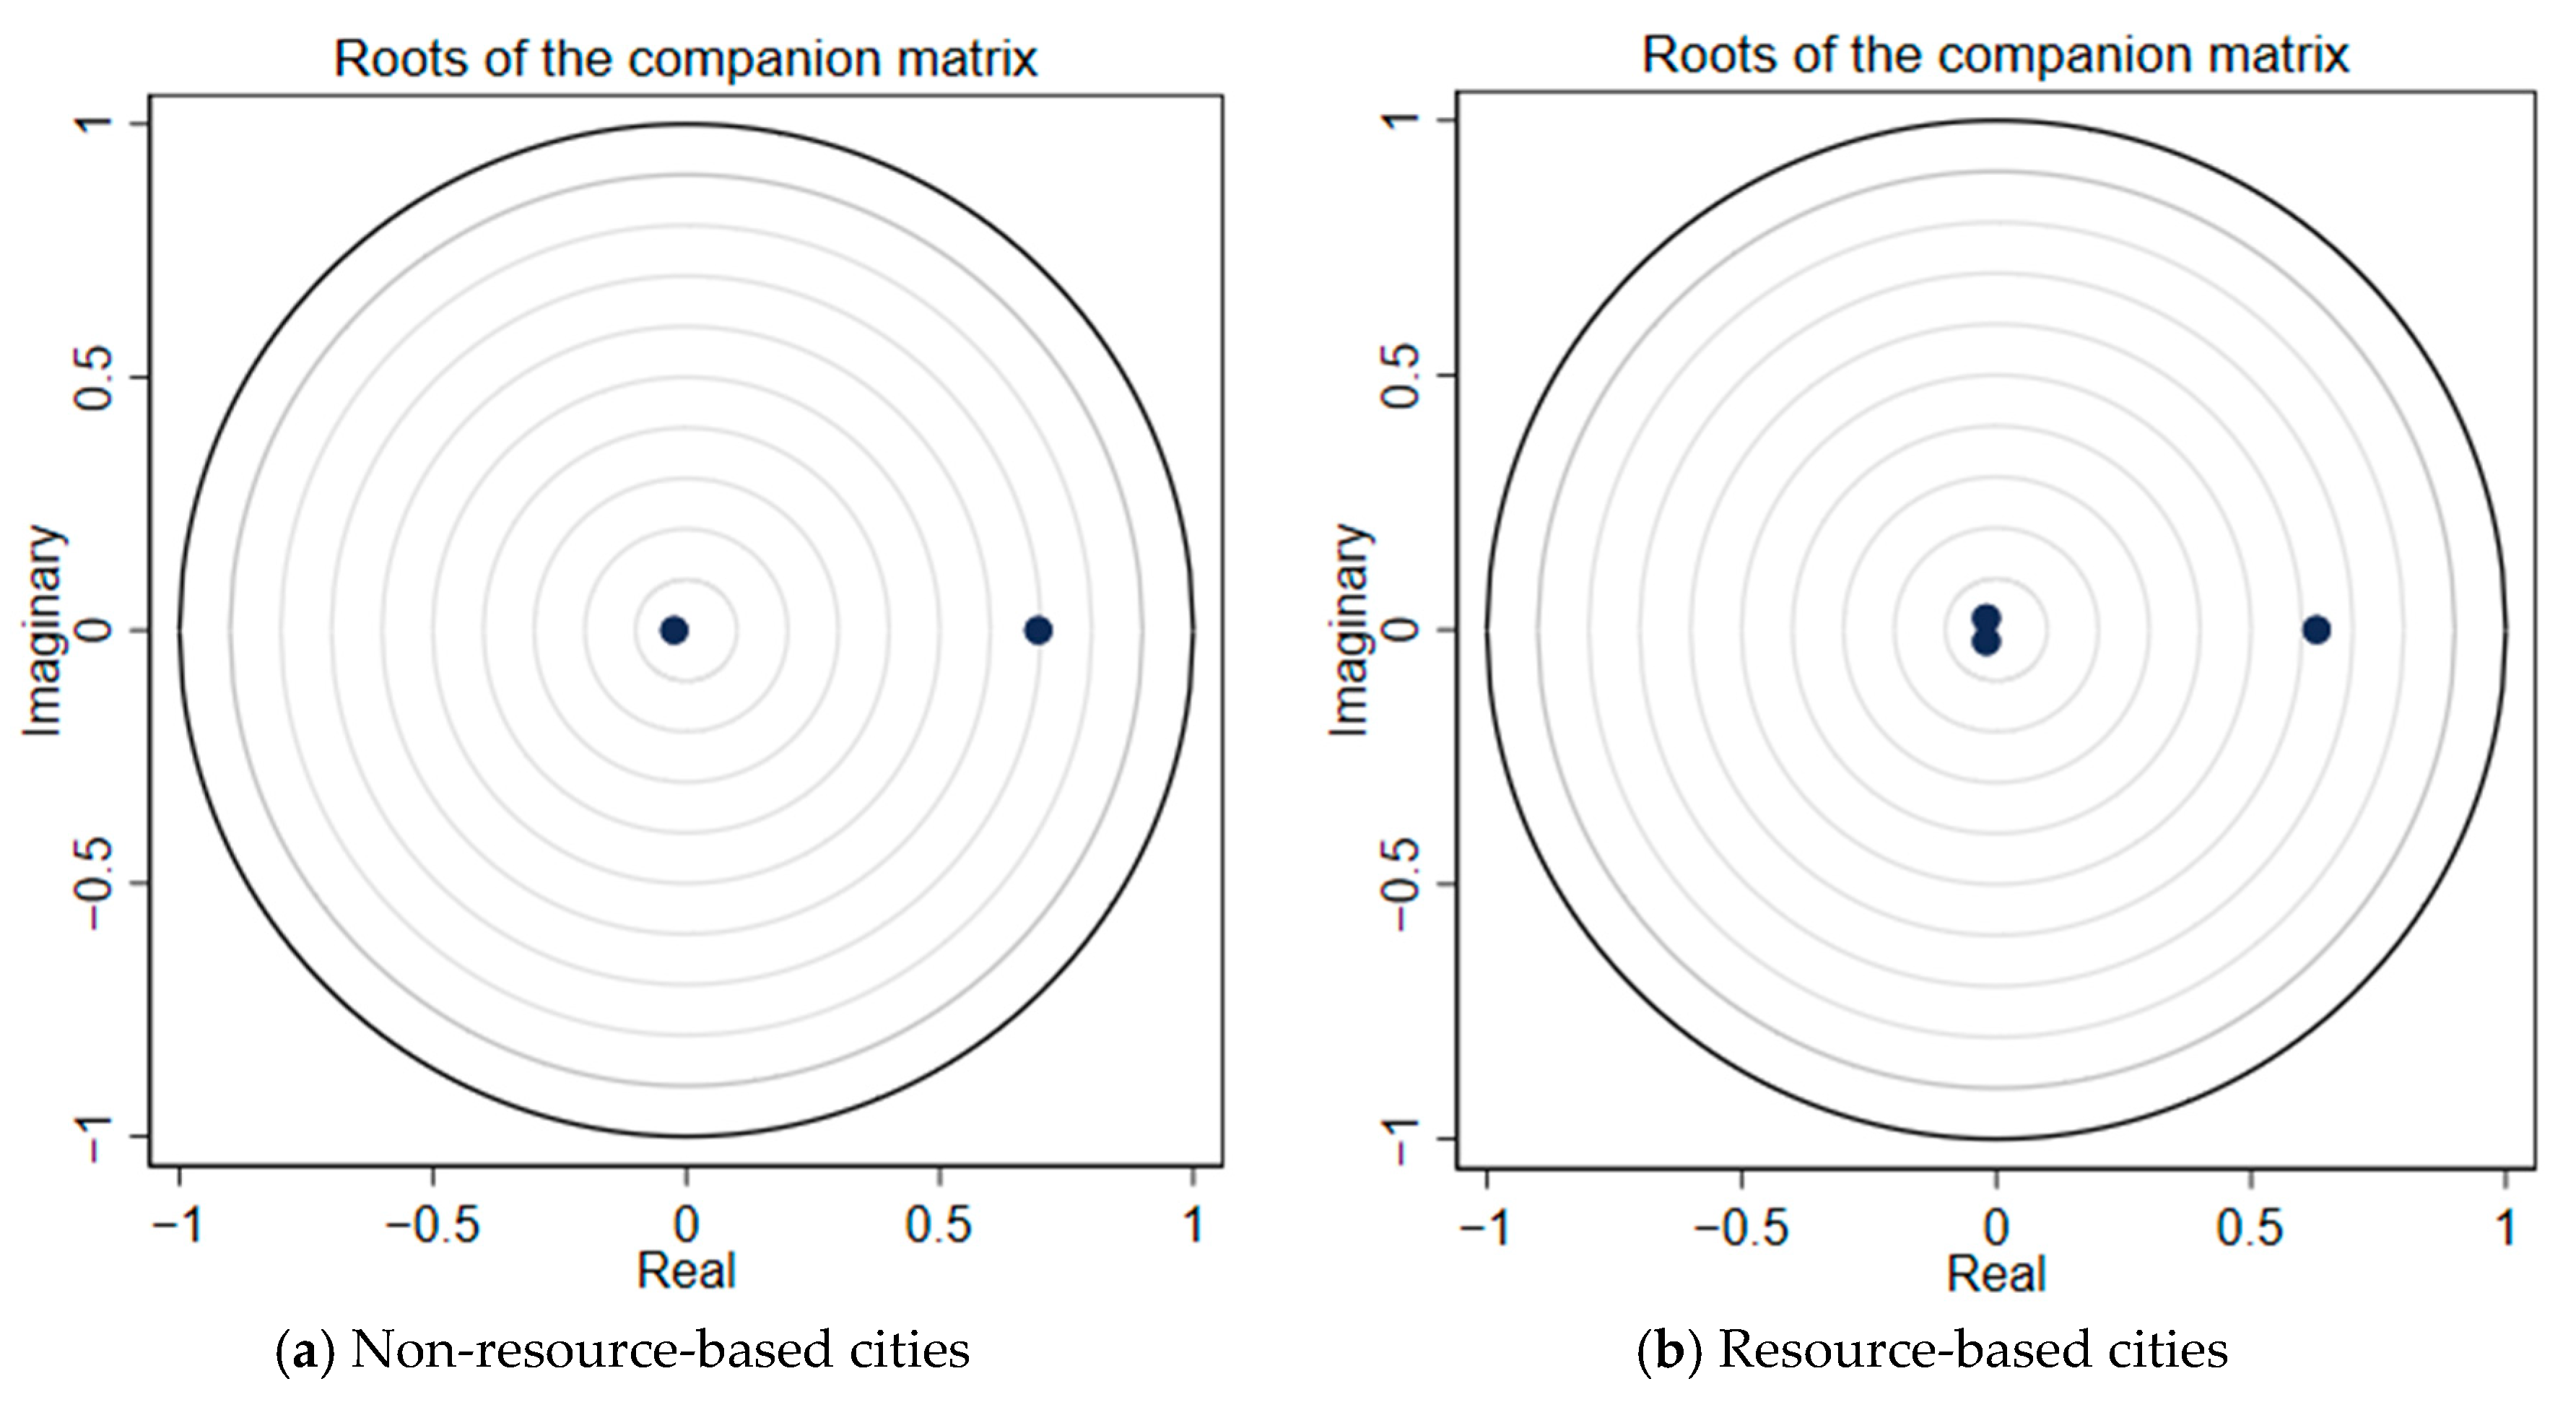
| Region | Eigenvalue | Modulus | |
|---|---|---|---|
| Real | Imaginary | ||
| Non-resource-based cities | 0.6945 | 0 | 0.6945 |
| −0.0238 | 0 | 0.0238 | |
| Resource-based cities | 0.6289 | 0 | 0.6289 |
| −0.0195 | 0.0228 | 0.0300 | |
| −0.0195 | −0.0228 | 0.0300 | |
| Response Variables | Forecast Horizon | Impulse Variables | |
|---|---|---|---|
| d.LnGDP | d.LnPCE | ||
| d.LnGDP | 1.000 | 1.000 | 0.000 |
| 2.000 | 1.000 | 0.000 | |
| 3.000 | 1.000 | 0.000 | |
| 4.000 | 1.000 | 0.000 | |
| 5.000 | 1.000 | 0.000 | |
| 10.000 | 1.000 | 0.000 | |
| 20.000 | 1.000 | 0.000 | |
| d.LnPCE | 1.000 | 0.020 | 0.980 |
| 2.000 | 0.020 | 0.980 | |
| 3.000 | 0.020 | 0.980 | |
| 4.000 | 0.020 | 0.980 | |
| 5.000 | 0.020 | 0.980 | |
| 10.000 | 0.020 | 0.980 | |
| 20.000 | 0.020 | 0.980 | |
| Response Variables | Forecast Horizon | Impulse Variables | ||
|---|---|---|---|---|
| d.LnCCE | d.LnGDP | d.LnPCE | ||
| d.LnGDP | 1.000 | 0.065 | 0.935 | 0.000 |
| 2.000 | 0.050 | 0.937 | 0.013 | |
| 3.000 | 0.046 | 0.938 | 0.017 | |
| 4.000 | 0.044 | 0.938 | 0.018 | |
| 5.000 | 0.044 | 0.938 | 0.018 | |
| 10.000 | 0.044 | 0.938 | 0.018 | |
| 20.000 | 0.044 | 0.938 | 0.018 | |
| d.LnPCE | 1.000 | 0.007 | 0.096 | 0.897 |
| 2.000 | 0.009 | 0.097 | 0.894 | |
| 3.000 | 0.009 | 0.098 | 0.893 | |
| 4.000 | 0.009 | 0.099 | 0.892 | |
| 5.000 | 0.009 | 0.099 | 0.892 | |
| 10.000 | 0.009 | 0.099 | 0.892 | |
| 20.000 | 0.009 | 0.099 | 0.892 | |
| d.LnCCE | 1.000 | 1.000 | 0.000 | 0.000 |
| 2.000 | 0.985 | 0.012 | 0.004 | |
| 3.000 | 0.979 | 0.017 | 0.004 | |
| 4.000 | 0.977 | 0.019 | 0.004 | |
| 5.000 | 0.976 | 0.019 | 0.004 | |
| 10.000 | 0.976 | 0.020 | 0.004 | |
| 20.000 | 0.976 | 0.020 | 0.004 | |
| Region | Explained Variables | Explanatory Variables | chi2 | df | Prob > chi2 |
|---|---|---|---|---|---|
| Non-resource-based cities | h_ d.LnGDP | h_ d.LnPCE | 0.0716 | 1 | 0.789 |
| ALL | 0.0716 | 1 | 0.789 | ||
| h_ d.LnPCE | h_ d.LnGDP | 0.00576 | 1 | 0.940 | |
| ALL | 0.00576 | 1 | 0.940 | ||
| Resource-based cities | h_ d.LnGDP | h_ d.LnPCE | 0.43566 | 1 | 0.509 |
| h_ d.LnCCE | 3.7456 | 1 | 0.053 * | ||
| ALL | 3.8003 | 2 | 0.150 | ||
| h_ d.LnPCE | h_ d.LnGDP | 0.21012 | 1 | 0.647 | |
| h_ d.LnCCE | 1.1502 | 1 | 0.284 | ||
| ALL | 1.5149 | 2 | 0.469 | ||
| h_ d.LnCCE | h_ d.LnGDP | 1.6605 | 1 | 0.198 | |
| h_ d.LnPCE | 0.74643 | 1 | 0.388 | ||
| ALL | 1.6606 | 2 | 0.436 |
Disclaimer/Publisher’s Note: The statements, opinions and data contained in all publications are solely those of the individual author(s) and contributor(s) and not of MDPI and/or the editor(s). MDPI and/or the editor(s) disclaim responsibility for any injury to people or property resulting from any ideas, methods, instructions or products referred to in the content. |
© 2023 by the authors. Licensee MDPI, Basel, Switzerland. This article is an open access article distributed under the terms and conditions of the Creative Commons Attribution (CC BY) license (https://creativecommons.org/licenses/by/4.0/).
Share and Cite
Dong, F.; Li, G.; Liu, Y.; Xu, Q.; Li, C. Spatial-Temporal Evolution and Cross-Industry Synergy of Carbon Emissions: Evidence from Key Industries in the City in Jiangsu Province, China. Sustainability 2023, 15, 3881. https://doi.org/10.3390/su15053881
Dong F, Li G, Liu Y, Xu Q, Li C. Spatial-Temporal Evolution and Cross-Industry Synergy of Carbon Emissions: Evidence from Key Industries in the City in Jiangsu Province, China. Sustainability. 2023; 15(5):3881. https://doi.org/10.3390/su15053881
Chicago/Turabian StyleDong, Feng, Guoqing Li, Yajie Liu, Qing Xu, and Caixia Li. 2023. "Spatial-Temporal Evolution and Cross-Industry Synergy of Carbon Emissions: Evidence from Key Industries in the City in Jiangsu Province, China" Sustainability 15, no. 5: 3881. https://doi.org/10.3390/su15053881