1. Introduction
European social policy is a multi-level policy. At present, on the one hand, supranational intervention in Member States’ national social policies is aimed at legislating significant social policy initiatives on their own and dismantling the facilities of national social security systems that are not considered compatible with the development of the Single Market.
Today’s social policy needs to address challenges related to a multitude of economic, demographic, social, technological, and other issues. The financing of the European Social Policy (ESP) is performed through the European Social Fund. The European Social Fund has two main strands: social investment and social protection. Other financial instruments with a social component are the European Globalisation Adjustment Fund (EGF), the European Support Fund for the Most Deprived Persons (EUSF), and the EU Programme for Employment and Social Innovation (EaSI). In line with the Europe’s 2020 Strategy, the European Social Policy should support the achievement of the following targets: 75% of the population aged 20–64 to be employed; the early school leaving rate to fall below 10%; 40% of the younger generation to be university educated; and 20 million fewer people at risk of poverty.
Social investment focuses on people and supports the improvement of their skills and capabilities. The most important measures for optimal social investment are: education, health, skills, job search management, rehabilitation management, and good education of children.
The economic effects of the recent global economic crisis, the not-so-positive economic outlook, and the demographic trend at an EU level are also leading to the deregulation of the European economic and social environment. The statistics for 2030 predict a 68% increase in the number of people aged over 80, against a 15% reduction in the working-age population by 2030. This demographic trend will test the sustainability and resilience of national social systems. As a policy response to these challenges, the European Commission has adopted a package of measures (Social Investment Package—SIP) capable of addressing/mitigating undesirable socio-economic phenomena such as high levels of financial stress, increasing poverty with a focus on child poverty, social exclusion, and unemployment especially among young people. Social risks include unemployment, parental responsibilities, illness and health care, disability, loss of a spouse or parent, old age, housing conditions, and social exclusion. National and supranational instruments that protect European citizens against social risks are social protection.
The European Social Policy is financed from the following sources: the European Social Fund (ESF); the European Global Adjustment Fund (EGF); the European Fund for the Most Deprived Persons; and the European Programme for Employment and Social Innovation. With a budget of over EUR 99 billion (current prices) for the period 2021–2027, ESF+ will invest in the following priority areas: Supporting young people who have been particularly affected by the COVID-19 crisis—ESF+ resources will help these young people find qualifications, a good quality job, and improve their education and training; Helping children in need by allocating ESF+ resources to specific actions to combat child poverty, and supporting the most vulnerable in society suffering from job losses and income cuts, including the provision of food and basic material assistance to the most disadvantaged; Retraining and upskilling people for the transition to a green and digital economy; Capacity building for social partners and civil society organisations; Transnational cooperation to promote social innovation across the EU; Direct support for social innovation through the Employment and Social Innovation (EaSI) component.
People at risk of poverty have a disposable income of less than 60% of the national average (after social transfers). According to the latest official statistics, the population at risk of poverty or social exclusion represents 22.4% of the total EU population. This share increased during 2009–2012 as a result of the global crisis. The population at risk of poverty or social exclusion in the euro area has also followed roughly the same pattern. There are large disparities between Member States on this indicator. Romania and Bulgaria face rates of population at risk of poverty or social exclusion higher than 30% of the total population. The lowest rates are achieved by the Czech Republic, Slovenia, and Slovakia (below 15%).
The approach to social policies from the perspective of the financial burden of free access to the labour market or through the prism of the risk of poverty is not the first scientific endeavour, and there is a former interest on the part of researchers in this field, which will be presented in detail in the
Section 2. However, an integrated approach to these aspects and the creation of an implementable model at the level of the EU economy that quantifies the level of social security in the context of today’s multiple challenges is the novel element of this research, which places it on a level of scientific-applicable interest for academics and social policy makers.
In this context, the determination of a social security index becomes an important and necessary objective, which will support social policy decision-making.
The objectives of the study are to:
O1: Identify social security models in the literature or proposals for their improvement in crisis conditions and the dissemination of working hypotheses based on results from the literature;
O2: Building and strengthening the evidence base with relevant indicators to support the modelling of social security status;
O3: Defining the social security index and the dissemination of the results.
The structure of the paper continues with the literature review, presentation of the main methodological issues, modelling results, and the scientific dissemination of the results. The conclusions will briefly present the main contributions to the development of the field.
2. Literature Review
Changing social policy priorities, structure, and management in the context of the global economic crisis was the subject of an analysis by Graziano and Hartlapp [
1]. The authors make the connection between European economic integration and austerity policies and point out that, under the pressure of the effects of the global crisis, there is a decline of EU social policy provision. In this context, the attention given to older people by European social policies is addressed by Kluge, Goldstein, and Vogt [
2]. Social policy analysis was conducted by Kuhn and Kamm [
3] based on a sample covering the Netherlands and Spain. Different survey results have found that: European citizens are less supportive of the unemployed [
4] than the unemployed among themselves, Europeans with a higher education and who are pro-immigration are more sympathetic to unemployed people from other European countries, foreign citizens are more discriminated against [
5], and political parties show no solidarity with unemployed people [
4] from abroad. The solidarity of European regions during the economic crisis was analysed by Trein [
6], who treats the problem in the same way but at an EU level. An interesting approach belongs to Wieczorek et al., which [
7] focused on supporting informal home care-givers. The authors noted wide disparities across Europe in the level of support for this approach. As a result of the dysfunctional social policies during the pandemic period, negative physical and psycho-social health problems can be observed. These problems have been compounded by rising unemployment [
8,
9]. The particular attention to be paid to the definition and implementation of social policies in the EU was highlighted by Korzeniowska [
10]. Social policy is seen by the author as an element of improving population’s health and alleviating poverty or illness. An interesting conclusion of this study was that the organisation of social policies at a Member State’s level must take into account cultural and social factors, as evidenced by Paraschiv et al. [
11]. A similar conclusion was reached by Rhinard [
12]. An element of risk for European social policy is the unexpected shock of inflation [
13] on unemployment [
14].
Analyses of social policy in the UK pre- and post-Brexit were made by Giordano [
15] and Pattyn, Gouglas, and De Leeuwe [
16]. The aforementioned authors considered social policy as influenced by risk situations. A rather controversial conclusion of these analyses is that Cohesion Policy has had the effect of increasing regional disparities in the UK. The approach to fiscal policy in risk situations using pro-cyclical variables was analysed at EU level by Gootjes and de Haan [
17]. Aksman has analysed the risk of the population at the poverty line [
18] using the Lorenz curve approach and the measures of cost of closing, the relative poverty gap, and income inequality.
Goniewicz analysed the post-pandemic social policy analysis [
19] and highlighted the need for adequate financial support. The solution proposed by the authors involves multidisciplinary and transdisciplinary levels of cooperation.
The correlation between social security spending and human development was analysed by Song and Tong [
20], based on a common human development index. The statistical data were processed using regression and revealed regional disparities. The authors argue that there is an inverted U-shaped connection between social security spending and common human development and that economic development and increasing urbanisation rates can support effective social policies.
One factor in ensuring social welfare is corporate social responsibility. Authors such as Lv et al. [
21] analysed the period of 2009–2017 and focused on the impact of corporate social responsibility on social security policy. The analysis found that firms strengthened their social responsibility by implementing social policies according to financial constraints and the ability to pass on costs.
The implications of lifetime inequality for social insurance reform were studied by Jones & Li [
22] using a life-cycle model with heterogeneous agents. The authors believe that by 2050, well-being can be achieved through social security policies with increasing average life expectancy and the education-mortality gradient. Related to this topic is research by Lopez-Velasco [
23] on social insurance systems. The authors used overlapping generations’ models (OLG) and Markov chains. The modelling concluded that “equilibria with social security can only exist if the underlying economy is dynamically inefficient” in the context of an ageing European society [
24], highlighting the role of pension systems in providing social protection. The analysis covered 19 EU27 countries and its main conclusion was that an increase in the value of social insurance and pensions would reduce wealth inequality among European citizens.
Other authors, such as Amarante & Colacce [
25], used harmonized cross-sectional social protection surveys to compare multidimensional poverty indices for older adults in different states. The analysis focused on four indicators (housing, health, labour and social security, and education) and lead to the highlighting of regional disparities in this area. The issue of poverty was studied by Caminada et al. [
26] in the context of quantifying the impact of income taxes and social transfers on this phenomenon. The analysis covered the period of 1982–2014 and used statistical data on the total population and the working-age population taken from the LIS Cross National Data Center in Luxembourg. The authors argued for more effective tax systems and social policies to reduce income inequality.
The effects of European social policy in the context of the COVID-19 pandemic were analysed by Quaglia & Verdun [
27] in relation to experiences of previous economic and pandemic crises. In general, the response to the pandemic crisis was an effect of the learning process by European entities (European Commission, European Central Bank) between and within crises. The same issue is addressed by O’Dwyer [
28], which, based on an extensive meta-analysis, focused on the gendered nature of the economy as well as the gendered impact of policy interventions at the EU27 level. The authors argued that European public policies, including social policies, generated gendered consequences and supported the construction of gendered assumptions about society and the economy. The indirect effects of the COVID-19 pandemic in the social context were examined by Flor et al. [
29], who used public information to determine population variations of this phenomenon by gender. The authors considered indicators relating to vaccination rates, health care services, labour market developments, education, and safety at home and in the community. The primary statistics were processed using regression and allowed the exploration of population differences by sex at the global level and by region. Gender disparities widened during the pandemic, with the authors concluding that social policies must “enable and encourage women to participate in the labour force and continue their education, thus enabling them to have a greater capacity to overcome the barriers they face”.
Understanding happiness and welfare from a geographical perspective is an interesting scientific approach by Ballas & Thanis [
30]. The authors took a regional approach to social welfare in the countries and regions that had been most affected by the severe economic crisis and austerity measures based on data from the European Social Survey (ESS) and Eurostat. The analysis highlighted the impact of austerity and inequality on the happiness and welfare of European citizens. The authors concluded that there were large differences in social welfare between Northern European countries compared to the Baltic countries and Central and Eastern European countries.
In the context of Social Europe, Carella & Graziano [
31] examined the launch of the European Pillar of Social Rights in the context of stronger intervention in the social sphere through the implementation of new social policies. The authors studied more than 60 official European documents and concluded that the EU was only prepared to implement “soft law” policies in the social field. This theme of the welfare state was also addressed by Hausermann et al. [
32] in the context of the knowledge economy. The authors aimed to better understand social welfare policies in the 21st century. Furthermore, the authors linked social policies to the electoral process in eight Western European countries and highlighted the differences that emerged in European citizens’ perceptions of the importance of social policies, social investment, and social consumption policies. The major change in European social policy came with the launch of the Europe 2020 initiatives and the European Semester in the view of Copeland & Daly [
33]. The authors looked at ways of promoting European social policy and the impact of EU social actors on this policy.
A comparative analysis of European social policies was carried out by (Ferragina & Deeming [
34], and covered the period of 1991–2022. Benchmarking provided a deeper understanding of the role, nature, and outcomes of European social policy. The EU Social Policy Agenda 1990–2020 was reviewed by Hemerijck [
35] in the context of highlighting progress in addressing this concept. The authors talked about social policy as a productive factor, social cohesion, and social investment. Finally, they forecasted social investment at a European level.
Social policies in terms of the concepts of “sustainable welfare” and “safe operating space” were addressed by Koch [
36] at the Swedish level. The authors believed that an effective policy is one that maximizes basic income, taxes wealth appropriately, and reduces working time without affecting the output and income of workers. The theme of social sustainability in the context of human development, quality of life, and welfare was taken up by Conigliaro [
37], which makes the connection between social sustainability, universal individual rights, human needs, and social justice (decent work). The authors introduced a set of indicators to characterize decent work in the context of social sustainability. These indicators were the result of the implementation of the method of partially ordered sets (Poset), i.e., discrete mathematics. Following this approach, the authors made proposals on decent work in EU countries in the context of social sustainability. The usefulness of social indicators in shaping the concept of quality of life and social welfare was addressed by Shek & Wu [
38], who defined five paradigms of social indicator research.
The effects of digitisation and automation of work on employment or wage levels were quantified by Busemyer & Sahm [
39] in the context of analysing different types of social policies. The statistics were taken from the European Social Survey and lead to the conclusion that “the risk of automation is positively associated with support for redistribution, but negatively associated with support for social investment policies”.
Other researchers were concerned with quantifying social security welfare at the individual level [
40]. The authors based their analysis on specific indicators such as country-specific legislation, earnings history, and longevity prospects of individuals. Using the statistical data collected, redistribution indices were defined for pension systems in Europe. Social security from the perspective of intergenerational income redistribution was discussed by Brendler [
41] in relation to new economic and demographic conditions. The authors found a preferential targeting of social policies towards more educated and older households since the 1980s.
The role of social policies in supporting quality of life was analysed by Aria et al. [
42]. The authors proposed to research social indicators and study the extensive literature on the period of 1989–2018. Based on these bibliometric studies, the authors offered solutions for more effective social policies. In the same context of ensuring a better quality of life [
43], they introduced the human development index H, which covers life expectancy, education, and income. The analysis covered the period of 1990–2017 and allowed for the examination of other policies (health, safety, and education) in relation to social policy. The main advantage of this approach as to shift the focus of the analysis from gross income (including GDP/capita) to other more subtle indicators.
The effects of social policy from the perspective of transnational models of human society were presented by Smith [
44]. The authors advocated providing access to official statistical data at no cost or with minimal financial and time costs. In this way, statistical data related to social policy could be widely distributed and analysed by researchers worldwide.
The increasing importance of social policy affecting research methods such as weighting and aggregation in the construction of dedicated compositional indicators was highlighted by Greco et al. [
45]. As a result of the analysis carried out, trends in the social policy context were highlighted, with dedicated composite indicators becoming available to both academics and practitioners.
Identifying social impact indicators that are useful in social policies is a priority in the view of Wallstam et al. [
46]. A Delphi approach proposed by the authors lead to the identification of six social indicators to be considered in any strategic economic approach at a national level.
Refining the analysis of the impact of social policy from a human and social capital perspective was studied by Djuric et al. [
47] through an approach based on a social metrology model. To this end, the authors analysed seven specific indicators, including sustainable development and social performance.
Prosocial behaviours related to charitable organisations were analysed by Kessler et al. [
48], based on the premise of optimising the effects of these organisations’ contributions on the social protection of disadvantaged European citizens. The authors sought solutions to increase the volume and value of social giving and monitor the prosocial behaviour of European citizens.
The impact of digitization in solving social problems was quantified by van Kersbergen & Vis [
49], with reference to the cases of Denmark and the Netherlands in the context of using the concept of social acceleration. The authors identified four markers in addressing this challenge, covering awareness, motivation, strategic goals, and dedicated policy action.
In the context of social development and welfare, social protection plays an important role according to Jawad [
50]. The authors based their analysis on three strands: social risks, social justice, and the implementation of social protection with a focus on social assistance. Following the analysis, the authors concluded that the factors influencing the effects of social policy related to the connection between the state and civil society in the provision of services, social protection legislation, and the level of social cohesion.
The literature review supports our scientific approach and provides the necessary foundation for the development of the present research.
4. Results
Applying the statistical modelling procedures, the analysis generated a model with a statistical representativeness of 99.8%, a standard error of the estimator of 3%, and 11 degrees of freedom. The Durbin–Watson coefficient of the model is 2.97, and the model was validated by use of ANOVA with a calculated root mean square of the variables of 33,757,939.195 units. The one-sided critical probability test rejected the null hypothesis and validated the alternative hypothesis, the Sig coefficient of the F function being less than the chosen significance threshold of 0.05. The values of the unstandardized β coefficients of the model, calculated using the software IBM-SPSS, are presented in
Table 1.
Based on the coefficients, the proposed model can be defined by the following equation:
The Pearson correlation table of the variables indicates that their correlation with the dependent variable is strong and positive in terms of financial indicators (in the vast majority of cases the correlation level is greater than 85%). As we presented in the
Section 3, some variables (TEXUN—Total unemployment insurance budget expenditures; EMPL—Active population; HEX—Health expenditures) present non-linear relationships between variables, the most obvious being in the case of TEXUN [
4], thus demonstrating that the level of social security is destabilised due to unfavourable budgetary policies [
17] and the increasing level of poverty of the disadvantaged population [
18].
In case of demographic and social indicators [
19], the level of correlation is negative (inversely proportional) and lower, which indicates a vulnerability of social policy in relation to contributing human resources and the pressure of the socially assisted population (see
Table 2 below).
Based on the model, we propose the configuration of the social security index. Using the Pearson partial correlation ratios with the dependent variable, we generate the three risk coefficients (financial, demographic, and social), which will subsequently be integrated through a multiplicative formula to obtain the overall social security index.
The financial risk component involves the dynamic assessment of correlations of the financial allocations related to the general consolidated budget, social security, and unemployment insurance, as follows:
where: TREVGCB—Total revenues to general consolidated budget; SAGCB—Social assistance general consolidated budget; n—The number of years for which the Social Security Index is projected;
—Pearson correlation coefficient of TREVGCB and SAGCB indicators;
where: TREVSIB—Total revenues to state social insurance budget; SAGCB—Social assistance general consolidated budget; n—The number of years for which the Social Security Index is projected;
—Pearson correlation coefficient of the TREVSIB and SAGCB indicators;
where: TREVUN—Total unemployment insurance budget revenue; SAGCB—Social assistance general consolidated budget; n—The number of years for which the Social Security Index is projected;
—Pearson correlation coefficient of TREVUN and SAGCB indicators;
where: TEXGCB—Total expenditures of general consolidated budget; SAGCB—Social assistance general consolidated budget; n—The number of years for which the Social Security Index is projected;
—Pearson correlation coefficient of TEXGCB and SAGCB indicators;
where: TEXSIB—Total state social security budget expenditures; SAGCB—Social assistance general consolidated budget; n—The number of years for which the Social Security Index is projected;
—Pearson correlation coefficient of TEXIB and SAGCB indicators;
where: TEXUN—Total unemployment insurance budget expenditures; SAGCB—Social assistance general consolidated budget; n—The number of years for which the Social Security Index is projected;
—Pearson correlation coefficient of TEXUN and SAGCB indicators.
Financial risk can then be represented by:
where:
—the financial risk function related to social policies.
We can define risk, normality and safety barriers as follows:
;
;
.
The demographic risk component, with its impact on labour market, is treated according to Pearson partial correlation with the dependent variable of the model, as follows:
where: EMPL—Active population; SAGCB—Social assistance general consolidated budget; n—The number of years for which the Social Security Index is projected;
—Pearson correlation coefficient of EMPL and SAGCB indicators.
where: UNEMPL—Unemployed; SAGCB—Social assistance general consolidated budget; n—The number of years for which the Social Security Index is projected;
—Pearson correlation coefficient of EMPL and SAGCB indicators.
The demographic risk function becomes:
where:
—the employment risk function of the labour related to social policies.
We define risk, normality and safety barriers as follows:
;
;
.
The social risk function represented by the balance between social assistance recipients and social assistance contributors reads:
where: RET—Retired; SAGCB—Social assistance general consolidated budget; n—The number of years for which the Social Security Index is projected;
—Pearson correlation coefficient of RET and SAGCB indicators.
where: EMPLW—Employees; SAGCB—Social assistance general consolidated budget; n—The number of years for which the Social Security Index is projected;
—Pearson correlation coefficient of RET and SAGCB indicators.
The formula for calculating social risk becomes:
where:
—the social risk function of social policies.
We define risk, normality and safety barriers as follows:
;
;
.
Based on the three risk components, the Social Security Index can be quantified using a multiplicative form formula:
where:
—Social Security Index.
We define the risk, normality and safety barriers of the Social Security Index as follows:
;
;
.
The proposed Social Security Index was determined by using information taken from official statistics in Romania, but it can be generalized to the European and global level as the proposed methodology provides for the dynamic and correlated calculation of standardized indicators at a statistical level.
5. Discussion
The financial risk diagrams, based on the model using the software IBM-SPSS 25, allows for the identification of three clusters of predicted risk evolution (changes in financial policies related to social strategy). At the income level, it can be seen that (TREVGCB) the cluster structure is more evenly distributed than that of the expenditure cluster (TEXGCB), the latter following social policy changes while income followed fiscal and financial policy changes [
17] (see
Figure 2).
These aspects prove the validity of hypothesis H1 as there is a strong directly proportional correlation between social assistance supported by general consolidated budget funds and total unemployment insurance budget revenues. In Romania, under these conditions, we can state that the social assistance component is planned in terms of financial policy on the basis of direct, predictable funding sources collected from insured contributors. Thus, the model’s calculations show that 2.3 insured persons in Romania support 1 socially insured person through contributions.
The labour risk diagrams, based on the model using the software SPSS 25, allow the identification of three clusters of predicted risk evolution (changes in social inclusion policies), showing that at the level of the labour factor (EMPL) in the structure of the clusters is more homogeneously distributed than that of the clusters related to unemployment (UNEMPL), which means that the labour market functions optimally with the exception of crisis periods (see
Figure 3).
This approach validates the content of hypothesis H2. Respectively, the mass of inactive (unemployed) people contributes inversely and significantly to increase in pressure on social security budget. In the context of the research, it is shown that a 14% increase in the number of unemployed implies an increase in social security budget expenditure of at least 10 monetary units (m.u.) per 100 m.u. allocated.
The social risk diagrams, based on the model using the software SPSS 25, allow the identification of three clusters of predicted risk evolution (change in social inclusion policies), observing that the structure of the clusters is less homogeneously distributed compared to that of the clusters related to social assistance recipients at the level of social insurance contributors (EMPLW) (RET). This means that social assistance pressure is a particular vulnerability for Romania (see
Figure 4).
Based on the statistically processed data, we have drawn up the social security and financial, demographic, and social risk matrix presented in
Table 3.
The social security matrix shows that the level of financial risk is high (1.4469 points with 30% more than upper limit of normality sector), while the demographic and social risk indicators are in the normal range (lower than 1.1 points, which is upper limit of normality sector), which leads to the determination of a social security risk for Romania above the normal average (1.4458 points), falling within the risk range (31% more than the upper limit of normality range) both against the background of the economic crisis that affects the financial risk and the current geopolitical context that impacts the demographic and social risk.
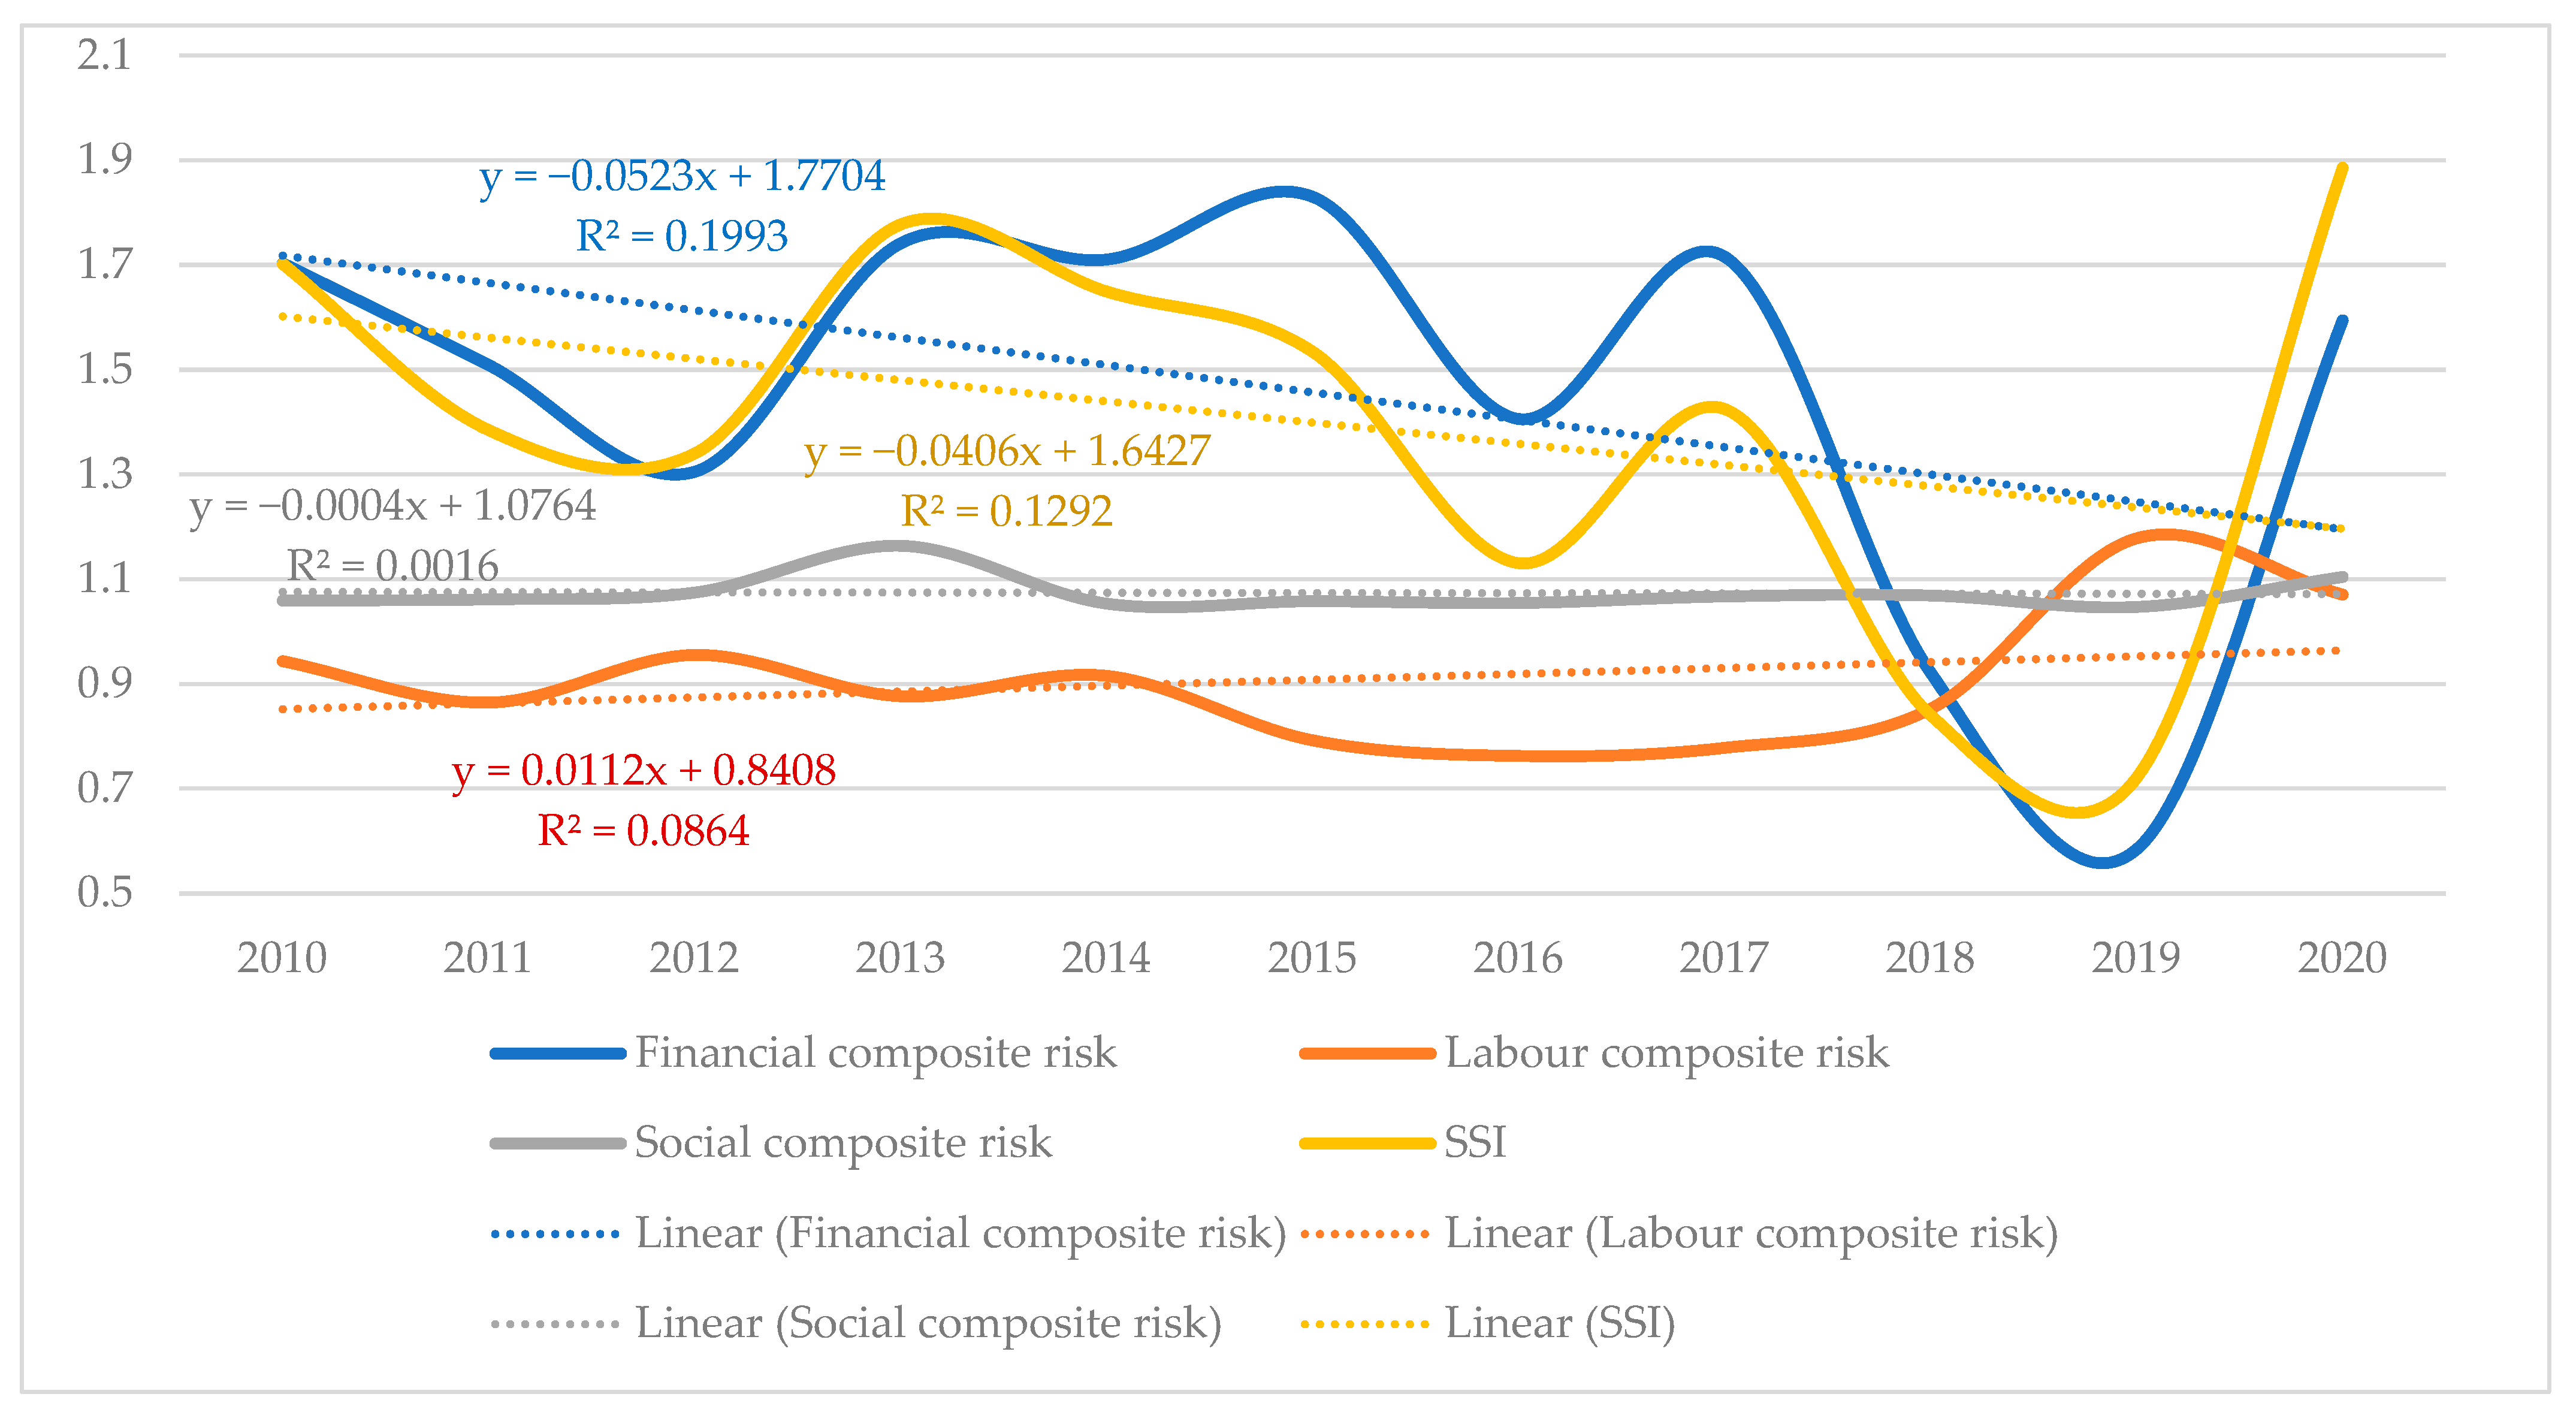
Based on the analysed data, using the social security matrix, we made a temporal distribution map using key indicators (see
Figure 5).
Figure 5 shows a normalised distribution of the social composite risk indicator and a stabilised distribution of the labour factor indicator, with an accelerating trend in the risk related to the pandemic and crisis periods since the beginning of the interval, with the value of the Social Security Index (SSI) following the trend in the financial composite risk indicator.
In terms of social policies, the issues of discrimination [
5] and lack of solidarity [
4] are strategic guidelines on which public policy makers need to focus in order to improve social security at European level.
Another aspect that emerges from the research is that of the population affected by unemployment [
8,
9]. It has been shown [
14] that the social pressure of the unemployed population is increasing in times of crisis, an aspect that makes sustainable social development vulnerable and requires immediate social support measures.
According to Aksman [
18], the poverty risk of 20.91% was high for Romania, as the country was amongst the top three countries with the highest share of households at risk of poverty in 2018. According to the methodology presented in this study, the risk determined according to the matrix of social security presented in
Table 3 is of over 30%. The study of Paraschiv et al. [
11], using a social inclusion index, placed Romania in last place in the European rankings with a social risk of 34.57%, which is close to the one determined by the authors through the social security matrix from
Table 3.
This conclusion validates hypothesis H3 in the context of the current social policy adopted by the authorities. A valid and representative statistical index of social security can be defined on the basis of changes in the social policy indicators analysed in the paper.
6. Conclusions
The research has drawn attention to the impact of social policies on social security, resulting in a fragile, strategically ill-adapted contextual picture for Romania, with shortcomings in terms of long-term social policy foresight and a narrow focus on improving economic induced aspects or unstable geopolitical contexts.
The analysis carried out was based on the cluster approach for the purpose of forecasting the evolution of risk in the financial, social, and labour market areas. This approach allowed vulnerabilities to be highlighted and become useful for public policy makers in the field from a social perspective. Based on the observations drawn from this study, we formulate the following dedicated public policy proposals: setting up a community instrument to monitor the poverty situation and access to the labour market, including for migrants; increasing funding for social policies; identifying and financially supporting new areas of activity in the context of the digital economy that can ensure retraining and active integration into the labour market of the population at risk; developing education and training provisions for the adult population; ad increasing the level of health security by developing social programmes in the medical field.
The authors have demonstrated all the proposed objectives throughout the research by developing an econometric model correlating social policy with financial indicators related to budget allocation and execution in the social field, and they have projected the social security matrix, which places social risk in Romania at a high level, above the average level of normality. This result can be extrapolated for calculation for other Member States, which is a limitation of the study. We plan to quantify the social deprivation index for all EU Member States in a future work.
The authors aim to revisit this research and build the European social security picture based on the methodology proposed in the research.
The research is topical and important for national and supra-national decision-makers, who can adjust elements of social security to decrease risk and increase quality of life.
Regarding the future of scientific literature, our study offers a new approach to European social policies and is a challenge for other specialists in the field.
From a managerial point of view, the study is useful because it is the basis for defining dedicated public social policy proposals.
Approaching social policies from the perspective of the financial burden of free access to the labour market or through the prism of poverty risk is theoretically and practically extremely useful. The authors propose an integrated approach to these issues through a new implementable model across the EU economy.


 ,
, 


