1. Introduction
As China began to implement the policy of “Reform and Opening up to the Outside World” in 1978, it embarked on a path of rapid economic development. The first wave of economic growth started in 1978 and continued till 2000, and the second wave commenced after 2001, when China entered the WTO. The chosen study period is from 2000 to 2017 to see the impact of economic growth on income inequality in the second wave against the background of entry into the WTO.
The objective of this paper is to measure the regional income inequality from 2000 to 2017 in the context of structural changes, understand the regional contribution to income inequality and put forward improvement suggestions for policy makers. To accomplish the objective, we need to examine the changes in the determinants of regional income inequality associated with the industrial structural changes in China from 2000 to 2017. This is done by decomposing regional inequality in per capita gross regional product by both regions and gross regional product components using a population-weighted coefficient of variation (WCA) as a measure of regional inequality. If the coefficient is squared, the coefficient of variation belongs to the generalized entropy class of inequality measures and is strongly Lorenz-consistent, meanwhile satisfying the four desirable properties as a measure of inequality, i.e., the principle of anonymity, income homogeneity, population homogeneity and the Pigue-Dalton principle of transfers [
1,
2]. Moreover, overall income inequality can be decomposed into a weighted sum of within-group inequalities and between-group inequality [
3], and also expressed as the sum of the contributions related with different income components [
4].
This paper includes the following seven sections:
Section 1 makes an introduction;
Section 2 is literature review;
Section 3 explains data source and methodology;
Section 4 presents results of structural changes;
Section 5 is regional inequality analysis;
Section 6 provides a decomposition analysis of region inequality and
Section 7 is a summary of study results and policy implications.
2. Literature Review
With China’s development over these years, the income inequality issue has drawn increasingly more and more attention in academia. The research on China’s income inequality is abundant, and the literature can be divided into three types: the convergence approach, the accounting approach and the decomposition approach.
China’s economic reform began in 1978, and the issue of provincial income equality gradually loomed large in 1990s. Many a scholar conducted studies on income inequality from the perspective of the decomposition approach.
Some scholars focused on national income inequality studies in China from the rual-urban or coastal-inland perspectives. Kanbur Ravi and Zhang Xiaobo (1999) tried to describe the relative contribution of rural-urban and inland-coastal inequality to regional inequality during the period of 1982–1995, and found that the contribution of rural-urban inequality is much higher than that of inland-coastal inequality using the generalize entropy method [
5]. Fujita Masahisa and Hu Dapeng (1999) examined the regional disparity trend from 1985 to 1994, using GDP and industry output data, and showed that income equality between the coastal region and the interior region had been increasing [
6]. Gustafsson Bjorn and Shi Li (2002) studied income inequality within and between counties in rural China, using household data for 18 provinces in 1988 and 1995, and found that the uneven development of mean income across counties explained for rapid increase in income inequality [
7]. Morduch Jonathan and Sicular Terry (2002) developed a general regression-based approach for decomposing inequality and studied inequality in rural China using survey data, and found that the contribution of spatial characteristics to inequality is large [
8]. Cheng Yuk-shing and Li Sung-ko (2006) utilized an interpretation for a decomposition of the Theil index to find out the extent to which differentials in productivity and efficiency can explain China’s inter-provincial income inequality [
9]. After 2000, with China’s entry into the WTO, globalization and economic liberalization exerted a significant impact on regional inequality. Peng Bin (2016) [
10] studied the development of regional disparity in China from 1998 to 2010 by way of a multidimensional index and identified the existence of a three-peak pattern of convergence during the study period [
11]. Wu Rongwei et al. (2018) found that the overall inequality, within-province inequality and between-region inequality declined from 2014 to 2017; furthermore, the between-province inequality increased [
12].
Other scholars concentrate on an investigation of China’s regional and provincial income inequality. Li Yuheng (2012) decomposed regional inequality in the Beijing-Tianjin-Hebei metropolitan region, which is one of the most developed areas in Region 1, and showed that regional inequality decreased between 1990 and 1994, after which it remained steady [
13]. Yue Wenze et al. (2014) employed exploratory spatial data analysis to investigate regional inequality in Zhejiang province in Region 1 in China from 1990 to 2010. The decomposition of the Theil Index showed that the contribution of the inequalities between Northeast Zhejiang and Southwest Zhejiang increased [
14]. Wei Sun et al. (2016) used a multi-scale and multi-mechanism framework to analyze regional development in Guizhou province in Region 3 between 2000 and 2012 and discovered that, regional inequality has been declining since 2000 [
15]. Ye Xiaosu et al. (2017) found that regional inequality in Chongqing municipality in Region 3 decreased from 1997 to 2015, and between-region inequality is the major source of regional inequality [
16].
Still others focus on income inequality research by comparing China and other developing countries. Takahiro Akita (2002) explored factors determining regional income inequality in China and Indonesia by the two-stage nested Theil decomposition method [
17]. Wagstaff Adam (2005) studied China and Vietnam by decomposing changes in income inequality into vertical and horizontal redistribution and reranking and found that substantial amounts of horizontal redistribution and reranking in both countries more than offset pro-poor vertical redistribution [
18]. Borooah et al. (2006) made a comparison of income inequality between China and India using the generalized entropy method and discovered that differences in mean income across regions are much larger in China than in India and account for a larger proportion of income inequality in rural China [
19].
3. Data and Methodology
3.1. Data
This paper measures regional inequality in China from 2000 to 2017 using provincial GRP data from China Statistical Yearbook (2000–2018) by the National Bureau of Statistics. Both nominal and constant price GRP data are used. Nominal provincial GRP data are converted to real GRP data at constant 2000 prices to see the real changes during the study period.
To conduct our analysis by regional groups, we classify China’s thirty-one provinces, municipalities and autonomous regions (excluding Hong Kong and Macao) into three regions. Region 1 refers to the east region or coastal region, which has eight provinces and three municipalities. Region 1 is China’s developed area. Region 2 is called the middle region or central region with eight provinces. Region 2 is China’s developing area. Region 3 is the west region, which boasts six provinces, five autonomous regions and one municipality and this region is China’s underdeveloped area. Sometimes Region 2 and 3 are collectively called the interior area.
During 2000–2004, the provincial GRP dataset provides information for eight industrial sectors. The sectors are primary (Sector 1); industry (Sector 2); construction (Sector 3); transport/storage/post communication (Sector 4); wholesale/retail trade/catering (Sector 5); finance and insurance (Sector 6); real estate (Sector 7); and others (Sector 8).
During 2005–2017, the provincial GRP dataset adds information for one more sector, thus altogether nine industrial sectors, which are primary (Sector 1); industry (Sector 2); construction (Sector 3); transport/storage/post (Sector 4); wholesale/retail trades (Sector 5); hotels and catering services (Sector 6); financial intermediation (Sector 7); real estate (Sector 8); and others (Sector 9).
This study uses both the eight-sector and nine-sector classification in the decomposition of inequalities by GRP components. One noticeable point is that GDP/GRP as a measure of inequality fails to explain the dispersion of income and may underestimate the magnitude of regional income inequality. In future study, household survey data may be used to probe into the problem of regional income inequality in China.
3.2. Methodology
In this paper, the method of bi-dimensional decomposition of the squared population-weighted coefficient of variation is used. The method is explained as below.
Suppose there are m regions in an economy, where region i contains hi provinces.
Let
- (1)
ij = the per capita GRP of province j in region i;
- (2)
Nij = the population of province j in region i;
- (3)
Ni = = the total population of region i;
- (4)
Yi = ij = the total GRP of region i;
- (5)
i = Yi/Ni = the per capita GRP of region i;
- (6)
N = = the total population of all provinces;
- (7)
Y =ij = the total GRP of all provinces;
- (8)
= Y/N = the per capita GRP of all provinces.
The overall interprovincial inequality in per capita GRP can be measured by the squared WCA as below:
where
is the within-region inequality of region i and
= (
,
,…,
). In Equation (1),
=
is the within-region component, which is the weighted sum of within-region inequalities, and
=
is the between-region component that measures inequality in per capita GRP among m regions. It should be noted that the within-region component is not a weighted average of within-region inequalities, as the weights do not sum to unity.
Suppose next that the total provincial GRP consists of K GRP components as follows:
= + +…+ and = + +…+ , where = .
Then, the within-region inequality of region i, as measured by the squared WCV, can be additively decomposed as below:
In Equation (2), () is the weighted coefficient of covariation between total GRP and GRP from component k in region i, and is the GRP share of component k in region i, where = (, ,…, ).
Similarly, the between-region inequality can be decomposed as below:
In Equation (3), is the weighted coefficient of covariation between total GRP and GRP from component k in the economy, and is the GRP share of component k in the economy, where = (, ,…, ).
Substituting Equations (2) and (3) into Equation (1), we get the following bi-dimensional decomposition equation:
Dividing both sides of the above equation by
, we obtain,
In Equation (4), is the contribution of the within-region inequality of GRP component k in region i to overall inequality, while is the contribution of the between-region inequality of GRP component k to overall inequality. Therefore, altogether there are components.
For the within-region inequality of region i, we define = , whereas for the between-region inequality, we define = . Note that and are the relative concentration coefficients of component k for the within-region inequality of region i and for the between-region inequality, respectively. If > 1, then component k is an inequality-increasing component in region i; if < 1, then component k is an inequality-decreasing component in region i. Similarly, if > 1, then component k is an inequality-increasing component for the between-region inequality; if < 1, then component k is an inequality-decreasing component for the between-region inequality.
In this paper, we apply a bi-dimensional inequality decomposition analysis, using provincial GDP data from 2001 to 2017 to investigate regional inequality levels across provinces in China. Our study is different from previous research in that we divide China into three regions, i.e., region 1 (eastern region), region 2 (middle region) and region 3 (western region), and we use GDP data by 8–9 industrial sectors and population data by 31 provinces. We specifically choose the data range of 2000 to 2017, as 2001 is the year China joined WTO and China’s economic development accelerated since 2001, so we would like specifically to see the trend of income inequality development during this period.
4. Structural Changes
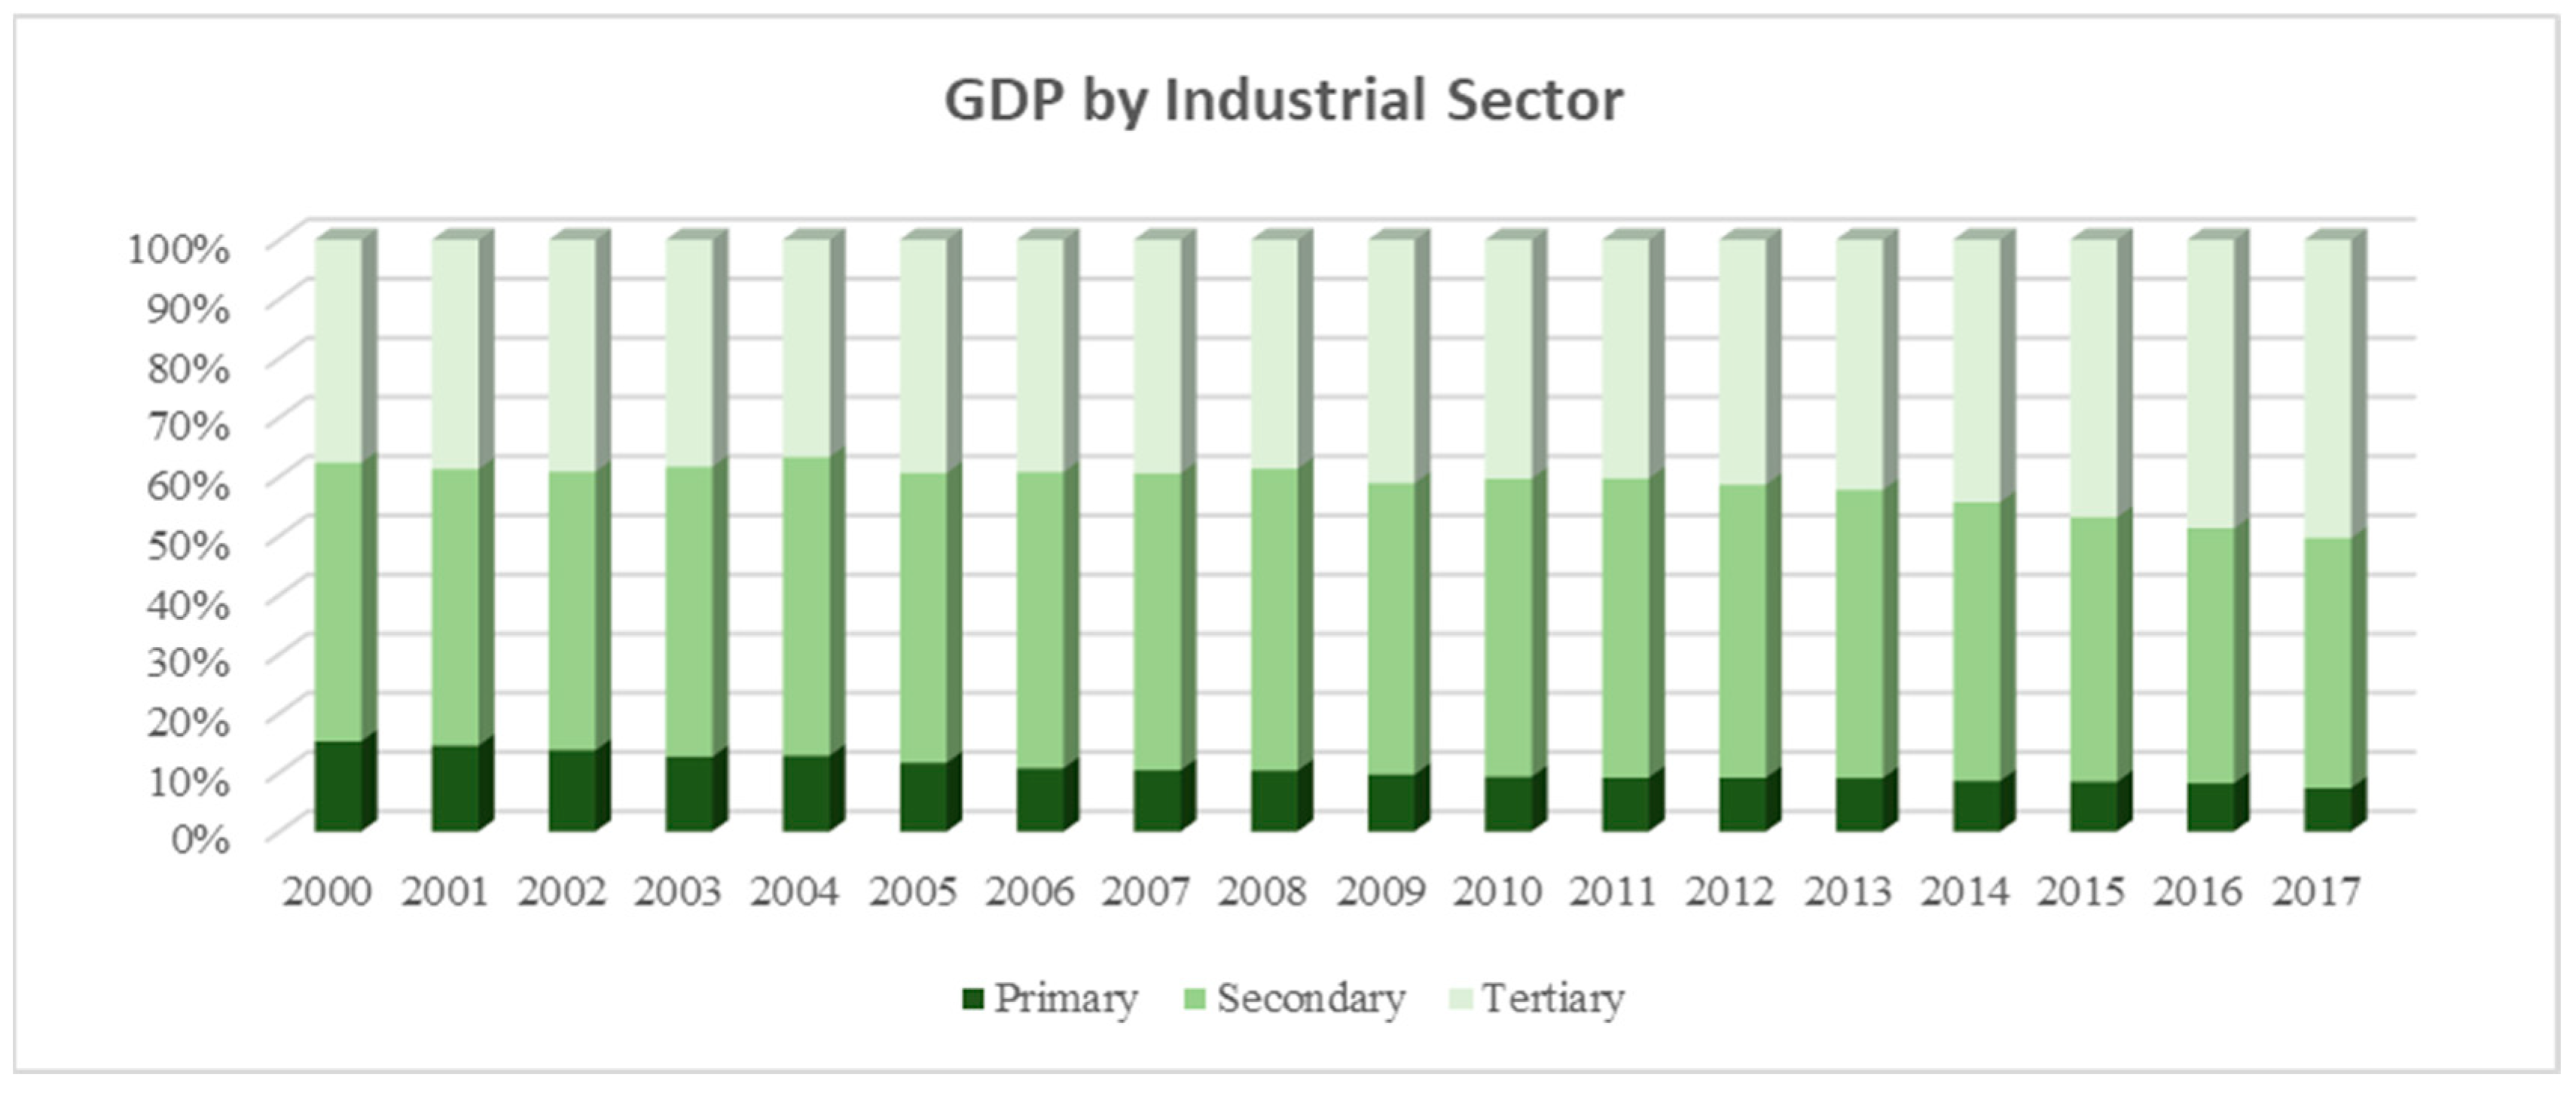
With the growth in economic size, China has also gone through substantial structural changes. As is shown in
Figure 1, the overall trend is the shrinking share of the primary sector, the relatively stable share of the secondary sector and growing portion of the tertiary sector.
Table 1 shows more clearly the structural changes over the time. The GDP share of the primary sector was 15.3 percent in 2000, dropped to 9.3 percent in 2010, and to 7.4 percent in 2017, while the GDP share of the secondary sector was 47.1 percent in 2000, rose to 50.4 percent in 2010, but fell down to 42.3 percent in 2017. Instead, the tertiary sector exhibited a steady increasing pattern; the GDP share was 37.6 percent in 2000, went up to 40.4 percent in 2010, and increased to 50.4 percent in 2017.
These structural changes are related with the changes in the regional distribution of gross regional product. In terms of GDP share by region (
Table 2), in 2000, the GDP share of Region 1 was 57.3 percent, and Region 2 and Region 3 are, respectively 25.6 percent and 17.1 percent. In 2010, the GDP share of Region 1 happened to be the same 57.3 percent, while Region 2 decreased to 24.1 percent, but Region 3 increased to 18.6 percent. In 2017, the GDP share of Region 1 declined to 55.7 percent, meanwhile Region 2 lingered around 24.4 percent, and Region 3 escalated to 19.9 percent. The numbers show that although Region 3 is narrowing the gap with Region 2, the GDP share between the coastal region (Region 1) and the interior area (Regions 2 and 3) remains almost unchanged.
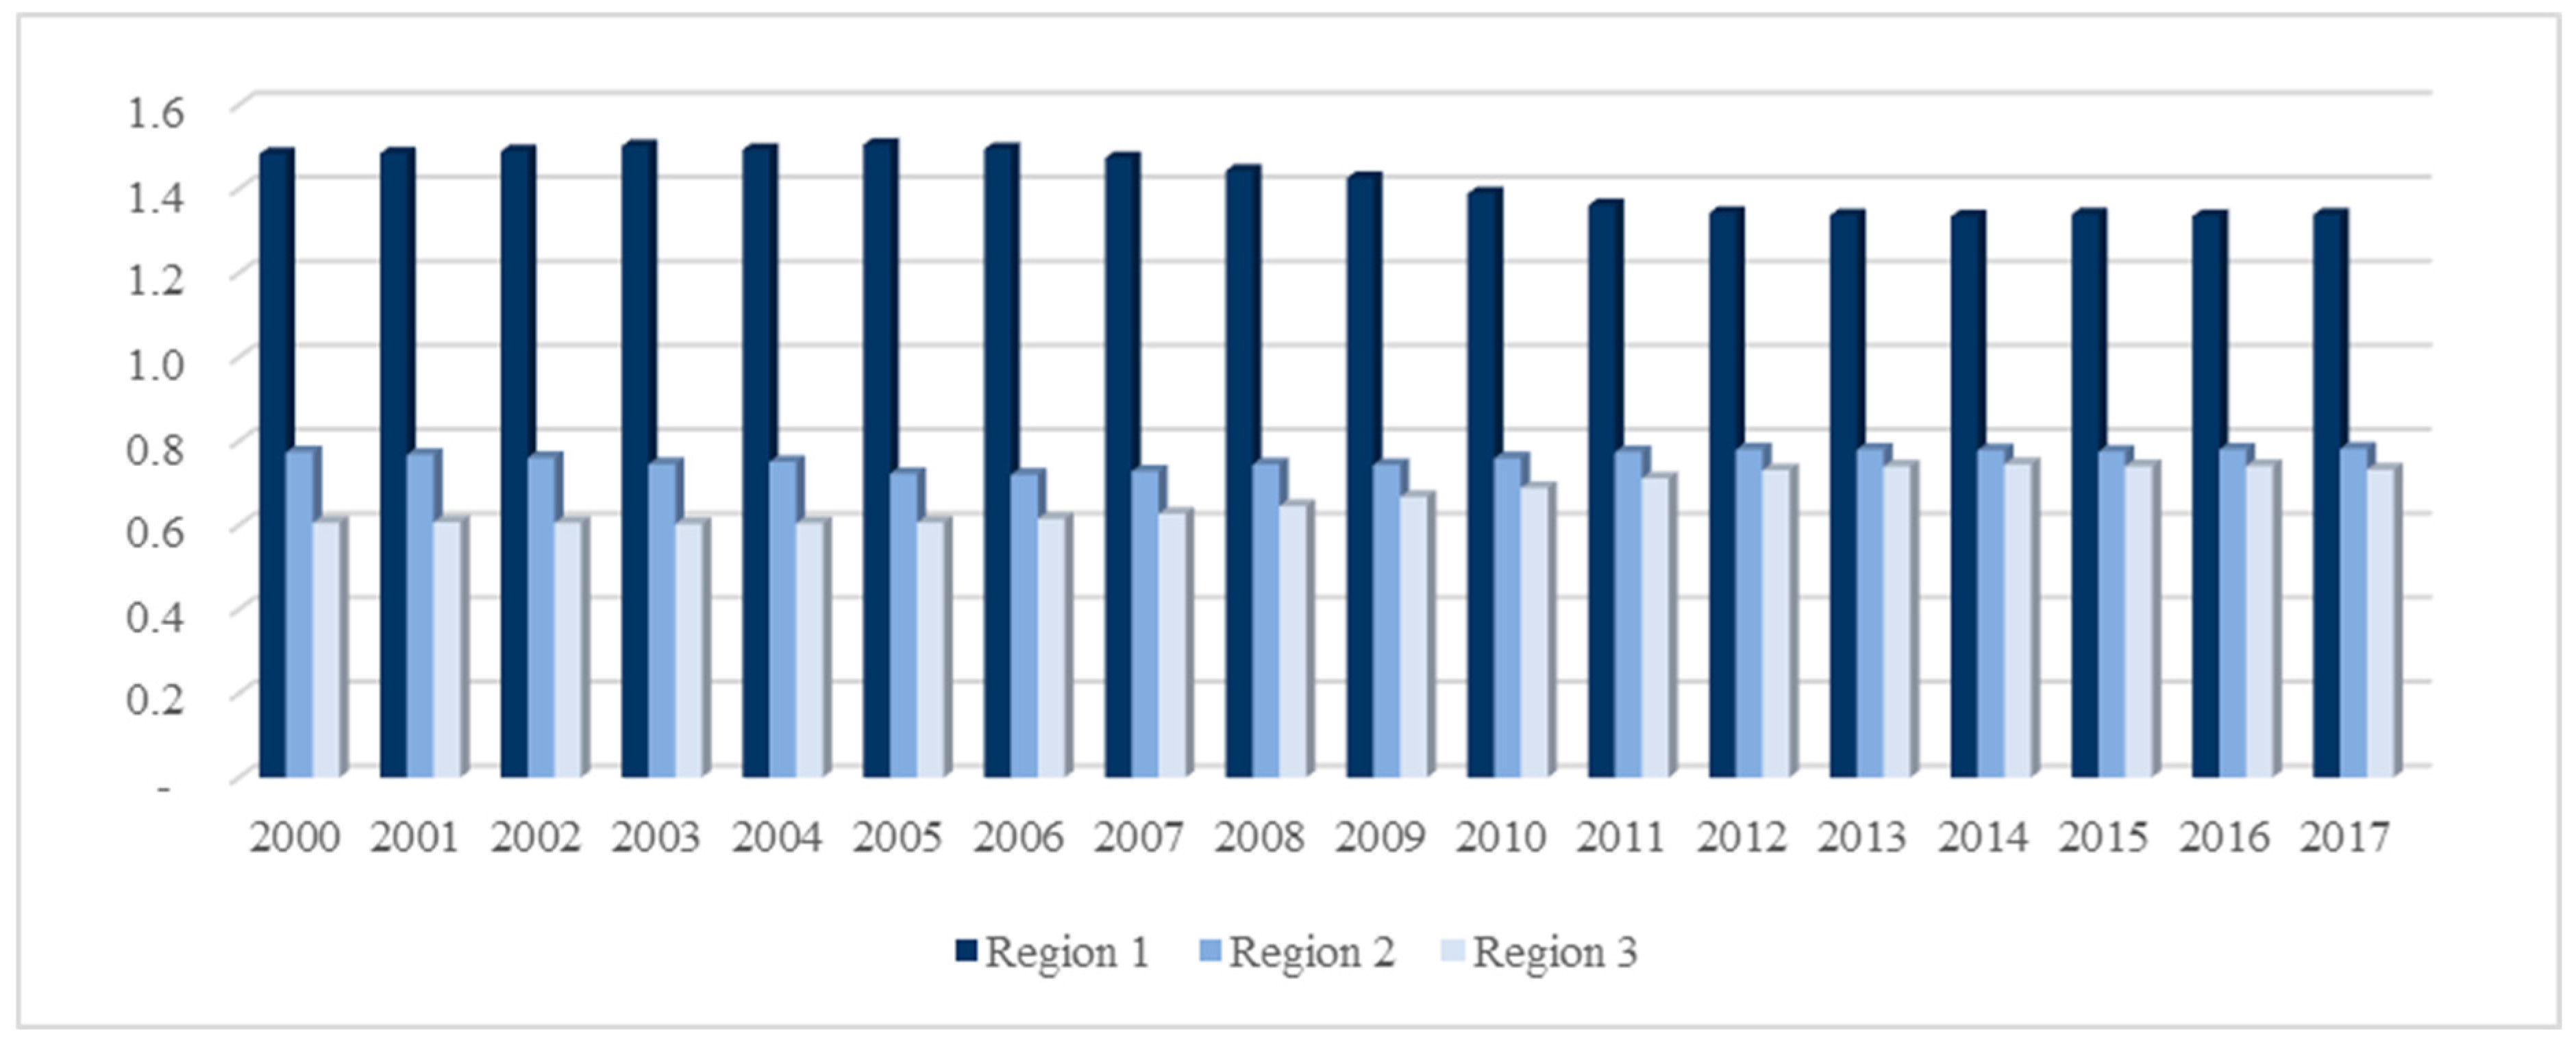
In terms of per capita GDP by region (
Figure 2), it is obvious that per capita GDP in Region 1 is much higher than both Region 2 and 3. To be more specific (
Table 2), in 2000, the per capita GDP in Region 1 was 1.48, while the per capita GDP of Region 2 and 3 were, respectively 0.77 and 0.61, which are only 52 percent and 41 percent of Region 1’s per capita GDP. In 2010, the per capita GDP in Region 1 was 1.39, meanwhile Region 2 was 0.76 and Region 3 rose to 0.69. In 2017, the per capita GDP in Region 1 went down to 1.34, but both Region 2 and Region 3 enjoyed a per capita GDP increase with Region 2 from 0.76 to 0.78 and Region 3 from 0.69 to 0.73. In 2017, the per capita GDP of Region 2 and 3 was 58 percent and 54 percent of Region 1’s per capita GDP. Although the per capita GDP difference is still large between the coastal region (Region 1) and the interior area (Region 2 and Region 3), it is good to see that the interior area is catching up with the coastal region.
5. Regional Inequality
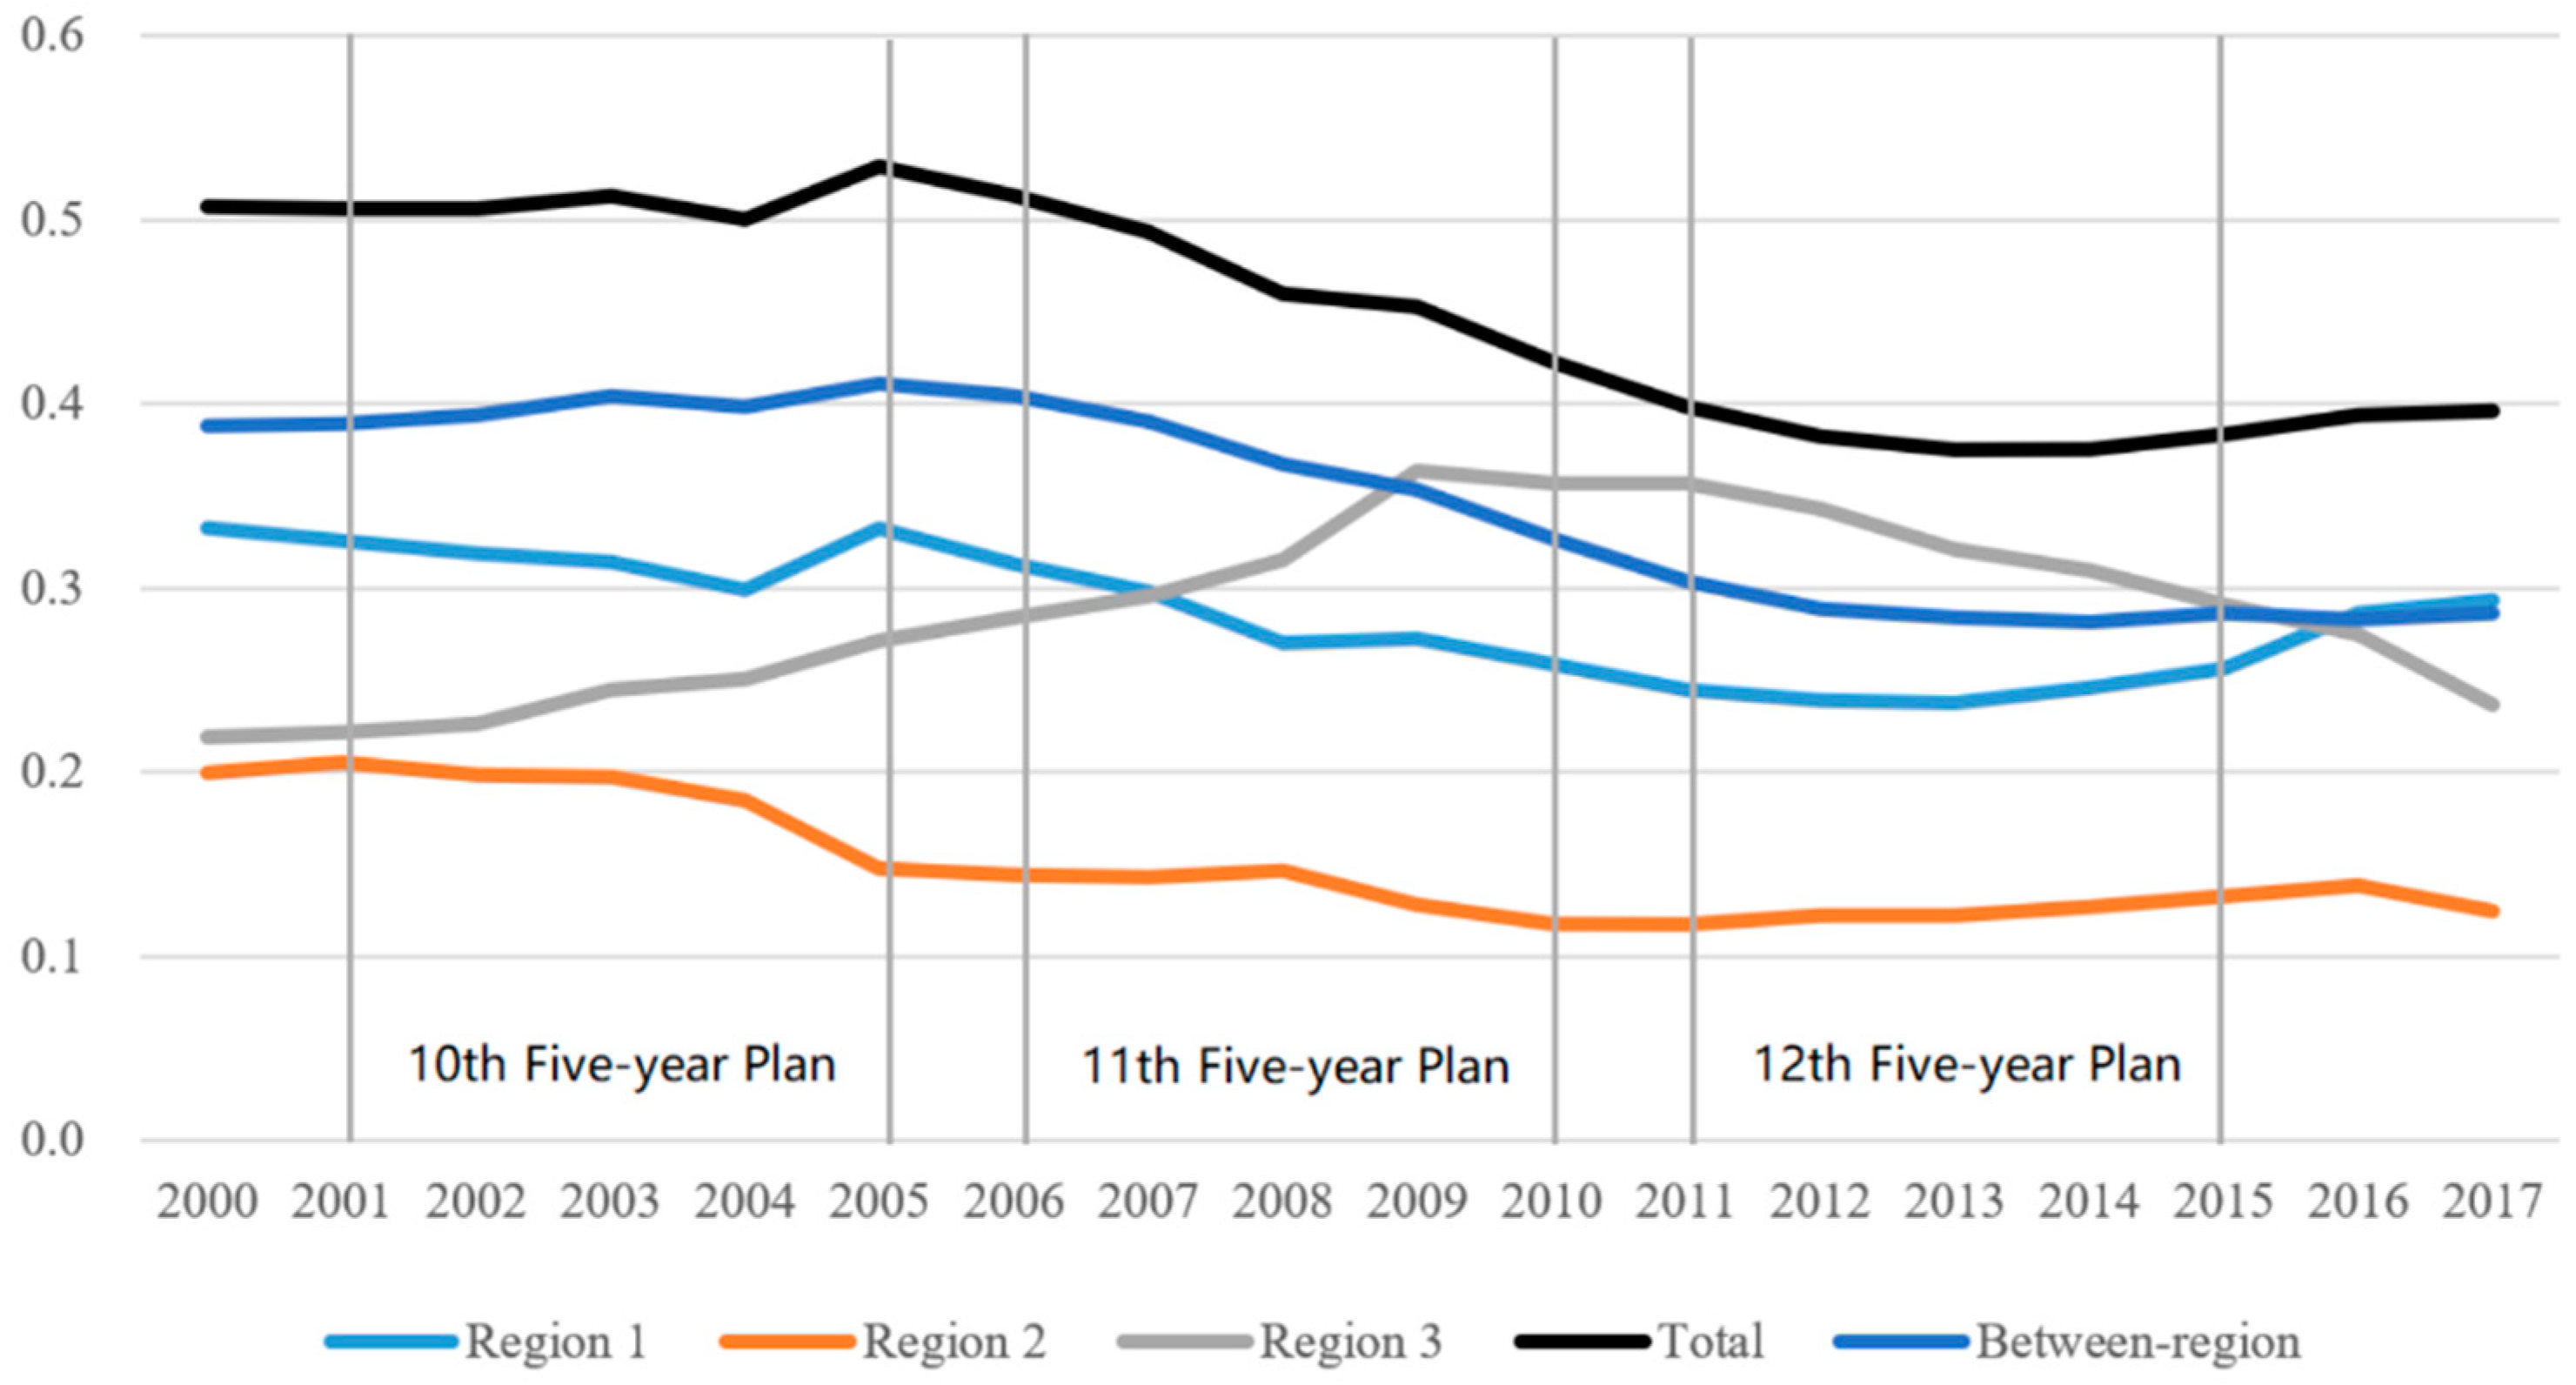
The regional inequality in per capita GRP at constant 2000 prices is shown in
Figure 3.
The whole period can be divided into three sub-periods, i.e., 2000–2004, 2005–2012 and 2013–2017. It can be seen that the total interprovincial inequality exhibits a stable trend during 2000–2004, an obvious declining trend during 2005–2012 and a slightly upward drift during 2013–2017.
The first sub-period is between 2000 and 2004, in which the interprovincial inequality rose slightly from 0.39 to 0.40. This sub-period coincides with China’s “Tenth Five-year Plan” period (2001–2005), in which the focus is put on the strategic adjustment of economic structure to meet the challenges of fresh entry into the WTO. The economy registered an annual average per capita GDP growth rate of 13.91 percent during the period. The second is from 2005 to 2012, in which the interprovincial inequality dropped sharply from 0.40 to 0.29. This sub-period almost overlaps with China’s “Eleventh Five-year Plan” period (2006–2010), in which one of the major tasks is to coordinate the development of urban and rural regions. Moreover, in 2006, the State Council approved the “Eleventh Five-Year Plan for Western Development”, which explained the drop in interprovincial inequality during this period. As a result, the economy achieved an annual average per capita GDP growth rate of 17.14 percent. The third sub-period is from 2013 to 2017, in which the interprovincial inequality became stable at around 0.29. This sub-period spans China’s two “Five-year Plan” periods, which are the “Twelfth Five-year Plan” (2011–2015) and “Thirteenth Five-year Plan”, (2016–2020), in which one of the focused areas is to promote regional coordinated development by optimizing the distribution of productive forces and bringing into full play the comparative advantages of different regions. After the high-speed per capita growth rate of the previous periods, the economy slowed down and only obtained an annual average per capita GDP growth rate of 7.94 percent.
6. Decomposition of Regional Inequality
6.1. Decomposition by Regional Groups
The study decomposes regional inequality into within-region and between-region inequality components as shown in
Table 3.
As is shown in the left side of
Table 3, both within-region (WR) and between-region (BR) inequality components declined conspicuously, with within-region inequality component reducing from 0.107 to 0.076 and between-region inequality component from 0.151 to 0.082. It is obvious that much of the interprovincial inequality comes from the between-region inequality component. Among the three regions, Region 1 and Region 2’s within-region inequality decreased, respectively from 0.111 to 0.086, and from 0.040 to 0.016, but Region 3’s inequality increased from 0.048 to 0.056, which means Region 1 and 2 contributed to the decrease in the within-region component, in other words, the overall interprovincial inequality. Region 3 made no contribution and offset the decrease in overall interprovincial inequality.
In the right side of
Table 3, the within-region contribution changed from 41.4 percent to 47.9 percent, an increase of 6.5 percent; while the between-region contribution changed from 58.6 percent to 52.1 percent, a decrease of 6.5 percent, which means that within-region contribution to interprovincial inequality is becoming more important. Among the three regions, Region 1’s contribution rose from 36.4 percent in 2000 to 40.8 percent in 2017, while the contribution of both Region 2 and Region 3 was very small. Of the total within-region contribution of 47.9 percent in 2017, Region 1’s share is 85 percent reflecting the overwhelming share of Region 1 and unbalanced development between China’s coastal area (Region 1) and interior provinces (Region 2 and 3).
6.2. Bi-Dimensional Decomposition by Regional Groups and GDP Components
It is shown in
Table 4 that in 2000, the between-region contribution was 58.6 percent, while the within-region contribution was 41.4 percent. In 2017, the between-region contribution was 52.1 percent, and the within-region contribution was 47.9 percent. Actually, during the study period, the between-region contribution was always larger than the within-region contribution. Among the three regions, it is observed that the contribution of both Region 2 and 3 is insignificant. In 2000, Region 2 accounted for 3.1 percent and Region 3 for 1.9 percent. In 2017, Region 2’s contribution fell to 1.9 percent, while Region 3 increased to 5.2 percent. One noticeable thing is that Region 3’s contribution jumped from 1.9 percent in 2000 to 9.1 percent in 2010 due to the contribution of industry, wholesale, retail trade and catering in light of China’s Western Development Strategy. The within-region contribution mostly comes from Region 1, rising from 36.4 percent in 2000 to 40.8 percent in 2017, due to the increasing contribution of the financial intermediation sector. It is not surprising to see this contribution as the majority of China’s banks, securities firms and insurance companies are located in Region 1. Taking the securities sector as an example, China’s two stock exchanges—Shanghai Stock Exchange and Shenzhen Stock Exchange are situated in this region, and the newly opened Beijing Stock Exchange can only reinforce the contribution. Moreover, the headquarters of China’s 133 securities companies are mostly either in Beijing, Shanghai or Shenzhen, all in Region 1. Nevertheless, between 2005 and 2010, Region 1’s contribution fell from 35.5 percent to 29.8 percent; the transport, storage and post sector is attributable to the drop in Region 1’s contribution.
It is worth noticing that the majority of total contribution comes from the between-region contribution, taking up 57.3 percent during the study period.
7. Conclusions
This paper has tried to explore the changes in the determinants of regional inequality in China during the period of 2000 to 2017 by way of bi-dimensional decomposition method. The method integrates two inequality decompositions by both regional groups and gross regional product components, helping us to evaluate the contributions of gross regional product components to both within-region and between-region inequalities, and to overall interprovincial inequality.
The major findings are summarized as follows.
Firstly, it is found that the overall inequality displayed a declining trend and the “Western Development Strategy” in Region 3 during the second sub-period from 2005 to 2012 contributed mostly to the decrease in interprovincial inequality. As Chengdu, the capital city of Sichuan province and Chongqing, a municipality under the direct jurisdiction of the central government, are not only the two largest cities in Region 3, but cities with enormous economic radiation effect. It is evident that the declining trend in interprovincial inequality would be more convergent along with the implementation of the “Outline of the Construction Plan for the Economic Circle in the Chengdu-Chongqing Region” and “Chengdu-Chongqing Co-construction Plan for Western Financial Center”.
Secondly, 57.3 percent of the interprovincial inequality is accounted for by the between-region inequality component, which calls the government’s attention to the unbalanced regional development between the coastal region (Region 1) and the interior area (Region 2 and Region 3). In 2020, out of the ten largest cities in terms of GDP in China, seven cities belong to Region 1, one city (Wuhan) in Region 2 and two cities (Chongqing and Chengdu) in Region 3. Compared with the coastal region, the interior area is naturally deficient in terms of geographic location, topography, climate, and foreign investment attraction, etc. The central government should give the interior area more preferential policies in terms of tax deduction, transfer payments, foreign trade promotion and the like.
Thirdly, the industry sector is the key contributor to within-region inequality, with its contribution from 15.1 percent in 2000 to 13.9 percent in 2017. It is not surprising to see this as China is well-known as a powerful manufacturing country, and every year various products made in China are exported to the rest of the world. Meanwhile, the primary sector has reduced its contribution to within-region inequality, with its contribution from −1.4 percent in 2000 to −1.2 percent in 2017.
Fourthly, Region 1 is the major contributor to within-region inequality, contributing 36.4 percent out of 41.4 percent to within-region inequality. In Region 1, the industry sector has played a leading role in the within-region inequality with a 15.1 percent contribution in 2000 and 10.8 percent contribution in 2017. Furthermore, the primary sector has reduced its contribution to within-region inequality of Region 1 from −1.7 percent in 2000 to −1.3 percent in 2017. In Region 2, there seems no outstanding contributor to within-region inequality. In Region 3, the industry sector again is the main contributor to within-region inequality and the contribution rose from 0.6 percent in 2000 to 2.3 percent in 2017. One fact worth mentioning is that the industry sector is the main contributor for both Region 1 and Region 3, as China’s manufacturing bases are all located in these two regions.
Fifthly, the tertiary sector exhibited a steadily increasing trend. The GDP share of the tertiary sector rose from 37.6 percent in 2000 to 50.4 percent in 2017, and the contribution of the tertiary sector to within-region inequality also increased proportionally due to the emergence of such new market forms as Meituan’s meal delivery service, Tik Tok’s e-commerce sales, Didi taxi, etc.
Lastly, our findings are consistent with the research results from Wu Rongwei et al. (2018), Li Yuheng (2012), Wei Sun et al. (2016), and Ye Xiaosu et al. (2017) that regional inequality is declining and between-region inequality is the major source of regional income inequality. One noticeable fact is that our study period is from 2000–2017, reflecting the structural changes and income inequality in the fifteen years since China entered the WTO. To fulfill WTO entry promises, China has gone through radical structural changes during this period, and regional income inequality worsened in the third sub-period from 2013 to 2017 along with the economic development. In other words, to understand if regional income inequality will become convergent again, further studies beyond 2017 should be done.


