1. Introduction
Global climate change caused by rapidly increasing greenhouse gas content in the atmosphere poses a great risk to humans. To mitigate this risk, the Paris Climate Change Accord defines the limit of temperature increase to avoid irreversible changes and encourages each member country to meet its own CO
2-reduction targets [
1]. For mitigation measures, energy transition from fossil fuels to renewable energy has progressed, but it can only reduce the emission amount of greenhouse gases. Reducing the emission amount alone is not sufficient, and hence, a measure to reduce the overall greenhouse gas content is required. Carbon capture, utilization, and storage (CCUS) is recommended as a key technique that enables the removal of significant amounts of CO
2 from a project perspective.
Aquifers are considered prospective sites for geological sequestration of greenhouse gases. Aquifers containing brine can dissolve CO
2. Particularly, aquifers can sequester CO
2 with high storage efficiency by maintaining the injected CO
2 in a liquid or supercritical phase owing to the hydrostatic pressure and geothermal temperature. However, it has a technical problem of salt precipitation [
2], which may clog pore throat resulting in decreasing CO
2 injectivity, and a limitation on the injection volume. The limitation is that the injection volume should not exceed the fracturing pressure of the formation, particularly in a closed aquifer. Injected fluid can induce fractures in formations [
3], micro-seismic events [
4], and earthquakes [
5]. Additionally, a formation pressure higher than the cap rock capillary entry pressure can break the stability of the CO
2 storage system. The fracturing pressure against regional pressurization due to CO
2 injection is a key constraint on the CO
2 storage capacity.
The size of the geological structure is another constraint on the CO
2 storage. The CO
2 storage resource management system (SRMS) highlights a high confidence in the commercial storage of geological formations, as supported by confinement [
6]. According to the principle of hydrocarbon fill-and-spill, the remaining CO
2 after displacing the native formation water of the structure migrates upward beyond the spill point. It may be untraceable during the migration along the aquifer; i.e., whether it reaches the biosphere may not be clear. During migration, it can be trapped by residual saturation, mineralization, dissolution, or other structures. However, it can also leak to the surface. The geological structure is the most reliable confinement for geological storage projects. The structure size is generally regarded as pre-determined, but it can be increased if the geological conditions meet specific requirements. Interbedded impermeable layer below the spill point is a potential opportunity for storage capacity expansion. If the injected CO
2 plume is steered to the substructure generated by the cap rock with the interbedded impermeable layer, the storage capacity can be increased without an additional injector.
A traditional strategy is to inject CO
2 and let it flow upwards [
7]. Once an injector is drilled in the lower part of the aquifer, CO
2 tends to migrate upward because of its lower density than that of brine. If the upper seal rock functions effectively, injected CO
2 can be trapped in the structure. This concept is applied to depleted oil or gas reservoirs [
8], which have a proven sealing structure and reduced formation pressure due to the long period of hydrocarbon production. However, it is challenging to apply this concept to aquifers. The increased aquifer pressure due to the injected CO
2 may result in the mechanical instability of the formation. To mitigate this risk, several concepts of pressure management were suggested in earlier studies [
9,
10,
11,
12,
13].
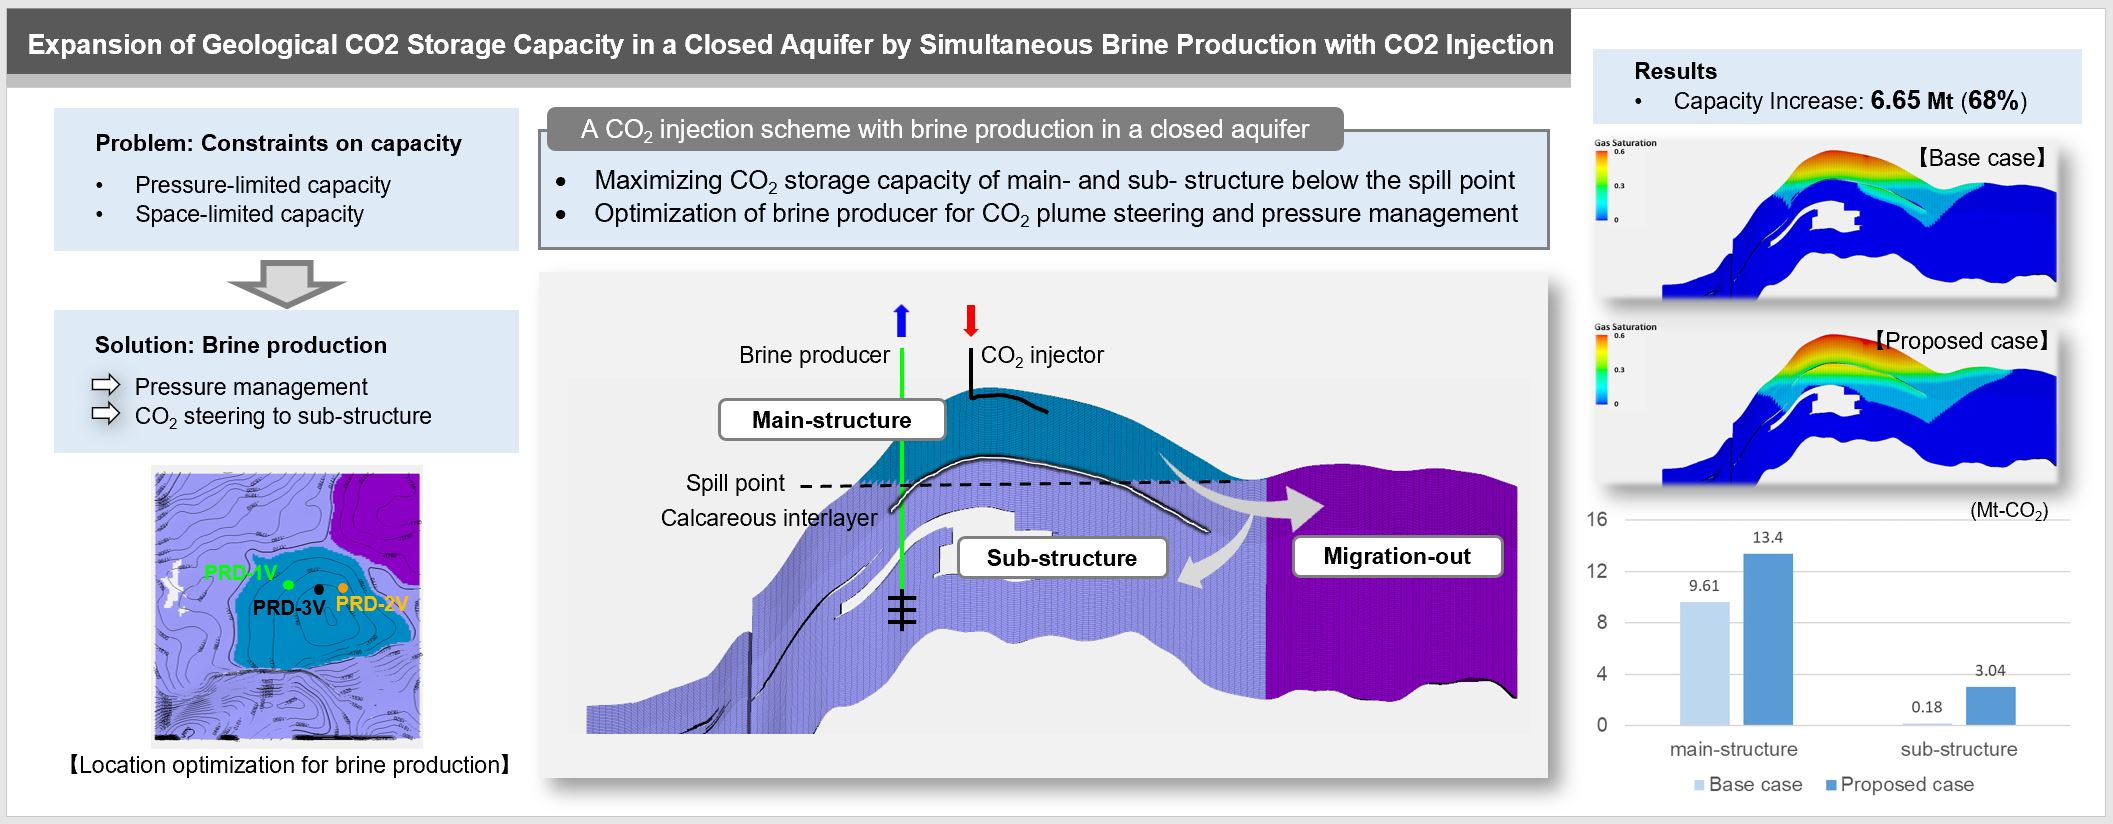
Here, an injection scheme with an additional substructure below the spill point is investigated for the structural trap in the aquifer. It applies the strategy of pressure management to prevent the formation of fractures and to steer CO2 plumes as long as the brine producer does not produce injected CO2. This study investigates the potential candidate schemes, which are a combination of various types of injectors and producers, from the perspective of quantities of trapped CO2 in the main structure and substructure, and evolution of the CO2 plume.
4. Results and Discussion
The pressure management strategy was optimized by comparing cases with various combinations of injectors and producers to meet the following requirements. The formation pressure does not exceed the threshold pressure for the fracturing pressure of the cap rock. The injected CO2 was not produced by brine production. The injected CO2 can be trapped in the structure as much as possible, particularly in the substructure, by steering the CO2 plume.
Table 5 summarizes the injection time, total injection mass, and CO
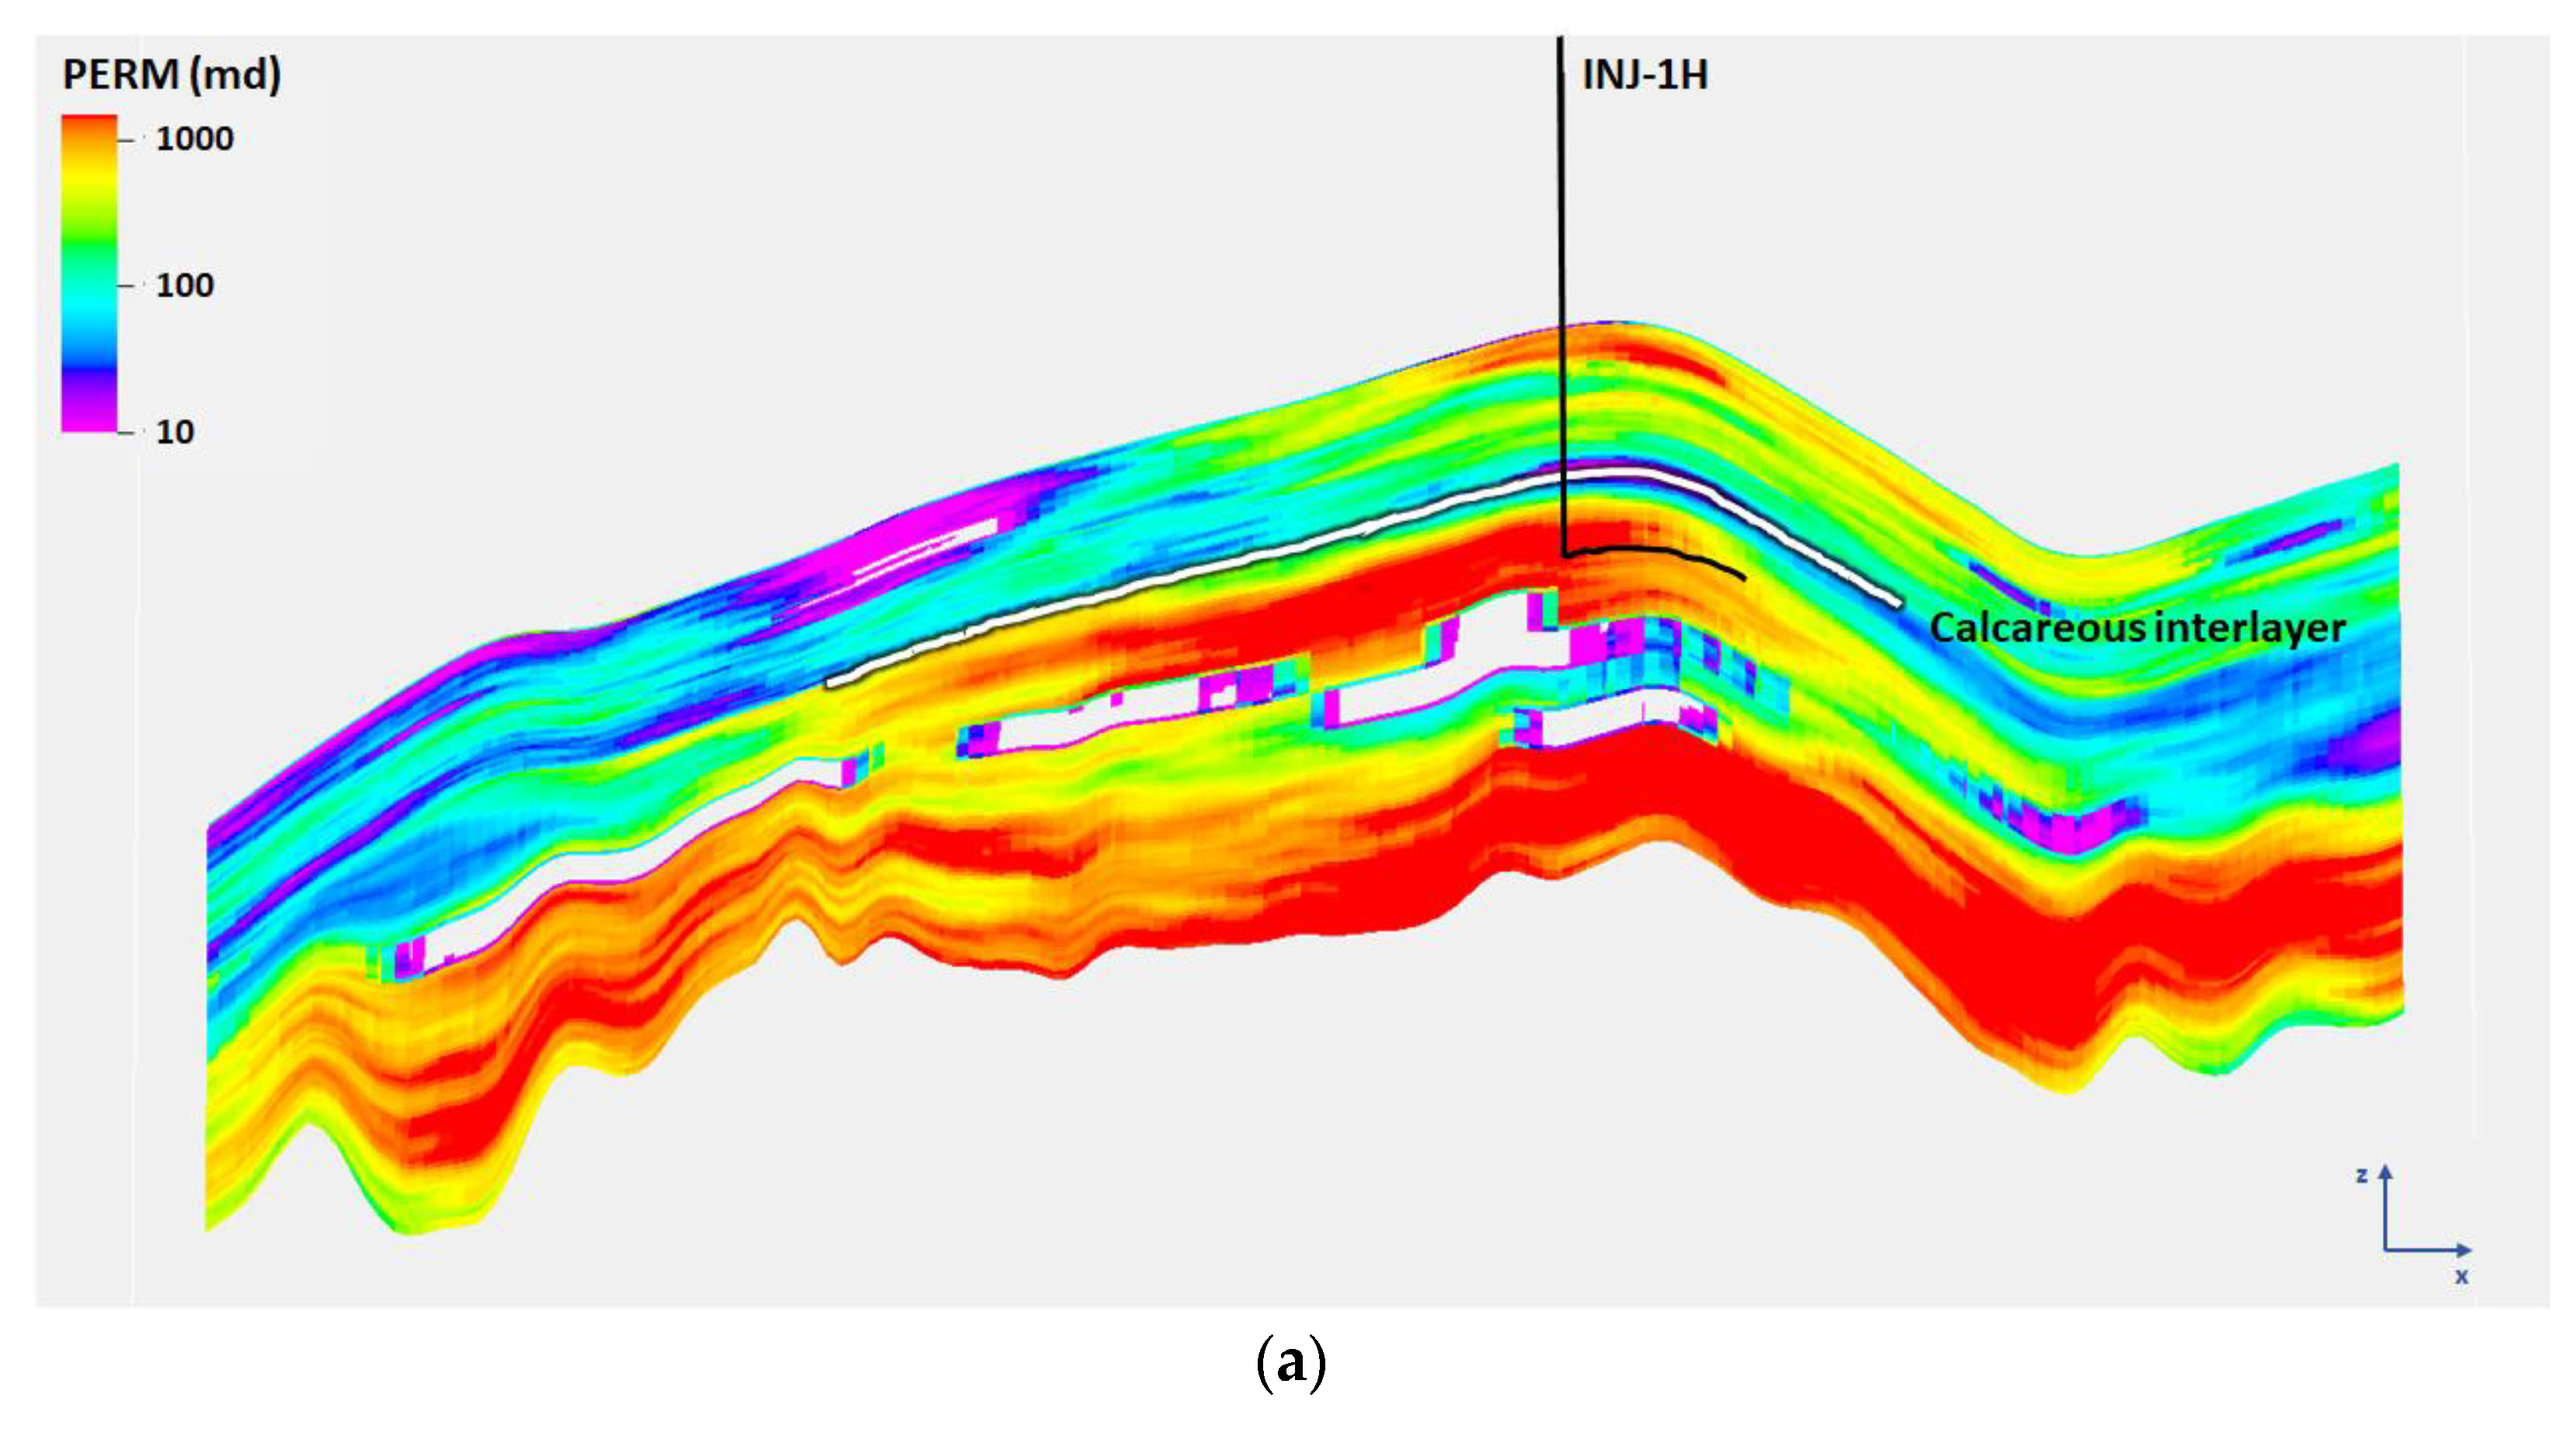
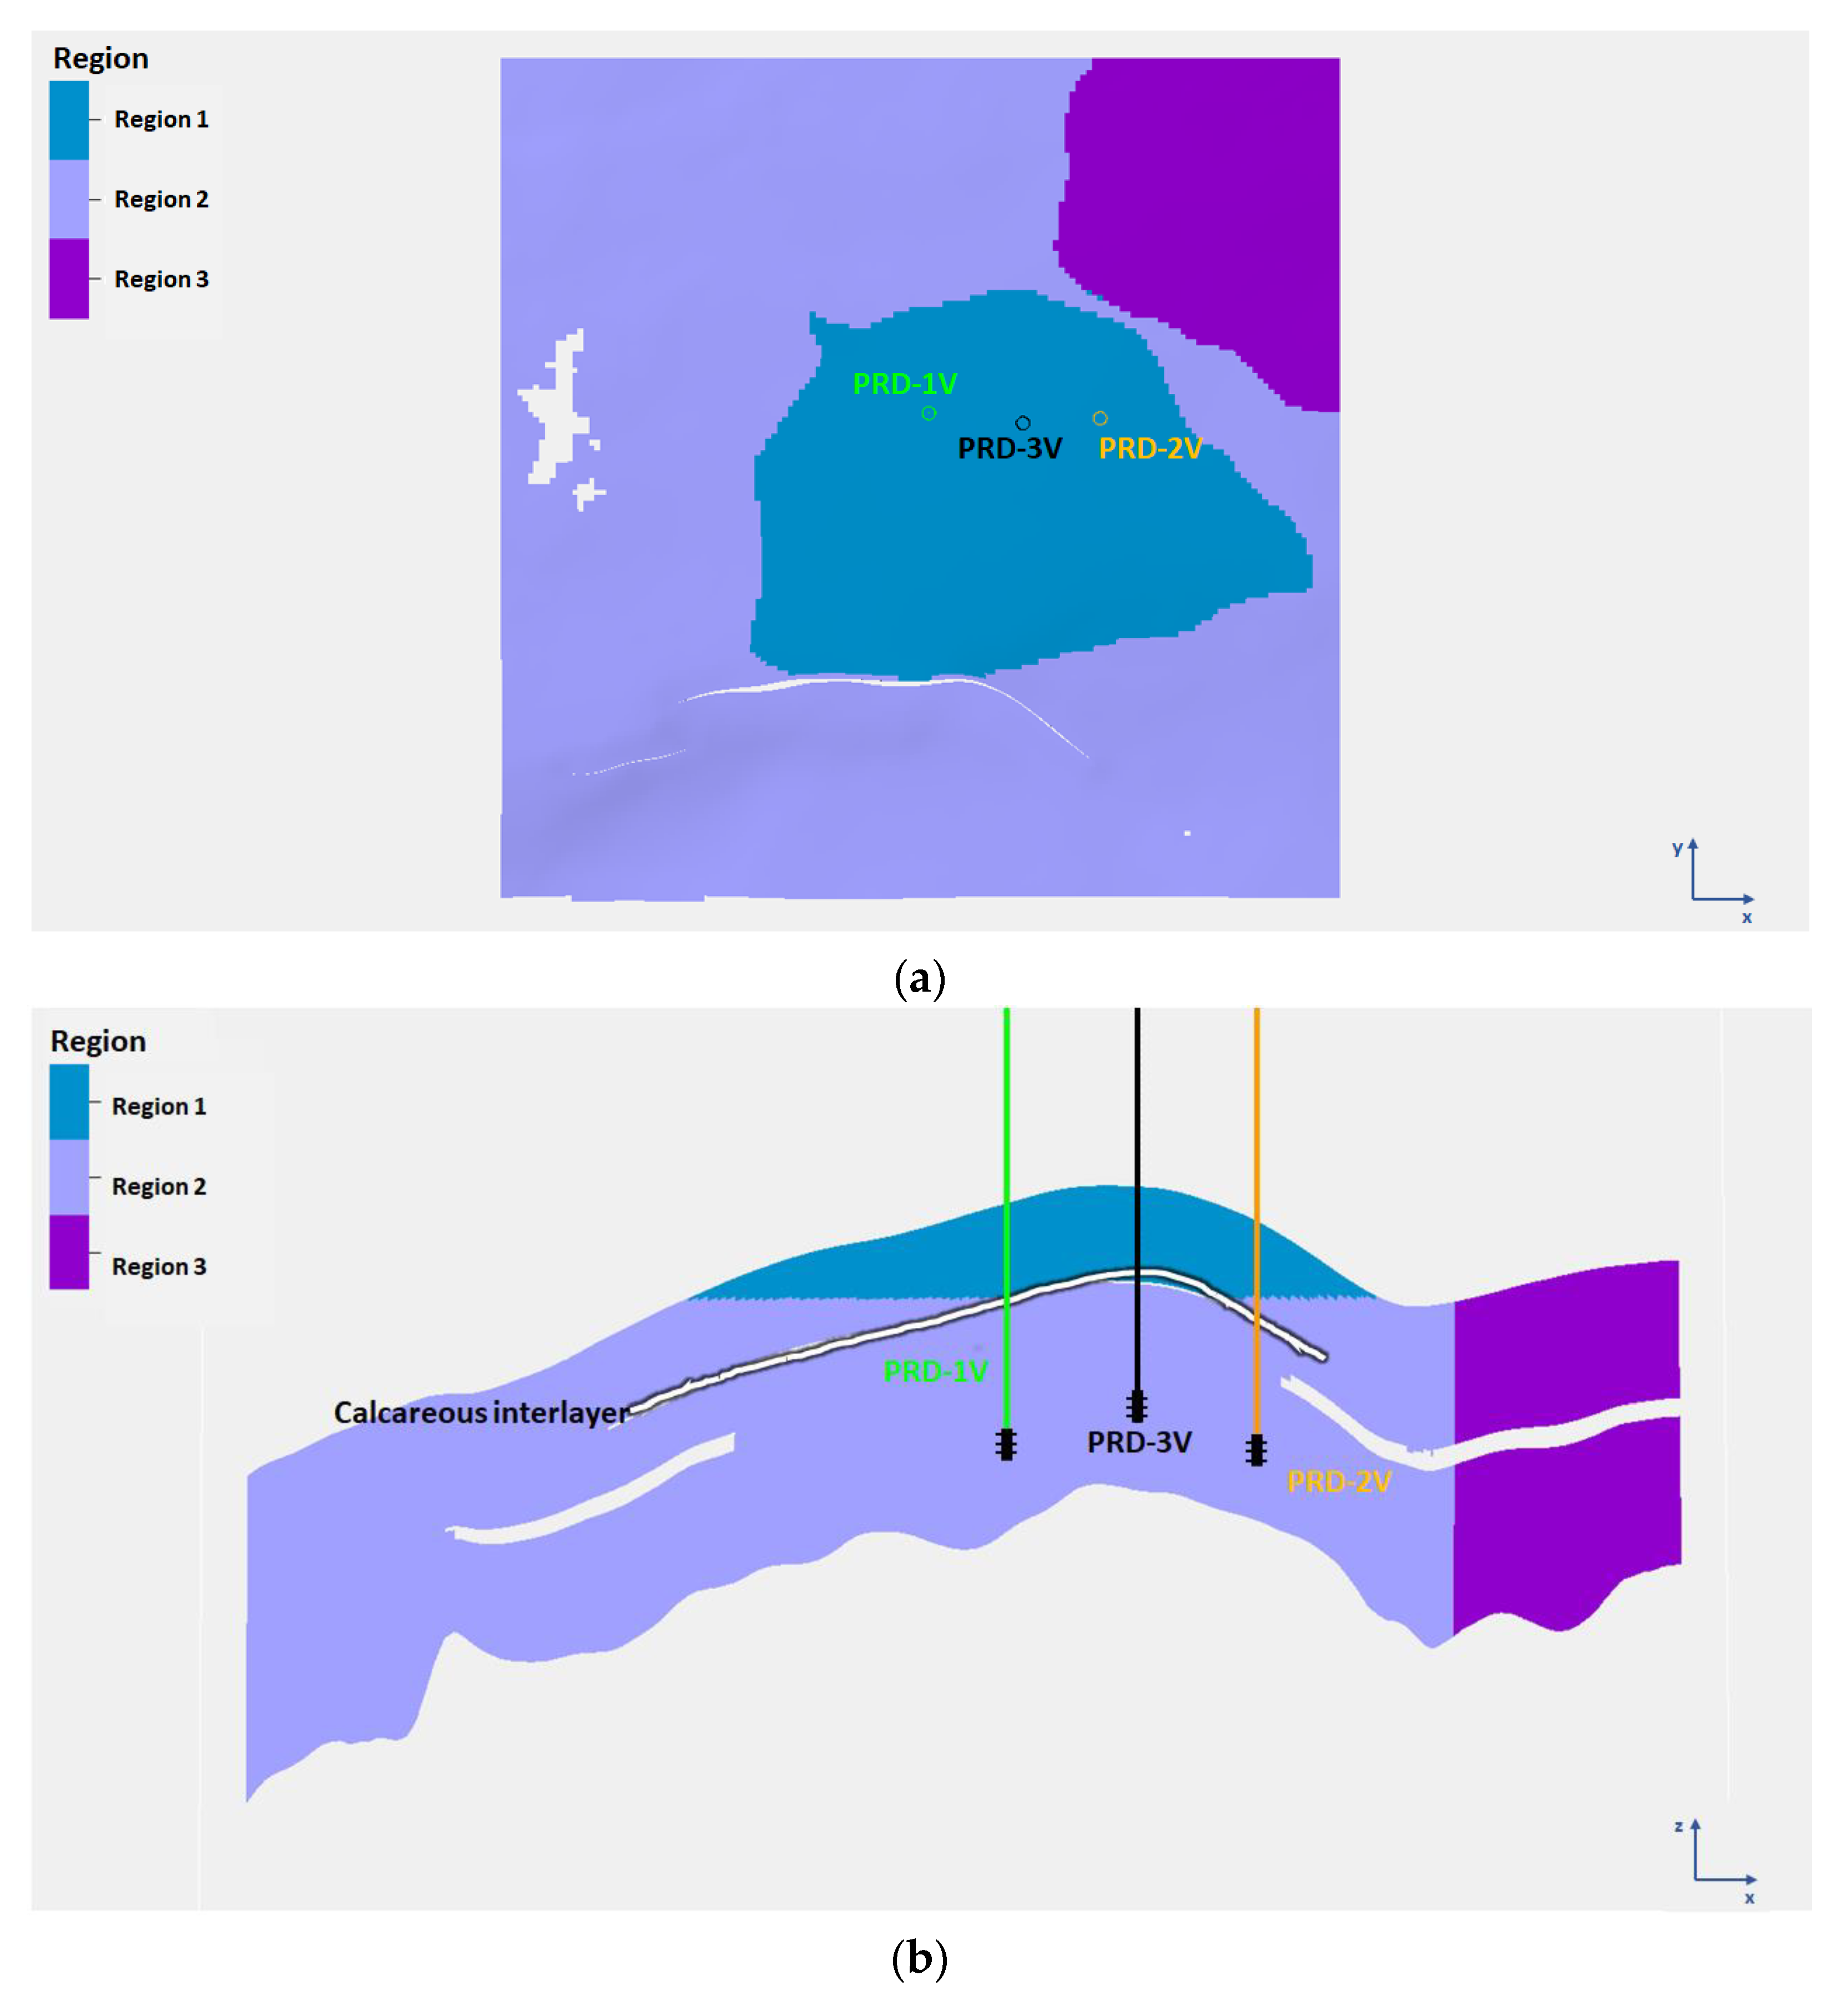
2 capacity, and shows the pressure constraints and effects of pressure management. The lower injector of CASE 1 has a limited effect on the pressure constraint because the injector is located far away from the reference point for the formation fracture, as shown in
Figure 5. Additionally, it takes a long time to propagate the pressure buildup from the aquifer bottom due to the calcareous barrier ceiling of the substructure. Additional CO
2 can be injected during the extended time over CASE 2 until the formation pressure reaches the threshold pressure of formation fracture. However, it is the highest limit because the scheme has an obstacle for brine production due to the CO
2 production associated with brine production. The migration direction due to buoyancy is the main reason for not locating the brine producer, even in the upper part of the aquifer. More injection volume without brine production causes the over-pressure around the weak formation, which can be a potential risk on the structure stability.
Pressure management has a significant effect on the CO
2 injection mass summarized in
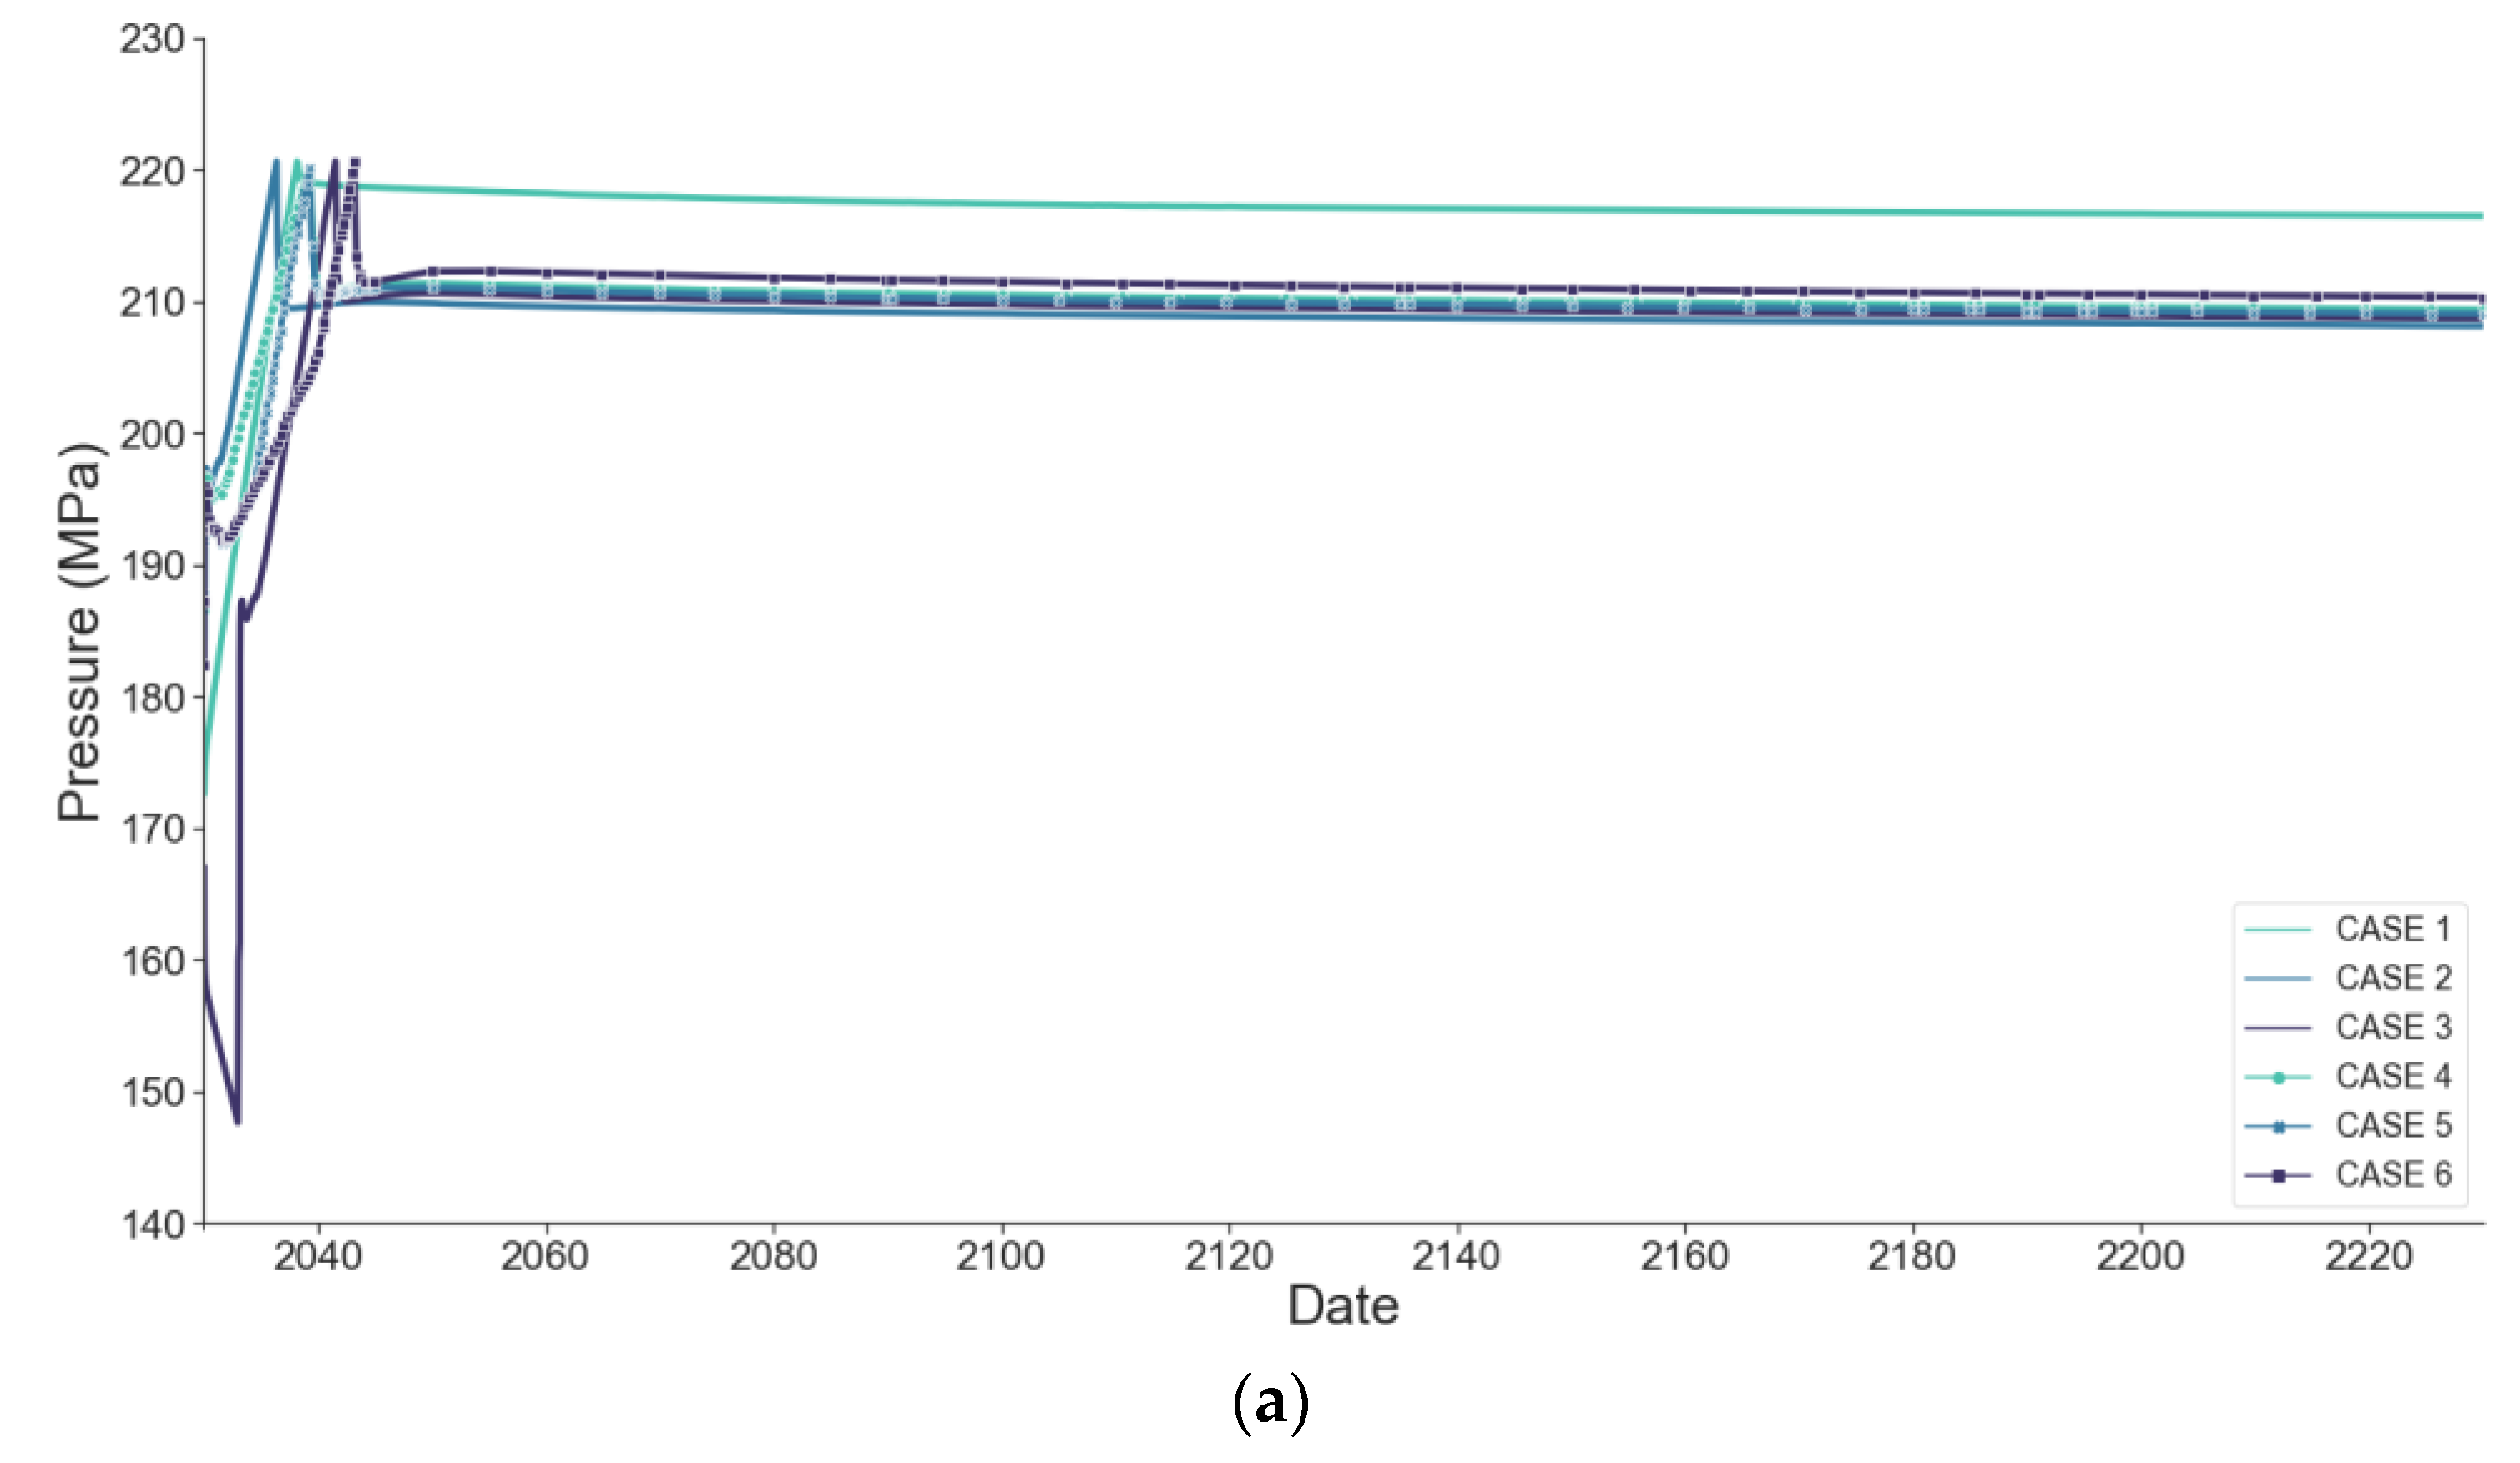
Table 5. It enables at most 6.8 years of additional injection time compared to the cases without brine production. From the formation pressure behaviors shown in
Figure 7, the formation pressure of CASE 3, pre-injection brine production, was reduced linearly below the initial formation pressure before ceasing brine production. Then, the formation pressure increased discretely for 3 months, i.e., a shut-in period of 3 months to convert the brine producer into a CO
2 injector. Once CO
2 was injected into the aquifer, the formation pressure increased rapidly until it reached the pressure threshold of the fracturing pressure of the cap rock. The simultaneous brine production case of CASE 4 exhibits a trend of formation pressure increase with a gradual slope. The target production rate is set to 5000 m
3/d, but it cannot meet the target due to the lower limit of bottomhole pressure, as shown in
Figure 8. The simultaneous injection with higher rate production in CASE 5 has a dual slope, and its intersection is the point at which brine production stops due to CO
2 breakthrough. Despite the relatively short period of brine production (4.4 years) indicated in
Figure 8, a low formation pressure can be maintained due to the higher production rate. Well completion in the interval with higher permeability enables the brine production as much as CASE 4 in a shorter period. CASE 6 shows the longest CO
2 injection time owing to the higher production rate and delayed CO
2 breakthrough. It drives CO
2 injection for 13.2 years, which is longer than that of any other pressure management case.
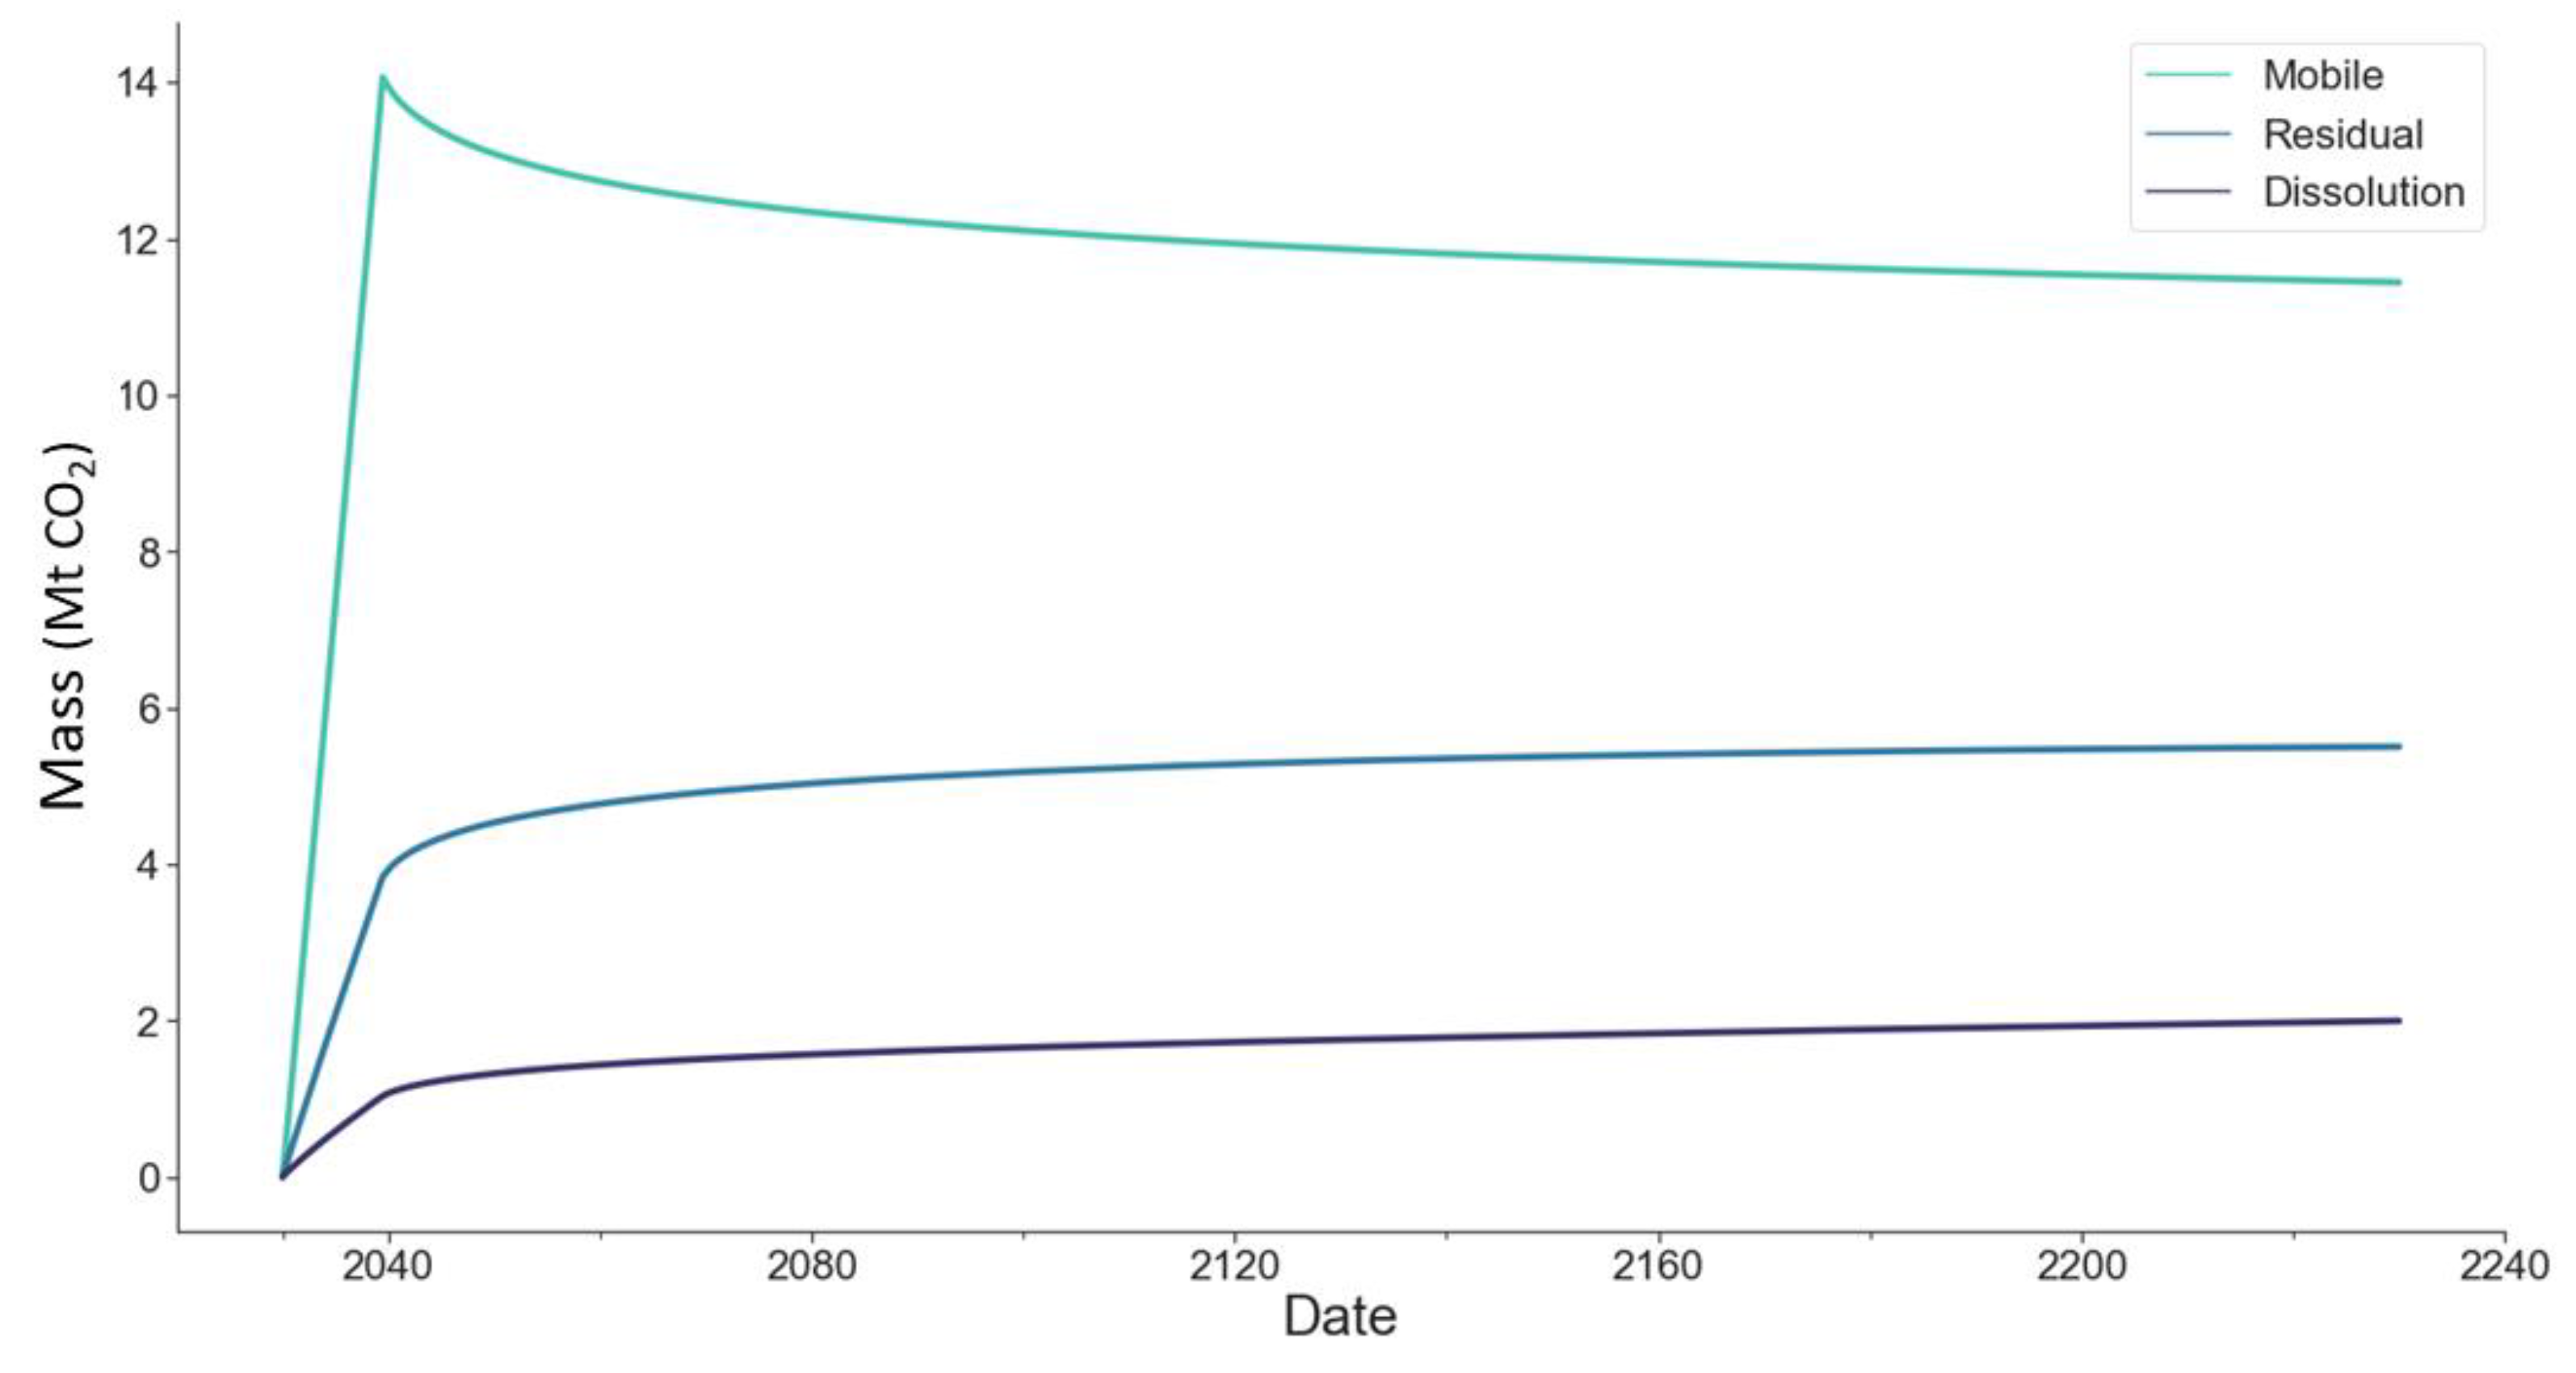
The injected CO
2 masses categorized by sequestration mechanism and region are summarized in
Table 6. The combination of sequestration mechanisms and sequestrated regions can provide a basis for prioritizing the sequestration concept. The sequestration mass by structural traps and residual saturation traps in the main- and the sub-structure was determined as the CO
2 capacity, as discussed in
Section 3.2. The mass beyond the spill point cannot be certified as a proven storage even if it is trapped by saturation residual or dissolution in the simulation results. Although the sequestrated mass by residual and dissolution is known to be stable, the actual quantity is highly uncertain depending on the parameters or coefficients.
The effects of the injector location were analyzed in two cases, as described in
Section 3.3. Only CASE 1 had an injector below the substructure. It fills the substructure first, and then the injected CO
2 migrates to the main structure. Because of the buoyancy of CO
2, its dominant migration direction is vertical. This resulted in a negligibly small mass of migration beyond the spill. While vertically migrating long distances from the aquifer bottom to the top, it sequestrates the large amount of residual trapped CO
2. CASE 1, which sequestrates the most mass in the substructure, contains CO
2 in the main structure as well, as shown in
Figure 9a. However, the amount in the main structure is relatively small compared to the whole size of the main structure, and hence, CASE 1 cannot be an efficient sequestration concept. Contrarily, CASE 2 cannot fill the substructure as shown in
Figure 9b. The calcareous layer, which is a cap rock of the substructure, acts as a bottom barrier, and buoyancy causes the CO
2 plume to migrate out of the structure.
For the pre-injection brine production in CASE 3, a single well was drilled and utilized as a brine producer and a CO
2 injector sequentially. It is less effective from a pressure management perspective compared to that of CASE 4, 5, or 6 because of the rapid build-up of formation pressure. When shut-in for well conversion, the formation pressure of the reference location recovers immediately. Once the CO
2 injection commences, the recovered formation pressure, which is still below the initial pressure, starts to build up rapidly and finally reaches the pressure threshold of the fracturing pressure, as shown in
Figure 7b. As CO
2 is injected into the under-pressured zone by brine production, the scheme displaces the zone with CO
2 rather than overflowing beyond the spill, as shown in
Figure 9c. Although it has the disadvantages of project delay and less efficiency, it can be selected for reasons of less CAPEX (capital expenditure) and confident operation based on the test analysis through prior drawdown.
CASE 4 implements pressure management by simultaneous brine production using an additional well. The results show that this is a measure to extend the sequestration capacity by overcoming pressure constraints. It enables an additional 3.1 years of CO
2 injection compared to that of the control case (CASE 2). The additional injection mass was almost 6.1 Mt, although the migration mass beyond the spill increased proportionally to the total injection mass. It still cannot make better use of the substructure for sequestration site considering only 0.98 Mt sequestration mass in the substructure. The brine producer was drilled below the substructure, away from the CO
2 injector, and perforated in the interval with poor permeability. The effects of pressure management were not directly propagated to the reference point of the cap rock. Additionally, the producer is located in the opposite direction to the migration pathway; therefore, there is no drive for the CO
2 plume to dig beneath the cap rock of the substructure. The CO
2 plume from the main structure developed to be distributed both in the substructure and beyond the spill, as shown in
Figure 9d.
CASE 5 has a producer inside the substructure along the migration pathway. The formation pressure was reduced around the brine producer, which drove the CO
2 plume to migrate beneath the top of the substructure. If the brine producer is close to the migration pathway, the steering effects to the substructure can be enhanced, rather than migrating beyond the spill as illustrated in
Figure 10. However, early CO
2 breakthrough eventually leads to cessation of CO
2 injection. It acts as another constraint of the CO
2 storage capacity judging from less CO
2 capacity than that of CASE 4.
The trade-off between CO
2 steering and pressure management is confirmed through CASE 4 and CASE 5. The key optimization point for maximizing storage capacity is the producer location. Thus, the location of the producer in CASE 6 is moved to the center of the substructure away from the migration pathway. The requirement of the brine producer is to make under-pressured zone near the migration pathway, but sufficient distance away from the migration pathway to delay CO
2 breakthrough. Through the application of this scheme, the substructure accounted for 18% of the total storage capacity. The contribution of the substructure secures an additional 2.1 Mt of CO
2 storage capacity compared to that of CASE 4. The distribution of sequestrated CO
2 plume in the substructure is shown in
Figure 9f. The residual trap is depicted in light green color according to the footprint of the CO
2 plume movement. The remaining mobile CO
2 after being trapped by residual saturation is distributed in the top of the substructure with a high concentration of CO
2.


