1. Introduction
Presently, the digital economy has become the direction and focus of development for the world’s leading nations. The global economy has transitioned from the industrial era to the digital era. The new format and model enabled by digital technology have invigorated the growth of the global economy. The digitization of businesses has started to garner broad interest in worldwide media and academia. China has also implemented a number of macro-level plans and initiatives in the realm of the digital economy. China’s digital economy will reach CNY 39.2 trillion in 2020, accounting for 38.6% of the country’s gross domestic product, with apparent late-mover benefits. In recent years, the state has placed a high priority on the development of the digital economy, incorporated data into the category of production factors, emphasized the acceleration of the cultivation of the data factor market, enhanced the income distribution mechanism related to data factors, promoted digital transformation, and achieved the deep integration of the digital economy and the real economy. Development has reached the pinnacle of the national strategy for medium- to long-term development.
Gupta pointed out that in the Internet era, digital capabilities have become the organizations’ key resources and competencies [
1]. Digitization is the transition from a single communication technology to an integrated digital technology, which emerged from informatization and internetization. The understanding of the digital transformation can be summed up as follows: the integrated innovation of new generation digital technologies, such as big data, cloud computing, the Internet of Things, and artificial intelligence, which are deeply integrated with enterprises, regards data as a new factor of production and then promotes the innovation of production organization and business models, and the resource is difficult to imitate and replace [
2]. In the wave of development of the digital economy, enterprises are not only the main source of innovation but also the vehicle for the integration and use of digital technologies. Moreover, enterprises can obtain a competitive edge and distinctive operations through the improvement of their digital level. Its essence is to increase the gap with competitors, strengthen consumer loyalty, and enhance corporate performance. Therefore, promoting and achieving the improvement of company digitization levels is crucial to the growth of the digital economy. This study’s primary objective is to determine how to quantify and categorize the extent of enterprise digitalization.
The research on the digitalization levels of enterprises focuses mostly on the strategic level, and some scholars believe that digital transformation is dominated by technology to build a new digital economy system, and the overall efficiency of enterprises will be improved through the application of digital technology [
3]. Additionally, some academics argue that this represents a shift in the ideological value perspective [
4]. Traditional companies will modify their business models by shifting their focus from customer value to digital technology. Nonetheless, some academics believe that digitalization is intimately linked to an enterprise’s adopted strategy [
5]. Few scholars have built an index system to quantify the level of enterprise digitization, and the classification of enterprise digitization levels is rarely discussed in the current literature.
Through field research and web research, this study identifies digital-economy-related enterprises as the survey object; compiles the fundamental information for these enterprises, their level of digitization, and the dilemma and demands of digital level improvement; and generates survey data for 1936 enterprises. Based on these statistics, this report identifies the characteristics that have an impact on the enterprises’ digital advancement. Using statistical knowledge and a machine learning model, this paper constructs an index system that affects the digital level of the enterprise and categorizes the enterprises’ digital transformation levels based on the enterprises’ basic information, such as their regions, times of establishment, and the nature of the enterprises. For the independence test of categorical variables, the multi-classification logistic regression method is further used on the basis of contingency table analysis to further explore the impact of the basic information for the enterprises regarding the improvement of their digitization level. This study can provide theoretical guidance for the future advancement of the digital levels of firms and expand the theory of digital economic development by combining its findings with those of earlier research. Simultaneously, the machine learning research method is integrated into the current enterprise management practice based on the rapid expansion of the digital economy at the macro level, promoting industrial upgrading and transformation.
2. Related Works
With the wave of digitization sweeping the world, research on the level of enterprise digitization continues to emerge, but it is still in its exploratory phase, and there is a dearth of integrated research on the impact mechanism and stage of digital-level improvement. Sachs believed that an enterprise’s digital transformation necessitates the establishment of a new production and management system [
6]. Industrial digitization is the modernization of the agriculture, manufacturing, and service industries by digital technology, and it is the goal of the digital transformation of enterprises. Sebastian et al. and Bharadwaj et al. believe that digital transformation should include changes in the way companies work and organize and their overall business models as caused by the combination of different technologies triggered by digital technologies [
7,
8]. Enterprises must employ 5G, big data, cloud computing, the Internet of Things, and other digital technologies to the purchase, production, and circulation of raw materials, as well as other links. It is the implementation of industrial digitization and represents the value of data as a production element.
External variables that influence digital transformation include primarily the growth and diffusion of digital technology, the intensification of the competitive environment, and the evolution of user demand. Matt et al. noted that the growth of digital technology can expand the limits of organizations and facilitate the shift of their strategic focus from product-centered to customer-centered [
9]. In turn, the improvement of information sharing among enterprises can promote the adoption of big data analysis technology, form a virtuous circle, and enhance supply chain performance and organizational performance [
10]. Bellalouna studied the key role of augmented reality (AR) in the field of manufacturing digitization and demonstrated the application of AR in digital product configuration management and production planning assistance with case studies [
11]. Li et al. believe that the continuous digital technology revolution can improve the coordination between business strategy and digital technology, hence fostering corporate growth [
12]. From the perspective of global value chains, Wu et al. assert that the digitization of the manufacturing industry will improve the comparative advantage and competitiveness of the country in the global value chain [
13]. In a competitive context, firms launch digital innovation mechanisms, and digital innovation can also alter the competitive climate in which enterprises operate [
14]. For instance, the use of remote information technology by the Italian vehicle insurance business Unipol signifies a strategic move in the market toward data-driven services, such as insurance rates based on driving behaviors [
15]. Abrell et al. analyzed three B2B organizations dealing with digital innovation and determined the various roles of customers and users in guiding digital innovation [
16].
Digital transformation’s primary function is to foster product and service innovation, process innovation, and business model innovation, ultimately improving operational efficiency and organizational performance. Bharadwaj et al. indicated that the digitization of business infrastructure tightens the connections between products, processes, and services, which can significantly enhance products and services and increase company networks [
17]. In the context of digital innovation, innovation subjects are more diversified, innovation is more democratic, the distinction between innovation processes and outcomes is shattered, product boundaries become mobile, and innovation activities continue during user usage [
18]. Boersma et al. believed that the application of Internet of Things technology has spawned a new business model and enhanced the profitability of the enterprise supply chain [
19]. Gnimpieba et al. constructed a digital architecture platform utilizing cloud computing technology and Internet of Things technology [
20]. Warner et al. explored how existing enterprises in traditional industries can build dynamic capabilities for digital transformation, simplify operations, or create new business models to enhance customer experience [
21].
Reviewing the literature in this field, many researchers utilize classic research methodologies, such as theoretical research, case studies, quantitative analysis, etc. to analyze the digital levels of organizations. Hazen et al. analyzed the impact of digital technology on supply chain sustainability from eight theoretical perspectives and concluded that, as digital technology continues to mature and be applied, it can continue to provide supply chain competitive advantages [
22]. Wang et al. summarized the pertinent literature on the application of big data in supply chain management, examined the potential application scenarios of big data technology in the future, and emphasized the significance of big data technology in enterprise supply chain management [
23]. Hess et al. investigated the role of CIOs (chief information officers) and other senior managers in responding to the risks and opportunities of digital transformation and developed a digital transformation strategy guidance matrix based on the successful digital transformation of three German media companies [
24]. Wei Zhang et al. employed Hamilton–Jacobi–Bellman equation to quantify the industrial digital collaboration mechanism and optimal strategy within the setting of the digital economy [
24].
At present, case studies are mainly used to study the transformation and upgrading of digital enterprises and value creation, which is conducive to exploring the mechanism of digital innovation and deeply dissecting the differences between digital innovation and traditional innovation models from an internal perspective. However, the empirical research rooted in the context of the digital economy is insufficient, including the measurement methods and tool selection of digital innovation, which not only shows that there are still a lot of gaps in the research field of enterprise digital level but also shows that the research on enterprises’ digital levels is still not systematic. With the understanding of the dimensions of digital innovation, future research can explore the research methods of scale or large sample empirical analysis for further verification [
25]. As a prevalent research approach in the field of social science, machine learning intends to employ information technology to improve the quantitative analytical level of social science research in order to solve multidimensional, multivariable, and dynamically complicated problems.
To sum up, the research on the related and derivative domains of the digital economy is developing increasingly sufficiently to adapt to the evolution of the times. However, for the measurement of enterprises’ digital levels, the existing research mainly focuses on the impact of the improvement of the enterprise digital level on human resources, financial management, incentive mechanism optimization, value chain cooperation, and so on. At the same time, the construction of the influencing factors of the digital transformation of enterprises and the calculation of the index weight are still in a relatively broad field and primarily discuss the influence of external factors, such as technological development and penetration, intensified competitive environment, changes in user needs, etc., rather than the enterprise itself. This study is primarily based on the theory of statistics and machine learning, starting from the microscopic perspective, and examines some of the conditions of the enterprise ‘s own information as the influencing factors; the study also constructs an index system and assesses the significance of the characteristics based on the index score. Concurrently, it conducts a classification study on the digital level of enterprises and compensates for the deficiencies in the existing research and provides a valuable reference for expanding the research on the enterprise digitization level and practices for enhancing the enterprise digitization level.
3. Data and Methodology
3.1. Experimental Data
Due to the lack of a unified and precise definition of the digital economy, there are significant regional variations in the assessment of the digital economy [
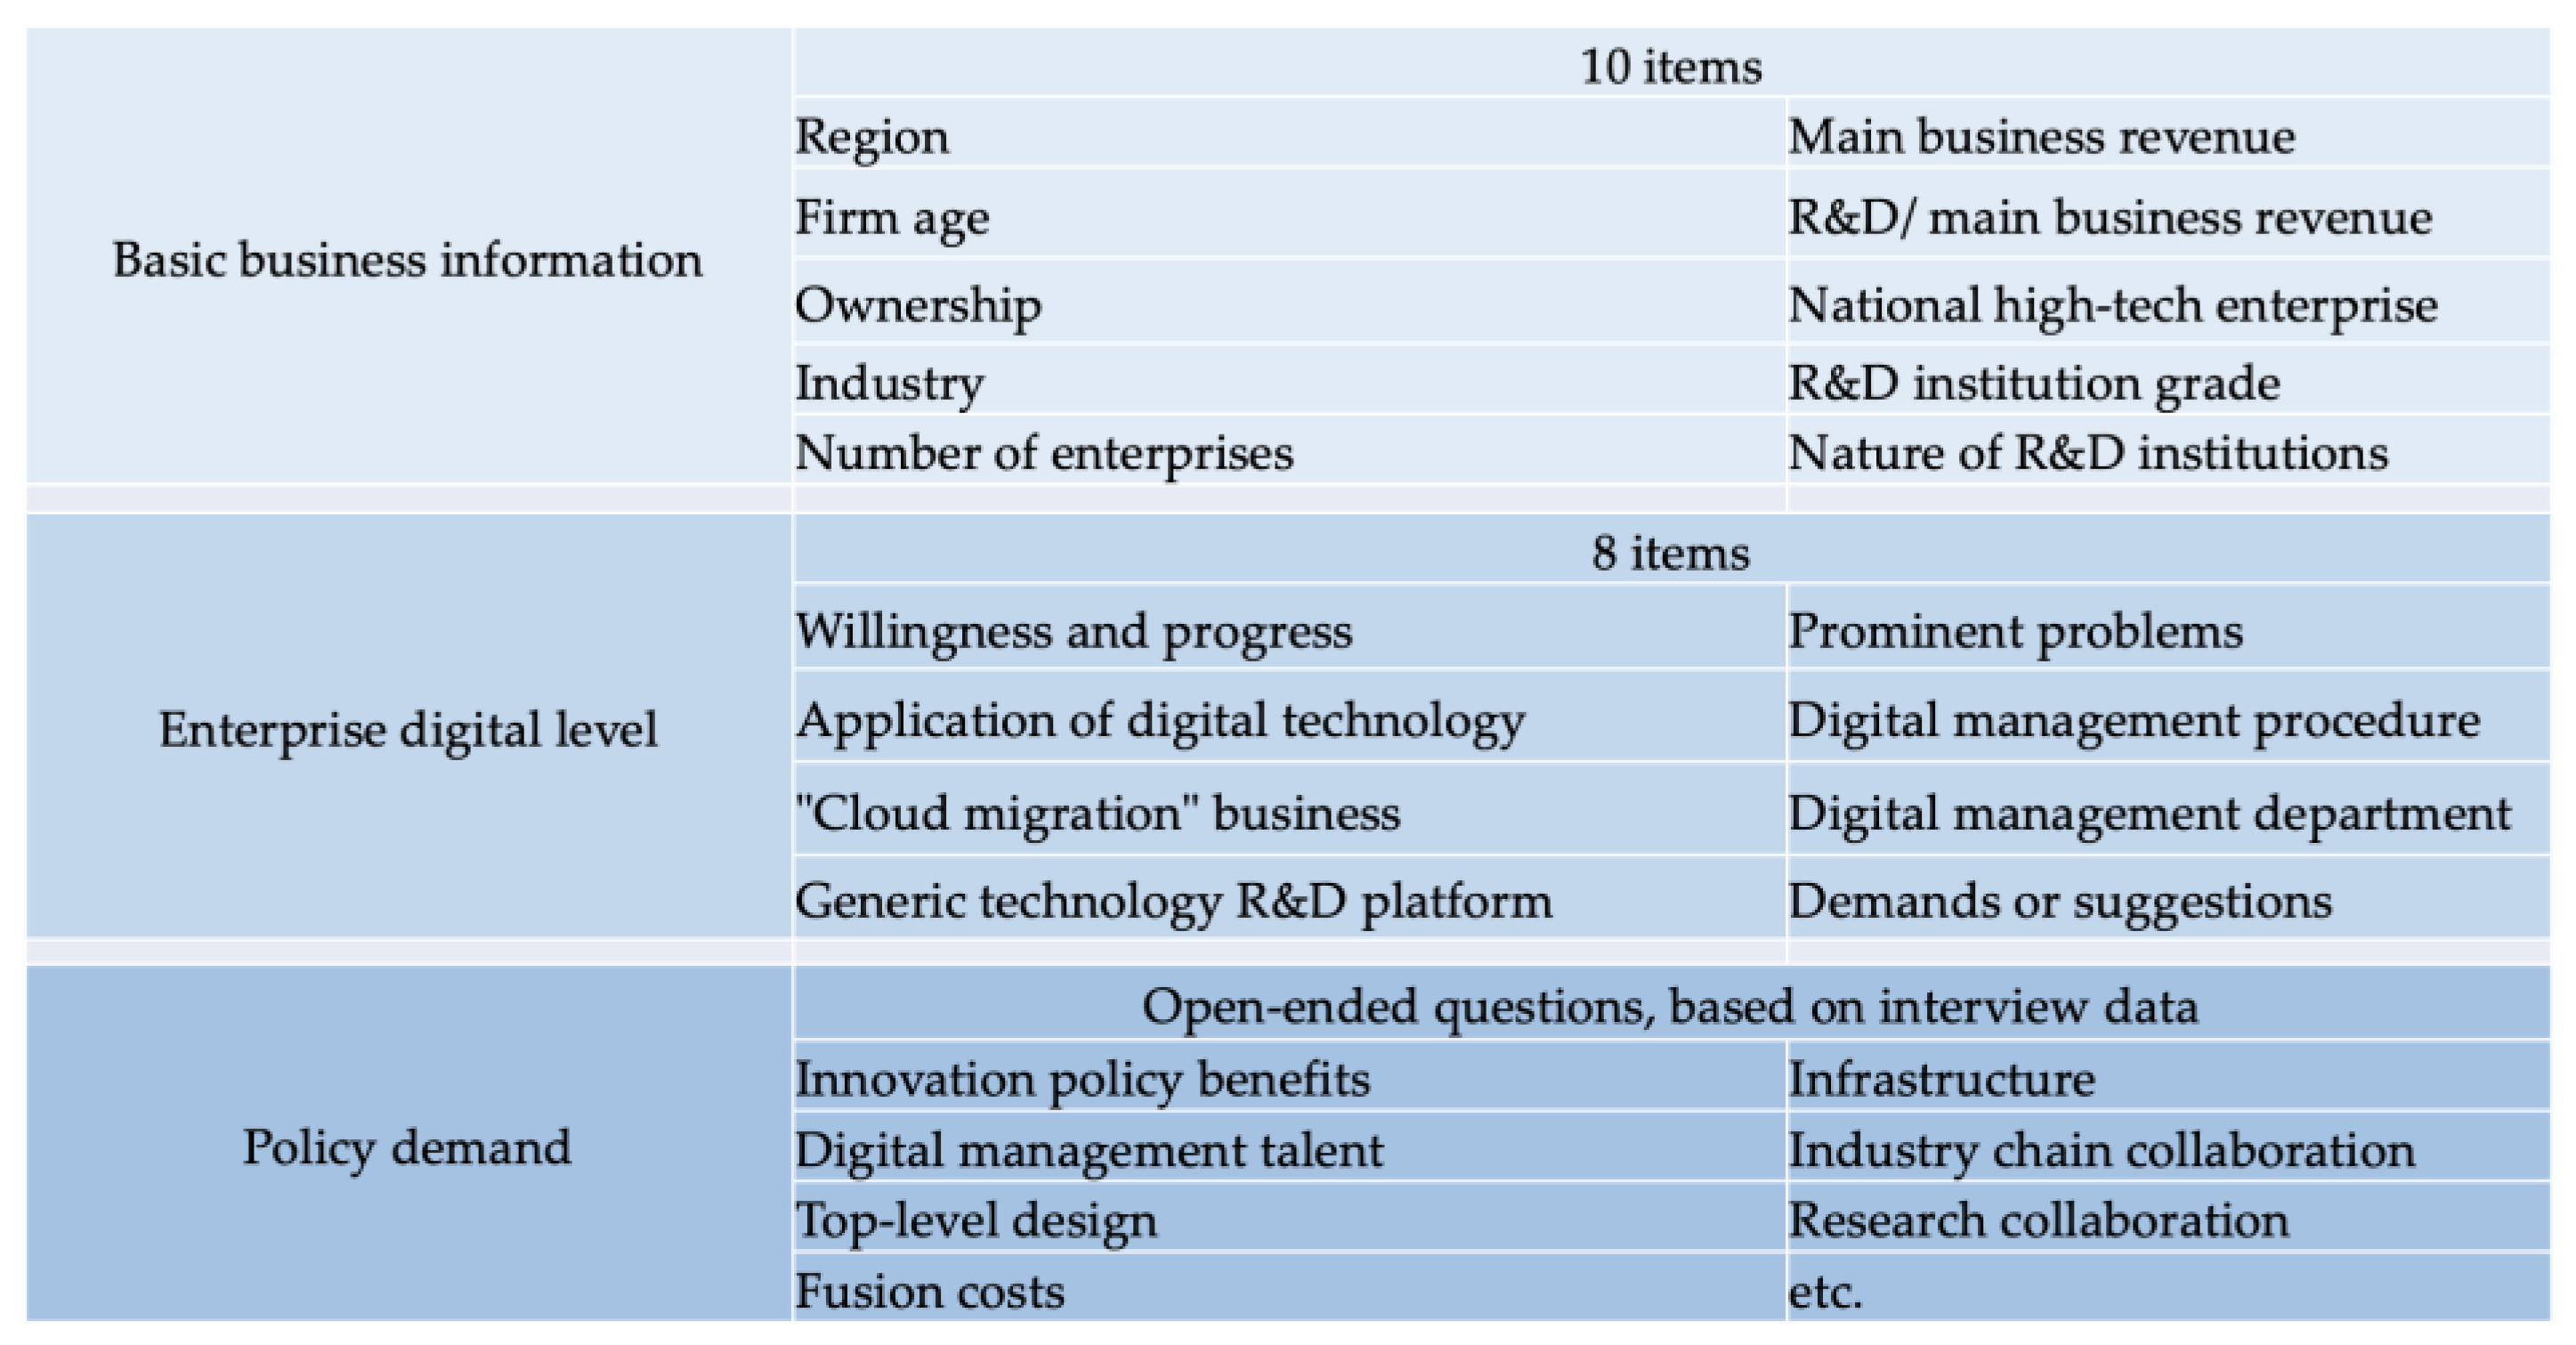
26]. In this study, the data for enterprise digital level classification are obtained by questionnaire survey. The questionnaire consists of three sections: enterprise fundamentals, enterprise digital level state, and digital transformation policy requirements. Among them, the following are found:
- (1)
Fundamental information. Its survey items include the city where the enterprise is located, the time of establishment, the nature of ownership, the number of employees, and the proportion of R&D investment relative to the business’s primary revenue over the preceding 3 years.
- (2)
Digital level status. It mainly investigates related enterprises from eight aspects—the willingness and promotion of enterprise digital transformation, the development of digital transformation, the driving factors of digital transformation, the application of digital technology, the development of cloud business, the existence and evaluation of industry-wide technology platforms, the outstanding problems of digital transformation, and the means of promoting digital transformation.
- (3)
The necessity for digital transformation policies. Its primary purpose is to listen to the demands of research organizations and provide decision-making guidance for the formulation of financial support programs from the enterprise’s policy-related focus on digital transformation, the enterprise’s demands, or ideas for promoting digital transformation to the government.
Each section specifically sets up 1–2 open-ended questions for the investigator to obtain more detailed information. In the context of the topic, these three elements are mostly considered: First, the enterprise’s basic information, such as the number of employees, the nature of ownership, and its region, is the enterprise attribute variable, which must be classified and identified. Second, the enterprise’s R&D and external technology acquisition are enterprise development variables, reflecting the enterprise’s R&D investment and the technical source of digital transformation. Third, the policy requirements of digital transformation, which are mostly dependent on the subjective cognition of businesses, require that we synthesize the viewpoints of businesses and prepare for policy design. In terms of option design, this study starts from both the supply and demand sides. On the demand side, we analyze the driving factors of the improvement of the digitalization levels of enterprises. On the supply side, data factors enable enterprises to promote the intelligent transformation of manufacturing technology mainly by affecting the production organization, resource allocation, and supply modes of enterprises. The related factors of questionnaire design are shown in
Figure 1.
This questionnaire was distributed via the Internet. Using a stratified sampling strategy, representative or typical businesses were studied and online forms were filled in. The distribution period was between 11 June 2022 and 14 July 2022. The respondents included digital-economy-related firms encompassing various sorts of enterprises with diverse ownership structures, establishment dates, employee counts, R&D investment proportions, etc. On the date of questionnaire recovery, a total of 1936 valid samples were received.
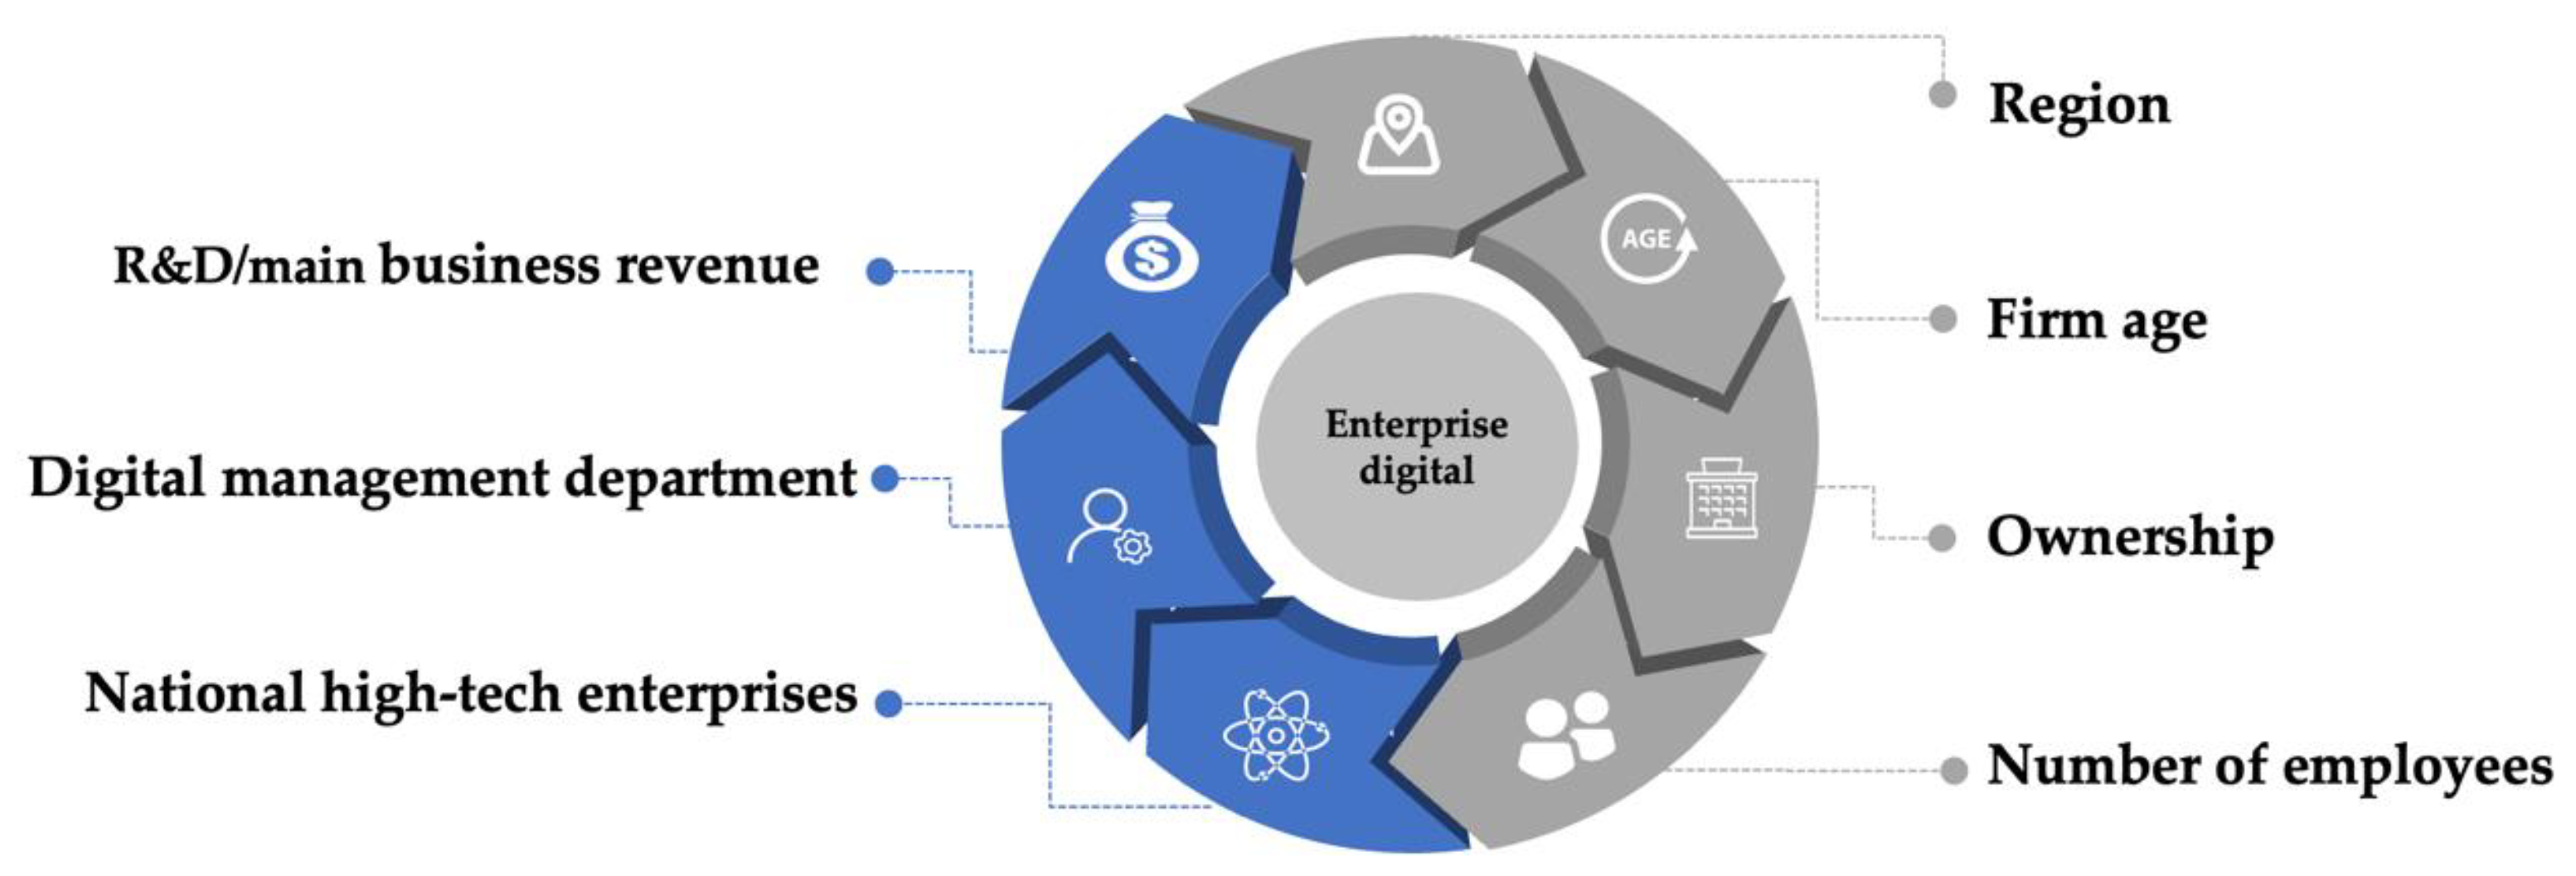
Through the establishment of a cross-contingency table for the questionnaire data for 1936 enterprises, the chi-square independence test was carried out. The seven basic information fields of the questionnaire/responses regarding the enterprises (enterprise region, enterprise age, ownership, number of employees, R&D investment, digital management department, and national high-tech enterprises) have a significant impact on the improvement of the digital level of the enterprise.
Figure 2 depicts the elements that affect the enterprise’s digital maturity level.
3.2. XGBoost Classification Algorithm
The base learner of the XGBoost classification algorithm is a decision tree model, and the classification features are selected according to the CART algorithm. Different from the random forest model based on Bagging, XGBoost is based on Gradient Boosting.
The XGBoost model is defined as:
In Equation (1), represents the kth decision-tree-based learner.
The objective function of XGBoost is defined as follows:
The objective function
in Formula (2) consists of two items: the former is the loss function; the latter is a regularization term, which is mainly used to control overfitting. The definition of the regularization term is as follows:
The optimization goal of the XGBoost model is to find the optimal
so that the objective function
is minimized. In order to find the optimal
, XGBoost adopts the method of objective function approximation. For this purpose, Formula (2) is rewritten as follows:
Formula (4) is further subjected to second-order Taylor expansion:
In Formula (5),
,
are:
Since the constant term does not affect the optimization results of the model, the Formula (5) is further simplified. Removing the constant term, Equation (5) is converted to:
Through such transformation, we find that Formula (8) is a unary quadratic function with independent variable
and dependent variable
. According to the formula for finding the most value of unary quadratic function, the optimal
of leaf node
is:
At this point, the optimal objective function value
is:
In order to simplify the expression, in Equations (9) and (10),
denotes
, and
denotes
, then:
Equation (12) is the scoring function of a decision-tree-based learner with training. In theory, for each training process, the optimal decision tree model can be obtained by calculating the evaluation scores for all candidate decision tree models. However, in practical problems, the number of candidate decision trees is infinite. Therefore, in order to solve this problem, the answer given by XGBoost is to use a greedy algorithm:
Because there is only one node at this time, the contribution at this time is
. After the node is split into two child nodes, the objective function contribution of the two child nodes becomes:
The objective function changes to:
The change of the final objective function can be obtained by iteration. The formula is expressed as:
In Equation (12), represents the total of all objective function values at leaf nodes. The difference between the objective functions of two trees before and after a node splitting is that the splitting node splits into two new nodes, while the remaining nodes remain unchanged. Therefore, the difference between the objective functions of the two trees before and after is in Equation (16).
3.3. Evaluation Index Construction
For the binary classification problem, True Positive (TP), False Positive (FP), True Negative (TN), and f False Negative (FN)) are distinct combinations of the real category of data samples and the model prediction category for the binary. The two dimensions of confusion matrix are prediction class and target class. In the binary classification problem, positive and negative examples are involved. According to the actual needs of the research problem, we wish to more precisely identify enterprises with low digital level more accurately to give appropriate tilt and support in the formulation of fiscal policy. Therefore, the label of 0 (i.e., low digital level) is expressed as a positive example in this study. The confusion matrix is shown in
Table 1.
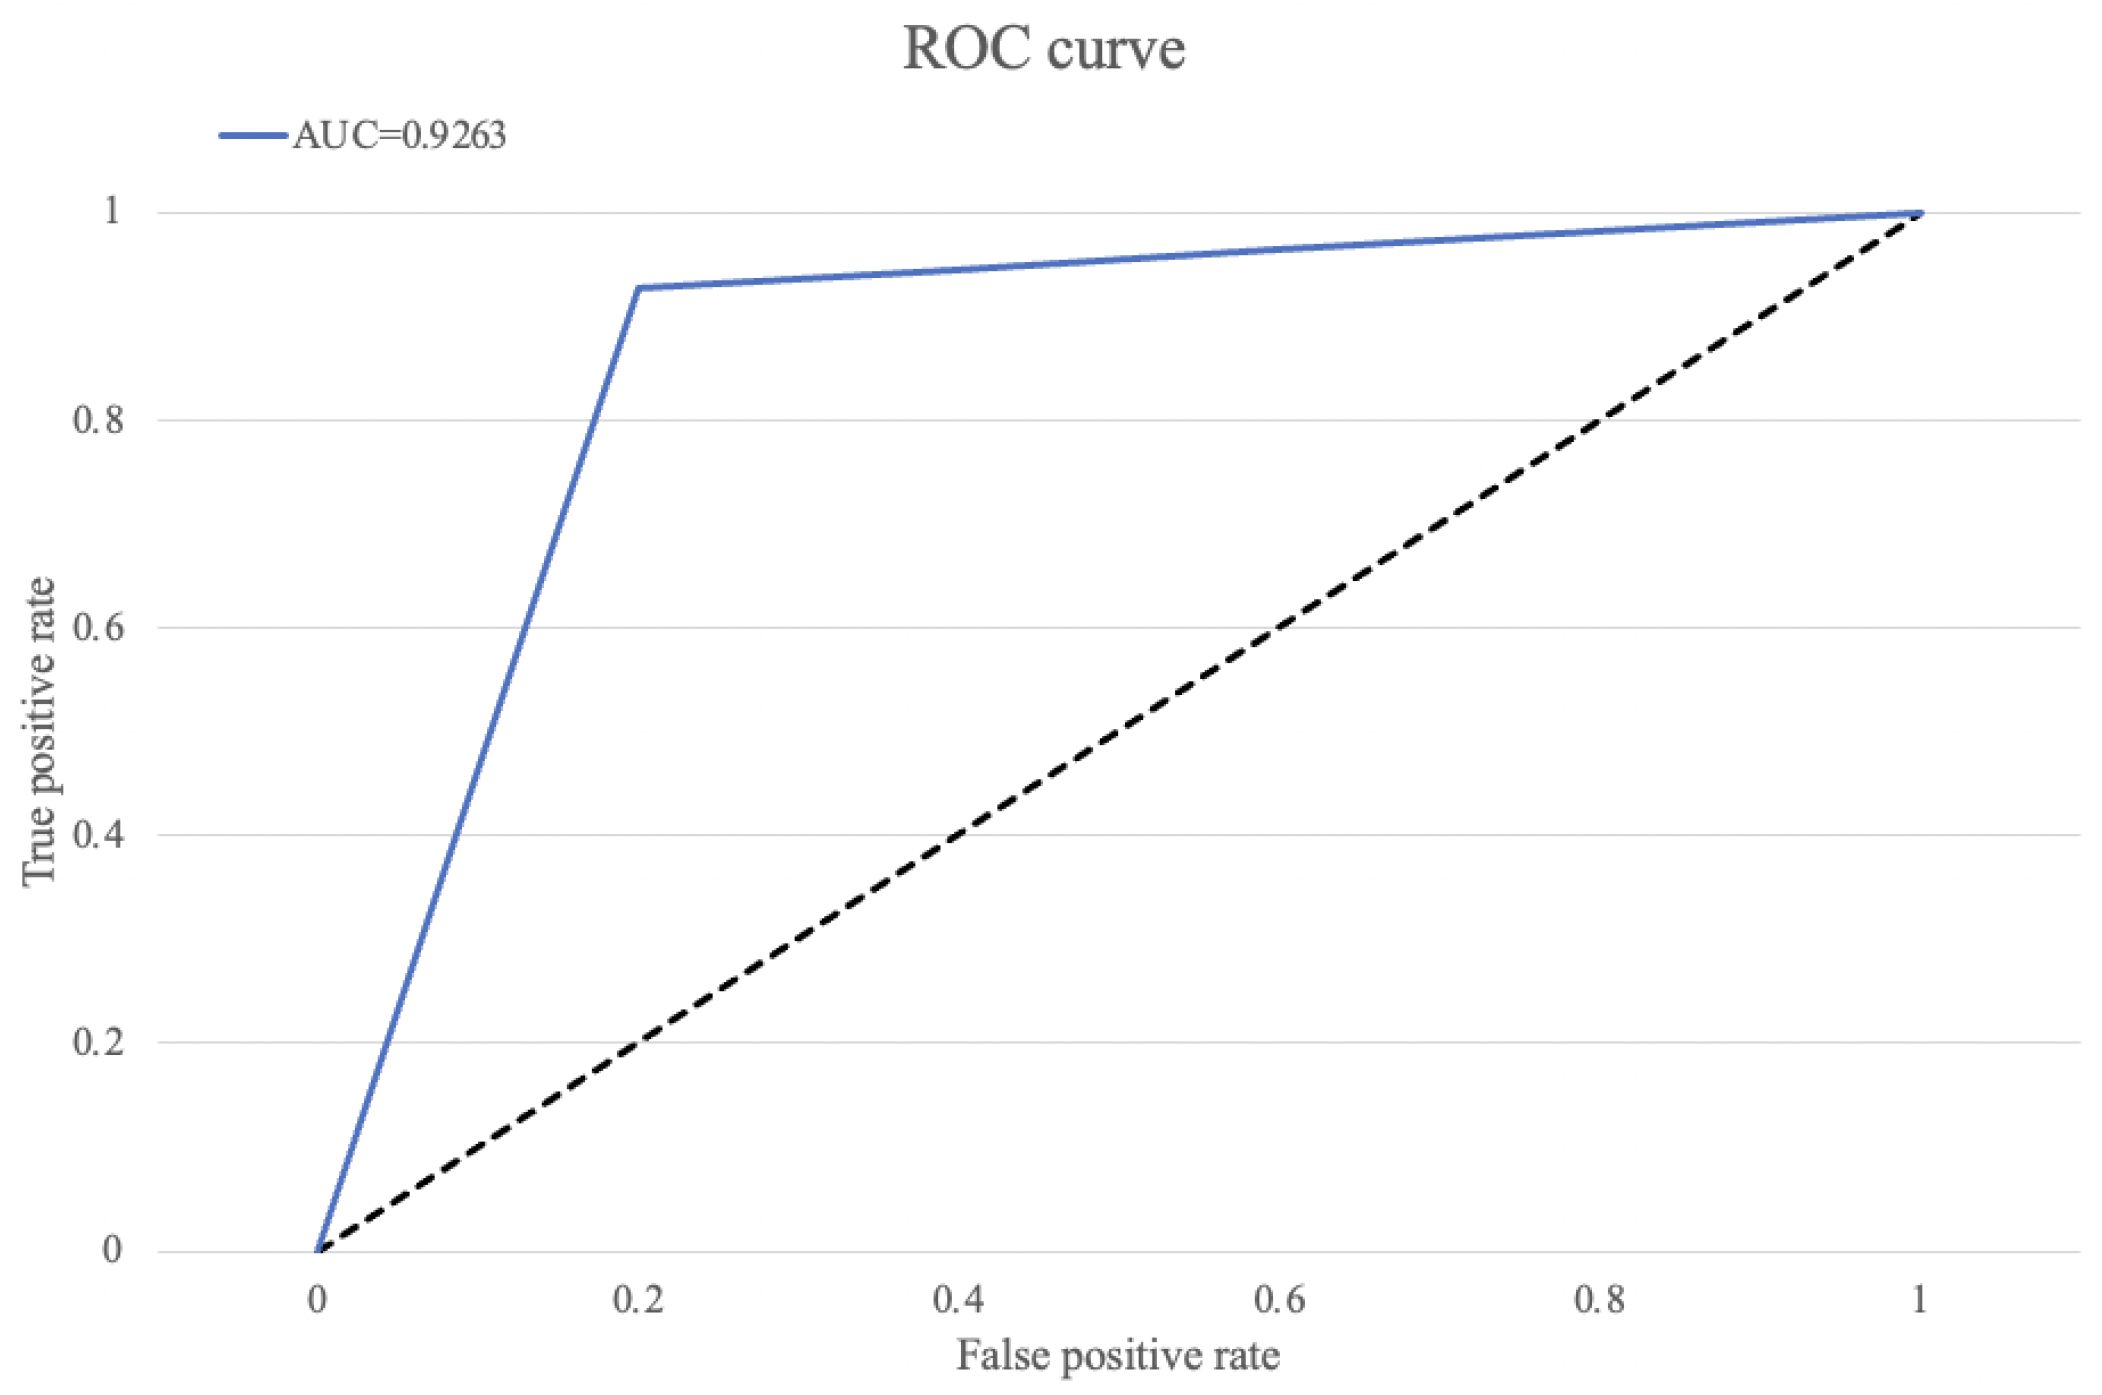
The evaluation index is defined as follows: AUC: indicates the area under the ROC curve, which is a curve with false positive rate (FPR) as the horizontal coordinate and true positive rate (TPR) as the vertical coordinate. The larger the AUC, the better the classification effect of the model. When AUC < 0.5, it indicates that the model classification effect is worse than random classification; when 0.5 < AUC < 1, the classification effect of the model is better than random classification; and when AUC = 1, the model is completely classified correctly. The indicators of the model are defined as follows.
5. Conclusions
This article examines the contributing elements and degree of enterprise digitization based on the macroeconomic context of digital economy development. The XGBoost classification model is proposed. Using statistical methods and machine learning techniques, the classification of enterprise digitization level is given, along with the index system, and the corresponding index scores for the enterprise digitization levels are obtained and are an effective supplement to study the enterprise digitization level in the era of the digital economy. Specifically, we begin by extracting questionnaire data, separating the target variables from the characteristic variables, and analyzing the correlation between the target variables and the characteristic variables. The results indicate that the region, the time of establishment, the nature of ownership, the number of employees, R&D investment, national high-tech enterprise status, and the establishment of digital transformation management departments have a substantial effect on the degree of digital transformation.
In the binary classification problem of digital levels, XGBoost, an ensemble learning approach based on decision tree model, is also a representative gradient-boosting-based ensemble algorithm. We traversed the characteristic variables for each model and acquired AUC, accuracy, recall, precision, and F1-score evaluations for five classification models. The experimental findings confirm that the model containing all feature variables has superior generalization performance; hence, all features should be given priority in the actual modeling process. During the phase of model parameter adjustment, the parameters of the two models are adjusted using the grid search approach. The experimental results show that our parameter modification effort yielded certain outcomes as the model’s five evaluation indices were enhanced to varying degrees, and the AUC is 0.9263.
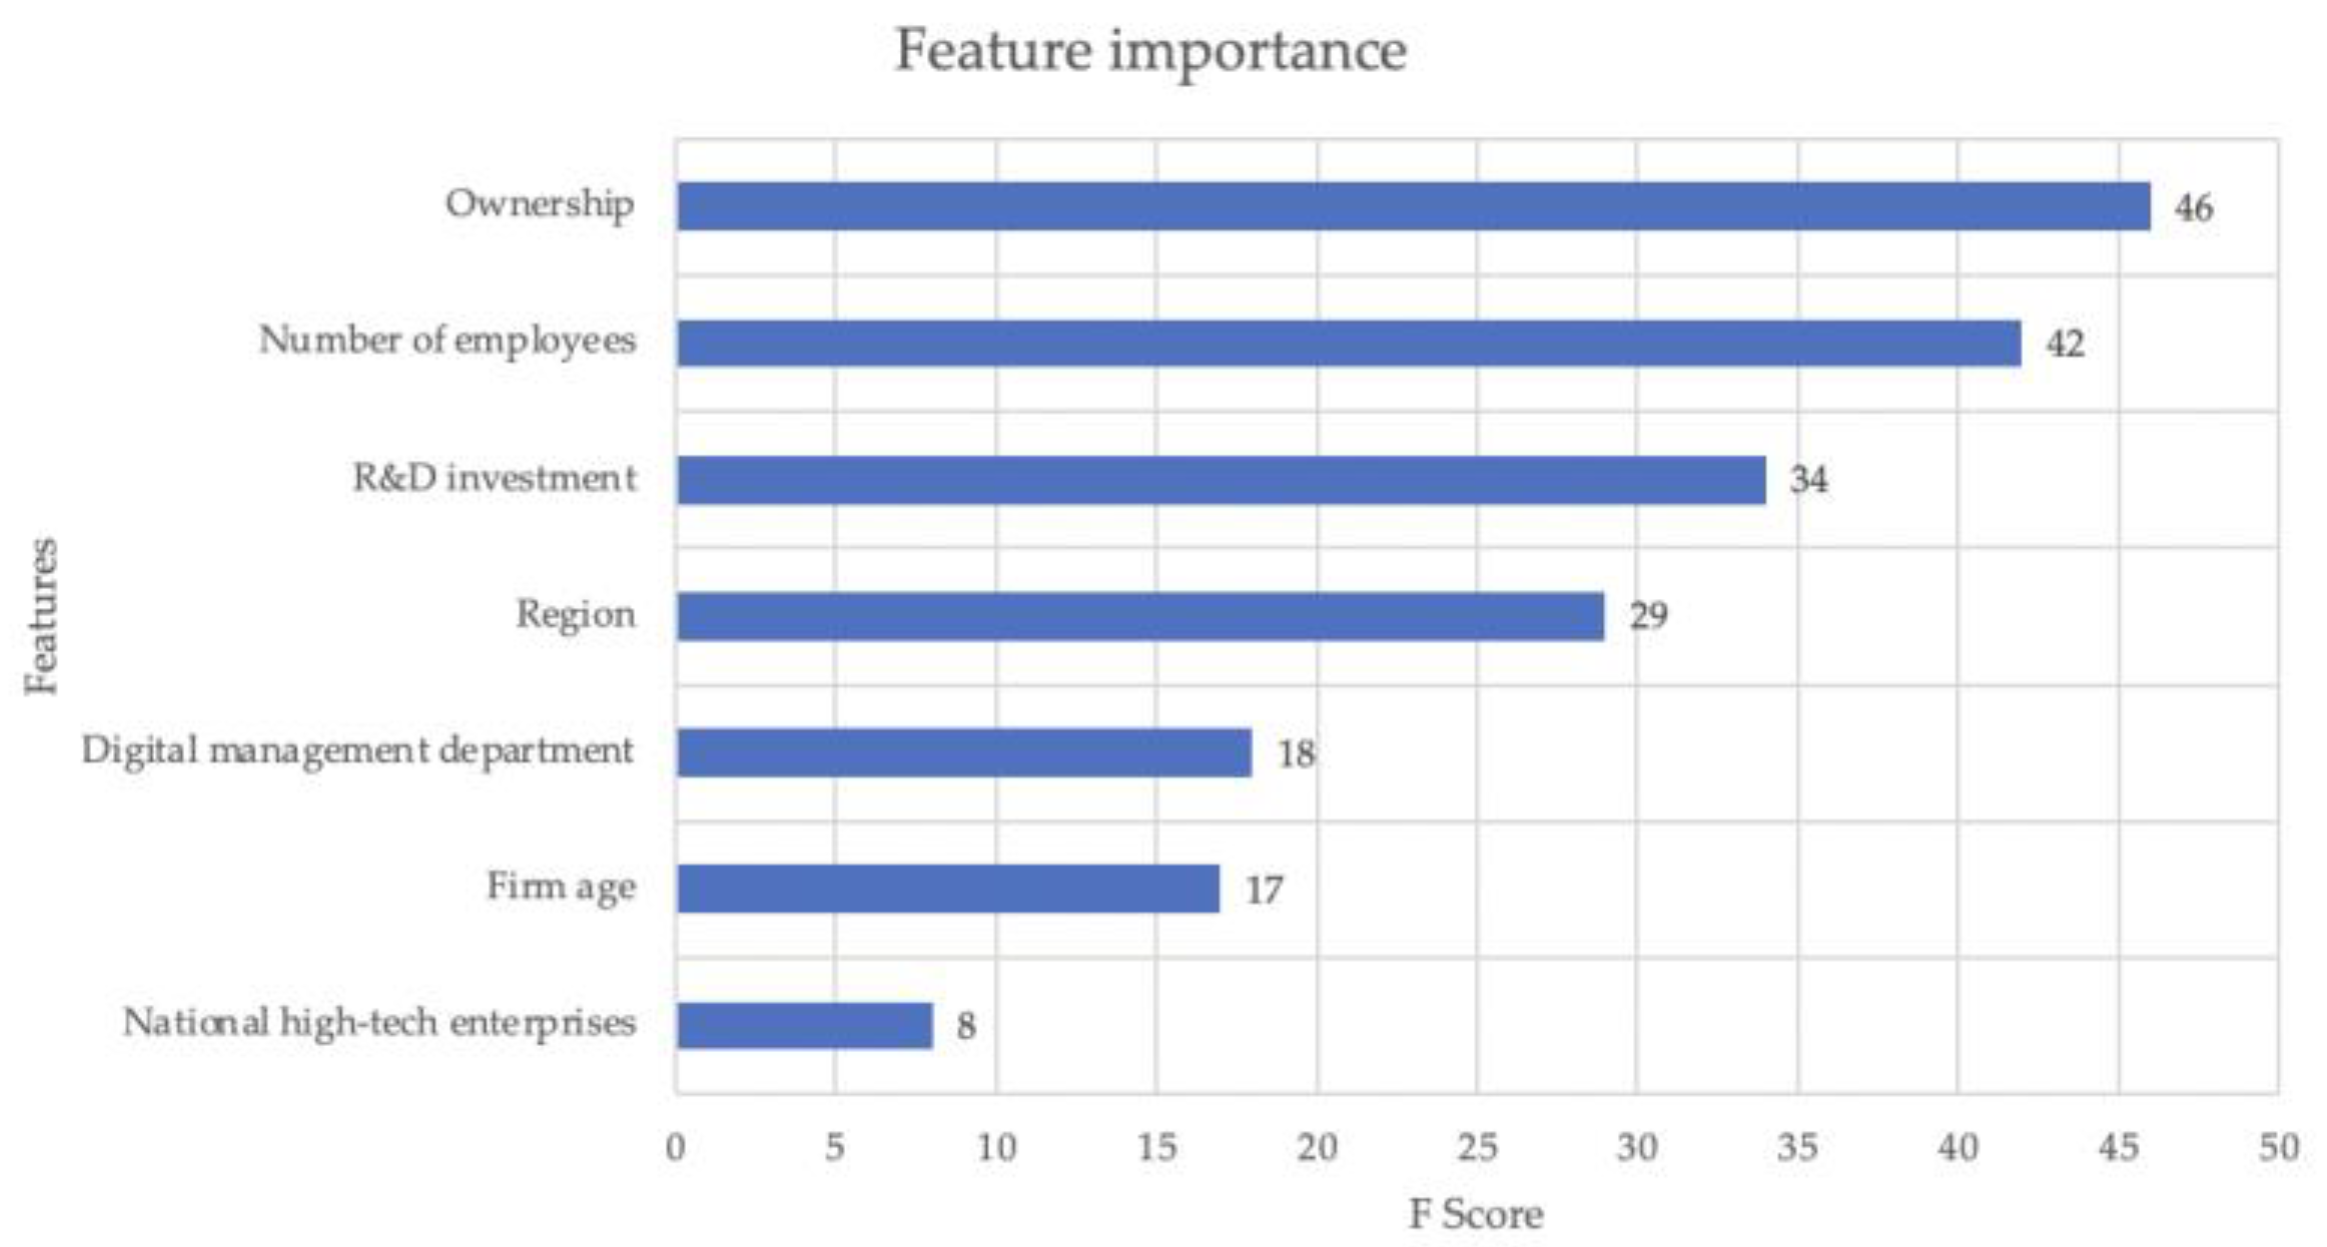
Based on the research of this paper and the previous research results, it is evident that, on the one hand, the scale and growth process of the enterprise is an interactive process with the improvement of its digital level. Enhancing the enterprise’s digital maturity can accelerate its growth. At the same time, the expansion of the scale of the enterprise also contributes to the promotion of digital transformation to a certain extent. In addition, the results of the XGBoost feature importance score indicate that the number of enterprises has a greater impact on the degree of digital transformation. On the other hand, enterprise investment in R&D funds and cooperation with scientific research institutions are crucial to promoting the integration of the digital economy and the real economy. On this basis, we believe that the following aspects should be deployed:
The agglomeration effect of enterprise-level digital enhancement. R&D investment and cooperation with scientific research institutes are crucial driving forces in supporting digital transformation. This notion has been validated by our empirical examination of the variable of enterprise R&D investment. The government can concentrate on establishing a digital economic industrial cluster. Enterprises in the region should aggressively participate in digital transformation. Simultaneously, efforts should be made to open up the layout of upstream and downstream industrial chains, give full play to the comparative advantages of different regions, and guide leading enterprises to unite university R&D institutions, upstream and downstream industries, and innovative consortia to form integrated industrial chain cooperation.
Enhance the supporting infrastructure of enterprise digital transformation. In the empirical section, it is evident that the formation of dedicated digital management departments in businesses would play a crucial role in encouraging the enhancement of the digital level. To this end, on the one hand, it is necessary to promote standardization and the standardization of the deep integration of the digital economy, to organize technical research in the field of digital economy, and to guide key enterprises to participate in the development of standards in various fields; on the other hand, it is necessary to further improve the statistical system of the digital economy, to clarify the boundary division of digital economy industry, and to strengthen the research on the compilation of industrial guidance catalogue and establish and improve the statistical classification catalogue, operation monitoring system, and other related index systems of the digital economy.
Accelerate the training of professionals and interdisciplinary talents in the digital economy. On the one hand, we are supposed to further improve the talent cultivation mechanism of the digital economy and increase the talent cultivation of digital technology, such as by strengthening the directional entrusted training mechanism of talents in colleges and universities; on the other hand, it is necessary to further improve the talent introduction policy, make efforts in the preferential policies for talent settlement and housing rental subsidies, and enhance the attractiveness and support accuracy of digital economy professionals.
There are still several areas for improvement in this study. The amount of data in this dataset is insufficient, to begin with. For machine learning problems, a large amount of data is generally required as support, which is more conducive to model training and learning. In the subsequent time, it is anticipated that the amount of data will increase as a result of an increase in the questionnaire’s coverage and completion rate. Secondly, the category distribution of this data set is not balanced enough, which is reflected in the ineffectiveness of multi-classification research conducted with the original data. It is anticipated that the generalization performance and classification effect of the learner can still be improved by expanding the amount of data in the later stage. In addition, in terms of research methods, this study employs the XGBoost model approach for the two-classification problem of enterprise digitization level in consideration of the characteristics of the digital innovation platform, innovation combination, and innovation dissemination; research methods might also attempt to employ new research methods such as computational social science, complicated theoretical approaches, and qualitative comparative research (QCA). Finally, for the selection of features, this paper extracts seven feature variables according to the effective information in the questionnaire and conducts independence tests separately. There may be some limitations and subjectivity. In later investigations, additional features can be added and incorporated into the model.


