


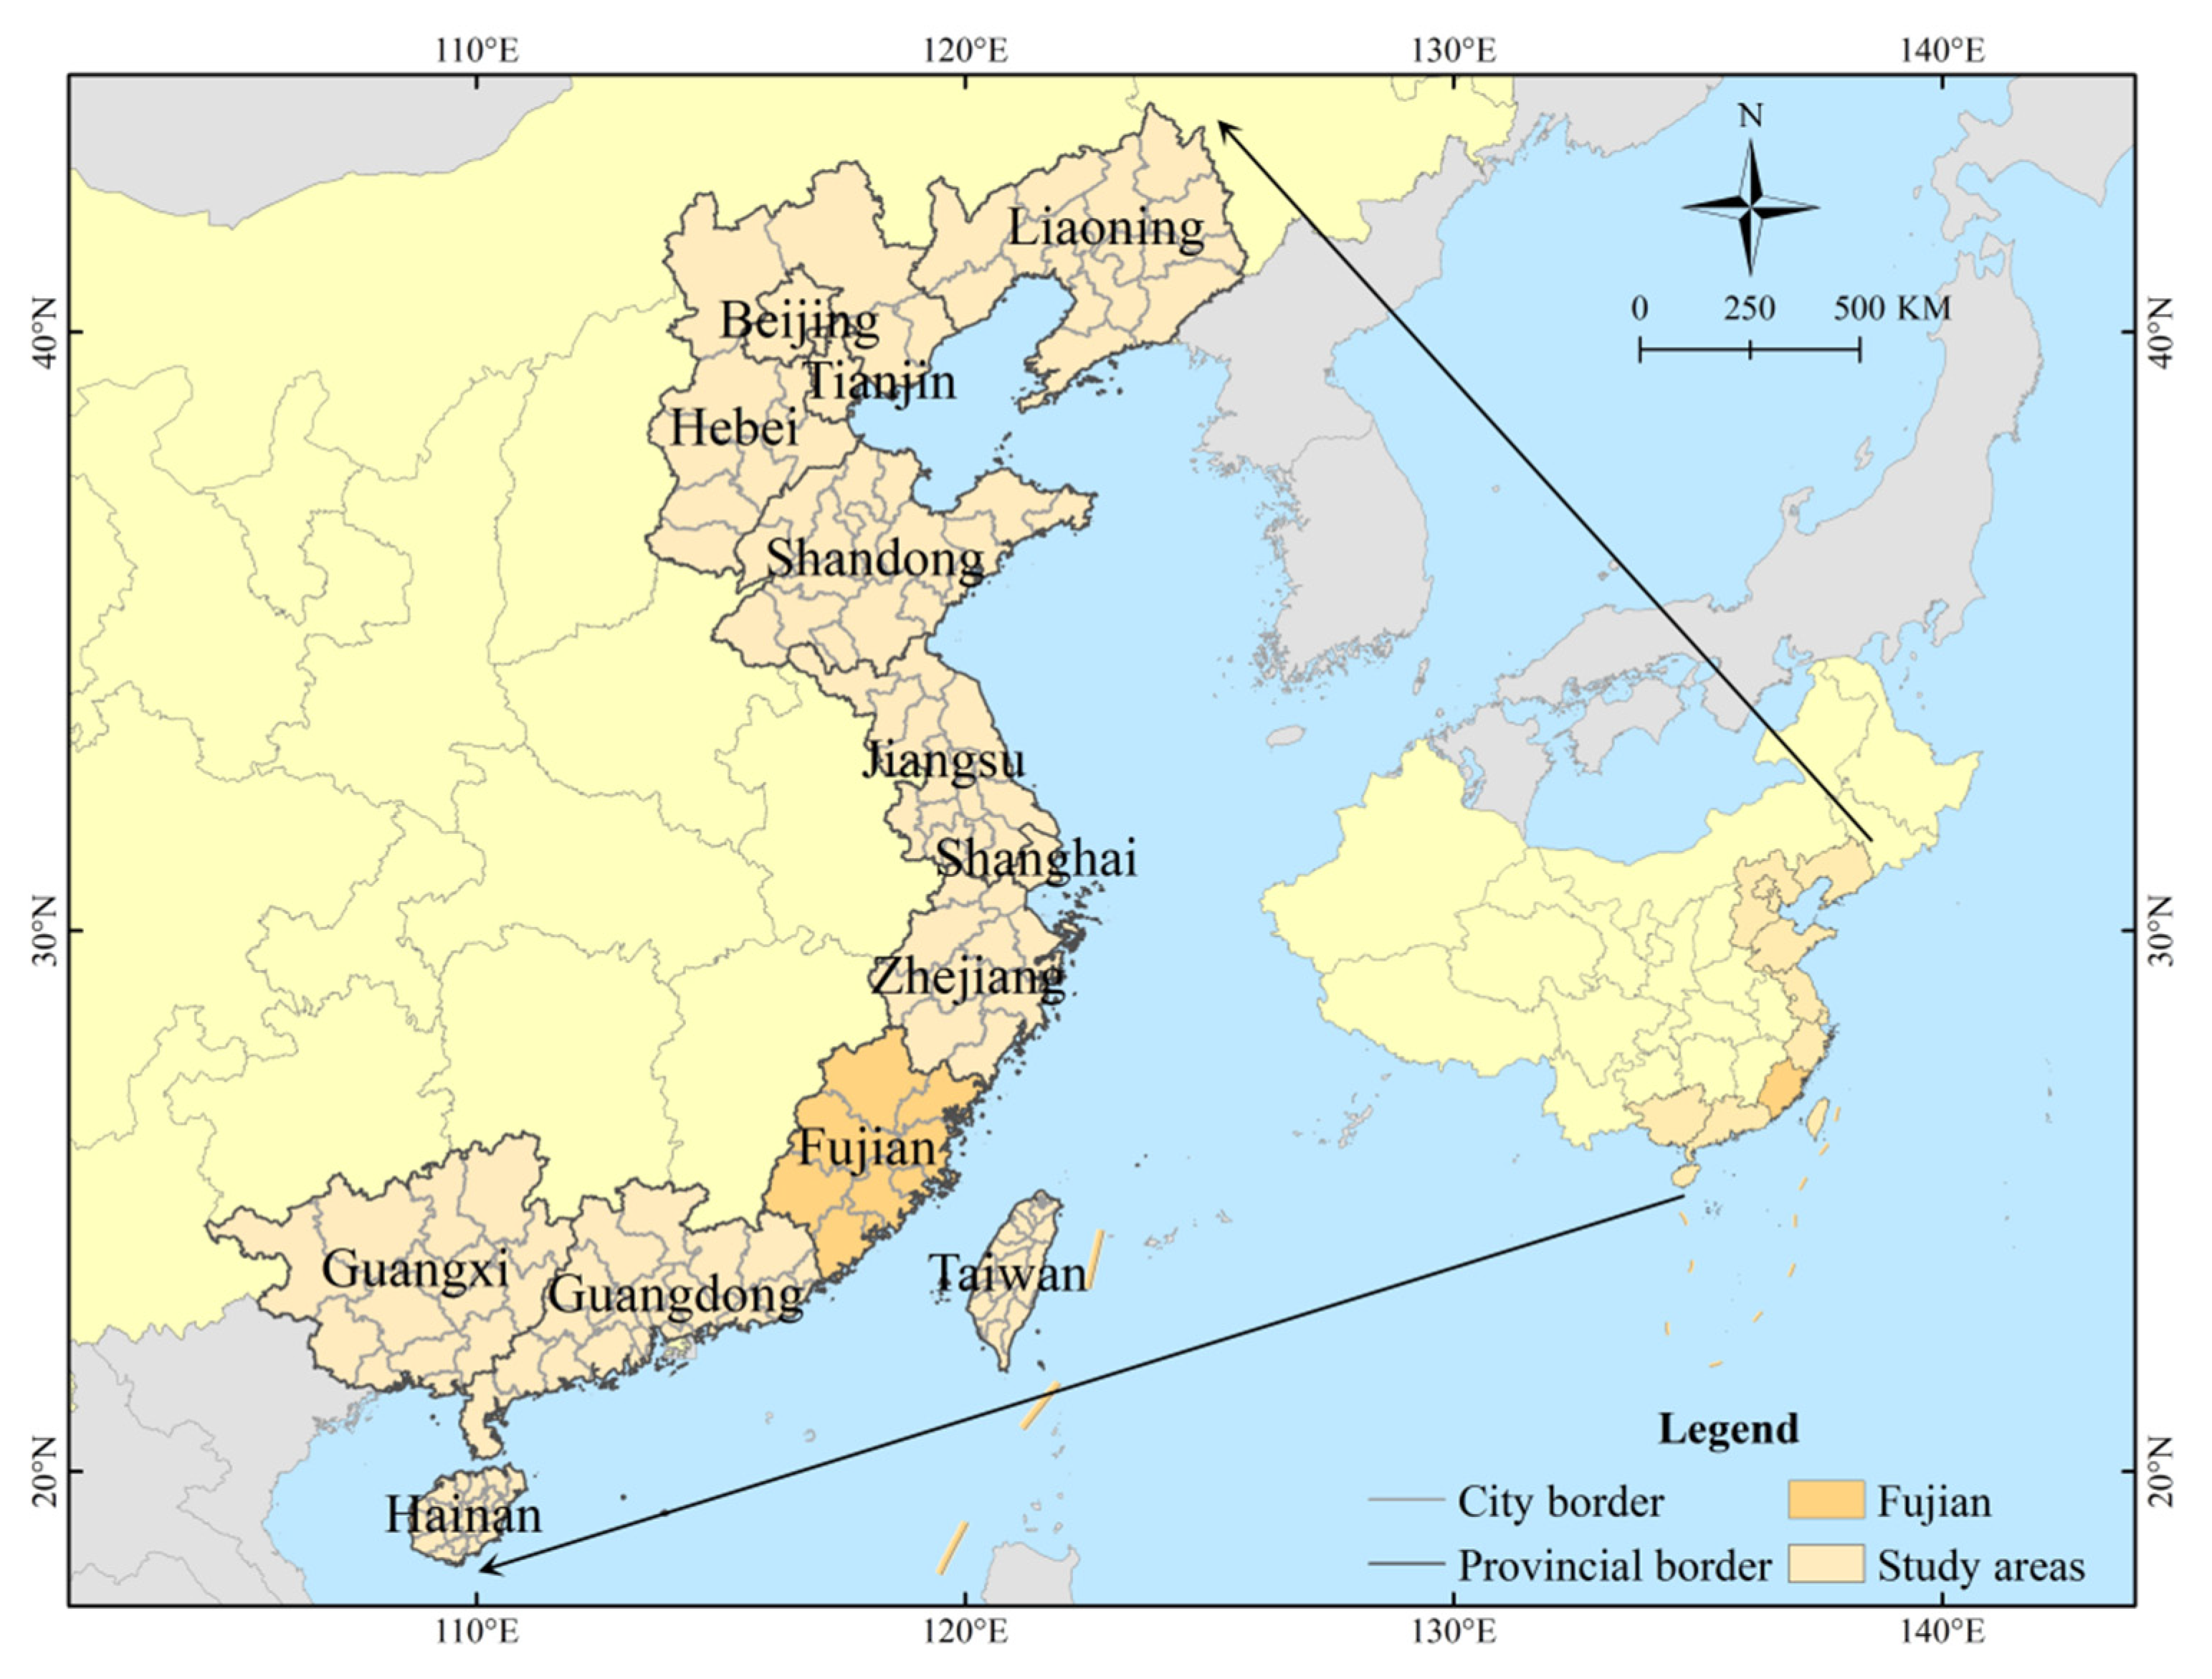
Scenario Prediction of Carbon Emission Peak of Urban Residential Buildings in China’s Coastal Region: A Case of Fujian Province
Abstract
:1. Introduction
- ①
- What were the characteristics of the historical carbon emissions from residential buildings in coastal provinces?
- ②
- Based on the current situation, what are the evolutionary trajectories and the peak situation of residential building carbon emissions in coastal provinces?
- ③
- What are the factors affecting whether residential buildings in coastal provinces can achieve the carbon peak goal?
2. Literature Review
3. Research Methods
3.1. Determination of Influencing Factors
3.2. Models
3.3. Forecast Scenario Setting
3.3.1. Baseline Scenario
3.3.2. Low-Carbon Scenario
3.3.3. Ultra-Low Carbon Scenario
3.3.4. High-Carbon Scenario
3.4. Data Sources
4. Analysis and Results
4.1. Analysis of Influencing Factors
4.2. Carbon Emission Prediction
4.3. Sensitivity Analysis Results of Influencing Factors
5. Prediction and Analysis of Emission Scenarios
5.1. Carbon Emission Scenario under the High-Carbon Model
5.2. Carbon Emission Scenarios under the Baseline Model
5.3. Carbon Emission Scenario under the Low-Carbon Model
5.4. Carbon Emission Scenario under Ultra-Low Carbon Model
6. Conclusions and Policy Implications
- (1)
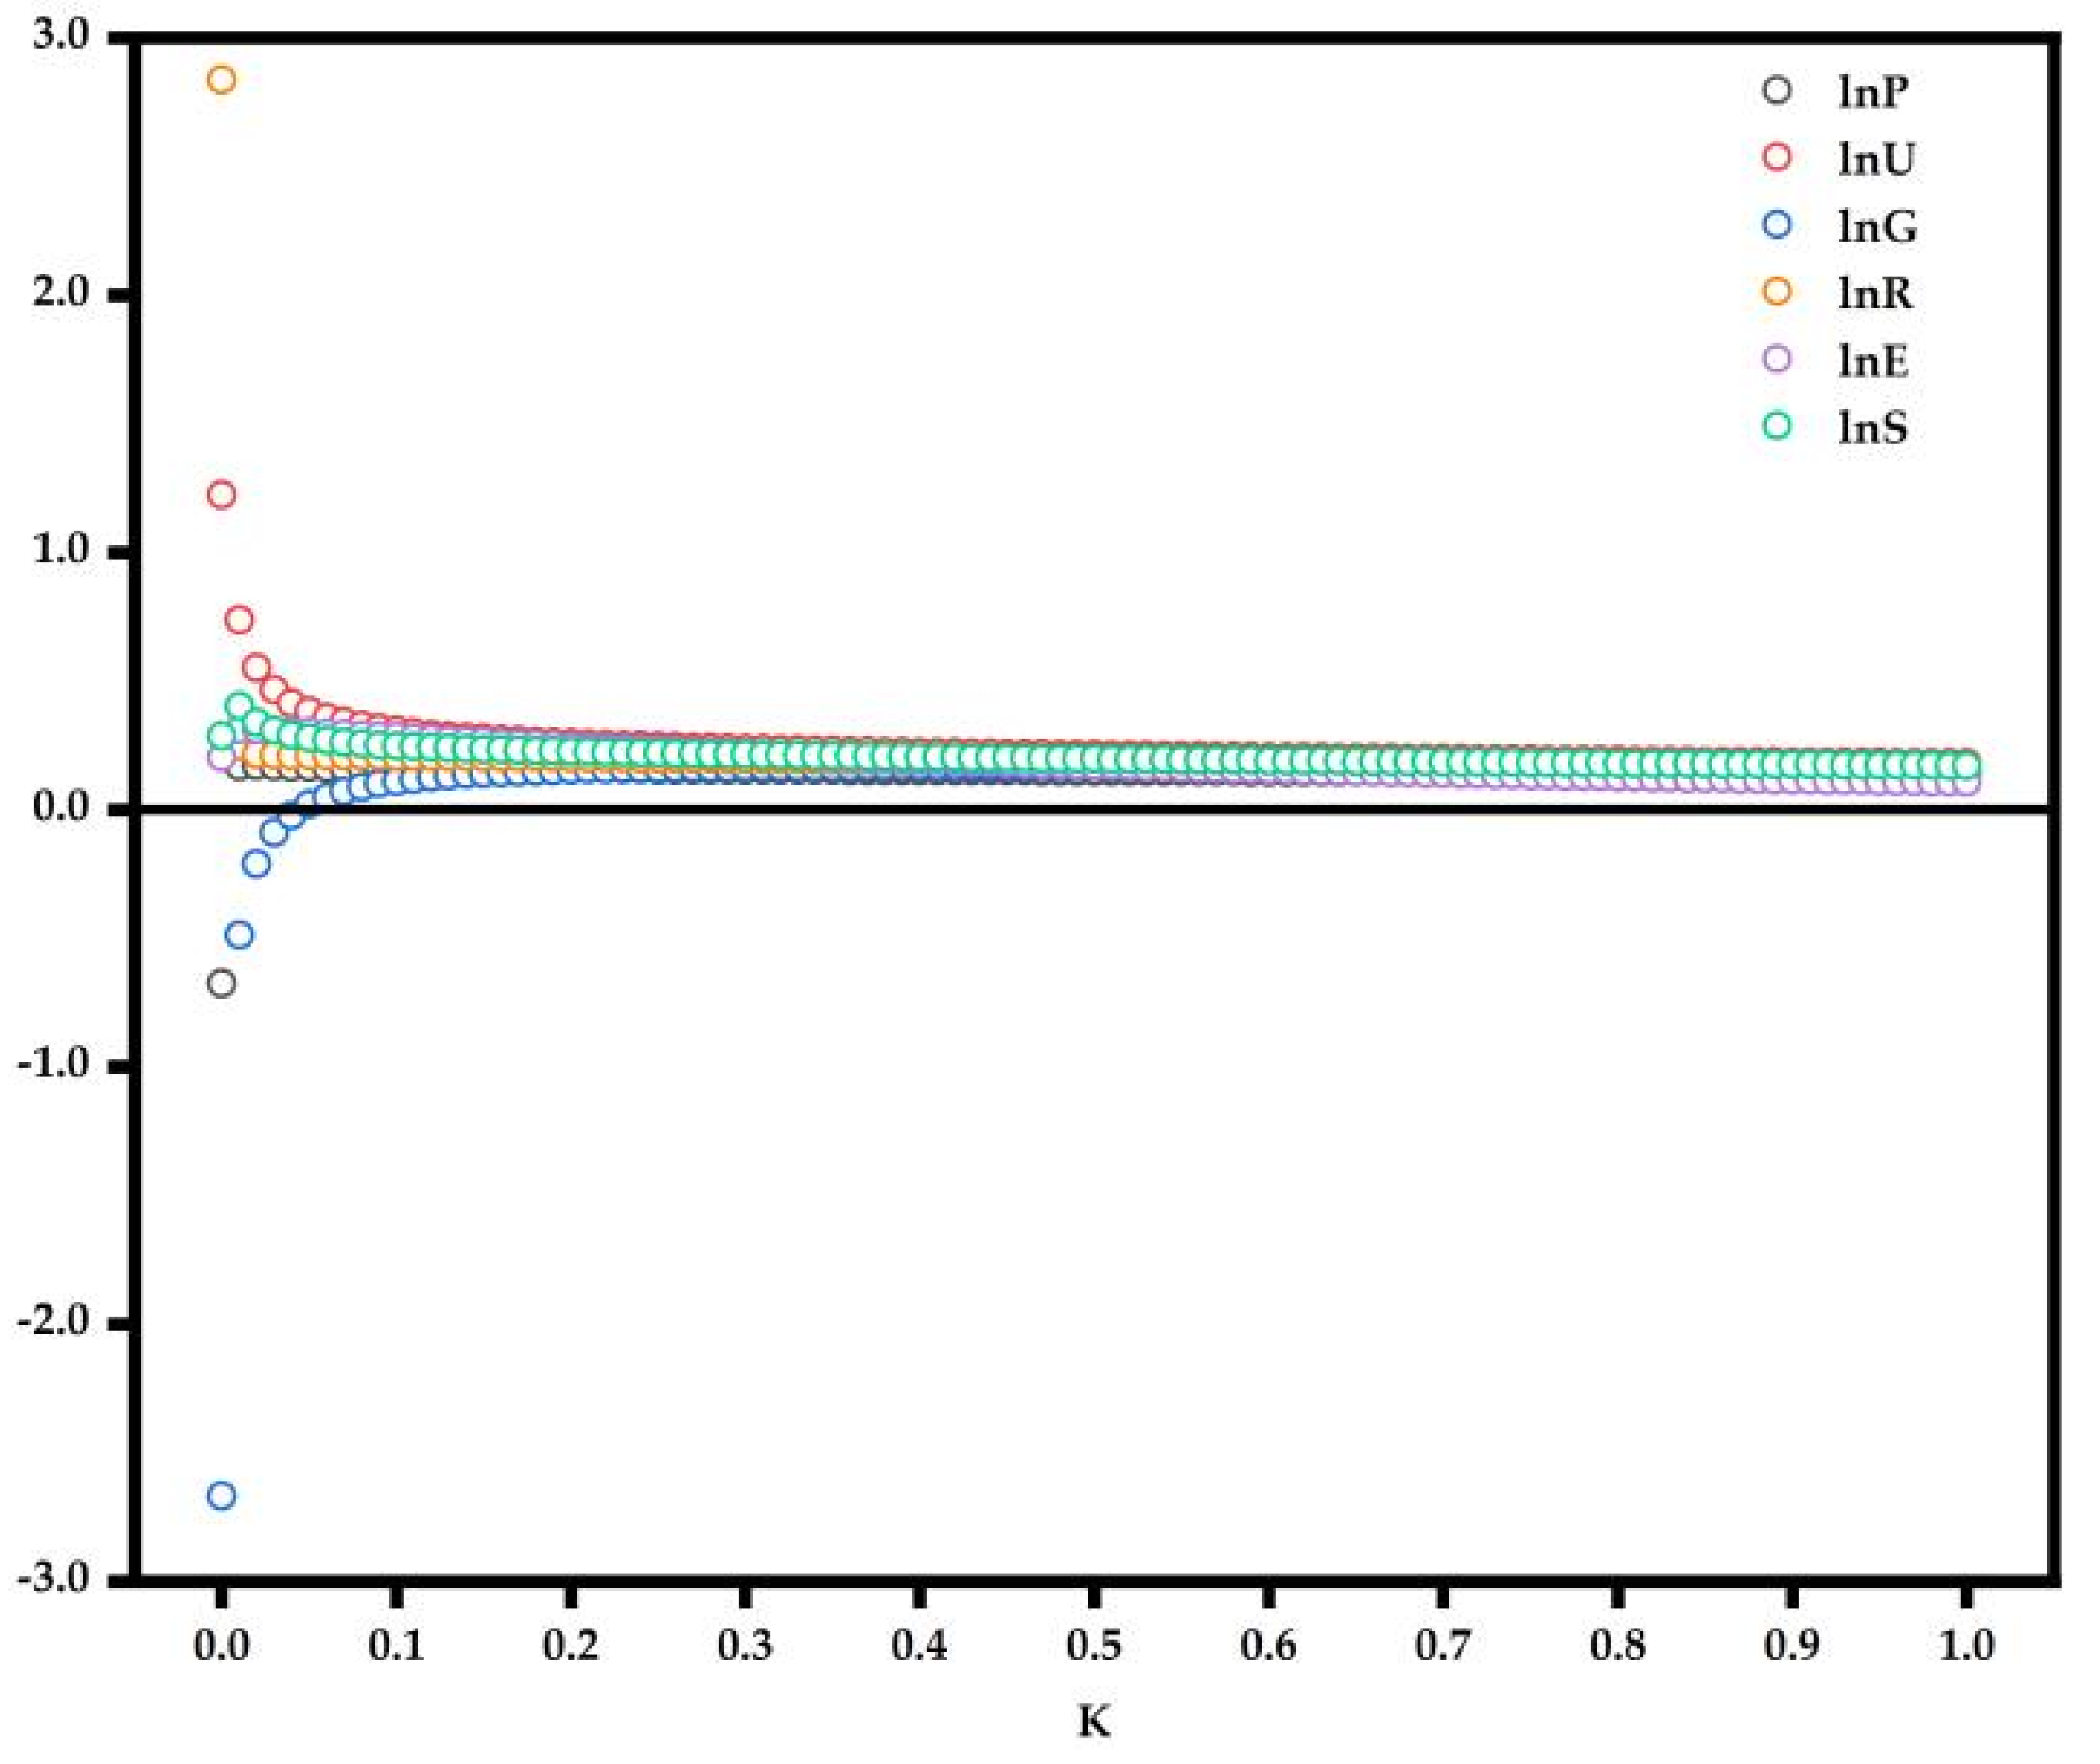
- From the literature survey, seven factors influencing urban residential buildings in Fujian Province were determined. The method of ridge regression was used to analyze the best fit degree. The industrial structure factors that have less impact on the carbon emissions of Fujian Province were excluded, and the influencing factors of urban living area were introduced, and the ridge regression analysis was conducted again. Finally, the six major influencing factors of carbon emissions affecting the urban living area of Fujian Province were determined, and a single factor sensitivity analysis on the prediction results was conducted. The total population, urban living area, residents’ consumption expenditure, urbanization rate, per capita GDP, and energy structure were determined as the key influencing factors, ranked from high to low.
- (2)
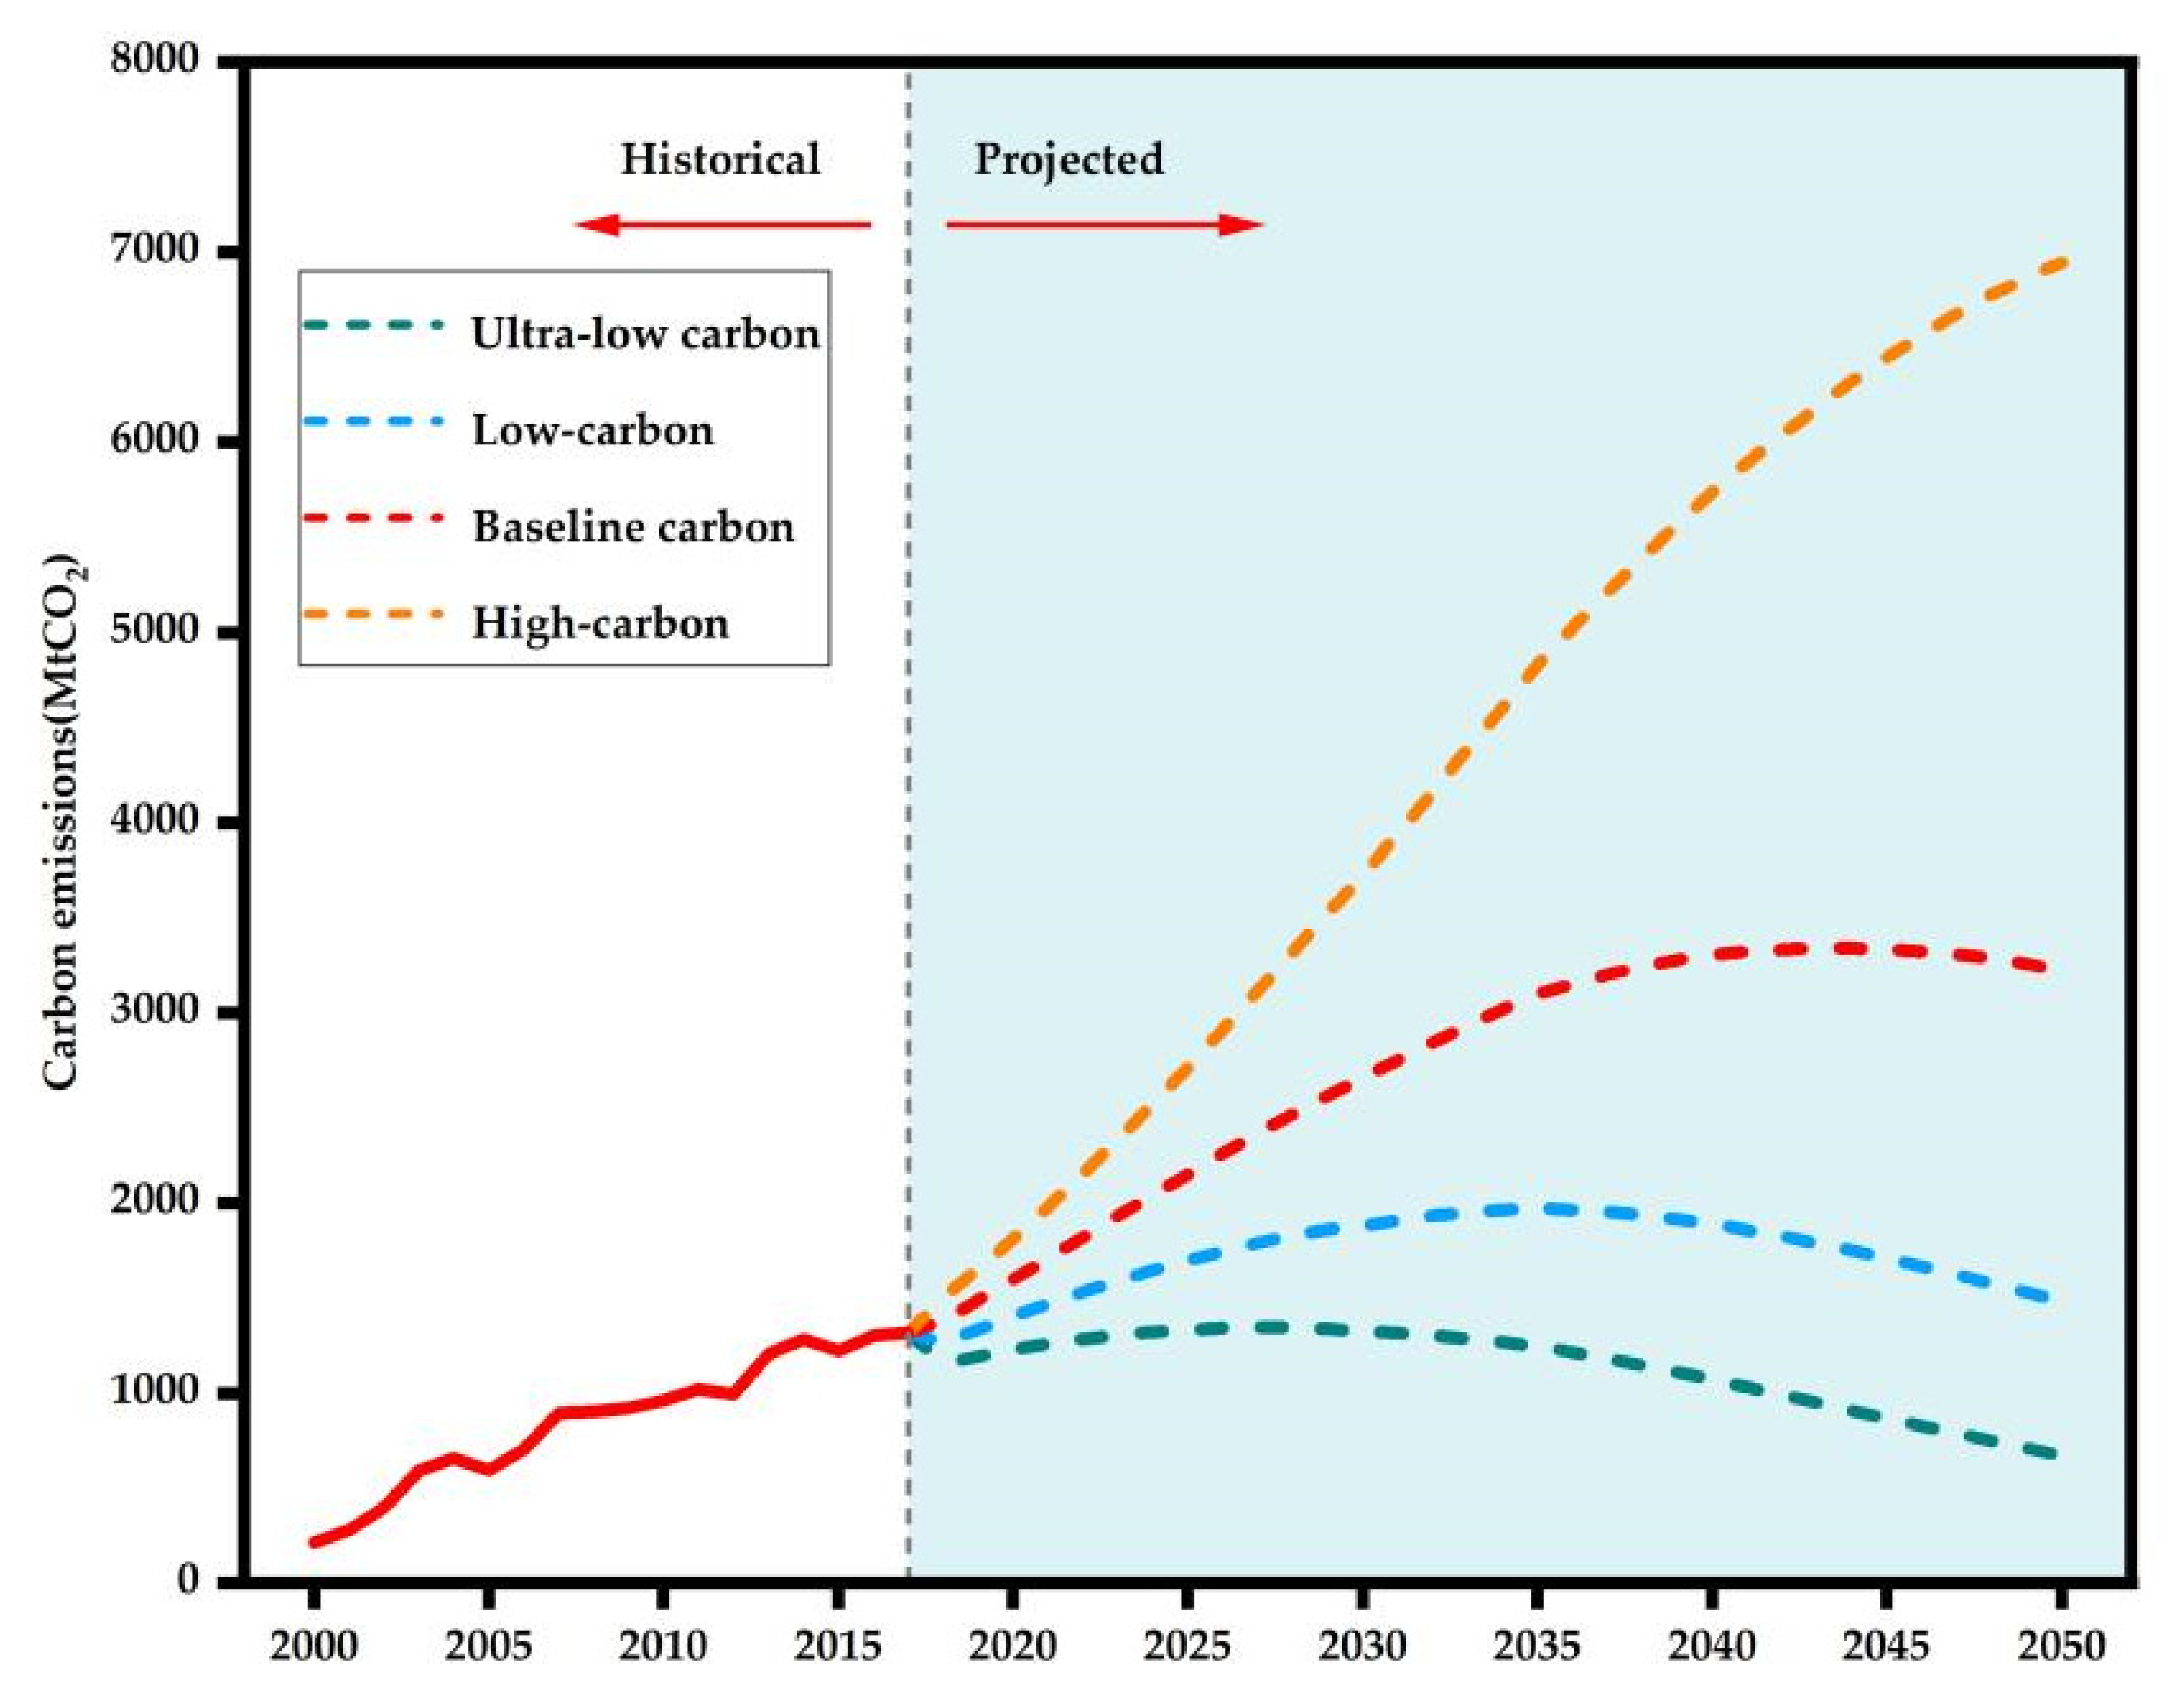
- By studying the relevant policies of Fujian Province in recent years, and processed the collected relevant data for modeling, and finally calculated the STIRPAT model with good fit using SPSSPRO software. The scenario analysis method was used to divide the carbon emissions of Fujian Province into four model scenarios: ultra-low carbon, low-carbon, baseline, and high-carbon. The peak carbon emissions of urban buildings in Fujian Province from 2018 to 2050 are predicted, and the following conclusions were drawn: Only the ultra-low carbon scenario can realize the 2030 carbon peak commitment of the urban residential buildings in advance. Under the baseline model, the carbon emissions will peak in 2044. In the low-carbon scenario, the turning point of the carbon emissions peak time will appear in 2035. Under the ultra-low carbon model, the carbon emissions will peak in 2027, which is in line with the goal of Fujian Province to reach the peak carbon by 2030. Whether there is a peak in the high-carbon model remains to be studied. Based on this, the corresponding countermeasures are proposed for reference.
- (1)
- Pay close attention to the change trend of the total population and advocate the concept of green energy use of residents. The above research shows that the change of total population is the most important factor affecting urban residential buildings. With the change of China’s fertility policy, Fujian Province should have a clear development plan for the total population and control the total population and growth rate within an appropriate range. At the same time, we should change the consumption structure of residents in Fujian Province from high carbon and high energy consumption to low carbon and high-quality consumption. The government can provide consumers with more low-carbon options through cooperation with enterprises, and use various publicity means to guide the masses to form low-carbon awareness, and promote the green transformation of individual consumption behavior.
- (2)
- Improve energy utilization efficiency and realize the transformation of energy structure. It can be seen from the above research that the reduction of coal energy proportion is the key factor affecting urban residential buildings. The government needs to first improve the efficiency of energy use through technological progress, develop centralized photovoltaic power generation projects according to local conditions, cultivate photovoltaic industries such as “complementary fishing and lighting”, and actively carry out the centralized promotion of rooftop distributed photovoltaic throughout the county (city, district). We will promote the development of offshore wind power in an orderly manner and plan to build a far-reaching offshore wind power base. Actively explore new marine energy such as wave energy and tidal energy, promote the complementation of source, network, load, storage and multi-energy, and lay out and build a number of integrated projects of scenery and storage. Develop nuclear power safely and steadily. Make rational use of biomass energy. We will promote the construction of pumped storage power stations in an orderly manner and accelerate the large-scale application of new types of energy storage. Promote the development of the whole chain of hydrogen energy “production, storage and transportation”. If clean energy is fully developed and used safely, it can solve the problems of environmental pollution and carbon emissions caused by excessive energy consumption from the source, which is of great significance.
- (3)
- Cooperate with multi-factor governance to achieve ultra-low carbon model. Total population, urban living area, residents’ consumption expenditure and other paths, multi-factor governance can realize the early transformation of the carbon emission model of coastal cities into ultra-low carbon model, which is conducive to the early realization of the carbon peak goal of coastal provinces. According to the results of sensitivity analysis, in the ultra-low carbon model, urbanization rate, per capita GDP and energy structure do not affect the peak year, but only affect the peak carbon. The total population, residents’ consumption expenditure and urban residential area have an impact on the peak and peak years, and urban residents’ consumption expenditure has brought the carbon peak years ahead of time, while the other two factors have a delayed effect. Only by cooperating with multi-factor governance can we enter the ultra-low carbon model as soon as possible and achieve the goal of “Dural carbon”.
Author Contributions
Funding
Institutional Review Board Statement
Informed Consent Statement
Data Availability Statement
Conflicts of Interest
References
- IPCC. Climate Change 2014: Mitigation of Climate Change: Contribution of Working Group III to the Fifth Assessment Report of the Intergovernmental Panel on Climate Change; Cambridge University Press: Cambridge, UK, 2014; pp. 168–192. [Google Scholar]
- Pokhrel, S.R.; Hewage, K.; Chhipi-Shrestha, G.; Karunathilake, H.; Li, E.; Sadiq, R. Carbon capturing for emissions reduction at building level: A market assessment from a building management perspective. J. Clean. Prod. 2021, 294, 126323. [Google Scholar] [CrossRef]
- World Bank Group. Carbon Emission Data. Available online: https://data.worldbank.org.cn/indicator/EN.ATM.CO2E.KT?view=chart (accessed on 2 April 2021).
- IPCC. Impacts of 1.5 °C of Global Warming on Natural and Human Systems. Available online: https://www.ipcc.ch/sr15/ (accessed on 1 April 2021).
- Zhou, T. New Physical Science Behind Climate Change: What does IPCC AR6 tell us? Innovation 2021, 2, 100173. [Google Scholar] [CrossRef]
- Energy & Climate Intelligence Unit. Net Zero Emissions Race. Available online: https://eciu.net/netzerotracker (accessed on 3 April 2021).
- Robati, M.; Oldfield, P.; Nezhad, A.A.; Carmichael, D.G.; Kuru, A. Carbon value engineering: A framework for integrating embodied carbon and cost reduction strategies in building design. Build. Environ. 2021, 192, 107620. [Google Scholar] [CrossRef]
- International Energy Agency. World Energy Outlook 2019—Executive Summary. Available online: https://www.iea.org/reports/world-energy-outlook-2019 (accessed on 3 April 2021).
- United Nations Environment Programme. 2021 Global Status Report for Buildings and Construction: Towards a Zero-emission, Efficient and Resilient Buildings and Construction Sector. Available online: Nairobi.https://www.unep.org/zh-hans/resources/baogao/2021quanqiujianzhuhejianzaoyezhuangkuangbaogao (accessed on 20 May 2022).
- Zhou, N.; Fridley, D.; Khanna, N.Z.; Carmichael, D.G.; Kuru, A. China’s energy and emissions outlook to 2050: Perspectives from bottom-up energy end-use model. Energy Policy 2013, 53, 51–62. [Google Scholar] [CrossRef]
- Zhou, N.; Khanna, N.; Feng, W.; Ke, J.; Levine, M. Scenarios of energy efficiency and CO2 emissions reduction potential in the buildings sector in China to year 2050. Nat. Energy 2018, 3, 978–984. [Google Scholar] [CrossRef]
- China Association of Building Energy Efficiency. 2021 Study on Building Energy Consumption and Carbon Emissions in China: Assessment of the Carbon Peak Situation in Provincial Buildings; China Association of Building Energy Efficiency: Beijing, China, 2021. [Google Scholar]
- Zhang, J.Y. Carbon Emission Prediction of Construction Industry Based on BP Neural Network. World Sci. Res. J. 2022, 8, 565–572. [Google Scholar]
- International Energy Agency. World Energy Outlook 2018; IEA: Paris, France, 2019; Available online: https://www.iea.org/weo2018/ (accessed on 13 February 2020).
- Shi, Q.W.; Gao, J.X.; Wang, X.; Ren, H.; Cai, W.; Wei, H.F. Temporal and Spatial Variability of Carbon Emission Intensity of Urban Residential Buildings: Testing the Effect of Economics and Geographic Location in China. Sustainability 2020, 12, 2695. [Google Scholar] [CrossRef] [Green Version]
- Fu, L.; Liu, A. Data: China Statistical Yearbook: China Power Project; China Statistics Press: Beijing, China, 2021. [Google Scholar]
- Fu, L.; Chen, Y.; Xia, Q.; Miao, J. Impact of economic policy uncertainty on carbon emissions: Evidence at China’s city level. Front. Energy Res. 2022, 10, 866217. [Google Scholar] [CrossRef]
- Pan, L.; Yu, J.; Lin, L. The temporal and spatial pattern evolution of land-use carbon emissions in China coastal regions and its response to green economic development. Front. Environ. Sci. 2022, 10, 1018372. [Google Scholar] [CrossRef]
- FAVA, J.A. Will the next 10 years be as productive in advancing lifecycle approaches as the last 15 years? Int. J. Life Cycle Assess. 2006, 11, 6–8. [Google Scholar] [CrossRef]
- Jiang, P.; Dong, W.; Kung, Y.; Geng, Y. Analysing co-benefits of the energy conservation and carbon reduction in China’s large commercial buildings. J. Clean. Prod. 2013, 58, 112–120. [Google Scholar] [CrossRef]
- Xu, L.; Qu, J.S.; Li, H.J.; Zeng, J.; Zhang, H. Analysis and Prediction of Residents Energy Consumption Carbon Emission in China. Ecol. Econ. 2019, 35, 19–23. [Google Scholar]
- Suzuki, M.; Oka, T.; Okada, K. The estimation of energy consumption and CO2 emission due to housing construction in Japan. Energy Build. 1995, 22, 165–169. [Google Scholar] [CrossRef]
- Adalberth, K. Energy use during the life cycle of buildings: Amethod. Build. Environ. 1997, 32, 317–321. [Google Scholar] [CrossRef]
- You, F.; Hu, D.; Zhang, H.; Guo, Z.; Zhao, Y.; Wang, B.; Yuan, Y. Carbon emissions in the life cycle of urban building system in China—A case study of residential buildings. Ecol. Complex. 2011, 8, 201–212. [Google Scholar] [CrossRef]
- Yu, X.; Gao, P.; Liu, Y.; Lei, M.; Zhang, P. Research on whole life cycle carbon emission model of typical buildings. Chin. J. Popul. Resour. Environ. 2015, 13, 320–323. [Google Scholar] [CrossRef]
- Mao, Y.; Gong, X.; Yun, Y. Carbon emission-based measurement of floor area ratio bonus for residential green buildings in china. J. Green Build. 2018, 13, 84–97. [Google Scholar] [CrossRef]
- Wu, X.Y.; Peng, B.; Lin, B.R. A dynamic life cycle carbon emission assessment on green and non-green buildings in china. Energy Build. 2017, 149, 272–281. [Google Scholar] [CrossRef]
- Wang, W.Q.; Li, J.; Li, C.G. A study on the correlation between residential patterns and carbon emissions from residents’ transportation:a case study of caoyang xincun in shanghai. China City Plan. Rev. 2017, 26, 53–59. [Google Scholar]
- Dabaieh, M.; Kenawy, I.; Salah, W.; Adel, M. Carbon mapping for residential low carbon retrofitting. In Advanced Technologies for Sustainable Systems; Lecture Notes in Networks and Systems; Springer International Publishing: Cham, Switzerland, 2017; Volume 4, pp. 79–91. [Google Scholar]
- Nematchoua, M.K.; Orosa, J.A.; Ricciardi, P.; Obonyo, E.; Sambatra, E.J.R.; Reiter, S. Transition to Zero Energy and Low Carbon Emission in Residential Buildings Located in Tropical and Temperate Climates. Energies 2021, 14, 4253. [Google Scholar] [CrossRef]
- York, R.; Rosa, E.A.; Dietz, T. Footprints on the Earth: The Environmental Consequences of Modernity. Am. Sociol. Rev. 2003, 68, 279–300. [Google Scholar] [CrossRef]
- York, R.; Rosa, E.A.; Dietz, T. STIRPAT, IPAT and ImPACT: Analytic tools for unpacking the driving forces of environmental impacts. Ecol. Econ. 2003, 46, 351–365. [Google Scholar] [CrossRef]
- Gao, J.; Zhong, X.; Cai, W.; Ren, H.; Huo, T.; Wang, X.; Mi, Z. Dilution effect of the building area on energy intensity in urban residential buildings. Nat. Commun. 2019, 10, 4944. [Google Scholar] [CrossRef]
- Ma, M.; Yan, R.; Cai, W. An extended STIRPAT model-based methodology for evaluating the driving forces affecting carbon emissions in existing public building sector: Evidence from China in 2000–2015. Nat. Hazards 2017, 89, 741–756. [Google Scholar] [CrossRef]
- Zhang, Y.; Song, Y. Tax rebates, technological innovation and sustainable development: Evidence from Chinese micro-level data. Technol. Forecast. Soc. Change 2022, 176, 121481. [Google Scholar] [CrossRef]
- Song, Y.; Zhang, Y.; Zhang, Y. Economic and environmental influences of resource tax: Firm-level evidence from China. Resour. Policy 2022, 77, 102751. [Google Scholar] [CrossRef]
- Dong, F.; Hu, M.; Gao, Y.; Liu, Y.; Zhu, J.; Pan, Y. How does digital economy affect carbon emissions? Evidence from global 60 countries. Sci. Total Environ. 2022, 852, 158401. [Google Scholar]
- Li, X.; Liu, J.; Ni, P. The Impact of the digital economy on CO2 emissions: A theoretical and empirical analysis. Sustainability 2021, 13, 7267. [Google Scholar] [CrossRef]
- Huo, T.; Xu, L.; Feng, W.; Cai, W.; Liu, B. Dynamic scenario simulations of carbon emission peak in China’s city-scale urban residential building sector through 2050. Energy Policy 2021, 159, 112612. [Google Scholar] [CrossRef]
- Chen, H.; Du, Q.; Huo, T.; Liu, P.; Cai, W.; Liu, B. Spatiotemporal patterns and driving mechanism of carbon emissions in China’s urban residential building sector. Energy 2023, 263, 126102. [Google Scholar] [CrossRef]
- Huo, T.; Ma, Y.; Cai, W.; Liu, B.; Mu, L. Will the urbanization process influence the peak of carbon emissions in the building sector? A dynamic scenario simulation. Energy Build. 2020, 232, 110590. [Google Scholar]
- Huo, T.F.; Ma, Y.L.; Xu, L.B.; Feng, W.; Cai, W.G. Carbon emissions in China’s urban residential building sector through 2060: A dynamic scenario simulation. Energy 2022, 254, 124395. [Google Scholar] [CrossRef]
- Yang, J.; Cai, W.; Ma, M.; Li, L.; Liu, C.; Ma, X.; Li, L.; Chen, X. Driving forces of China’s CO2 emissions from energy consumption based on Kaya-LMDI methods. Sci. Total Environ. 2020, 711, 134569. [Google Scholar] [CrossRef]
- Huo, T.; Xu, L.; Liu, B.; Cai, W.; Feng, W. China’s commercial building carbon emissions toward 2060: An integrated dynamic emission assessment model. Appl. Energy 2022, 325, 119828. [Google Scholar] [CrossRef]
- Wang, C.; Chen, J.N.; Zou, J. Decomposition of Energy-related CO2 Emission in China: 1957–2000. Energy 2005, 30, 73–83. [Google Scholar] [CrossRef]
- Ma, M.D.; Ma, X.; Cai, W.; Cai, W.G. Low carbon roadmap of residential building sector in China: Historical mitigation and prospective peak. Appl. Energy 2020, 273, 115247. [Google Scholar] [CrossRef]
- Huo, T.; Cao, R.; Xia, N.; Hu, X.; Cai, W.; Liu, B. Spatial correlation network structure of China’s building carbon emissions and its driving factors: A social network analysis method. J. Environ. Manag. 2022, 320, 115808. [Google Scholar] [CrossRef]
- Tan, X.; Lai, H.; Gu, B.; Zeng, Y.; Li, H. Carbon emission and abatement potential outlook in China’s building sector through 2050. Energy Policy 2018, 118, 429–439. [Google Scholar] [CrossRef]
- Chen, X.; Shuai, C.; Wu, Y.; Zhang, Y. Analysis on the carbon emission peaks of China’s industrial, building, transport, and agricultural sectors. Sci. Total Environ. 2020, 709, 135768. [Google Scholar] [CrossRef]
- Liang, Y.; Cai, W.; Ma, M. Carbon dioxide intensity and income level in the Chinese megacities’ residential building sector: Decomposition and decoupling analyses. Sci. Total Environ. 2019, 677, 315–327. [Google Scholar] [CrossRef]
- Yang, T.; Pan, Y.Q.; Yang, Y.K.; Lin, M.S.; Qin, B.Y.; Xu, P.; Huang, Z.Z. CO2 emissions in China’s building sector through 2050: A scenario analysis based on a bottom-up model. Energy 2017, 128, 208–223. [Google Scholar] [CrossRef]
- Shuai, C.Y.; Shen, L.Y.; Jiao, L.D.; Wu, Y.; Tan, Y.T. Identifying key impact factors on carbon emission: Evidences from panel and time-series data of 125 countries from 1990 to 2011. Appl. Energy 2017, 187, 310–325. [Google Scholar] [CrossRef]
- Zhang, Y.; Yan, D.; Hu, S.; Guo, S. Modelling of energy consumption and carbon emission from the building construction sector in China, a process-based LCA approach. Energy Policy 2019, 134, 110949. [Google Scholar] [CrossRef]
- Huo, T.; Ren, H.; Zhang, X.; Cai, W.; Feng, W.; Zhou, N.; Wang, X. China’s energy consumption in the building sector: A Statistical Yearbook-Energy Balance Sheet based splitting method. J. Clean. Prod. 2018, 185, 665–679. [Google Scholar] [CrossRef]


| Stage Situation | 2021–2025 | 2026–2030 | 2031–2035 | 2036–2040 | 2041–2045 | 2046–2050 | |
|---|---|---|---|---|---|---|---|
| Growth rate of total population | Ultra-low carbon | −1.00% | −2.00% | −2.50% | −3.00% | −3.250% | −3.50% |
| Low-carbon | 0.00% | −1.00% | −1.50% | −2.00% | −2.250% | −2.50% | |
| Baseline carbon | 1.00% | 0.00% | −0.50% | −1.00% | −1.250% | −1.50% | |
| High-carbon | 2.00% | 1.00% | 0.50% | 0.00% | −0.250% | −0.50% | |
| Urbanization growth rate | Ultra-low carbon | 68.50% | 72.00% | 75.00% | 76.00% | 76.500% | 77.00% |
| Low-carbon | 69.50% | 73.00% | 76.00% | 77.00% | 77.500% | 78.00% | |
| Baseline carbon | 70.50% | 74.00% | 77.00% | 78.00% | 78.500% | 79.00% | |
| High-carbon | 71.50% | 75.00% | 78.00% | 79.00% | 79.500% | 80.00% | |
| GDP growth rate per capita | Ultra-low carbon | 9.00% | 8.00% | 7.00% | 6.00% | 5.000% | 4.00% |
| Low-carbon | 10.00% | 9.00% | 8.00% | 7.00% | 6.000% | 5.00% | |
| Baseline carbon | 11.00% | 10.00% | 9.00% | 8.00% | 7.000% | 6.00% | |
| High-carbon | 12.00% | 11.00% | 10.00% | 9.00% | 8.000% | 7.00% | |
| Resident Growth rate of consumption expenditure | Ultra-low carbon | 5.00% | 4.00% | 3.00% | 2.00% | 1.000% | 0.00% |
| Low-carbon | 6.00% | 5.00% | 4.00% | 3.00% | 2.000% | 1.00% | |
| Baseline carbon | 7.00% | 6.00% | 5.00% | 4.00% | 3.000% | 2.00% | |
| High-carbon | 8.00% | 7.00% | 6.00% | 5.00% | 4.000% | 3.00% | |
| Proportion growth rate of coal energy | Ultra-low carbon | 40.00% | 38.00% | 37.00% | 36.00% | 35.000% | 34.00% |
| Low-carbon | 42.00% | 40.00% | 39.00% | 38.00% | 37.000% | 36.00% | |
| Baseline carbon | 44.00% | 42.00% | 41.00% | 40.00% | 39.000% | 38.00% | |
| High-carbon | 46.00% | 44.00% | 43.00% | 42.00% | 41.000% | 40.00% | |
| Growth rate of urban residential area | Ultra-low carbon | 2.50% | 2.00% | 1.50% | 1.00% | 0.500% | 0.00% |
| Low-carbon | 3.50% | 3.00% | 2.50% | 2.00% | 1.500% | 1.00% | |
| Baseline carbon | 4.50% | 4.00% | 3.50% | 3.00% | 2.500% | 2.00% | |
| High-carbon | 5.50% | 5.00% | 4.50% | 4.00% | 3.500% | 3.00% |
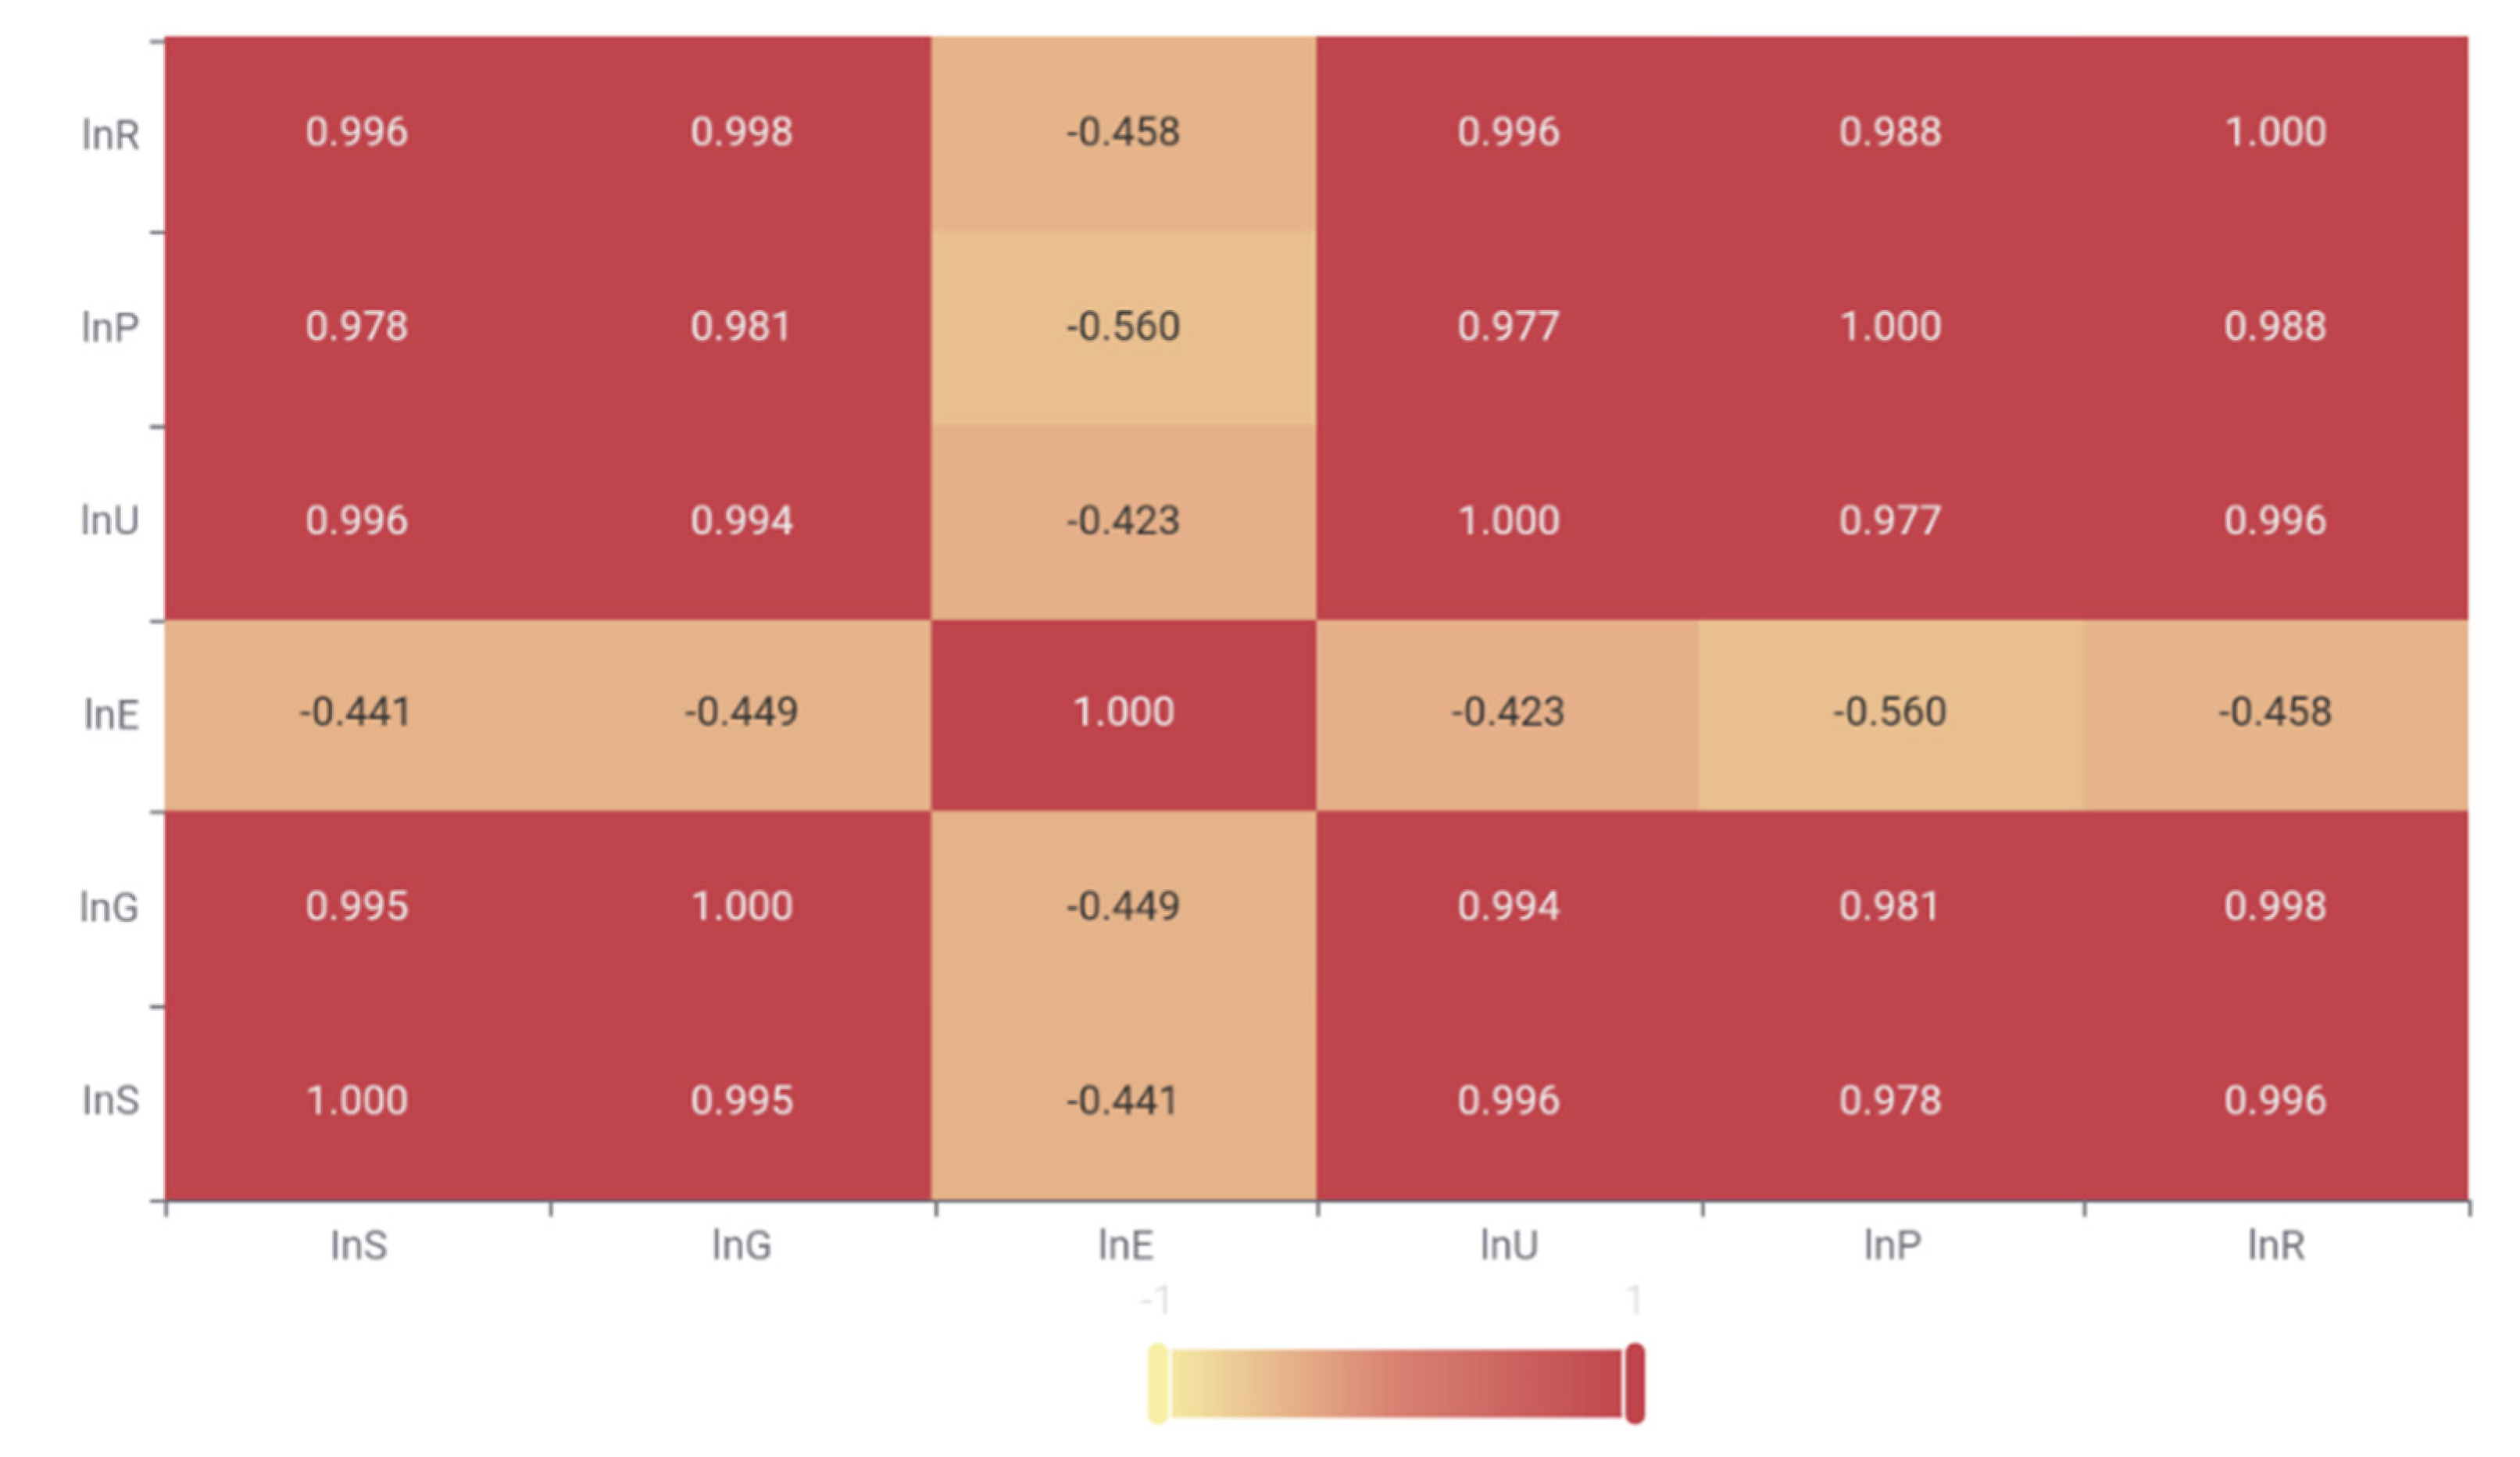
| 1.000 (0.000 ***) | 0.995 (0.000 ***) | −0.441 (0.067 *) | 0.996 (0.000 ***) | 0.978 (0.000 ***) | 0.996 (0.000 ***) | |
| 0.995 (0.000 ***) | 1.000 (0.000 ***) | −0.449 (0.062 *) | 0.994 (0.000 ***) | 0.981 (0.000 ***) | 0.998 (0.000 ***) | |
| −0.441 (0.067 *) | −0.449 (0.062 *) | 1.000 (0.000 ***) | −0.423 (0.080 *) | −0.560 (0.016 **) | −0.458 (0.056 *) | |
| 0.996 (0.000 ***) | 0.994 (0.000 ***) | −0.423 (0.080 *) | 1.000 (0.000 ***) | 0.977 (0.000 ***) | 0.996 (0.000 ***) | |
| 0.978 (0.000 ***) | 0.981 (0.000 ***) | −0.560 (0.016 **) | 0.977 (0.000 ***) | 1.000 (0.000 ***) | 0.988 (0.000 ***) | |
| 0.996 (0.000 ***) | 0.998 (0.000 ***) | −0.458 (0.056 *) | 0.996 (0.000 ***) | 0.988 (0.000 ***) | 1.000 (0.000 ***) |
| K = 0.154 | Nonstandard Coefficient | Standardization Coefficient | Adjustment | |||||
|---|---|---|---|---|---|---|---|---|
| B | Standard Error | Beta | ||||||
| constant | −18.166 | 4.169 | - | −4.357 | 0.001 *** | 0.928 | 0.889 | 23.618 (0.000 ***) |
| 1.488 | 0.475 | 0.157 | 3.136 | 0.009 *** | ||||
| 1.026 | 0.141 | 0.275 | 7.255 | 0.000 *** | ||||
| 1.178 | 0.338 | 0.262 | 3.486 | 0.005 *** | ||||
| 0.357 | 0.058 | 0.233 | 6.145 | 0.000 *** | ||||
| 0.19 | 0.021 | 0.204 | 8.906 | 0.000 *** | ||||
| 0.109 | 0.029 | 0.141 | 3.722 | 0.003 *** | ||||
| Scene | Ultra-Low Carbon Scenarios | Low-Carbon Scenarios | Reference Scenarios | High-Carbon Scenarios |
|---|---|---|---|---|
| Peak time | 2027 | 2035 | 2044 | Not reaching the peak |
| Peak value | 1347.48 Mt | 1971.57 Mt | 3340.59 Mt | 6947.75 Mt |
| Particular Year | Actual Carbon Emission Value | Predicted Value of Ultra-Low Carbon Model | Predicted Value of Low-Carbon Model | Predicted Value of Reference Model | Predicted Value of High-Carbon Model |
|---|---|---|---|---|---|
| 2018 | 1378.91 | 1155.252146 | 1264.57 | 1380.38 | 1502.91 |
| Error rate | 0.0000% | 16.2199% | 8.2920% | 0.1065% | 8.9926% |
| Ultra-Low Carbon Scenarios | Low Carbon Scenarios | Baseline Scenarios | High-Carbon Scenarios | |||||
|---|---|---|---|---|---|---|---|---|
| Peak Year | Carbon Reaches Peak Value (Mt) | Peak Year | Carbon Reaches Peak Value (Mt) | Peak Year | Carbon Reaches Peak Value (Mt) | Peak Year | Carbon Reaches Peak Value (Mt) | |
| Increase of influencing factors (0%) | 2027 | 1347.481042 | 2035 | 1971.574415 | 2044 | 3340.586066 | None | 6947.754937 |
| Annual average growth rate of total population 1% | 2034 | 1636.496518 | 2035 | 1956.923812 | None | 5258.105544 | None | 11275.74645 |
| Urbanization rate Average annual growth rate 1% | 2027 | 1367.26318 | 2035 | 2034.0931 | 2044 | 3384.310649 | None | 7036.874316 |
| Average annual growth rate of GDP per capita 1% | 2027 | 1360.900188 | 2035 | 2006.994065 | 2044 | 3430.937489 | None | 7177.288349 |
| Average annual growth rate of residents’ consumption expenditure 1% | 2028 | 1372.805102 | 2035 | 2036.105922 | 2045 | 3506.518417 | None | 7368.400278 |
| Average annual growth rate of coal energy 1% | 2027 | 1347.885983 | 2035 | 1982.954949 | 2044 | 3380.17423 | None | 6949.801097 |
| Average annual growth rate of urban residential area 1% | 2026 | 1301.848962 | 2035 | 2097.428666 | 2046 | 3670.947194 | None | 7771.955995 |
Disclaimer/Publisher’s Note: The statements, opinions and data contained in all publications are solely those of the individual author(s) and contributor(s) and not of MDPI and/or the editor(s). MDPI and/or the editor(s) disclaim responsibility for any injury to people or property resulting from any ideas, methods, instructions or products referred to in the content. |
© 2023 by the authors. Licensee MDPI, Basel, Switzerland. This article is an open access article distributed under the terms and conditions of the Creative Commons Attribution (CC BY) license (https://creativecommons.org/licenses/by/4.0/).
Share and Cite
Ke, Y.; Zhou, L.; Zhu, M.; Yang, Y.; Fan, R.; Ma, X. Scenario Prediction of Carbon Emission Peak of Urban Residential Buildings in China’s Coastal Region: A Case of Fujian Province. Sustainability 2023, 15, 2456. https://doi.org/10.3390/su15032456
Ke Y, Zhou L, Zhu M, Yang Y, Fan R, Ma X. Scenario Prediction of Carbon Emission Peak of Urban Residential Buildings in China’s Coastal Region: A Case of Fujian Province. Sustainability. 2023; 15(3):2456. https://doi.org/10.3390/su15032456
Chicago/Turabian StyleKe, Yanyan, Lu Zhou, Minglei Zhu, Yan Yang, Rui Fan, and Xianrui Ma. 2023. "Scenario Prediction of Carbon Emission Peak of Urban Residential Buildings in China’s Coastal Region: A Case of Fujian Province" Sustainability 15, no. 3: 2456. https://doi.org/10.3390/su15032456