

The Impact of Land-Use Structure on Carbon Emission in China
Abstract
:1. Introduction
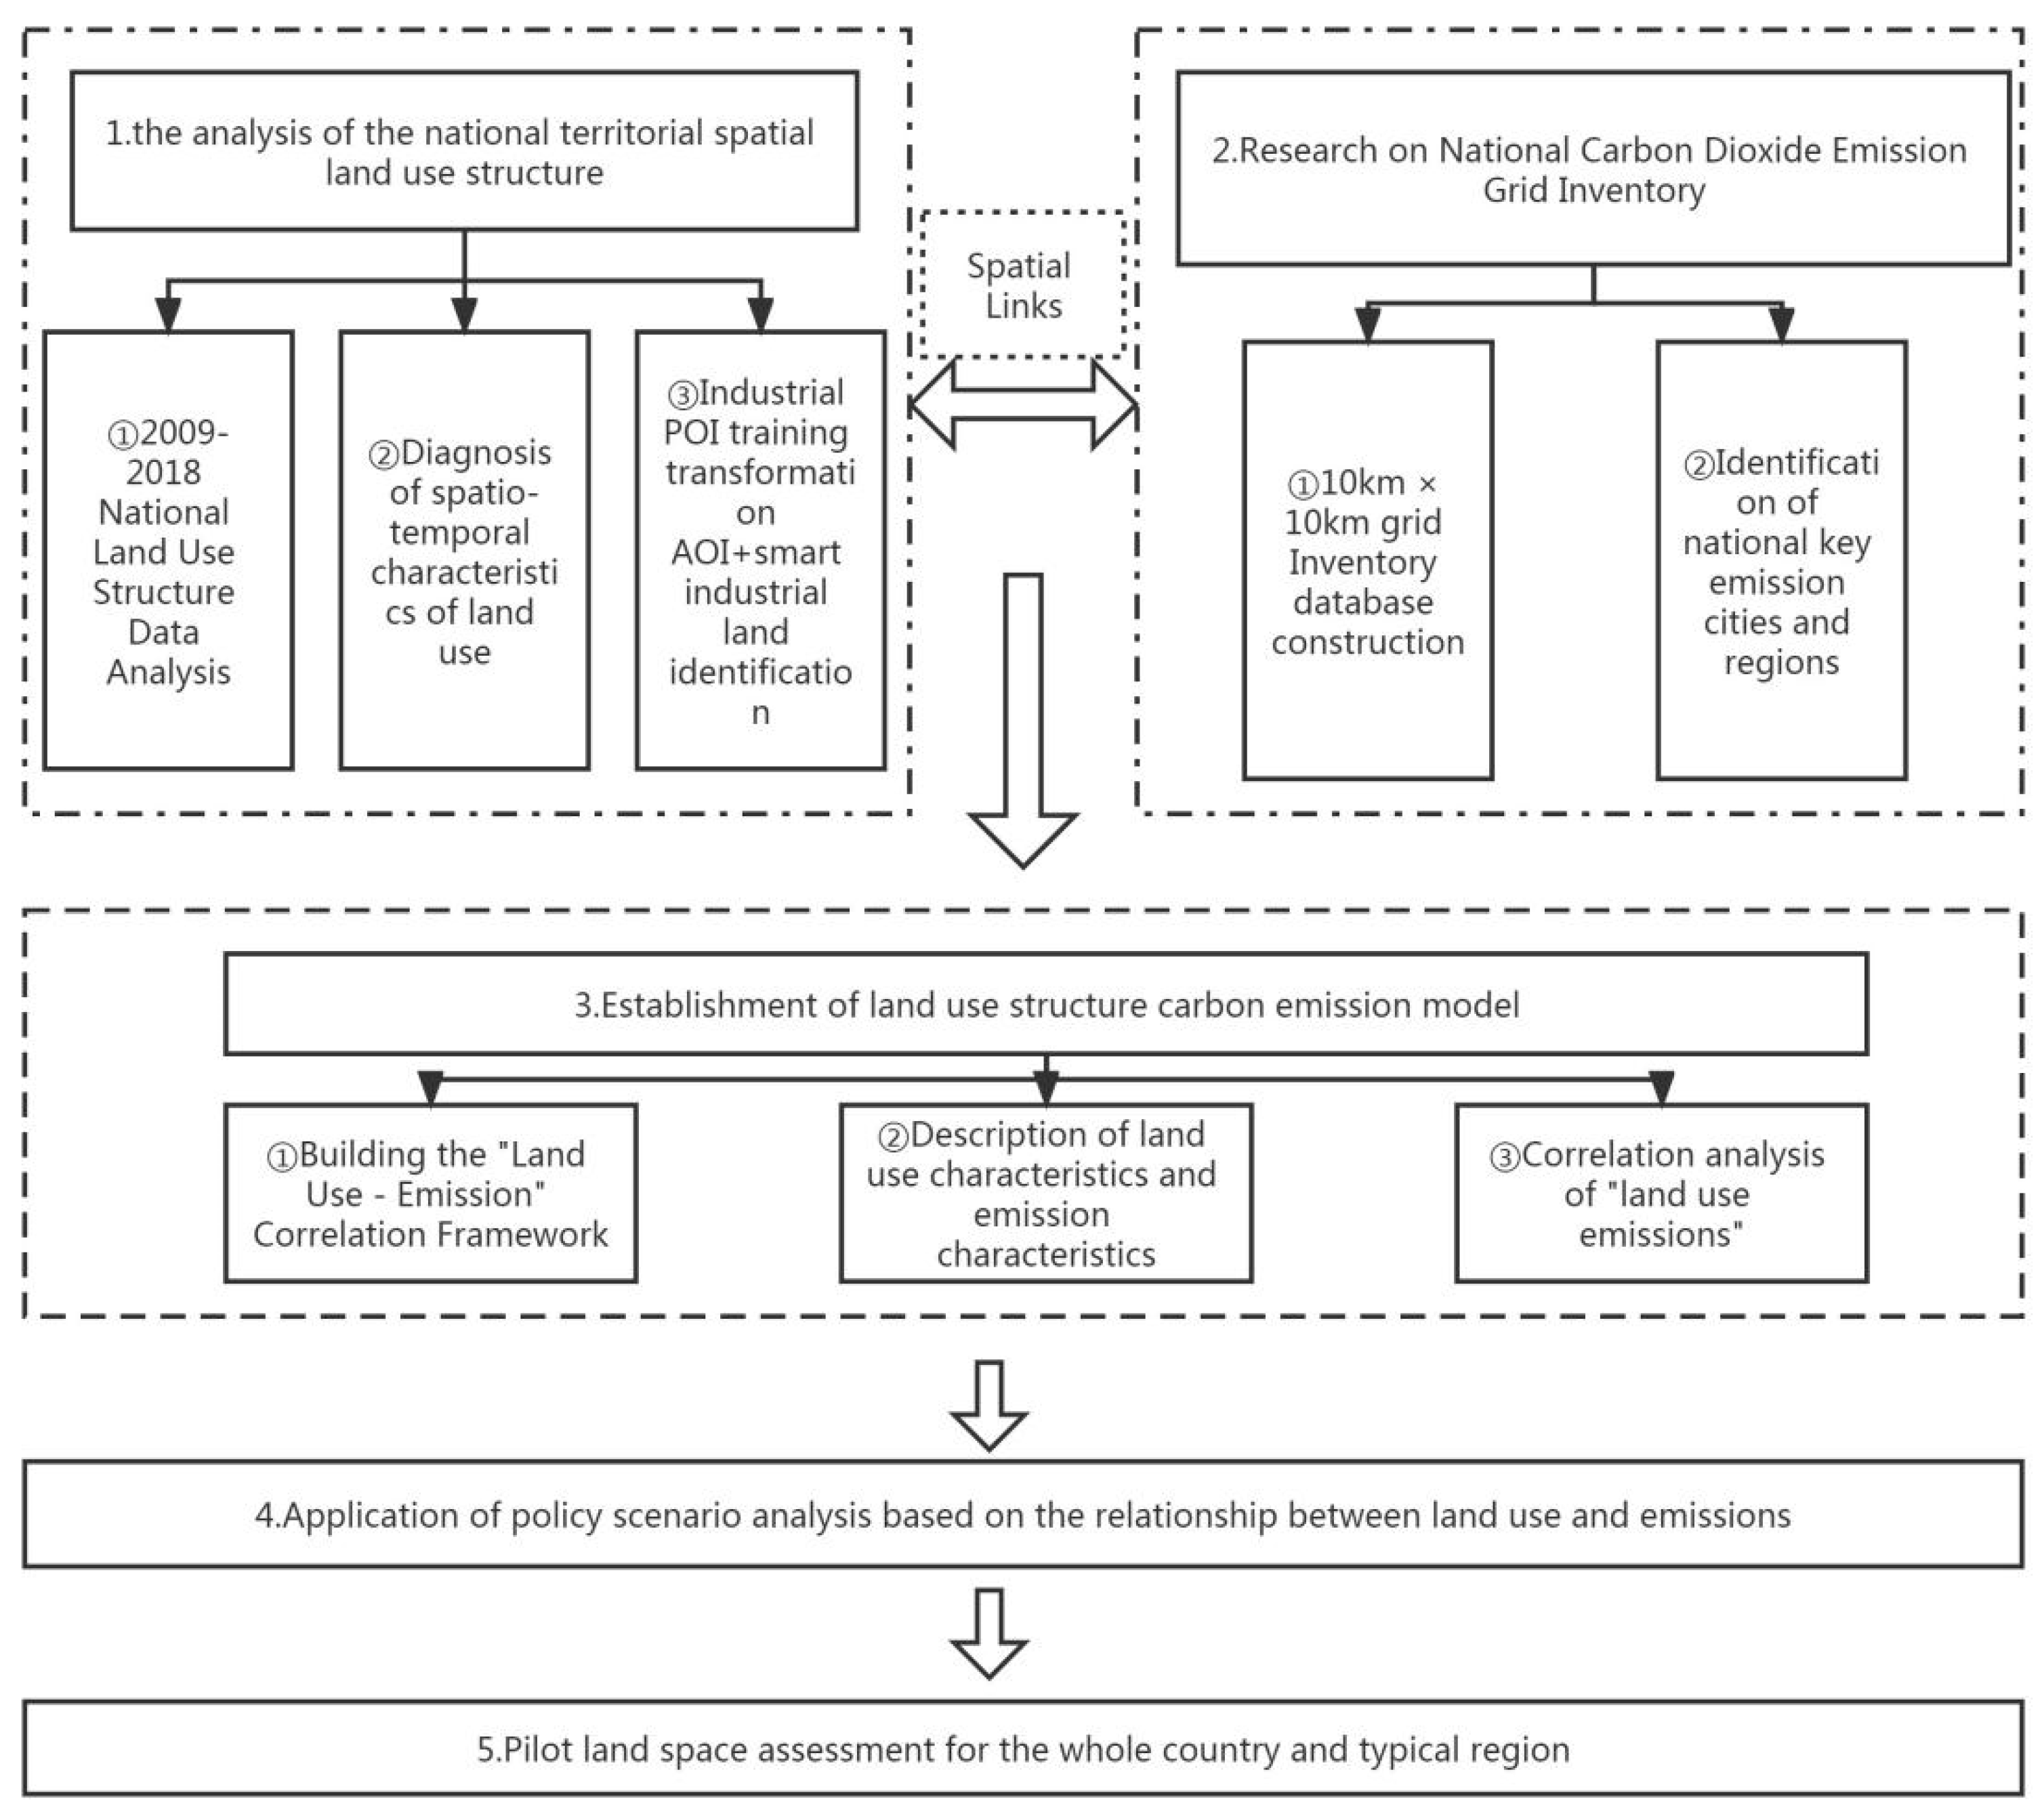
2. Materials and Methods
2.1. Research Object
2.2. Data Sources
2.3. Methods
3. Results
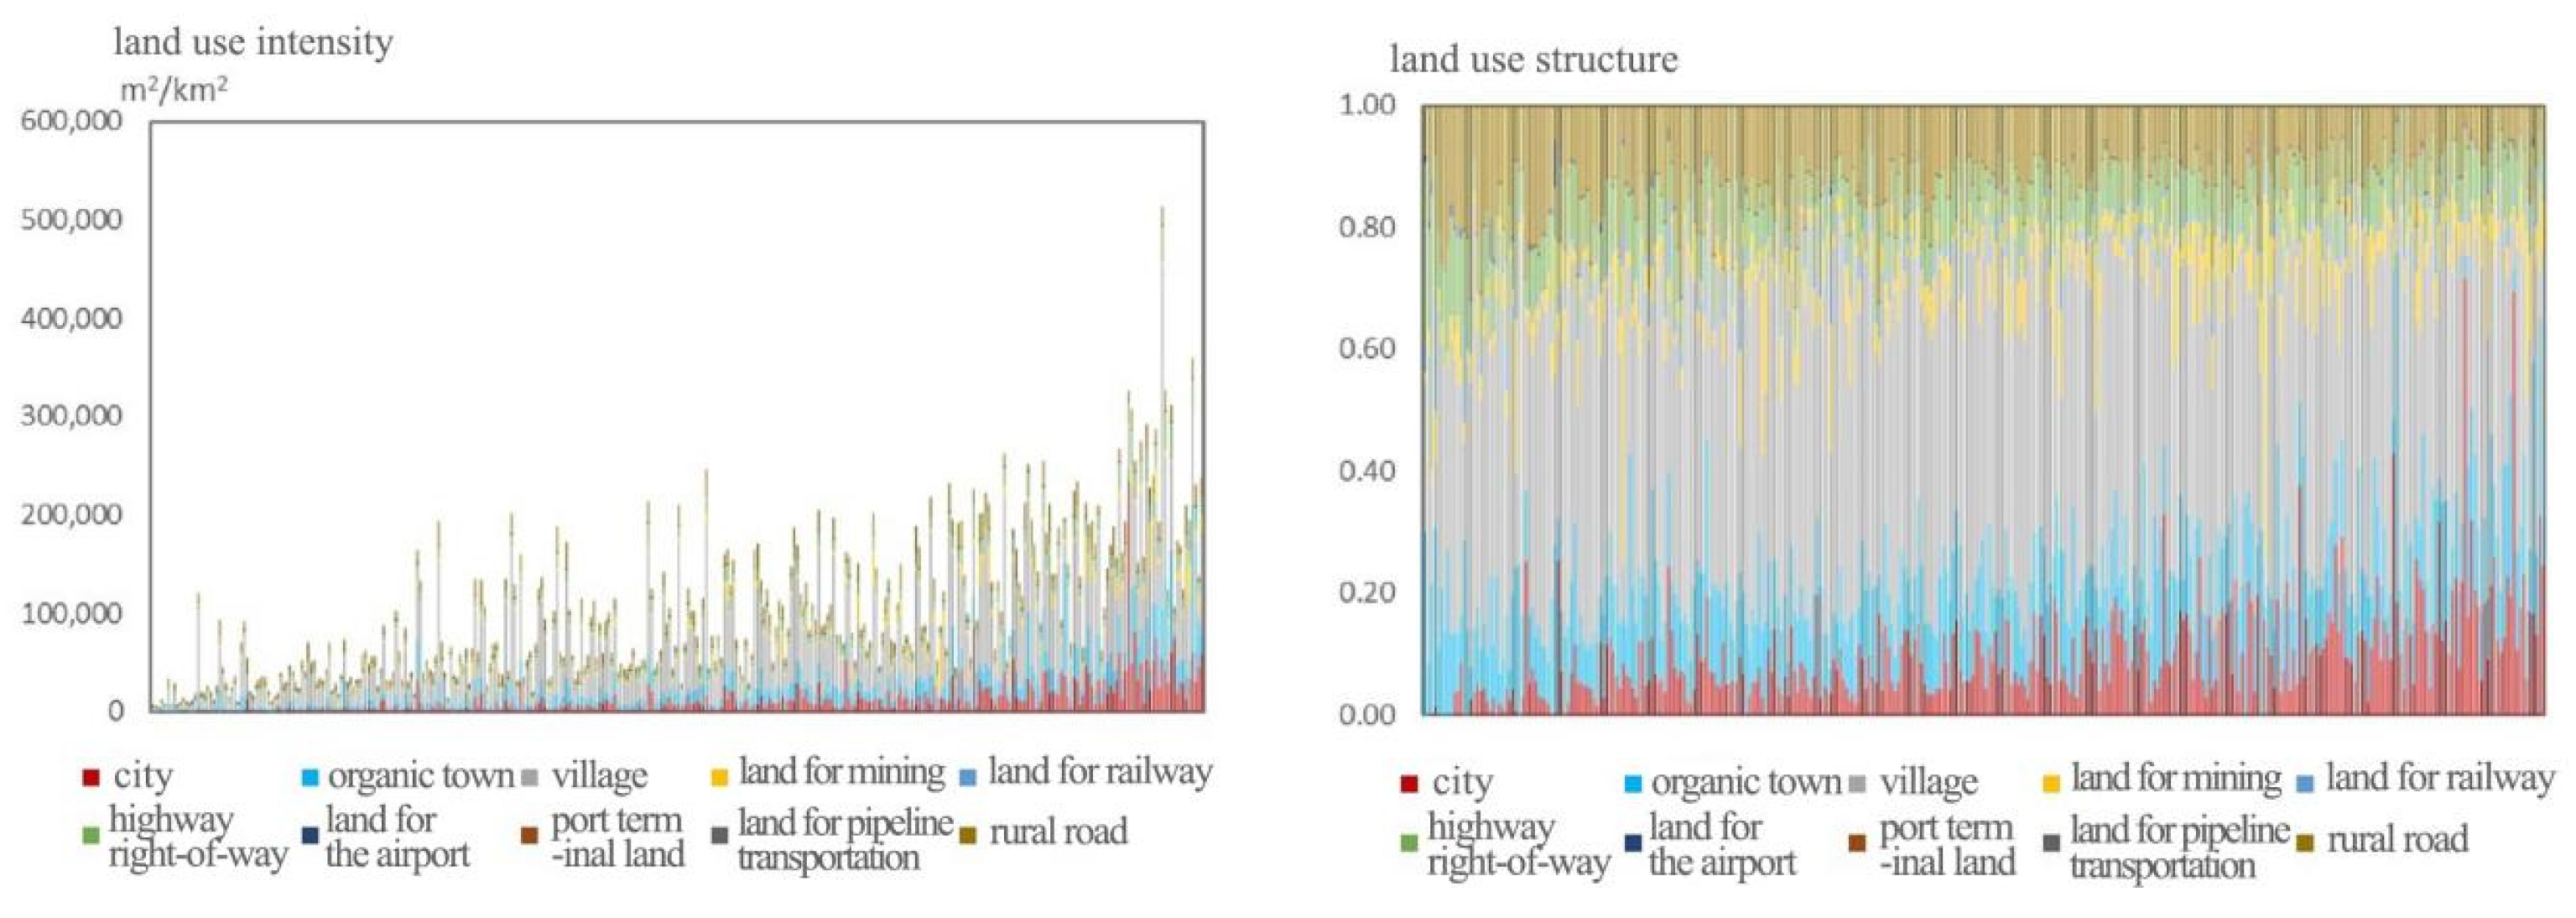
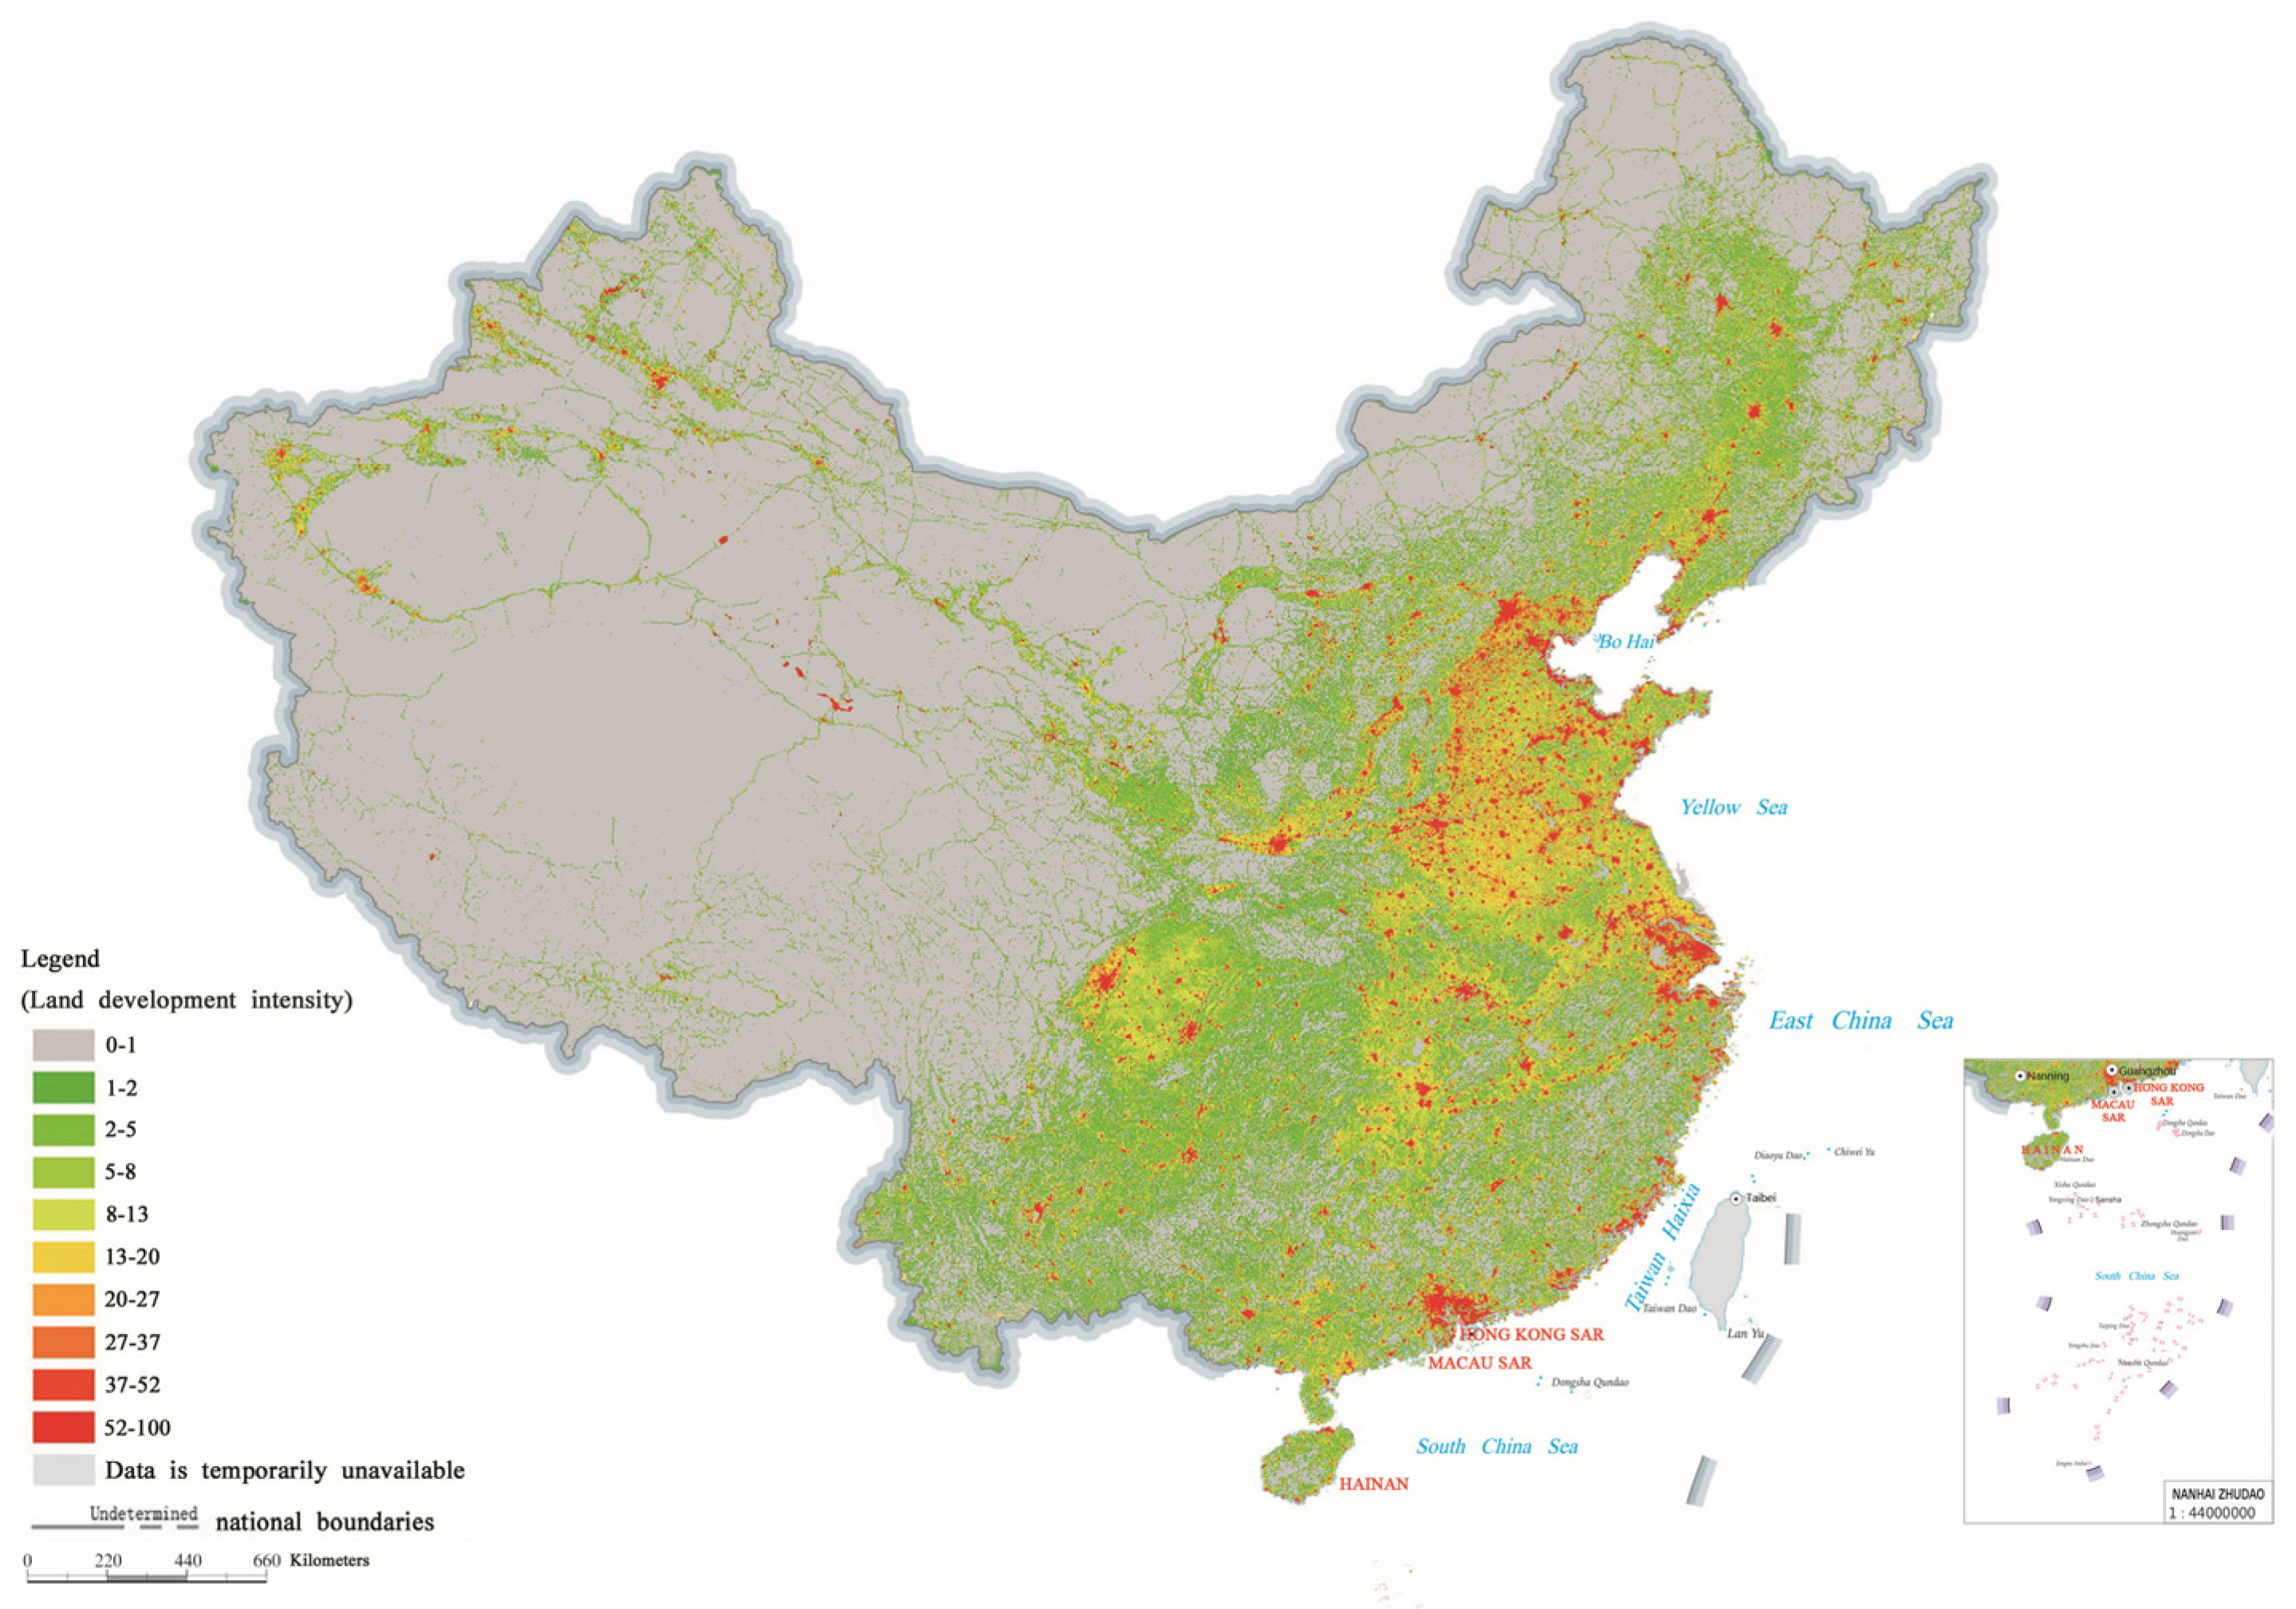
3.1. National Level Construction and Land Use and Emission Characteristics
3.1.1. National Level
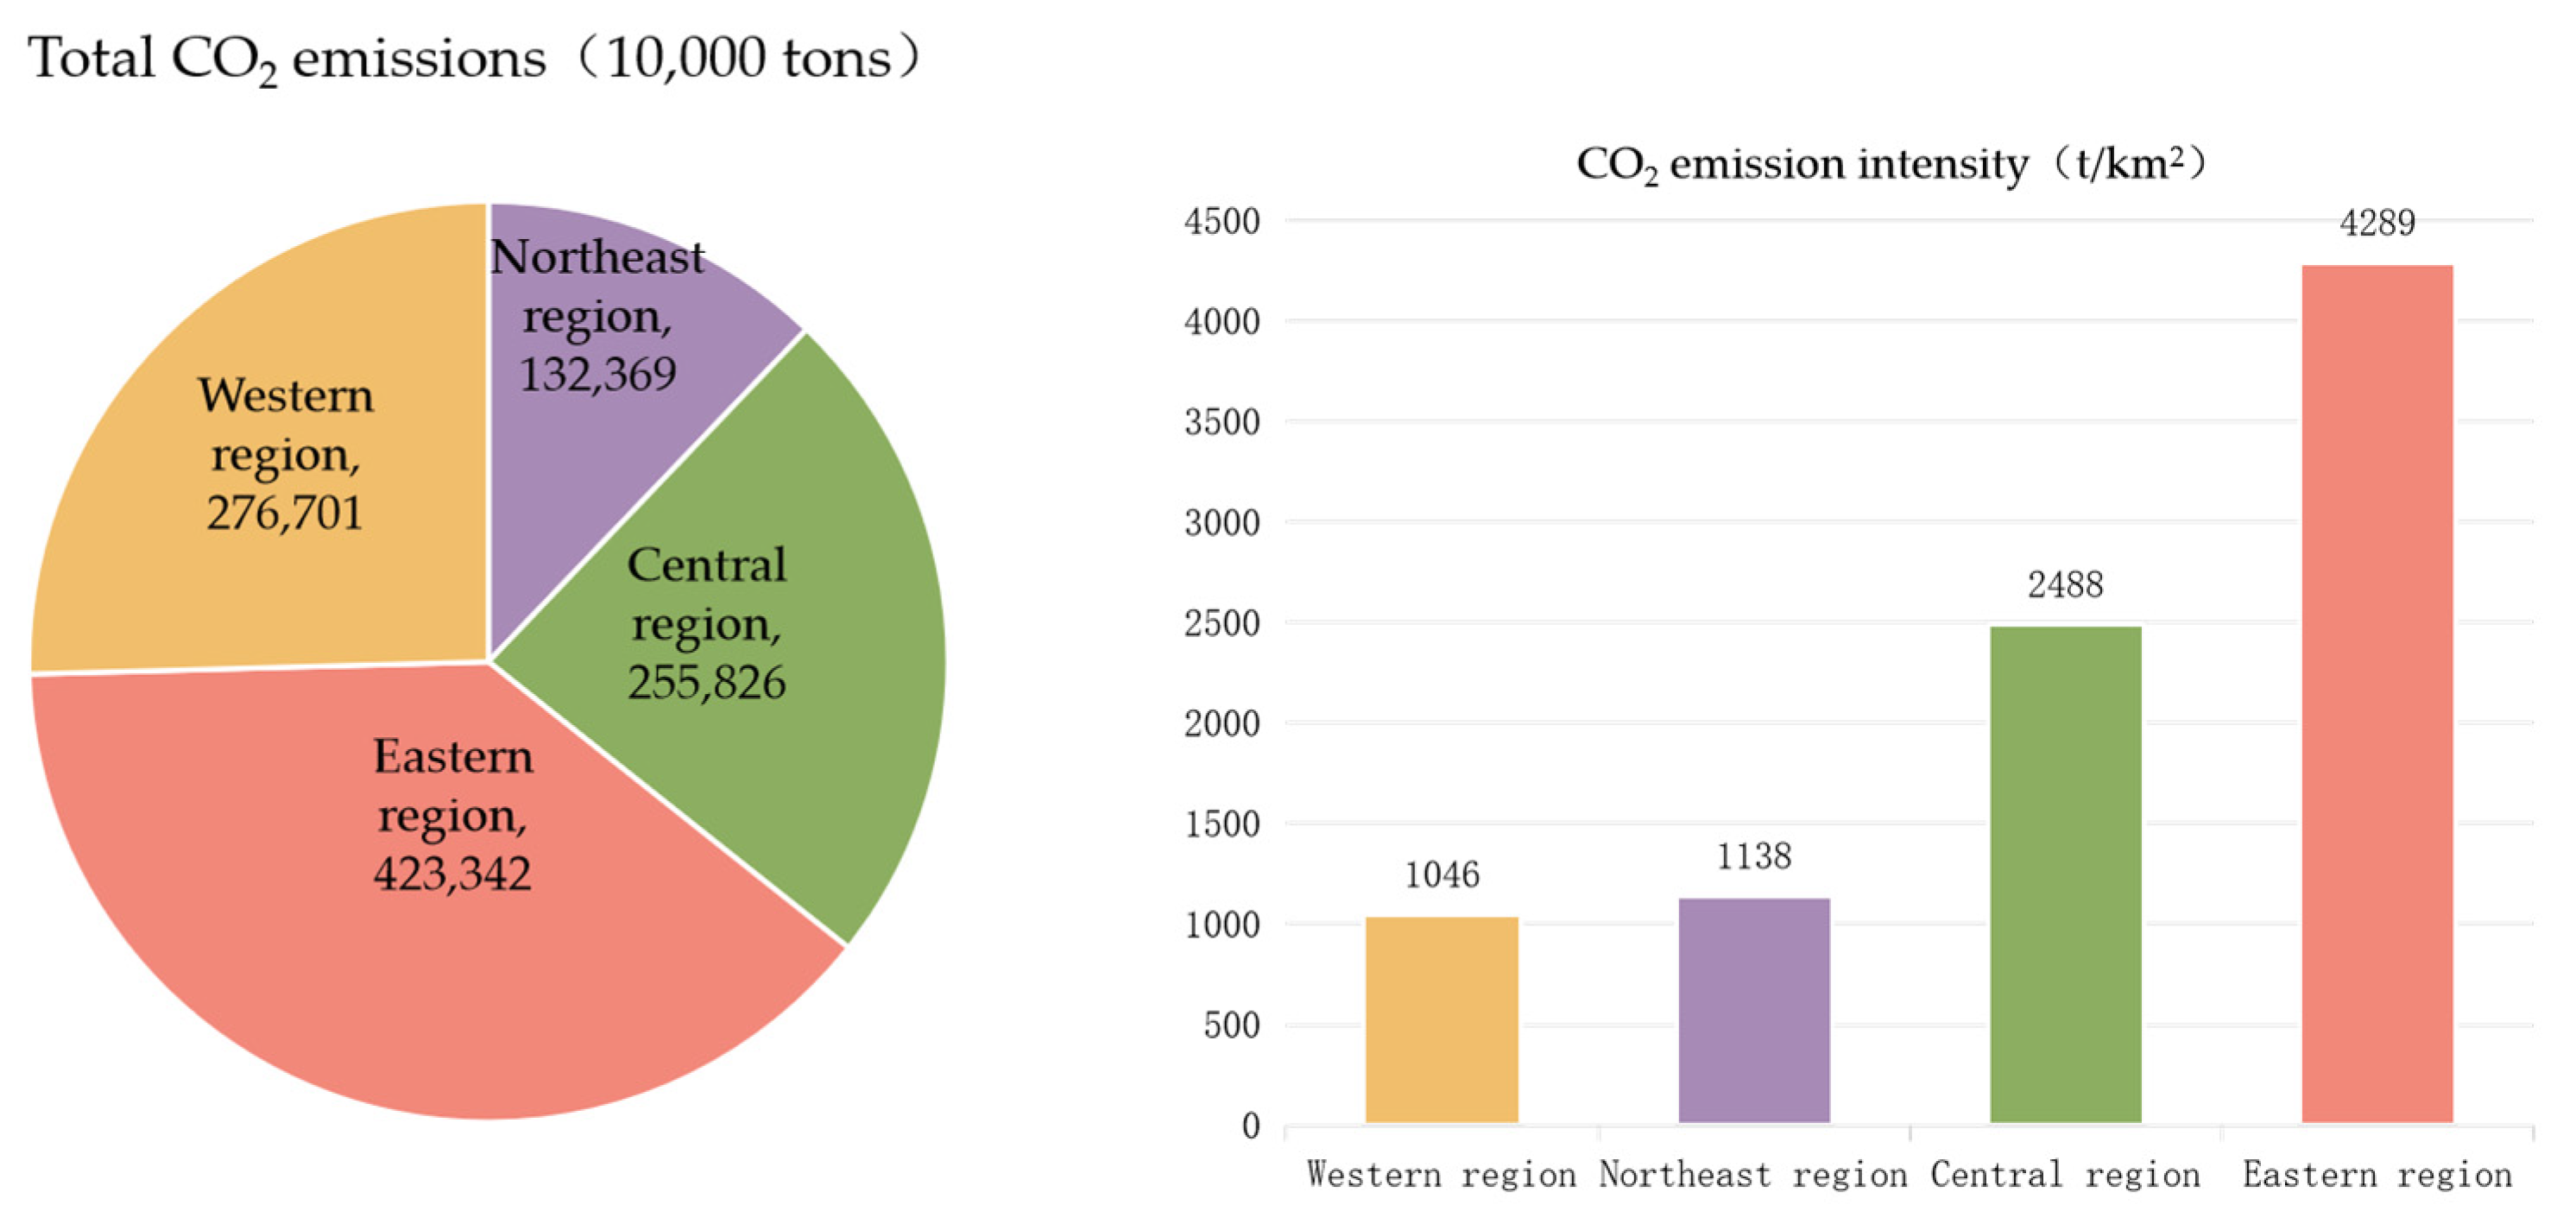
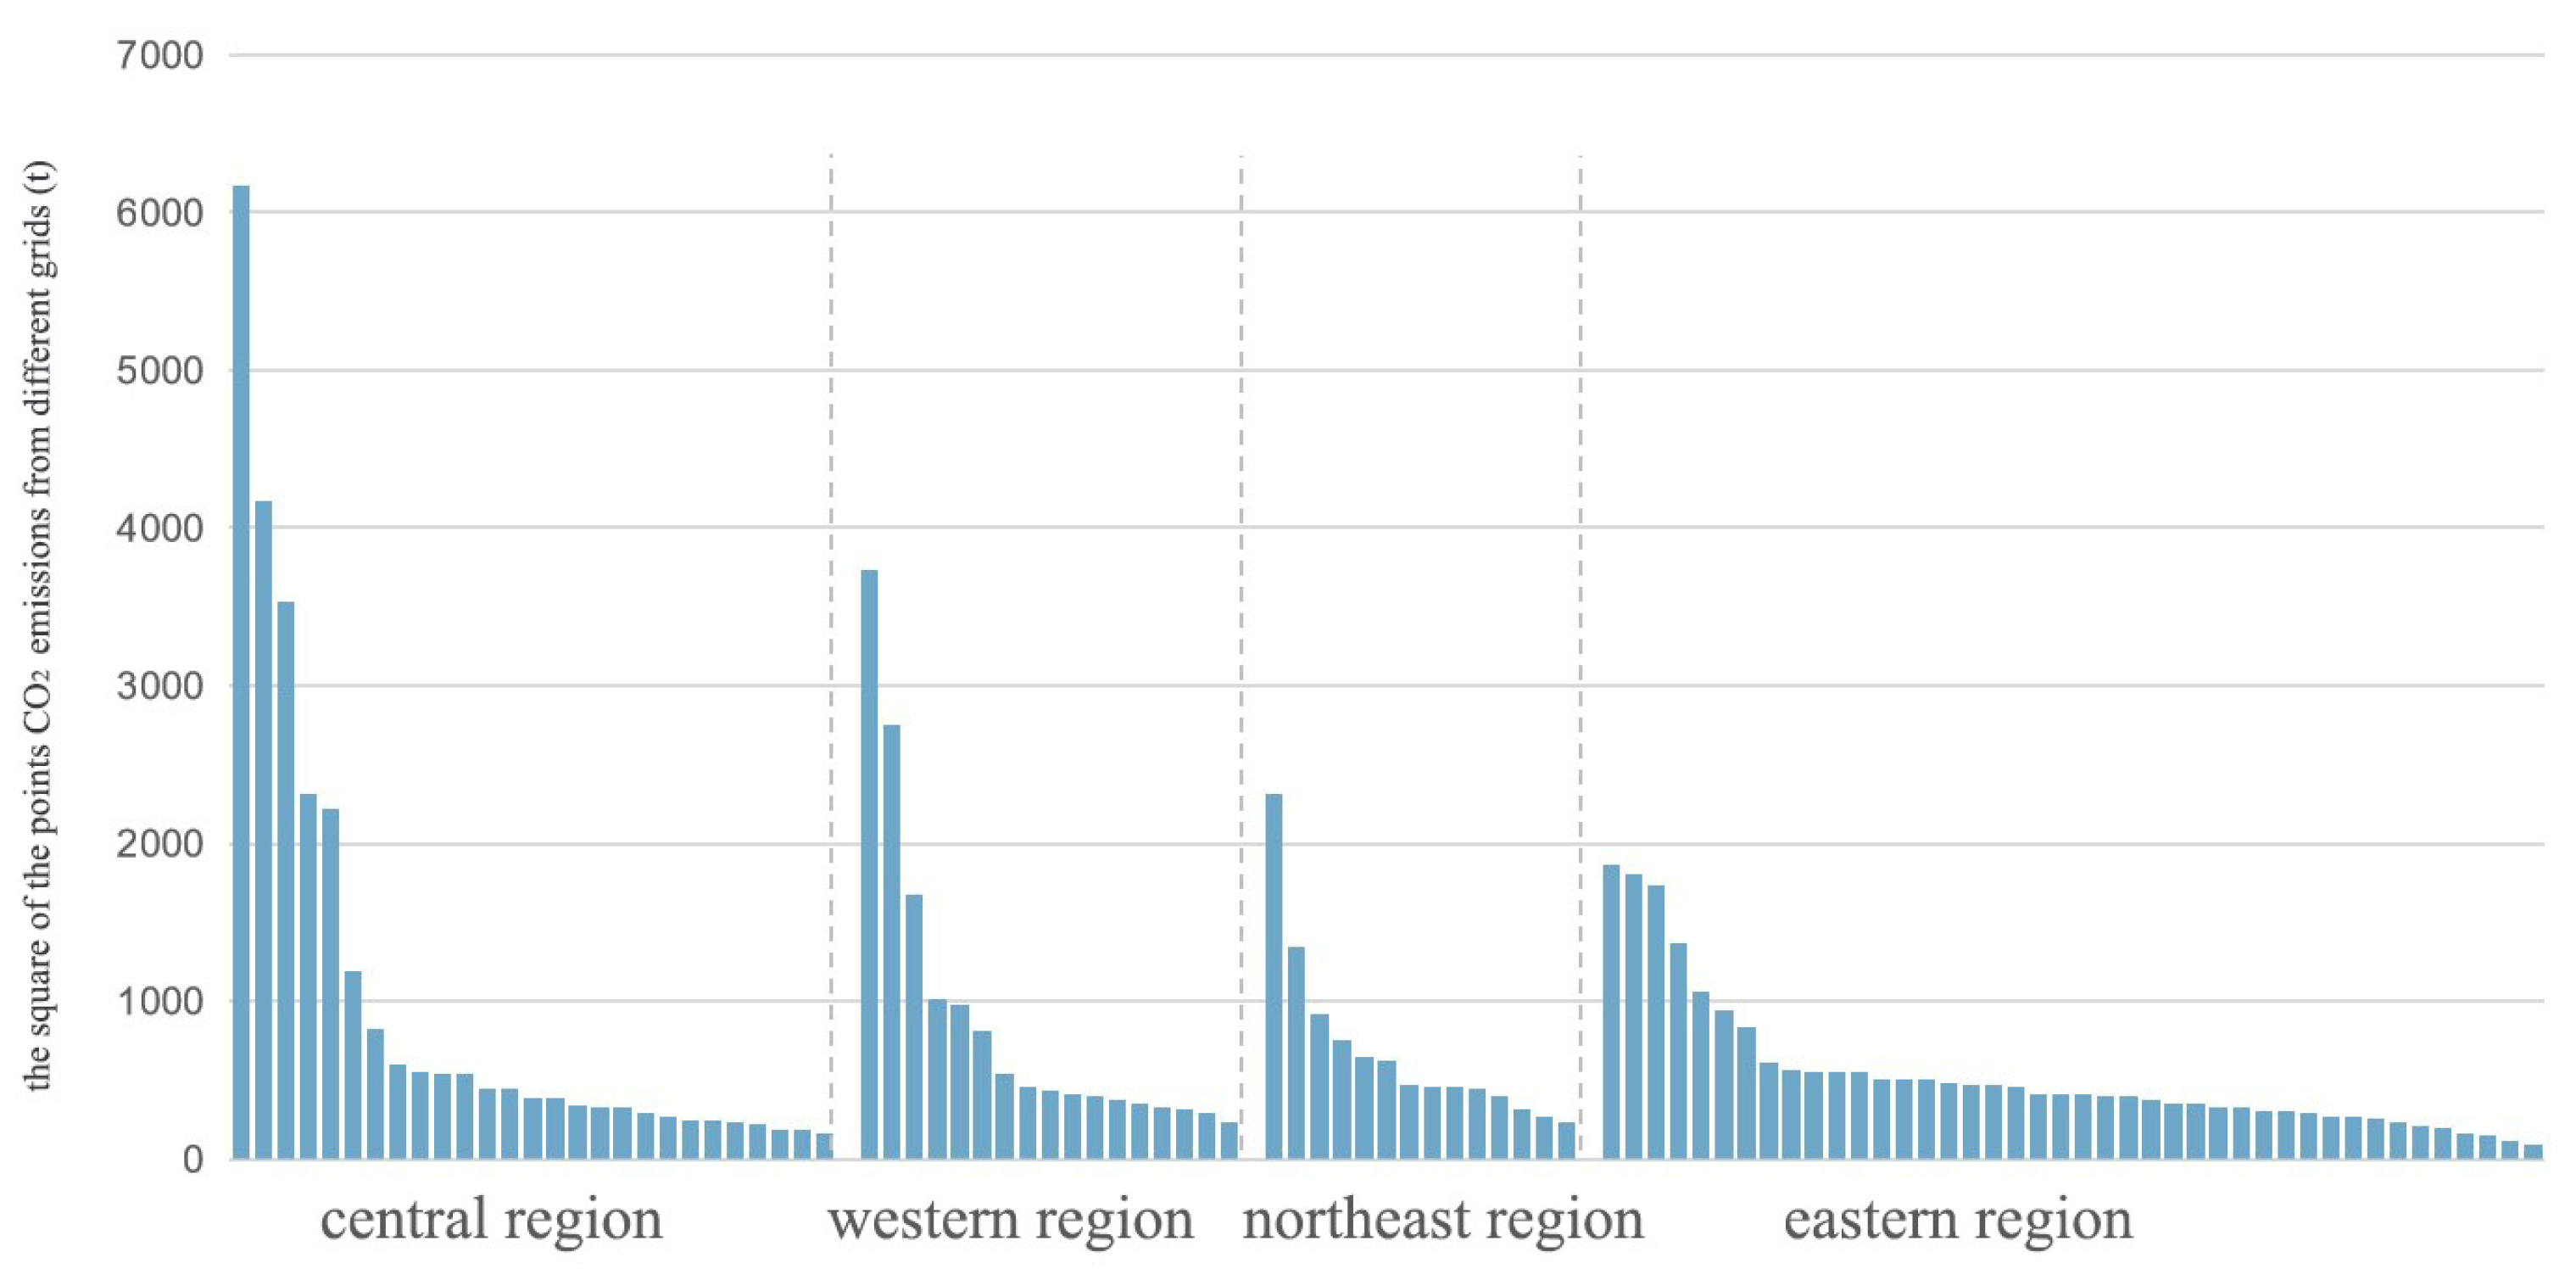
3.1.2. Partition Level
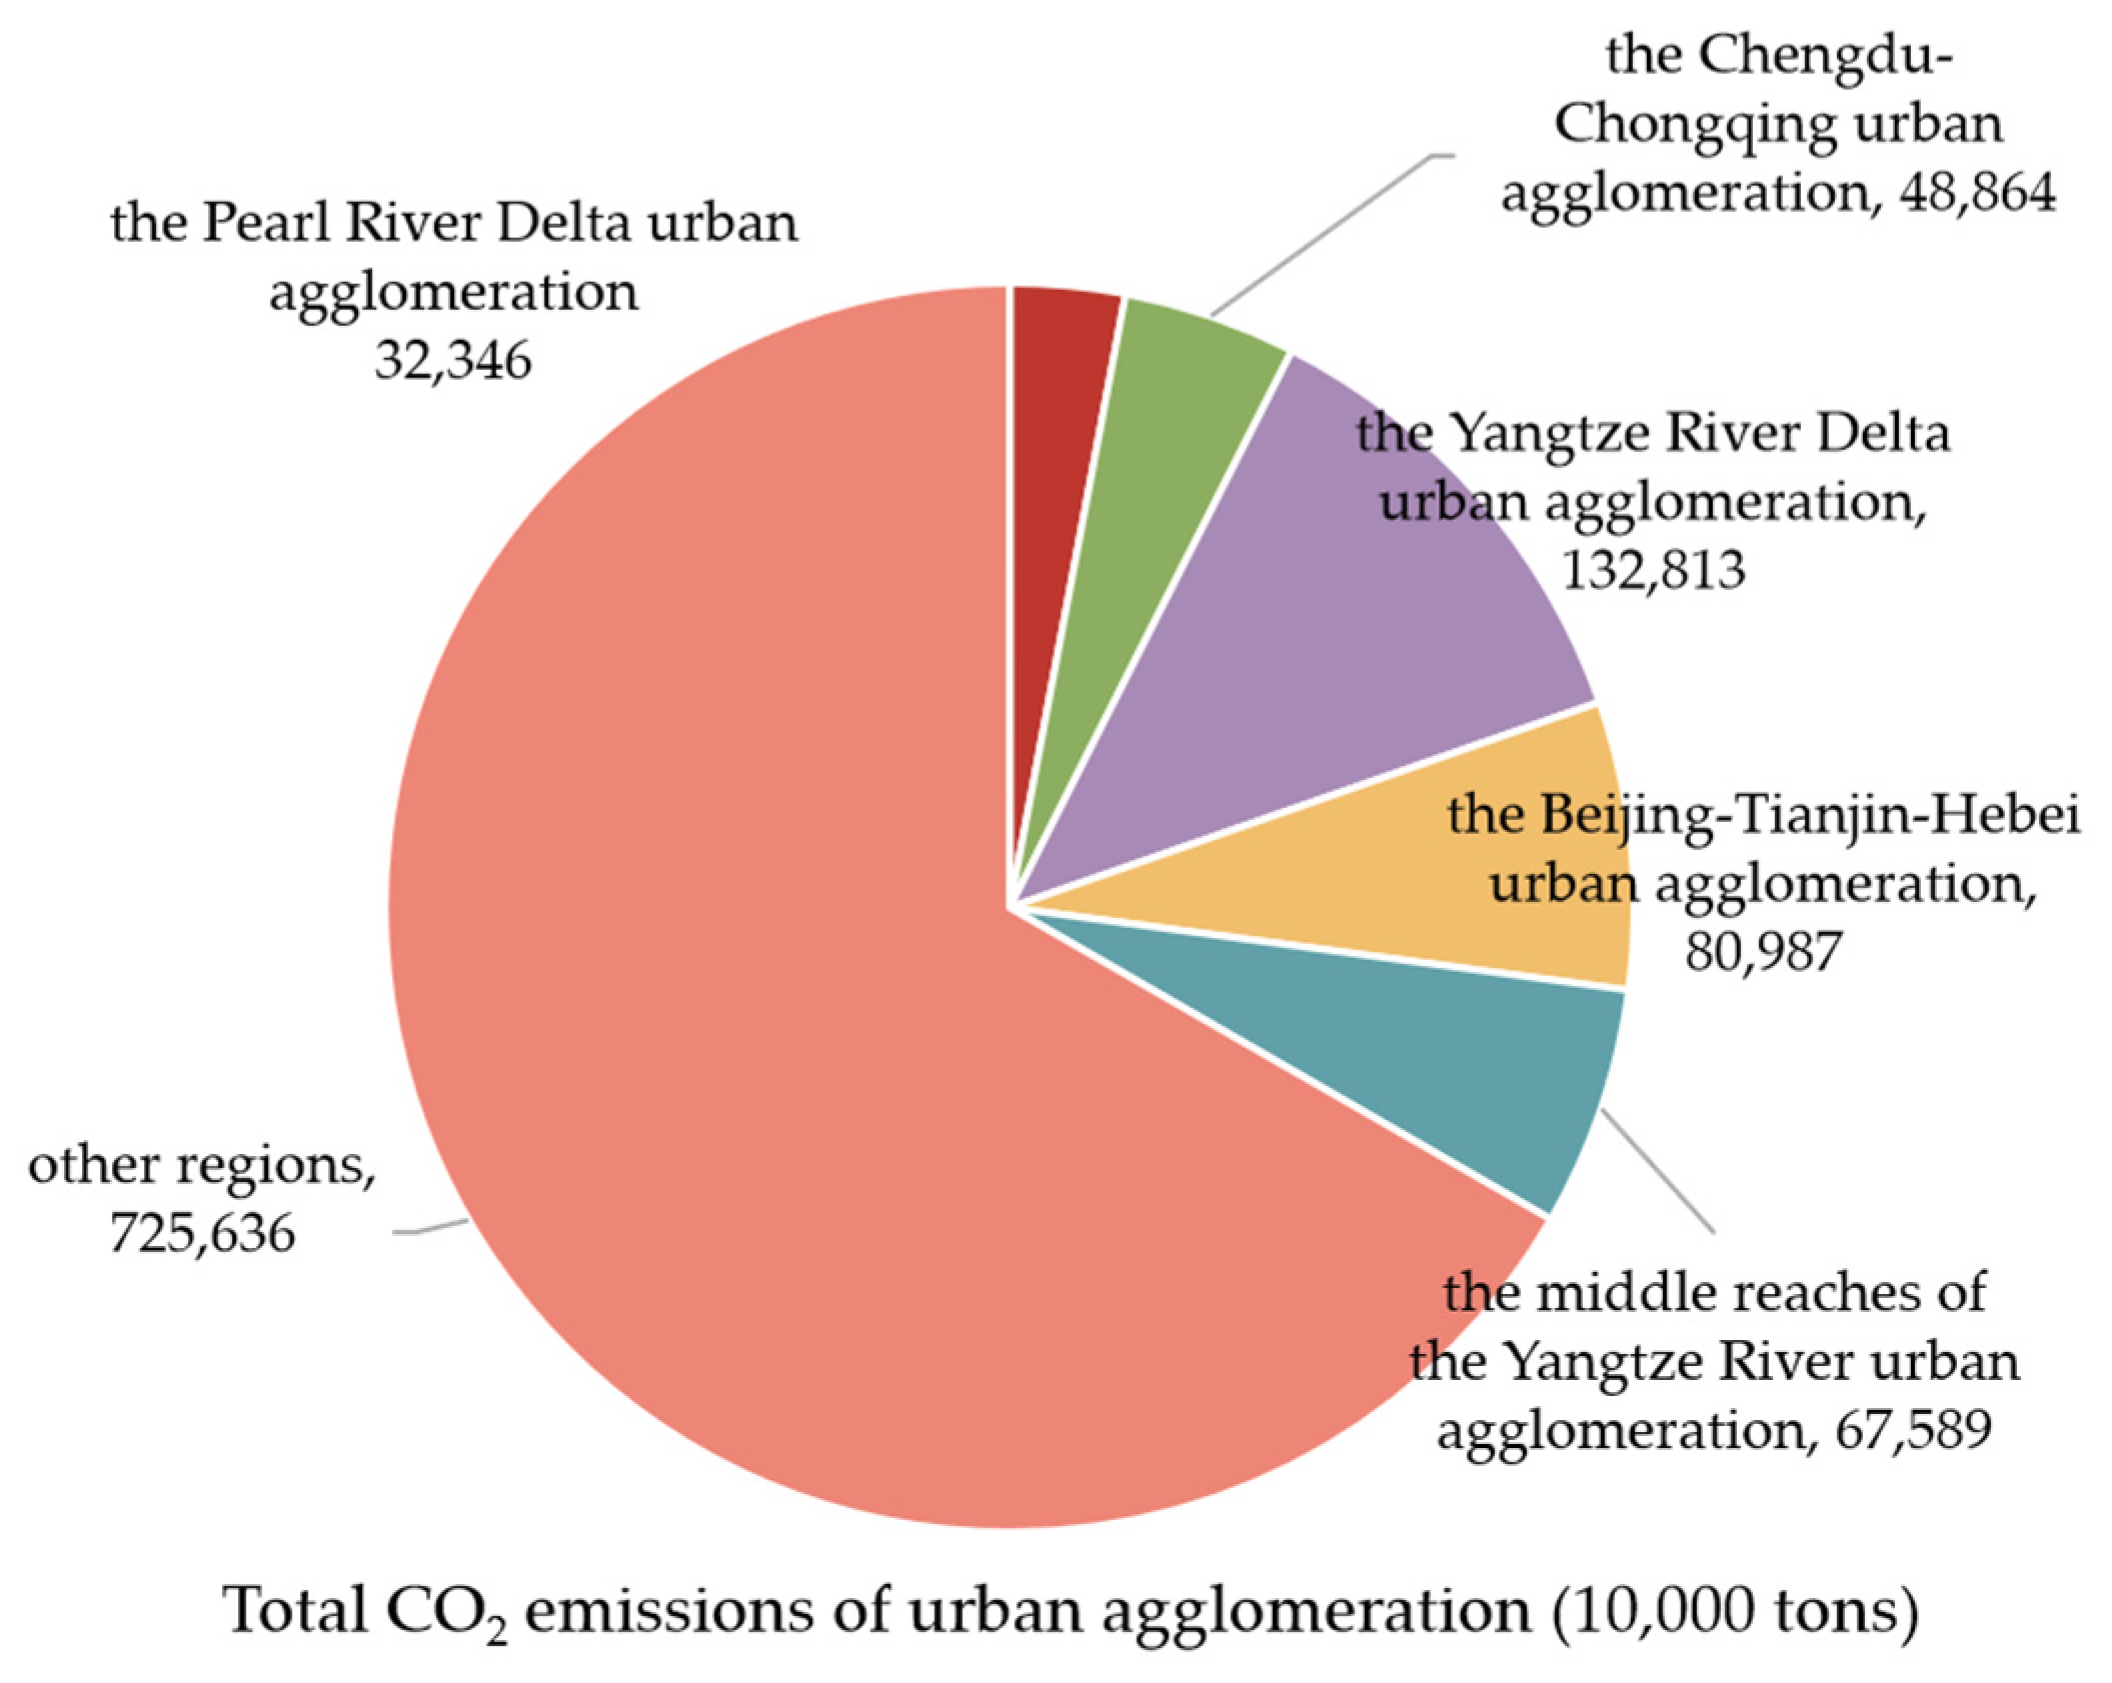
3.1.3. Urban Agglomeration Level
3.1.4. City Level
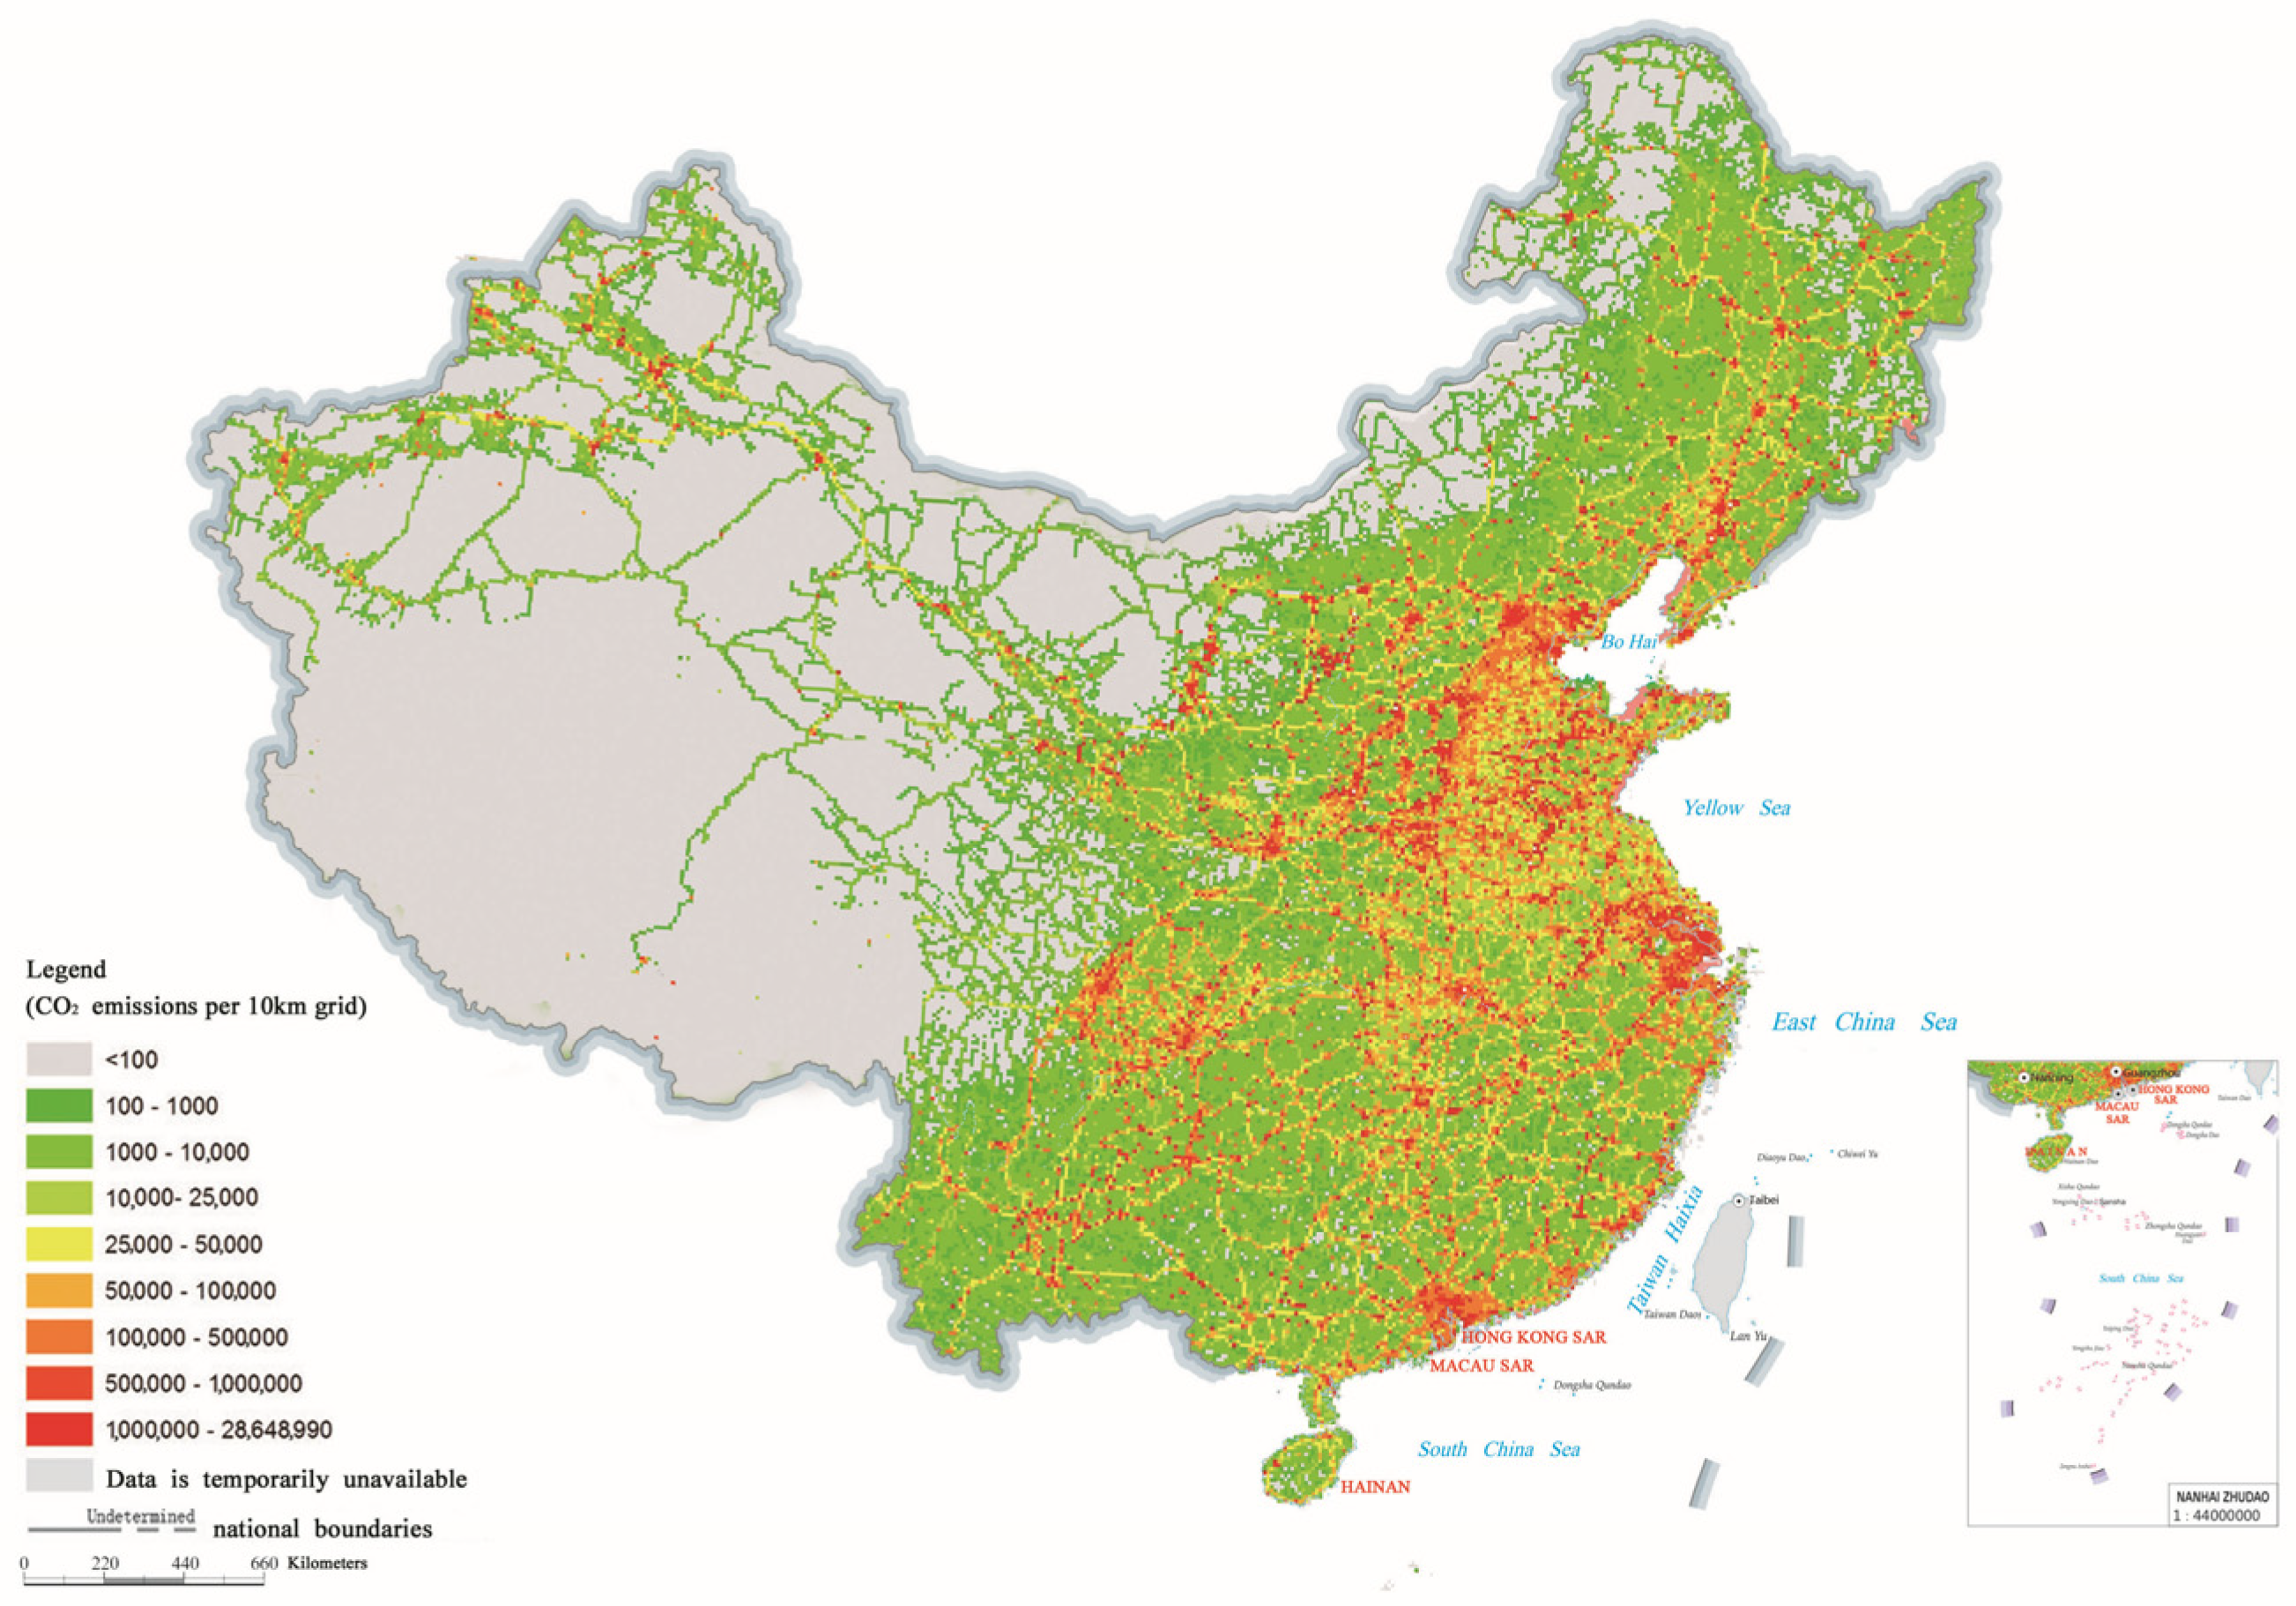
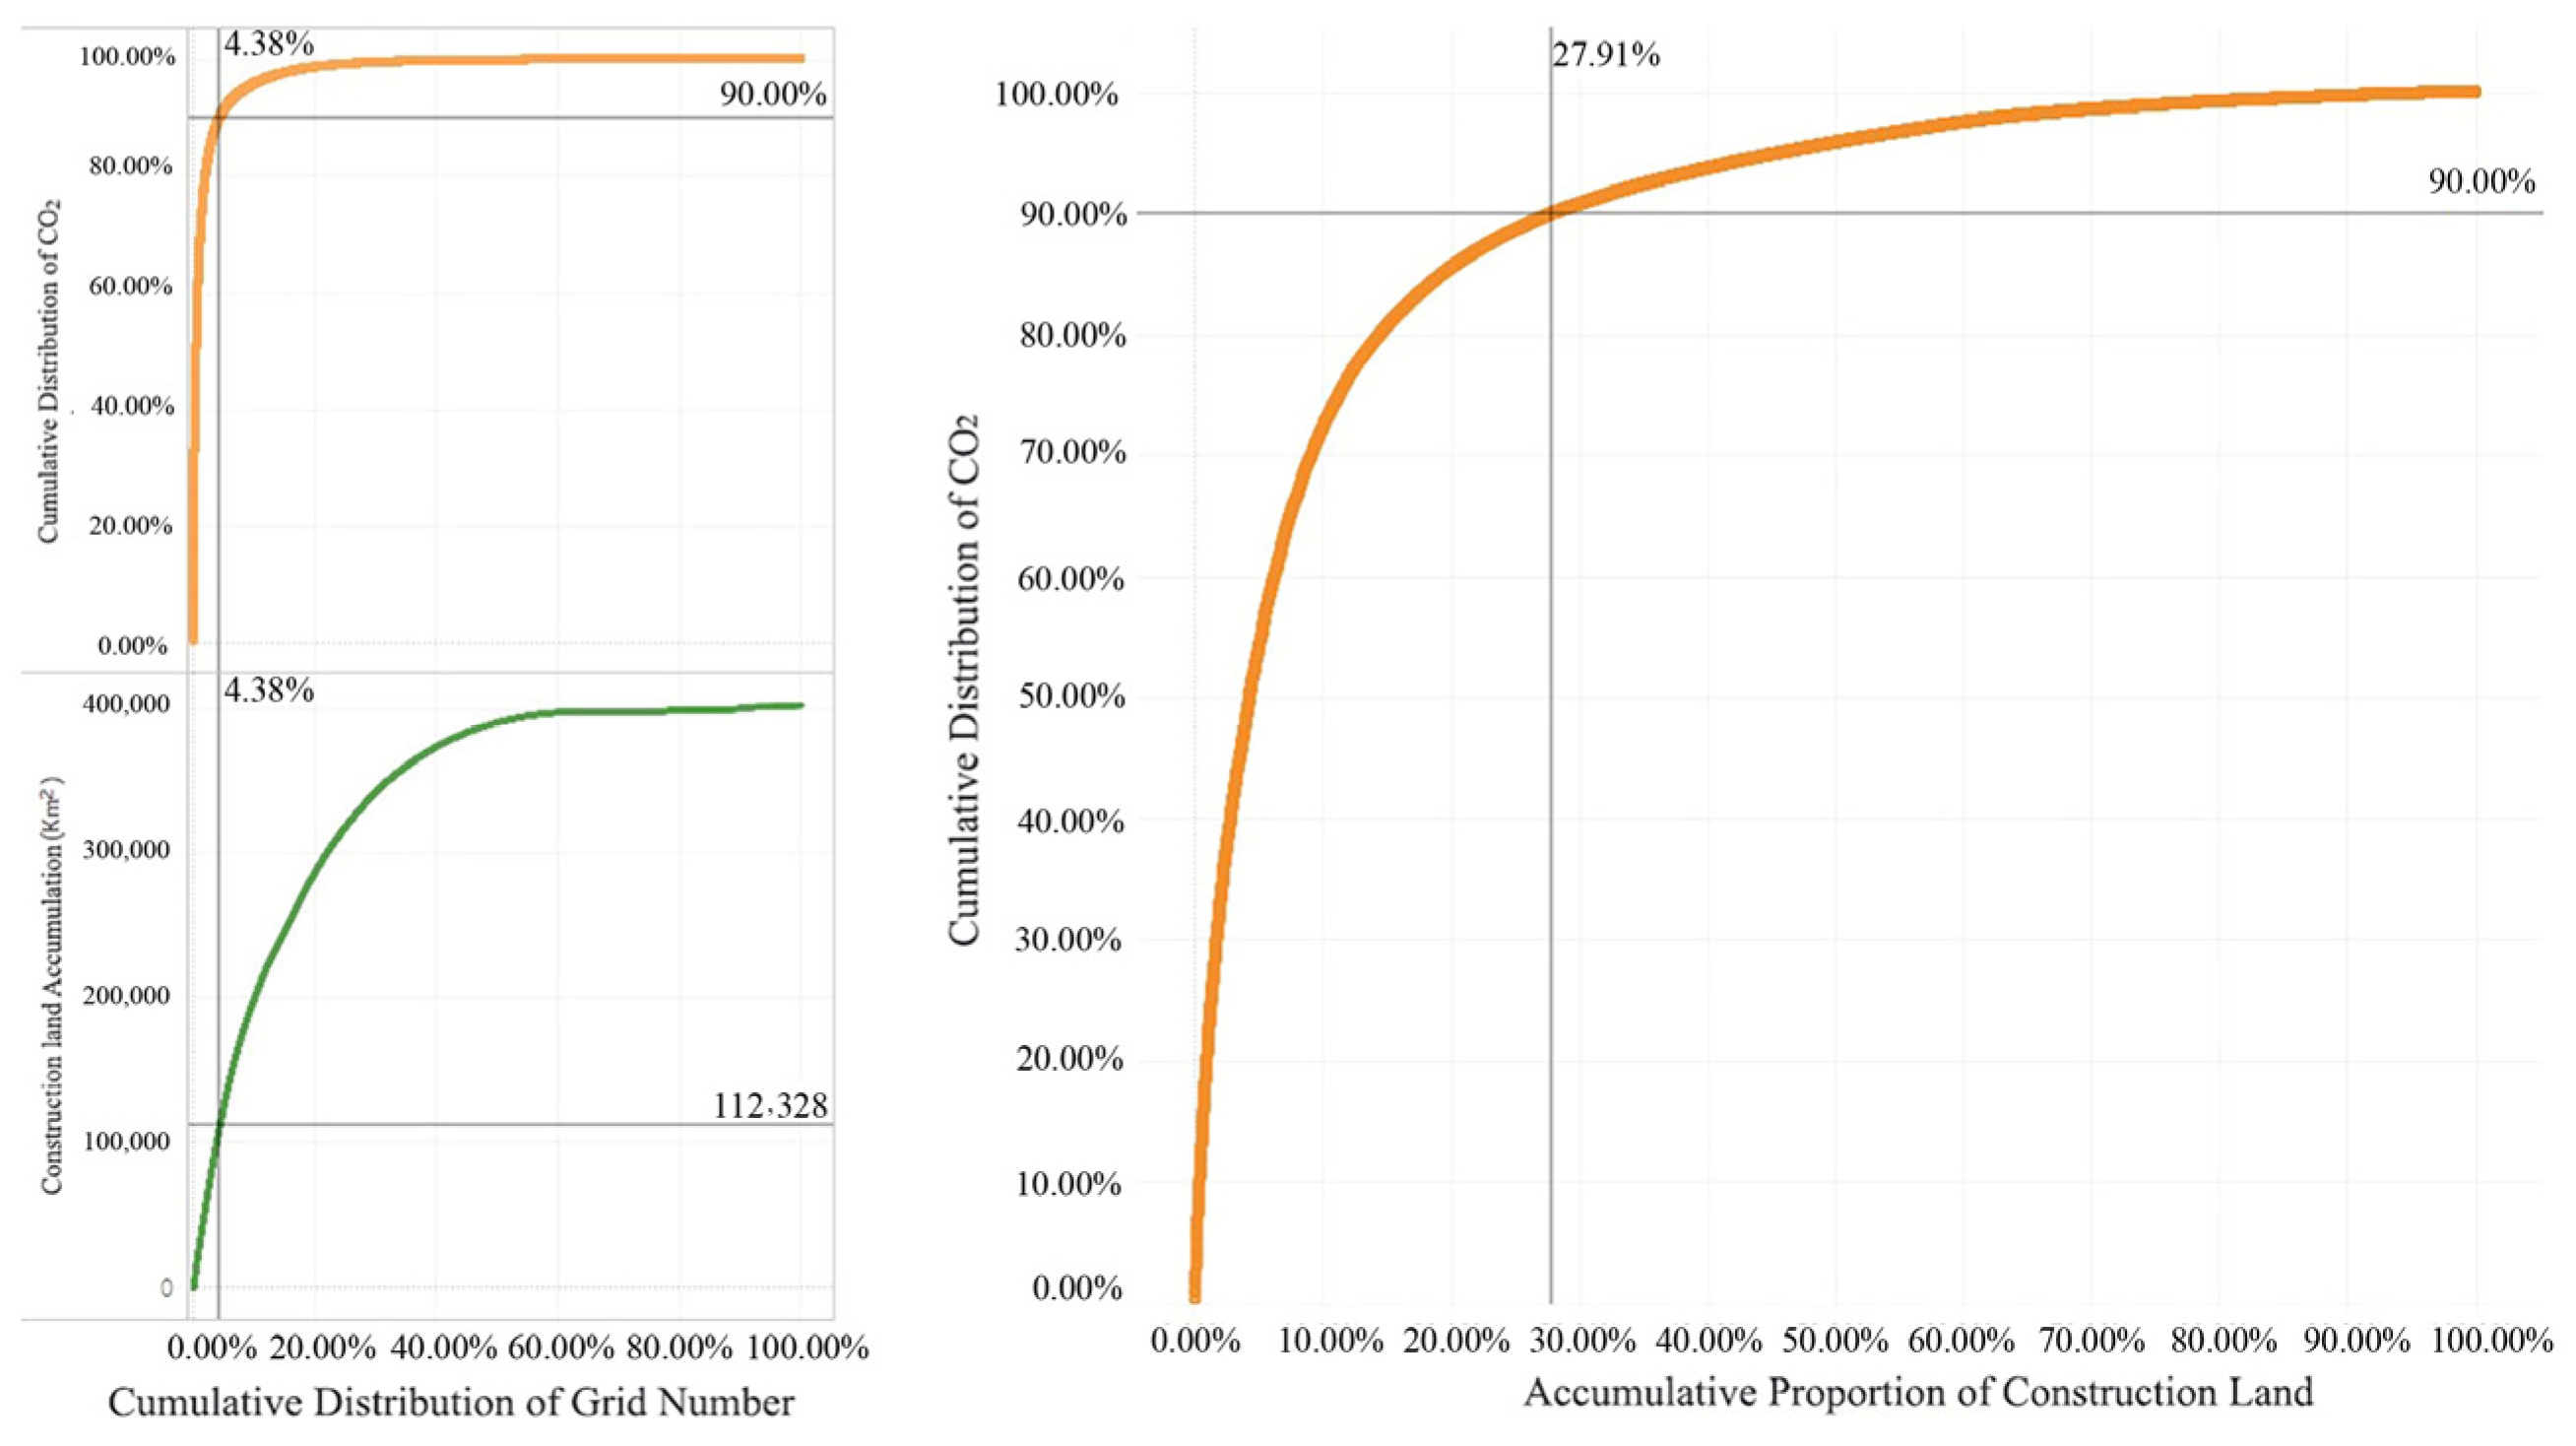
3.1.5. Grid Level
3.2. Coupling Analysis of “Land Use-Carbon Emission”
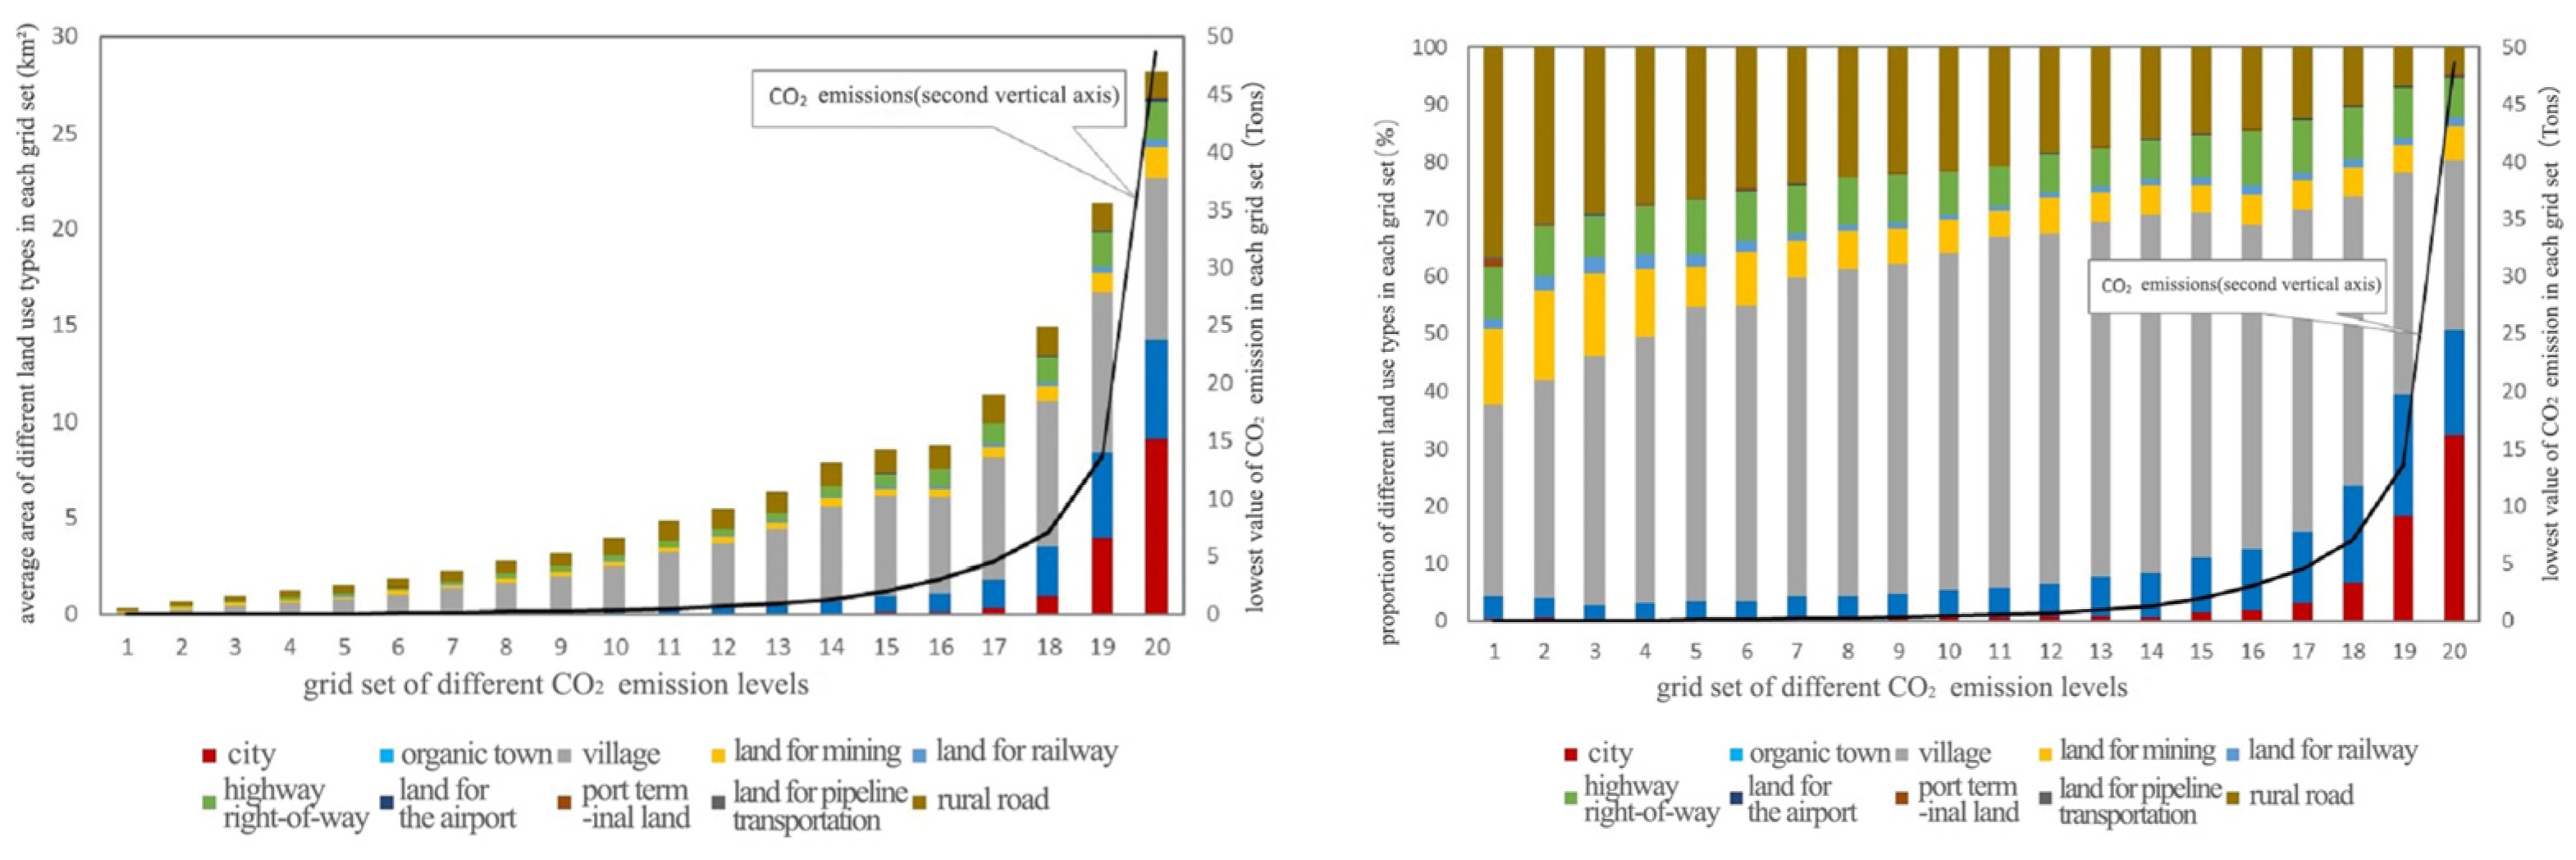
3.2.1. The Relationship between the Area and Type of Construction Land and CO2 Emissions
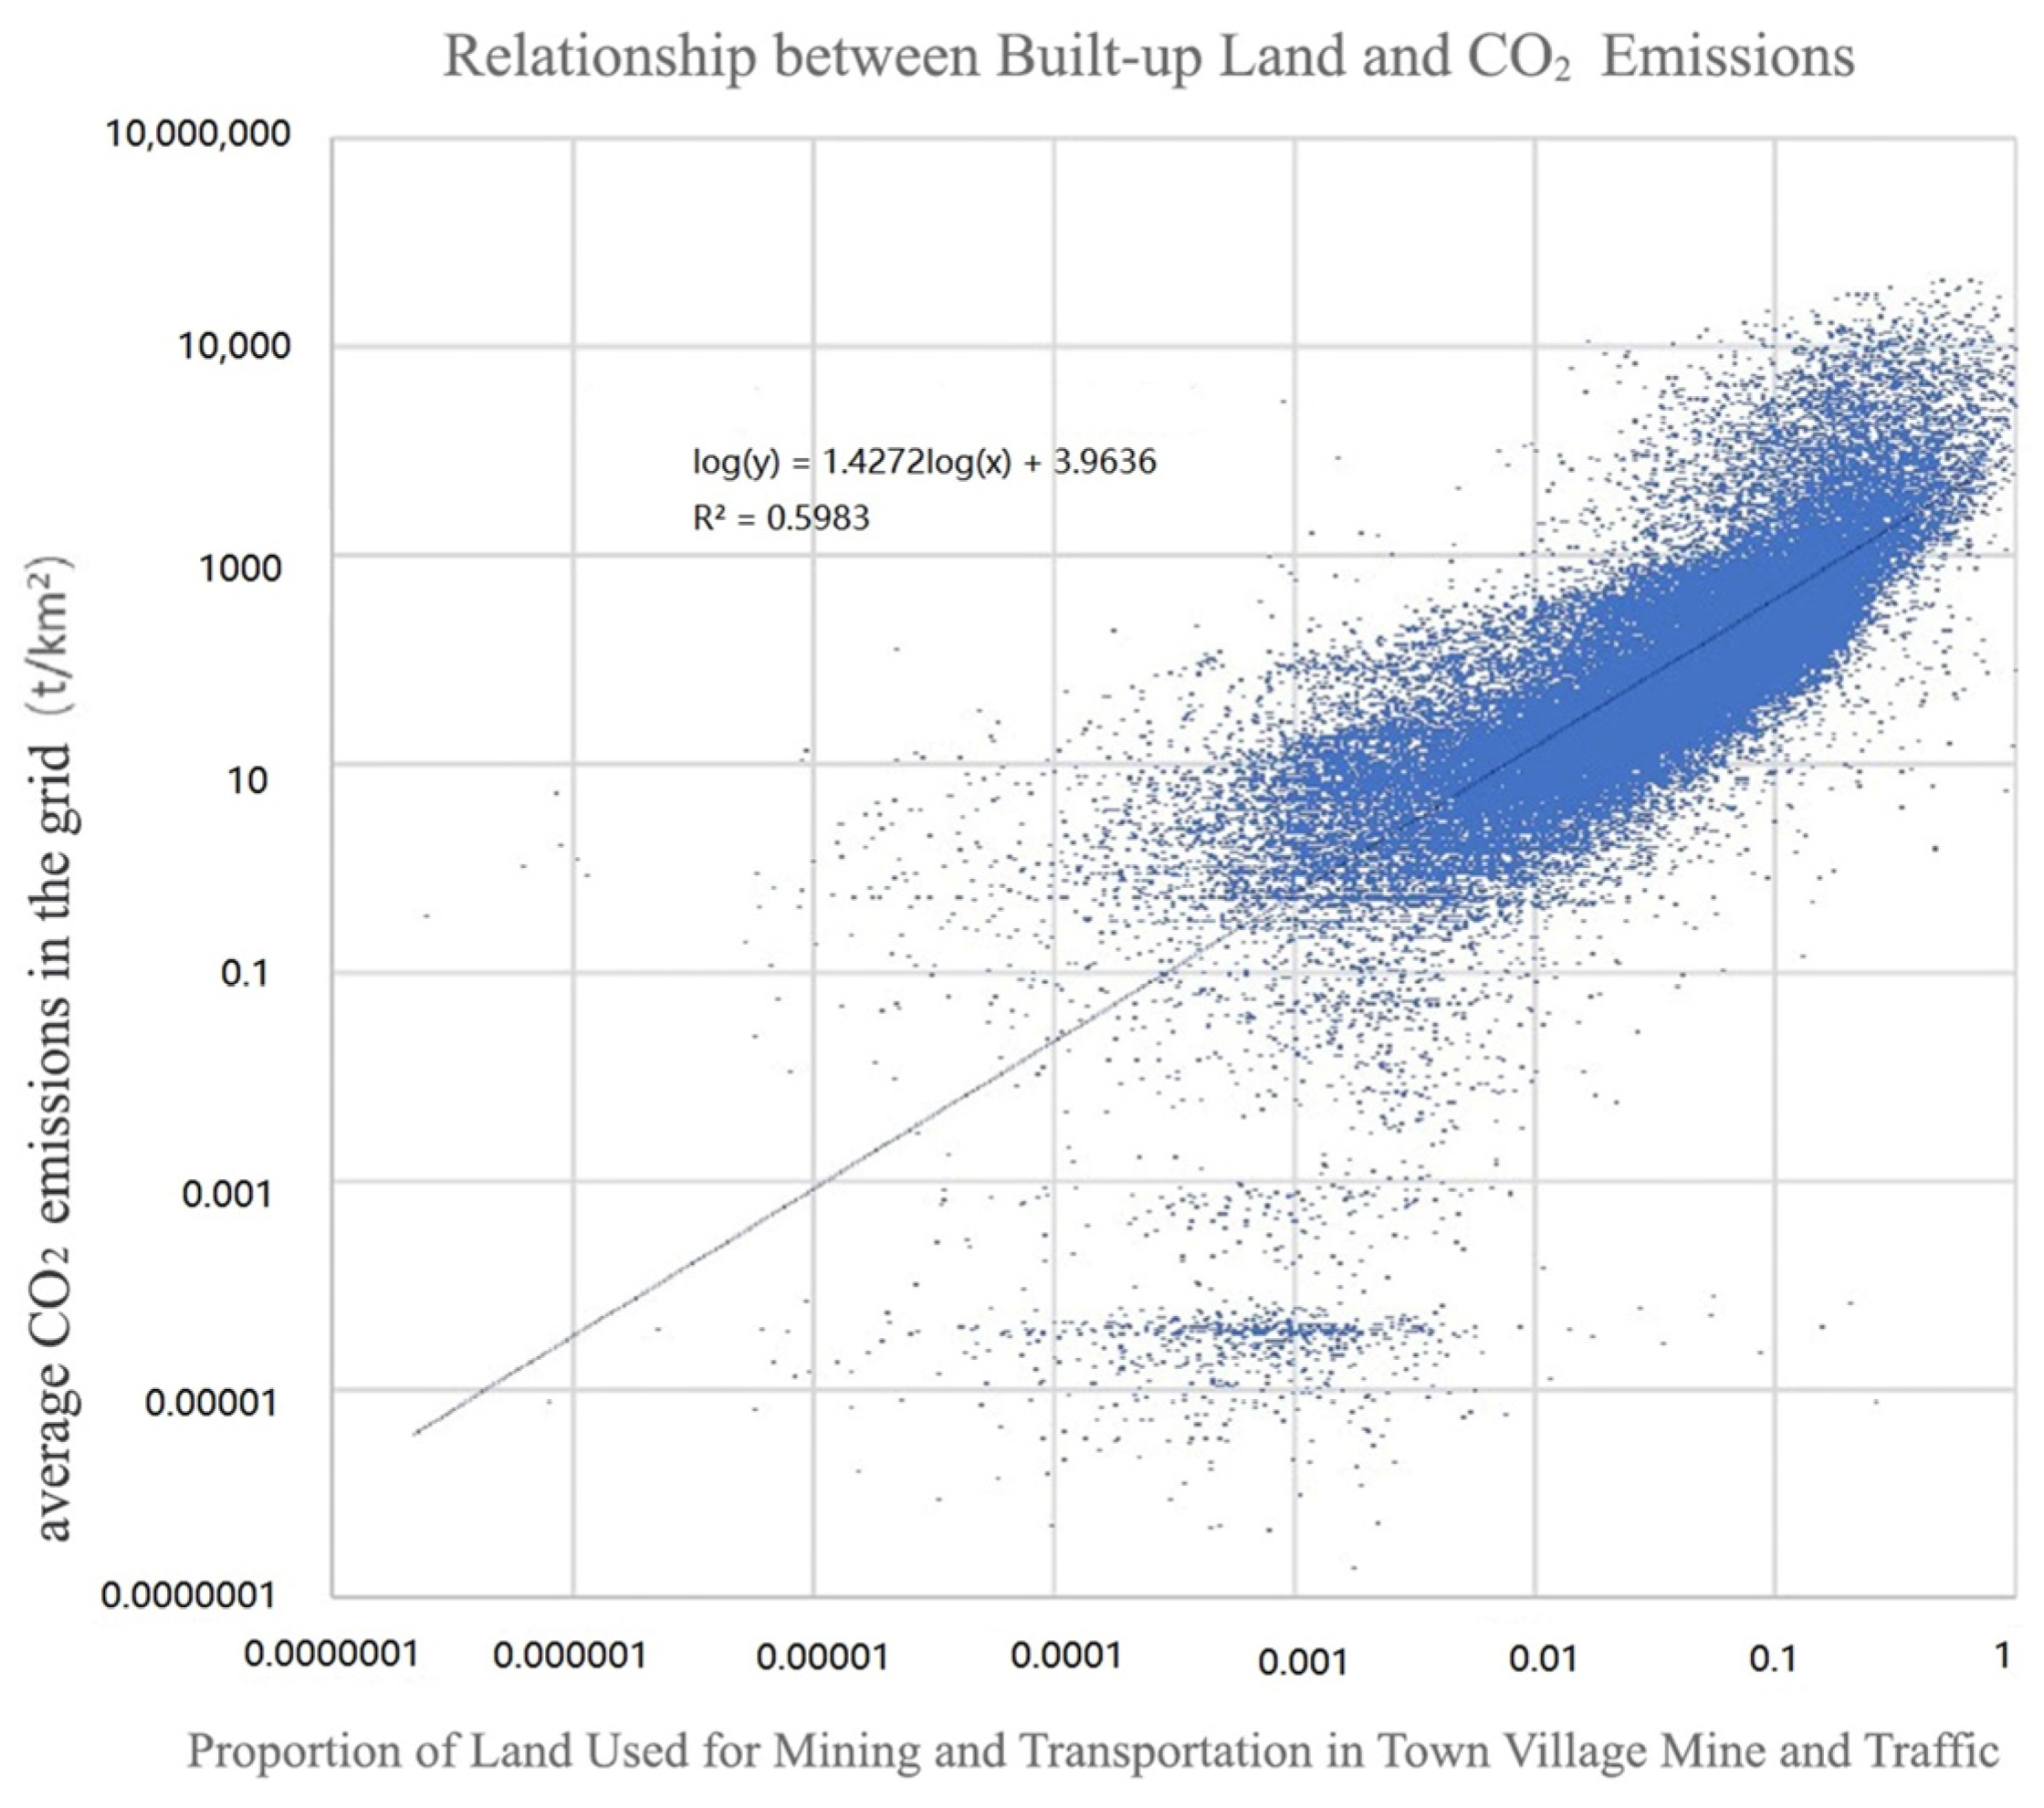
3.2.2. Double Logarithmic Model of Built-Up Land Area and Carbon Emissions
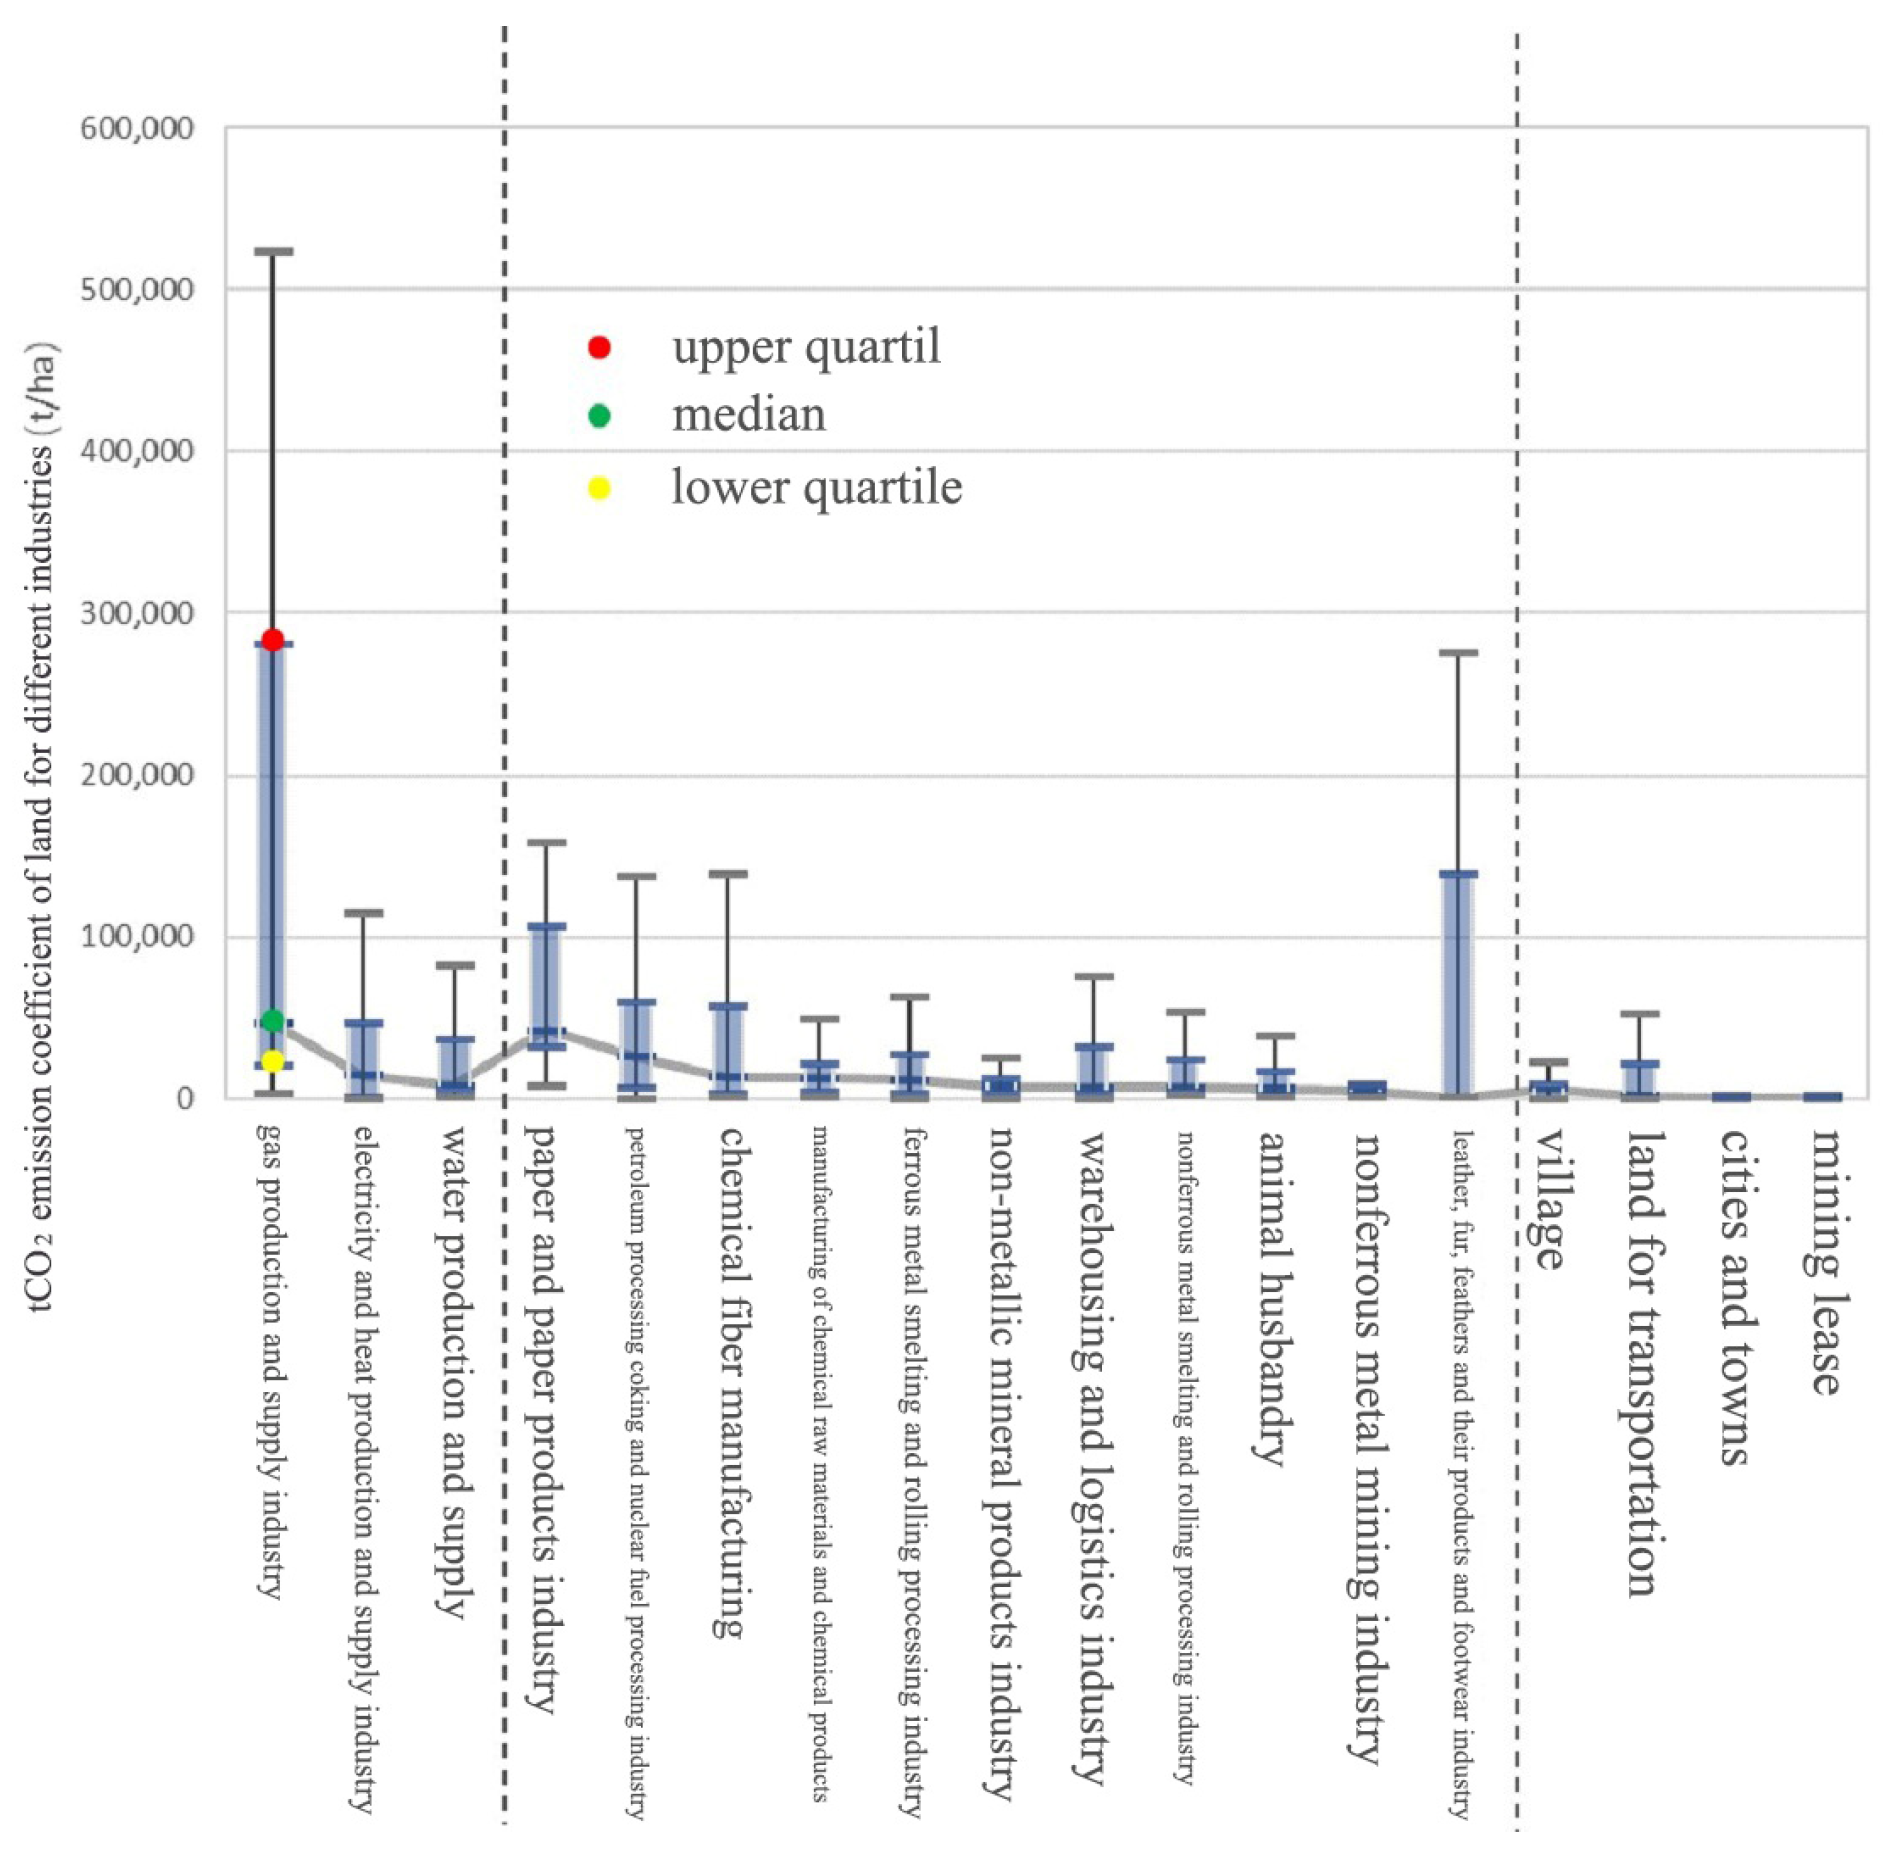
3.2.3. Double Logarithmic Model of Land Area and Carbon Emissions by Sub-Sector
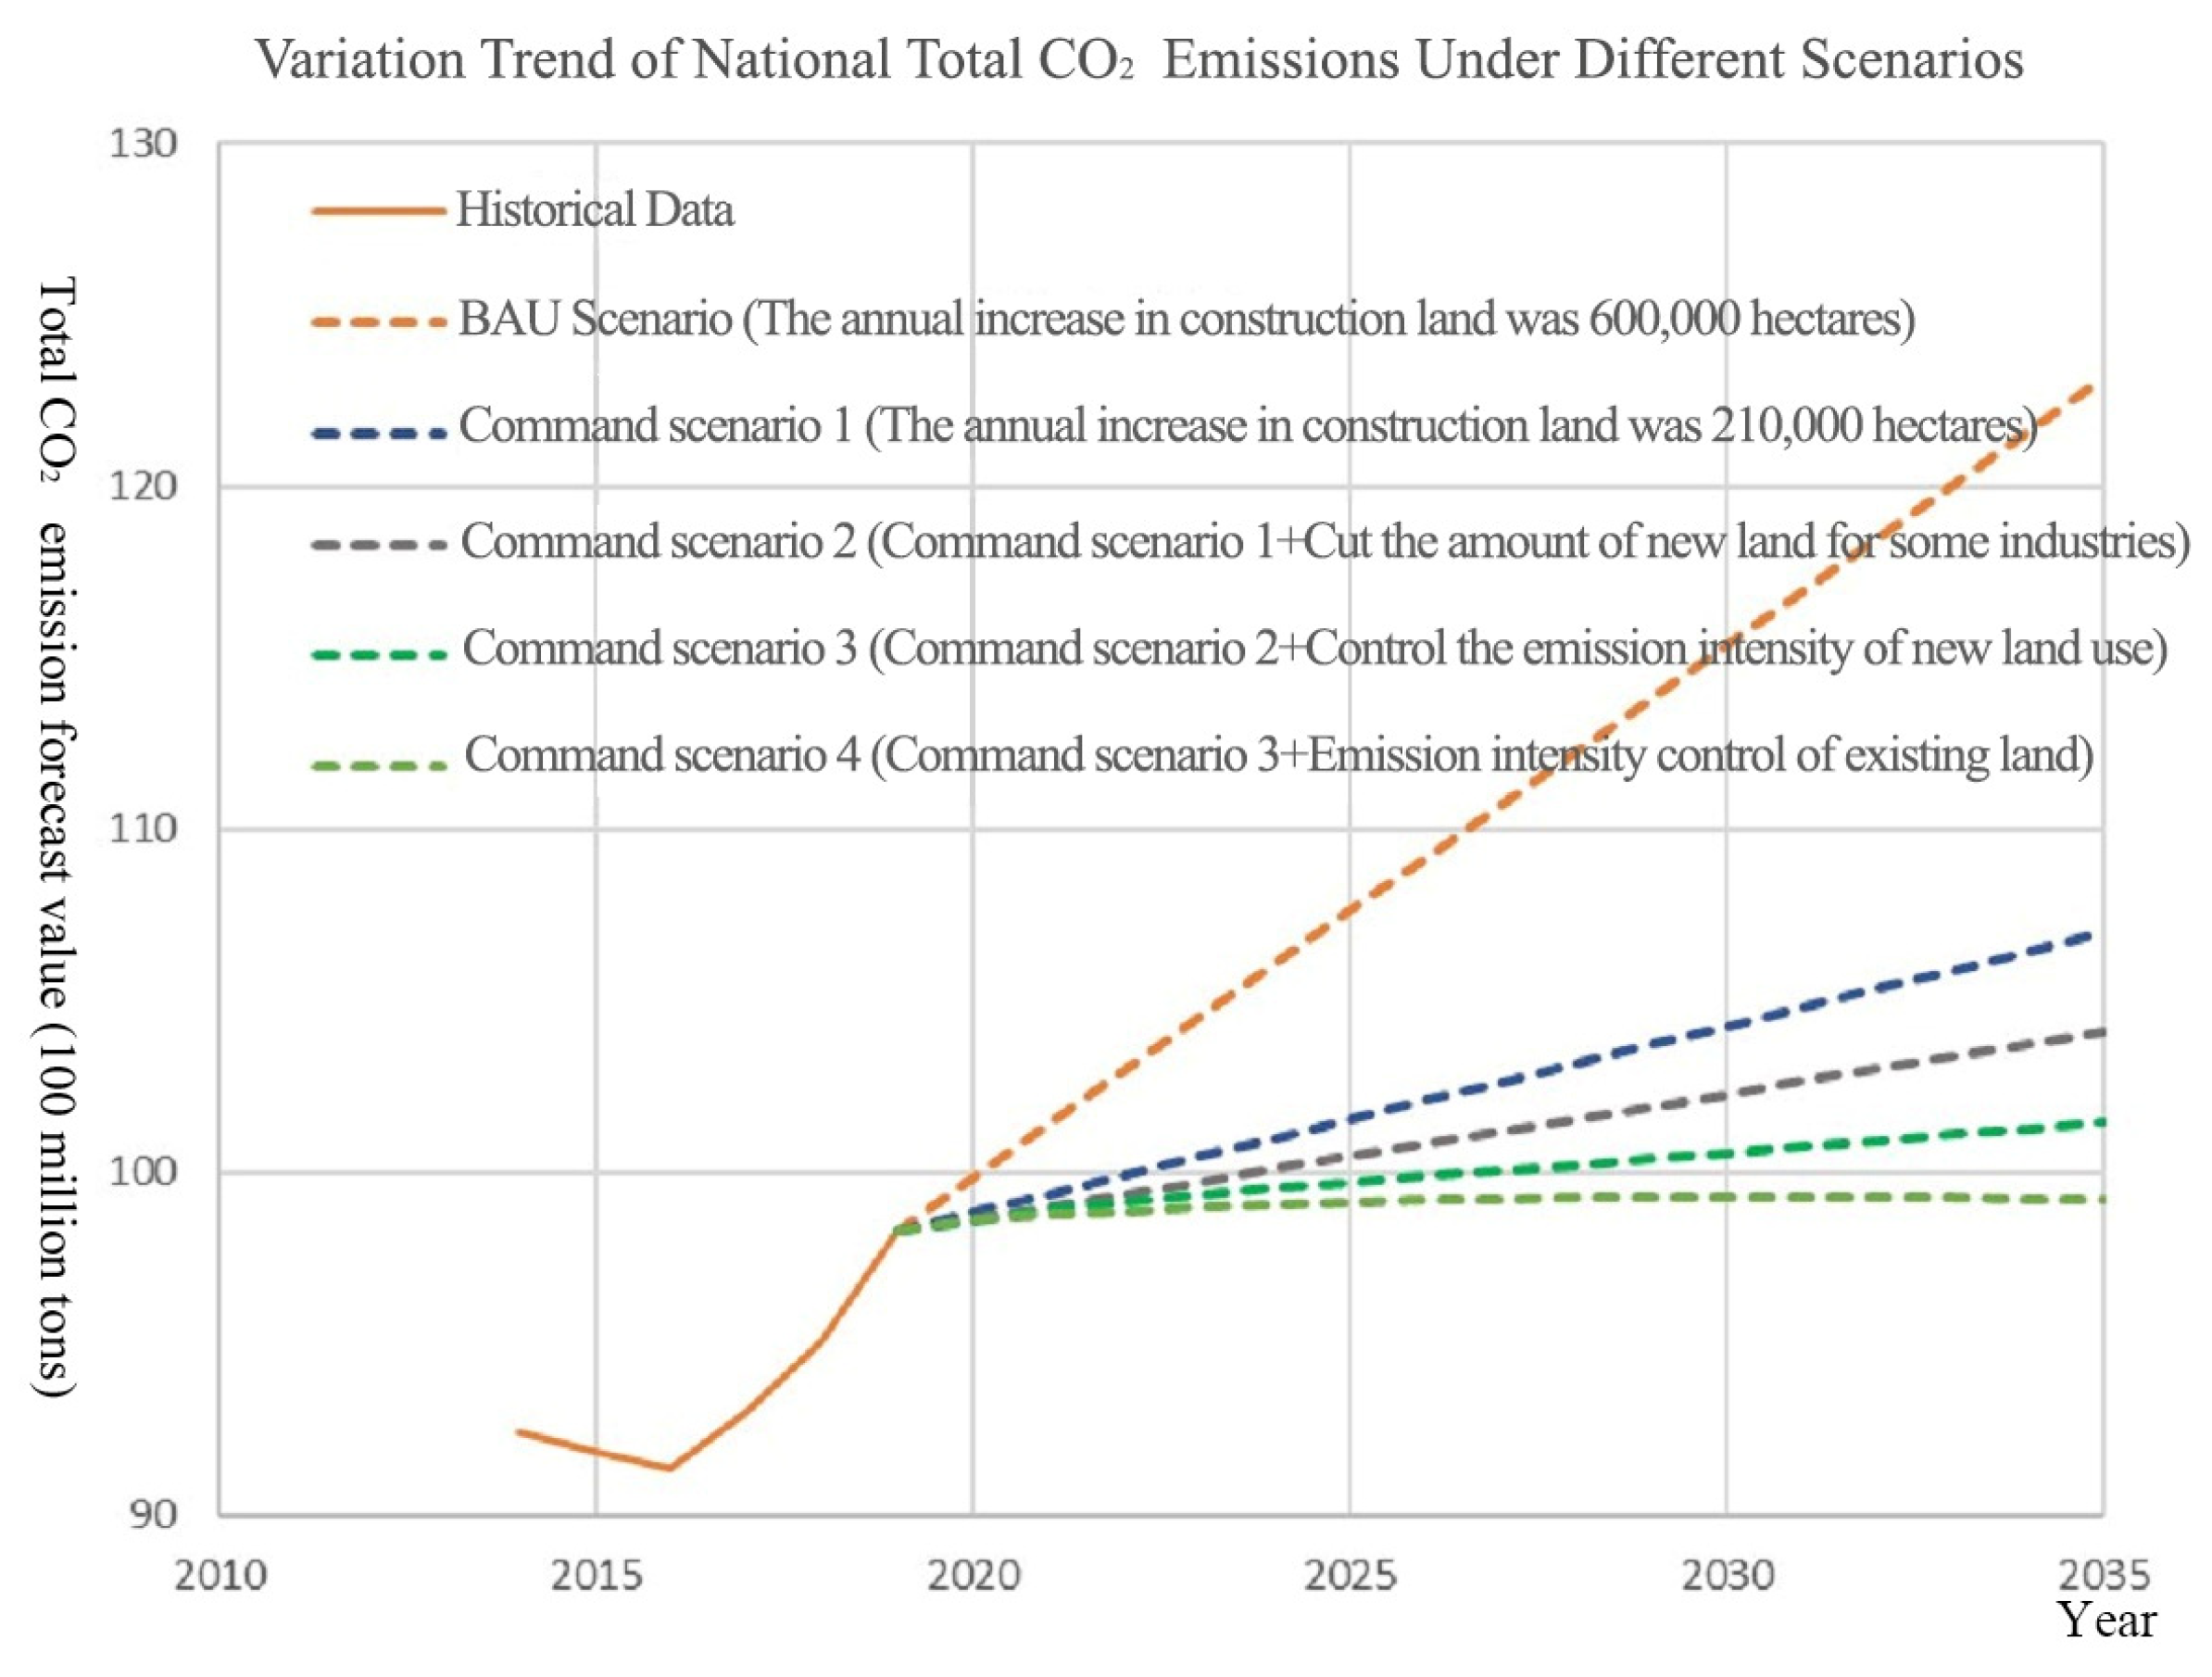
3.2.4. Carbon Emissions Forecast
4. Discussion
5. Conclusions
Author Contributions
Funding
Institutional Review Board Statement
Informed Consent Statement
Data Availability Statement
Conflicts of Interest
References
- Crutzen, P.J. Geology of Mankind. Nature 2002, 415, 23. [Google Scholar] [CrossRef] [PubMed]
- Houghton, R.A. The annual net flux of carbon to the atmosphere from changes in land use 1850–1990*. Tellus. Ser. B Chem. Phys. Meteorol. 1999, 51, 298–313. [Google Scholar] [CrossRef] [Green Version]
- Houghton, R.A. Changes in Terrestrial Carbon over the Last 135 Years; Springer: Berlin/Heidelberg, Germany, 1993. [Google Scholar]
- Houghton, R.A.; Hackler, J.L. Sources and sinks of carbon from land-use change in China. Glob. Biogeochem. Cycles 2003, 17, 1034. [Google Scholar] [CrossRef]
- Houghton, R.A.; House, J.I.; Pongratz, J.; van der Werf, G.R.; De Fries, R.S.; Hansen, M.C.; Le Quéré, C.; Ramankutty, N. Carbon emissions from land use and land-cover change. Biogeosciences 2012, 9, 5125–5142. [Google Scholar] [CrossRef] [Green Version]
- Zhang, C.; Chen, G.; Chapelka, A.; Xu, X.; Ren, W.; Hui, D.; Liu, M.; Lu, C.; Pan, S.; Lockaby, G. Impacts of urbanization on carbon balance in terrestrial ecosystems of the Southern United States. Environ. Pollut. 2012, 164, 89–101. [Google Scholar] [CrossRef] [PubMed]
- Poeplau, C.; Don, A. Sensitivity of soil organic carbon stocks and fractions to different land-use changes across Europe. Geoderma 2013, 192, 189–201. [Google Scholar] [CrossRef]
- Churkina, G.; Brown, D.G.; Keoleian, G. Carbon stored in human settlements: The conterminous United States. Glob. Chang. Biol. 2010, 16, 135–143. [Google Scholar] [CrossRef] [Green Version]
- Zhao, R.Q.; Huang, X.J.; Zhong, T.Y. Research on Carbon Emission Intensity and Carbon Footprint of Different Industrial Spaces in China. Acta Geogr. Sin. 2010, 65, 1048–1057. [Google Scholar]
- Defries, R.S.; Field, C.B.; Fung, I.; Collatz, G.J.; Bounoua, L. Combining satellite data and biogeochemical models to estimate global effects of human-induced land cover change on carbon emissions and primary productivity. Glob. Biogeochem. Cycles 1999, 13, 803–815. [Google Scholar] [CrossRef]
- Zhao, R.Q.; Qin, M.Z. Temporospatial Variation of Partial Carbon Source/Sink of Farmland Ecosystem in Coastal China. J. Ecol. Rural Environ. 2007, 23, 1–6. [Google Scholar]
- Koerner, B.; Klopatek, J. Anthropogenic and natural CO2 emission sources in an arid urban environment. Environ. Pollut. 2002, 11, 45–51. [Google Scholar] [CrossRef] [PubMed]
- Svirejeva-Hopkins, A.; Schellnhuber, H.-J. Modelling carbon dynamics from urban land conversion: Fundamental model of city in relation to a local carbon cycle. Carbon Balance Manag. 2006, 1, 1–9. [Google Scholar] [CrossRef] [PubMed]
- Ali, G.; Nitivattananon, V. Exercising multidisciplinary approach to assess interrelationship between energy use, carbon emission and land use change in a metropolitan city of Pakistan. Renew. Sustain. Energy Rev. 2012, 16, 775–786. [Google Scholar] [CrossRef]
- Ke, Y.; Yi, X. Path selection for low-carbon economic land use pattern in China. Energy Procedia 2011, 5, 452–456. [Google Scholar] [CrossRef] [Green Version]
- Dilling, L.; Failey, E. Managing carbon in a multiple use world: The implications of land-use decision context for carbon management. Glob. Environ. Chang. 2013, 23, 291–300. [Google Scholar] [CrossRef]
- Zhong, X.; Yu, G.; He, G.; Lu, D. Carbon storage loss during land readjustment and optimization of ecological compensation. Chin. J. Ecol. 2006, 25, 303–308. [Google Scholar]
- Chuai, X.; Huang, X.; Lai, L.; Wang, W.; Peng, J.; Zhao, R. Land use structure optimization based on carbon storage in several regional terrestrial ecosystems across China. Environ. Sci. Policy 2013, 25, 50–61. [Google Scholar] [CrossRef]
- Zhao, R.; Huang, X.; Zhong, T.; Chuai, X. Carbon Effect Assessment and Low Carbon Optimization of Regional Land Use Structure. Trans. Chin. Soc. Agric. Eng. 2013, 29, 220–229. (In Chinese) [Google Scholar]
- Shi, H.X.; Mu, X.; Zhang, Y.; Lv, M. Effects of Different Land Use Patterns on Carbon Emission in Guangyuan City of Sichuan Province. Bull. Soil Water Conserv. 2012, 3, 101–106. [Google Scholar]
- Chuai, X.; Feng, J. High resolution carbon emissions simulation and spatial heterogeneity analysis based on big data in Nanjing City, China. Sci. Total Environ. 2019, 686, 828–837. [Google Scholar] [CrossRef]
- Xia, C.; Li, Y.; Xu, T.; Ye, Y.; Shi, Z.; Peng, Y.; Liu, J. Quantifying the spatial patterns of urban carbon metabolism: A case study of Hangzhou, China. Ecol. Indic. 2018, 95, 474–484. [Google Scholar] [CrossRef]
- Li, L. Study on Carbon Emission Effect of Land Use in China. Master’s Thesis, Nanjing University, Nanjing, China, 2010. (In Chinese). [Google Scholar]
- Zhang, Z. Research on the Relationship between Land Use Structure and Carbon Emissions in Yunnan Province under the Background of Low-Carbon Economy. Master’s Thesis, Yunnan University of Finance and Economics, Kunming, China, 2011. (In Chinese). [Google Scholar]
- Zhou, B.; Xu, S.; Zhang, J. Geographic analysis of spatial differentiation of air pollution from the perspective of land use. Geomat. Inf. Sci. Wuhan Univ. 2017, 42, 216–222. (In Chinese) [Google Scholar]
- Pei, J.; Wang, L.; Chai, Z.; Fu, Q.; Niu, Z. Analysis of Land Use/Cover Change and Carbon Effect in Shenzhen Based on RS and GIS. Res. Soil Water Conserv. 2017, 424, 227–233. (In Chinese) [Google Scholar]
- Yang, H.; Wu, Q. Study on Ecological Efficiency of Land Use Transformation in Jiangsu Province from the Perspective of Carbon Emission -- Based on Mixed Directional Distance Function. J. Nat. Resour. 2017, 32, 1718–1730. (In Chinese) [Google Scholar]
- Zhang, M.; Gan, C.; Chen, Y.; Chen, L. Carbon Emission Efficiency Analysis and Low Carbon Optimization of Urban Construction Land Development Intensity in China. Sci. Geogr. Sin. 2017, 42, 216–222. (In Chinese) [Google Scholar]
- Zhang, J.; Yang, L.; Dong, M.; Jiang, L.; Wang, Y.; Jian, S. Analysis on the change of carbon emission intensity in Harbin from 2004 to 2012 based on land use. Sci. Geogr. Sin. 2015, 35, 322–327. (In Chinese) [Google Scholar]
- Wu, M.; Ren, L.; Chen, Y. Simulation Study on Carbon Emission System Dynamics of Urban Land Use: A Case Study of Wuhan City. China Land Sci. 2017, 31, 29–39. (In Chinese) [Google Scholar]
- Zhang, Y.; Yang, Y.; Jiang, P.; Deng, H.D.; Qi, F.; Li, Q.; Chang, X.W.; Cheng, P. Scientific cognition, path and governance system guarantee of the Life Community of Mountains, Rivers, Forests, Fields, Lakes and Grasses. J. Nat. Resour. 2022, 37, 3005–3018. [Google Scholar] [CrossRef]
- Lv, Z.; Jiang, B.; Sun, H.; Lv, Z.; Chen, C. Current Situation and Ways of Carbon Emission Reduction in China’s Paper Industry. Trans. China Pulp Pap. 2017, 32, 64–69. (In Chinese) [Google Scholar]
- Yu, Z.; Meng, Z. Present Situation and Suggestions of China’s Paper Industry Participating in Carbon Trading. China Pap. Newsl. 2019, 5, 7. (In Chinese) [Google Scholar]


| Province | Regression Coefficient | Determination Coefficient R2 | Number of Valid Grids | The Added Value of Carbon Emissions When the Area of Construction Land is Doubled |
|---|---|---|---|---|
| Xinjiang | 0.730 | 0.374 | 4547 | 66% |
| Inner Mongolia | 1.057 | 0.559 | 6801 | 108% |
| Sichuan | 1.160 | 0.620 | 4024 | 123% |
| Hainan | 1.240 | 0.448 | 360 | 136% |
| Anhui | 1.287 | 0.413 | 1402 | 144% |
| Beijing | 1.387 | 0.797 | 213 | 162% |
| Hubei | 1.466 | 0.610 | 1888 | 176% |
| Hunan | 1.467 | 0.549 | 2113 | 176% |
| Yunnan | 1.468 | 0.565 | 3618 | 177% |
| Gansu | 1.484 | 0.551 | 2763 | 180% |
| Heilongjiang | 1.494 | 0.694 | 3962 | 182% |
| Guangdong | 1.495 | 0.593 | 1844 | 182% |
| Zhejiang | 1.527 | 0.706 | 1167 | 188% |
| Shanghai | 1.548 | 0.541 | 104 | 192% |
| Chongqing | 1.580 | 0.561 | 965 | 199% |
| Guangxi | 1.599 | 0.540 | 2356 | 203% |
| Shaanxi | 1.613 | 0.584 | 1938 | 206% |
| Hebei | 1.613 | 0.688 | 1981 | 206% |
| Jiangsu | 1.651 | 0.473 | 1126 | 214% |
| Jiangxi | 1.664 | 0.565 | 1675 | 217% |
| Tianjin | 1.668 | 0.596 | 148 | 218% |
| Ningxia | 1.671 | 0.503 | 354 | 218% |
| Fujian | 1.672 | 0.607 | 1325 | 219% |
| Liaoning | 1.672 | 0.606 | 1520 | 219% |
| Henan | 1.674 | 0.554 | 1589 | 219% |
| Jilin | 1.760 | 0.656 | 1883 | 239% |
| Shanxi | 1.805 | 0.647 | 1612 | 249% |
| Shandong | 1.918 | 0.462 | 1600 | 278% |
| Guizhou | 1.989 | 0.499 | 358 | 297% |
| Xizang | 2.002 | 0.465 | 115 | 300% |
| Qinghai | 2.284 | 0.410 | 2256 | 387% |
| Serial Number | Industry or Industry Collection |
|---|---|
| 1 | Gas production and supply industry |
| 2 | Electricity and heat production and supply industry |
| 3 | Water production and supply industry |
| 4 | Paper and paper products industry |
| 5 | Petroleum processing coking and nuclear fuel processing industries |
| 6 | Chemical fiber manufacturing |
| 7 | Chemical raw materials and chemical products manufacturing |
| 8 | Ferrous metal smelting and rolling industry |
| 9 | Non-metallic mineral products industry |
| 10 | Warehousing and logistics industry |
| 11 | Non-ferrous metal smelting and calendering industry |
| 12 | Animal husbandry |
| 13 | Non-ferrous metal mining and dressing industry |
| 14 | Leather, fur and feathers and their products and footwear |
| 15 | Village |
Disclaimer/Publisher’s Note: The statements, opinions and data contained in all publications are solely those of the individual author(s) and contributor(s) and not of MDPI and/or the editor(s). MDPI and/or the editor(s) disclaim responsibility for any injury to people or property resulting from any ideas, methods, instructions or products referred to in the content. |
© 2023 by the authors. Licensee MDPI, Basel, Switzerland. This article is an open access article distributed under the terms and conditions of the Creative Commons Attribution (CC BY) license (https://creativecommons.org/licenses/by/4.0/).
Share and Cite
Zhang, H.; Gu, P.; Cao, G.; He, D.; Cai, B. The Impact of Land-Use Structure on Carbon Emission in China. Sustainability 2023, 15, 2398. https://doi.org/10.3390/su15032398
Zhang H, Gu P, Cao G, He D, Cai B. The Impact of Land-Use Structure on Carbon Emission in China. Sustainability. 2023; 15(3):2398. https://doi.org/10.3390/su15032398
Chicago/Turabian StyleZhang, Hui, Pengcheng Gu, Genrong Cao, Dongquan He, and Bofeng Cai. 2023. "The Impact of Land-Use Structure on Carbon Emission in China" Sustainability 15, no. 3: 2398. https://doi.org/10.3390/su15032398