1. Introduction
In the event of a large-scale industrial accident, there are specific factors, activities, spatial elements, groups of people, etc. that may be affected significantly and should be considered and examined thoroughly during the spatial planning processes of sites with Seveso facilities. The specific spatial elements depend on several social and environmental components of the area that will be affected by the accident, as well as the key infrastructures of the area adjacent to the facility.
Seveso sites are defined as industrial sites that, because of the presence of dangerous substances in sufficient quantities, are regulated under Council Directives 96/82/EC and 2003/105/EC, commonly referred to as the Seveso II Directive. The Directive applies to more than 12,000 industrial establishments in the European Union where dangerous substances are used or stored in large quantities, mainly in the chemical and petrochemical industry, as well as in the fuel wholesale and storage sectors. The Directive aims to control major accident hazards involving dangerous substances, especially chemicals, and contributes to the effort to reduce technological disaster risks [
1]. A subsequent Seveso Directive (Seveso-III-Directive (2012/18/EU) classified industrial establishments depending on the amount of dangerous substances present, in lower and upper tiers, and the latter are subject to more stringent requirements [
2]. In accordance with the European Directive 2012/18/EU [
2] and the Joint Ministerial Decision 172058 (Gazette 354/Β/17-2-2016) [
3], the main concern for these specific areas is the adoption of measures and policies to either avoid or/and minimize the consequences for people and the environment and, by extension, for the affected area. According to the literature review, there are several case studies that assessed either the social or the environmental vulnerability of the areas with Seveso facilities but without considering their spatial vulnerability. Researchers have frequently used assessment systems and indicators of vulnerability to industrial accidents (e.g., [
4,
5,
6]). In a few cases, the spatial elements were considered in light of examining the spatial dimension and spread of the accident, and not as a single multifactorial parameter, which contributed to the creation of an evaluation system for the area and the formulation of a unified spatial policy (e.g., [
5,
7]).
The main research question of this study focused on the elements and particularities of the areas hosting Seveso facilities that could affect and be affected by the occurrence of a large-scale industrial accident. According to the literature review and the three aspects of vulnerability (social, environmental and spatial), the elements and particularities refer to critical spatial elements such as the urban infrastructure and sensitive environmental features, as well as the socioeconomic parameters. The aim of the present study was to develop an appropriate system of indicators that can assess the vulnerability of areas hosting Seveso facilities, contributing to spatial planning and the decision-making processes as well as to the formulation of spatial policies and directions.
This study attempted to consider the spatial dimension of an industrial accident as part of a wider spatial system and investigated the concept of the vulnerability of an area that is subject to a major industrial accident by considering three aspects of vulnerability: social, environmental and spatial. The first stage of the whole process included the identification, assessment and evaluation of the risk of an industrial accident. According to the literature review and the three aspects of vulnerability, a vulnerability assessment indicator system (VAIS) that measures the vulnerability displayed by the areas located near Seveso industries was defined. The application area included the western part of Thessaloniki (the municipal districts (MDs) of Thessaloniki, Ampelokipi, Menemeni, Elefterio Kordelio, Evosmos, Diavata, Kalochori and Nea Magnisia) in Greece. The VAIS included social, environmental and spatial indicators, and an assessment of these indicators was performed through the collection of appropriate qualitative and quantitative data. Environmental, social and spatial vulnerability were considered as equally important components of vulnerability. The examined MDs were finally prioritized based on their overall vulnerability by using well-known multicriteria analysis methods (AHP and TOPSIS).
The remainder of the article is structured as follows.
Section 2 describes the state of the art regarding social and environmental vulnerability, while
Section 3 describes the methodological framework used for developing the VAIS and assessing the vulnerability of the examined areas (MDs). The study’s findings are provided and analyzed in
Section 4, while the study’s primary conclusions are presented in
Section 5.
2. State of the Art
The Social Vulnerability Index (SoVI) was created by Cutter et al. [
8], who investigated the spatial patterns of social vulnerability to natural hazards at the county level in the United States to explain and comprehend the social burdens of risk. The Social Vulnerability Index’s sensitivity to modifications in its construction, the scale at which it is applied, the set of variables applied, and the different geographic contexts were explored later by Schmidtlein et al. [
9]. Their investigation served as a starting point for comprehending the social vulnerability metric’s sensitivity. They showed that the algorithm was sensitive to changes in its quantitative design but robust to slight changes in the variables’ composition and scale. They also highlighted the requirement for expert involvement when creating the index, considering this sensitivity.
Holland et al. [
10] developed a methodology for quantifying social vulnerability to natural hazards in Norwegian municipalities. Through factor analysis, they calculated the vulnerability scores of the socioeconomic and built environment for each Norwegian municipality. The findings demonstrated that there were significant geographical differences: municipalities with high socioeconomic vulnerability were concentrated in portions of the southeast and northern half of Norway, whereas southwestern Norway was the region with the lowest socioeconomic vulnerability. Additionally, in densely populated places, the built environment’s vulnerability was the greatest.
Hummel [
11] assessed the hazards, social vulnerability, resilience research and the availability of spatial data in Brazil. The study examined the methods used to understand social vulnerability, risk exposure and resilience. It also examined the potential markers that could be used to gauge risk exposure and social vulnerability. For the State of Paraná, replication research on the Social Vulnerability Index (SoVI) was carried out. This allowed the creation of a comparative indicator of social vulnerability at the municipal level, demonstrating how various populations could be impacted by catastrophes.
Holand and Lujala [
12] measured the ability of an existing social vulnerability index to represent social vulnerability in a different country from the one for which it was first developed. They created two variants of the Social Vulnerability Index developed by Cutter et al., 2003 for Norway. The first one replicated the original index as closely as possible (SoVI Replica), and in the second, they performed various adjustments (SoVI Adapted). The findings indicated that only 19% of the variation in the adapted index was explained by the replicated index. Therefore, there were significant variations between analyses that simply replicated the index and those that customized it for a new situation.
Siagian et al. [
13] attempted to quantify, identify and map the variations in the social vulnerability of Indonesian districts to natural hazards through the use of the social vulnerability index (SoVI) methodology. According to their results, “socioeconomic status and infrastructure”, “gender, age, and population growth” as well as “family structure” were the three key determinants of social vulnerability in Indonesia.
Flanagan et al. [
14] discussed the creation of an SVI for use in disaster management and examined its potential utility by using Hurricane Katrina’s effects on the local people as an example. The SVI’s foundational dimensions included socioeconomic status, household composition and disability, minority status and language, and housing and transportation. The Katrina case study demonstrated how the SVI could be used in the response and recovery stages as a factor in estimations of risk. Older people were especially at risk during this incident. Additionally, regions that took longer to recover included those that had severe flooding and those with populations who were socioeconomically fragile.
Fatemi et al. [
4] investigated the crucial parameters for determining the degree of risk of people residing close to chemical sites. They created and evaluated several indicators using the Fuzzy Delphi method (FDM) and the Fuzzy Analytic Hierarchy Process (FAHP). Thirty-five relevant experts participated in the study, and the indicators of human vulnerability were investigated in two sets of social and physical domains. According to the FDM and FAHP, population density, the vulnerability of certain groups, and awareness were the top three indicators of human vulnerability.
According to Flanagan et al. [
15], social vulnerability is defined in terms of a person’s or community’s capacity to foresee, deal with, repair and recover from the effects of a disaster. Socioeconomic status, household composition, minority status and access to vehicles were all considered in their study as primary factors that might affect a person’s social vulnerability.
A methodology for estimating the risk of technological hazards, which included two steps, was proposed by Sanchez et al. [
7]: (i) the processing of meteorological databases to determine the study’s most likely and conservative scenario, and (ii) applying a local social vulnerability index to categorize the population. A potential release of liquefied ammonia from a meat-packing plant in the city of La Plata, Argentina, was given a risk estimate. The technique entailed combining the layer of the sociodemographic classification of the impacted population with the simulated toxic threat zone and Areal Locations of Hazardous Atmospheres (ALOHA) software. The findings highlighted the regions where there was a greater danger of exposure to ammonia, which should be addressed to prevent disasters in the area.
Tahmid et al. [
5] created a model for calculating the risk and sensitivity of humans to chemical mishaps. A GIS-based methodology that models accidents and determines the population’s susceptibility by using computer-aided hazard modeling tools and technical guidelines was proposed. A set of societal indicators gathered from pertinent research, expert judgments and the World Bank’s recommendations was used to estimate the population’s susceptibility. The Meghnaghat Industrial Area in Bangladesh was used as a case study. The vulnerability map and hazard footprints were superimposed to create a risk map, which was used to evaluate the current land use and provided suggestions for future land use planning.
A novel approach was provided by Botezan et al. [
16] to examine if changes in urban territorial dynamics had a significant impact on social vulnerability. Within the Urban Atlas inventory, the technique discovered and selected three case studies that best reflected the dynamics of significant Romanian cities, taking the following dangers into account: earthquakes, flood, and technological risks. The findings indicated that significant changes in land use were associated with a transition from low susceptibility to highly sensitive areas as a result of the growth of urban areas at the expense of natural and agricultural areas.
Regarding the environmental dimension of vulnerability, there have been just a few investigations.
Through two case studies (the municipality of Omegna and the province of Turin in Italy), Demichela et al. [
17] analyzed and considered the administrative and practical concerns related to the implementation of the land use planning criteria at a local level, with a focus on the decisional approaches adopted, the data required to support a decision, and the merging of land use planning criteria for high-risk installations, as discussed and applied in previous case studies (e.g., [
18,
19,
20,
21]), with the local planning regulations. The investigation revealed that the “Guidelines for the Assessment of Industrial Risk in Land Use Planning” must be applied by using a multidisciplinary approach, but local governments are frequently underequipped to conduct this type of multilevel analysis because they lack the financial, human or even technical resources required. Because of this, the significance of proper urban and land design in the vicinity of high-risk facilities may be underestimated.
In their study, Sikovora et al. [
22] outlined the legal reference setting in the Czech Republic and Italy, while considering the Seveso framework’s environmental domain and the ongoing problems related to other legislative directives and classification adjustments. The deployment of a framework for the implementation of the Seveso Directive for the prevention of environmental effects was initially provided, along with a statistical review of environmental accidents in these two countries. The development and application of a methodological approach focusing on environmental risk assessments within the Seveso framework was then applied to a real-world Czech case study. The results showed that the Seveso Directive’s environmental risk assessment was still a developing field of study that generated new issues for in-depth discussions.
Finally, in their study, Burdea et al. [
6] introduced an approach that evaluated the level of risk at a site subjected to the Seveso II Directive by considering security management as well as security measures. Four indexes were created to achieve this goal: (i) the hazard’s source (the establishment), (ii) the hazard’s flow (the mechanism by which the accident spreads), (iii) the vulnerability of the targets (people, the environment or equipment) and (iv) safety management (prevention and protection actions). The combination of the aforementioned parameters could provide the level of risk in order to characterize the risk generated by an industrial plant in its environment and thus could highlight preventive and risk minimization measures.
3. Materials and Methods
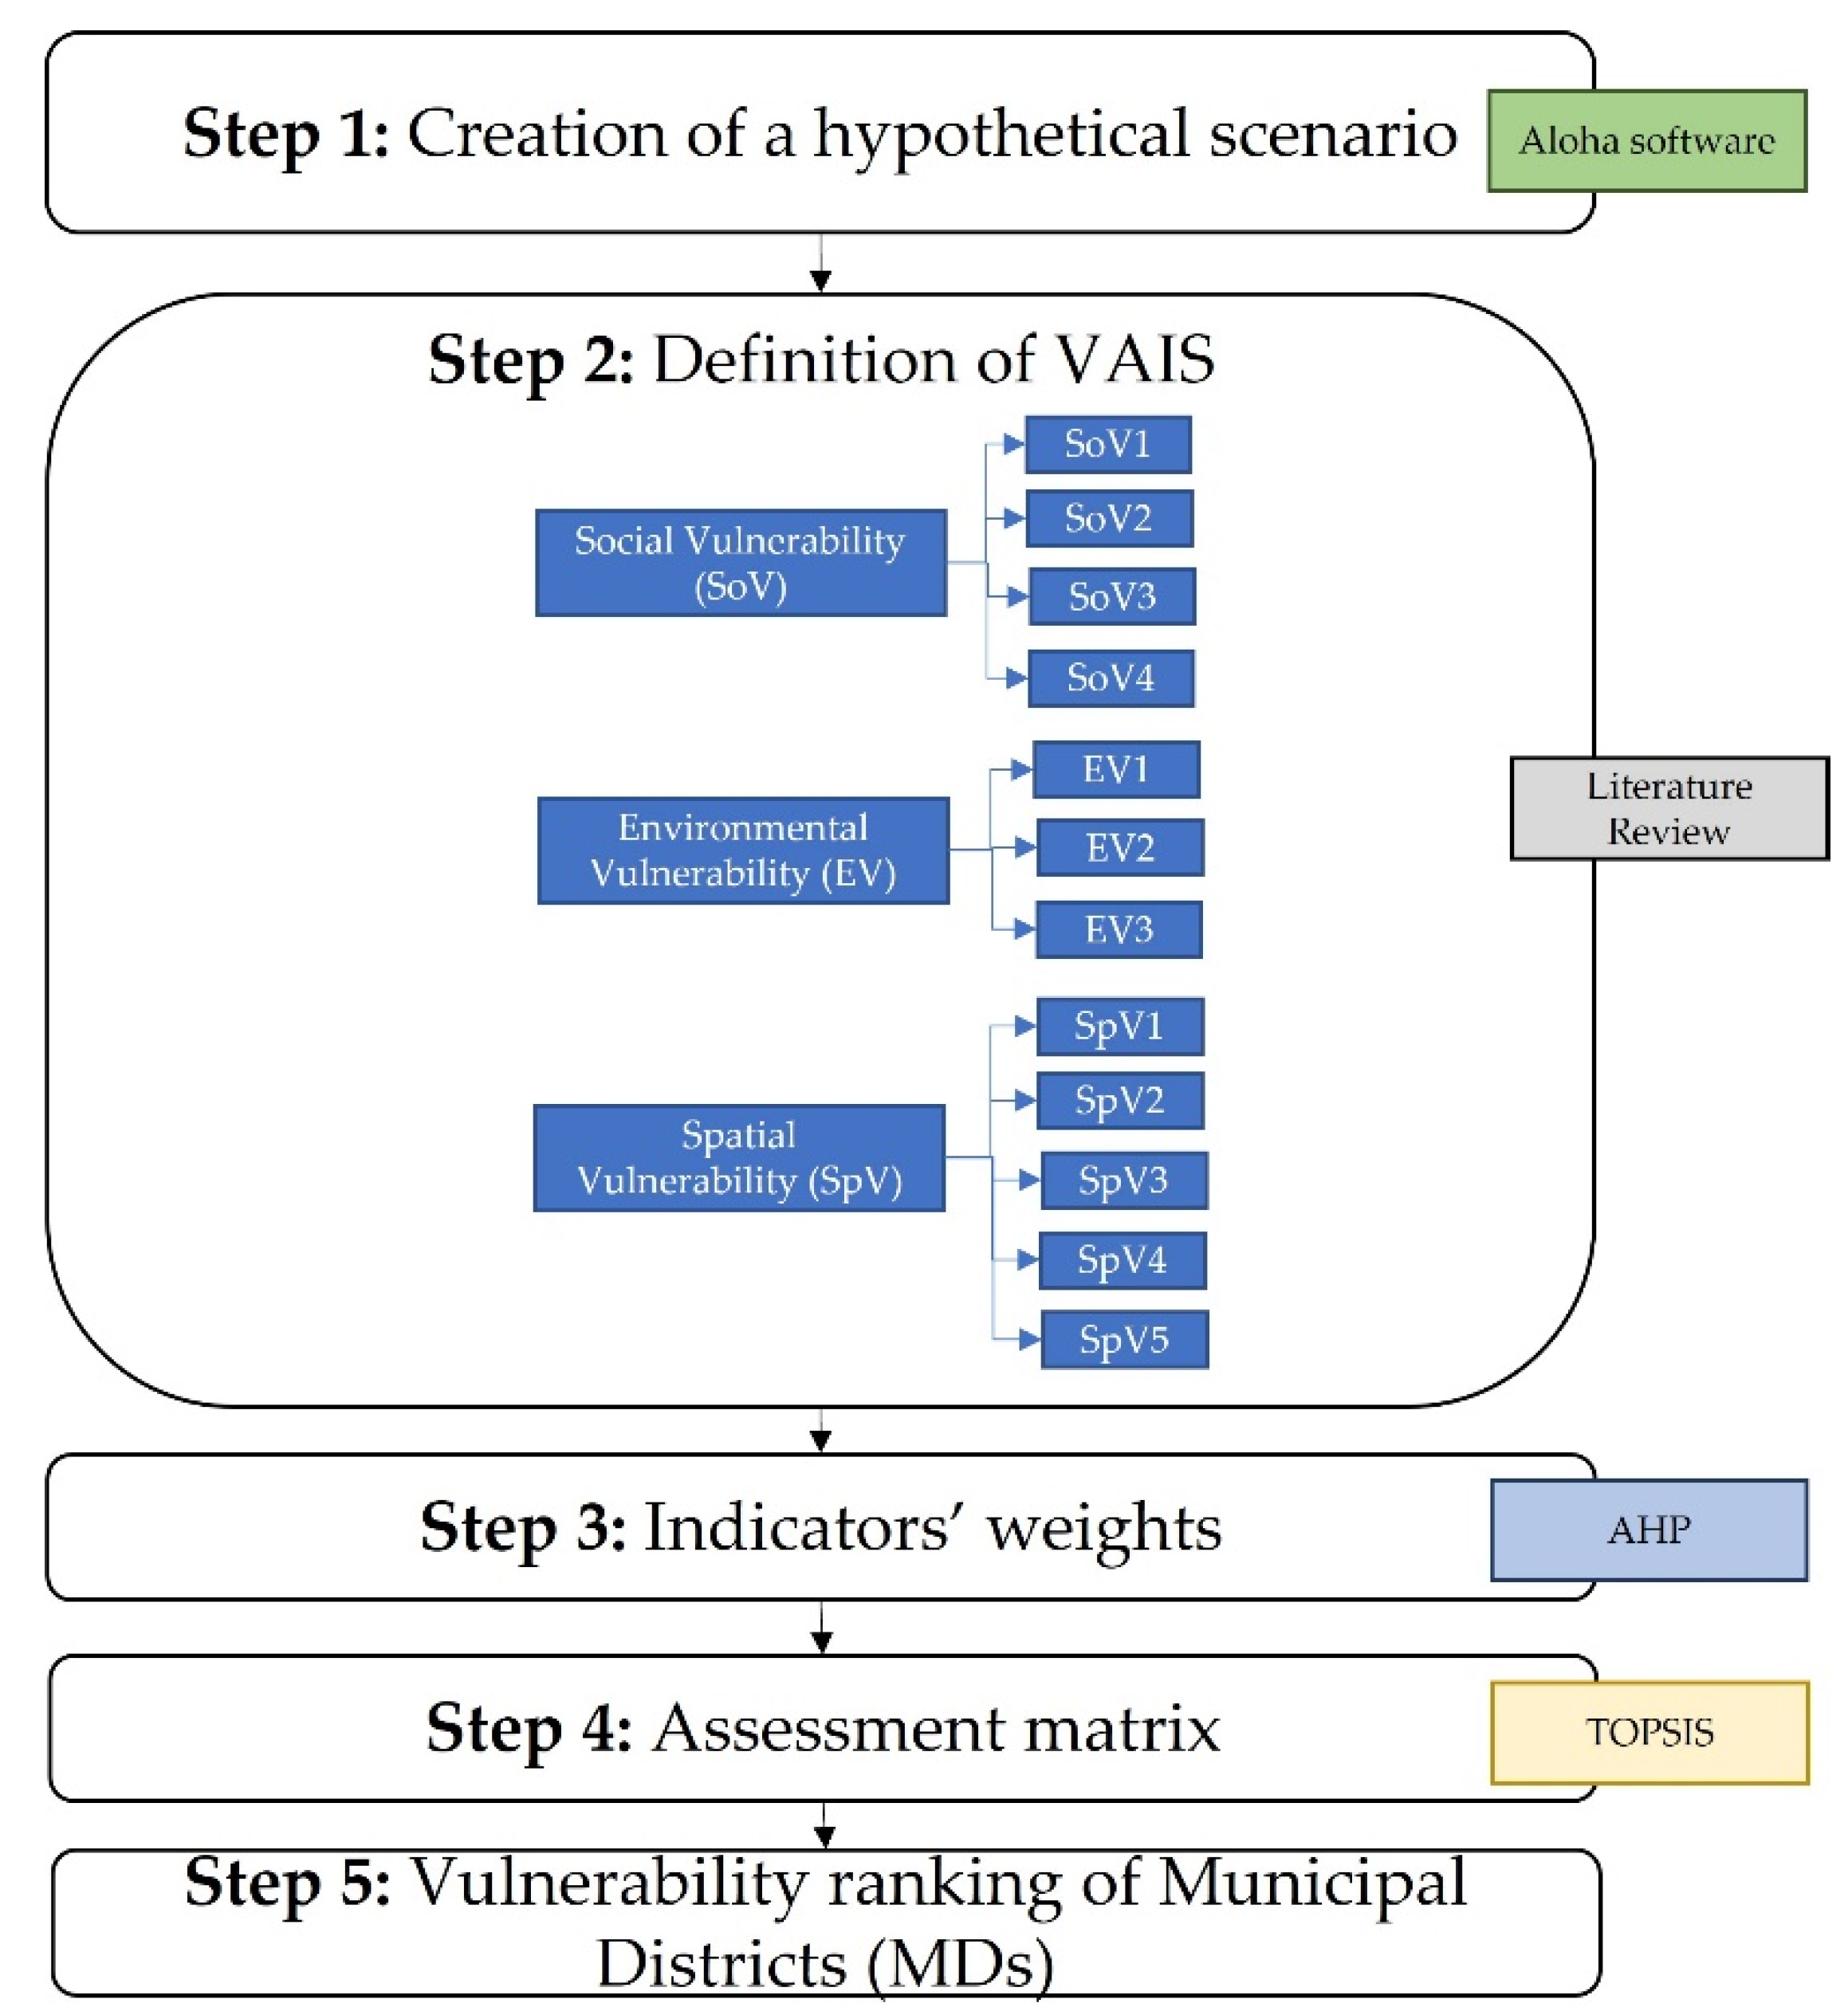
The objective of this research was to identify and propose an appropriate system of indicators, the Vulnerability Assessment Indicator System (VAIS,) which would assess the vulnerability of areas in proximity to Seveso sites. The methodological steps for the deployment of the VAIS are shown in
Figure 1. Each methodological step is thoroughly described in the following sections.
3.1. Creation of a Hypothetical Scenario
Since the proposed indicator system is catered towards areas that are in proximity to Seveso industrial facilities, it is important to define the study area based on the sphere of influence of a hypothetical accident scenario. In the event of an industrial accident, Seveso facilities have severe impacts both within their facilities and on the adjacent activities due to the peculiarity of the raw materials used or stored during the production process. Therefore, the spatial range of such an accident is considered as an important factor in determining the vulnerability of the adjacent areas.
The first step of the proposed methodology includes the creation of a hypothetical scenario of an industrial accident and delineation of the area that could potentially be affected.
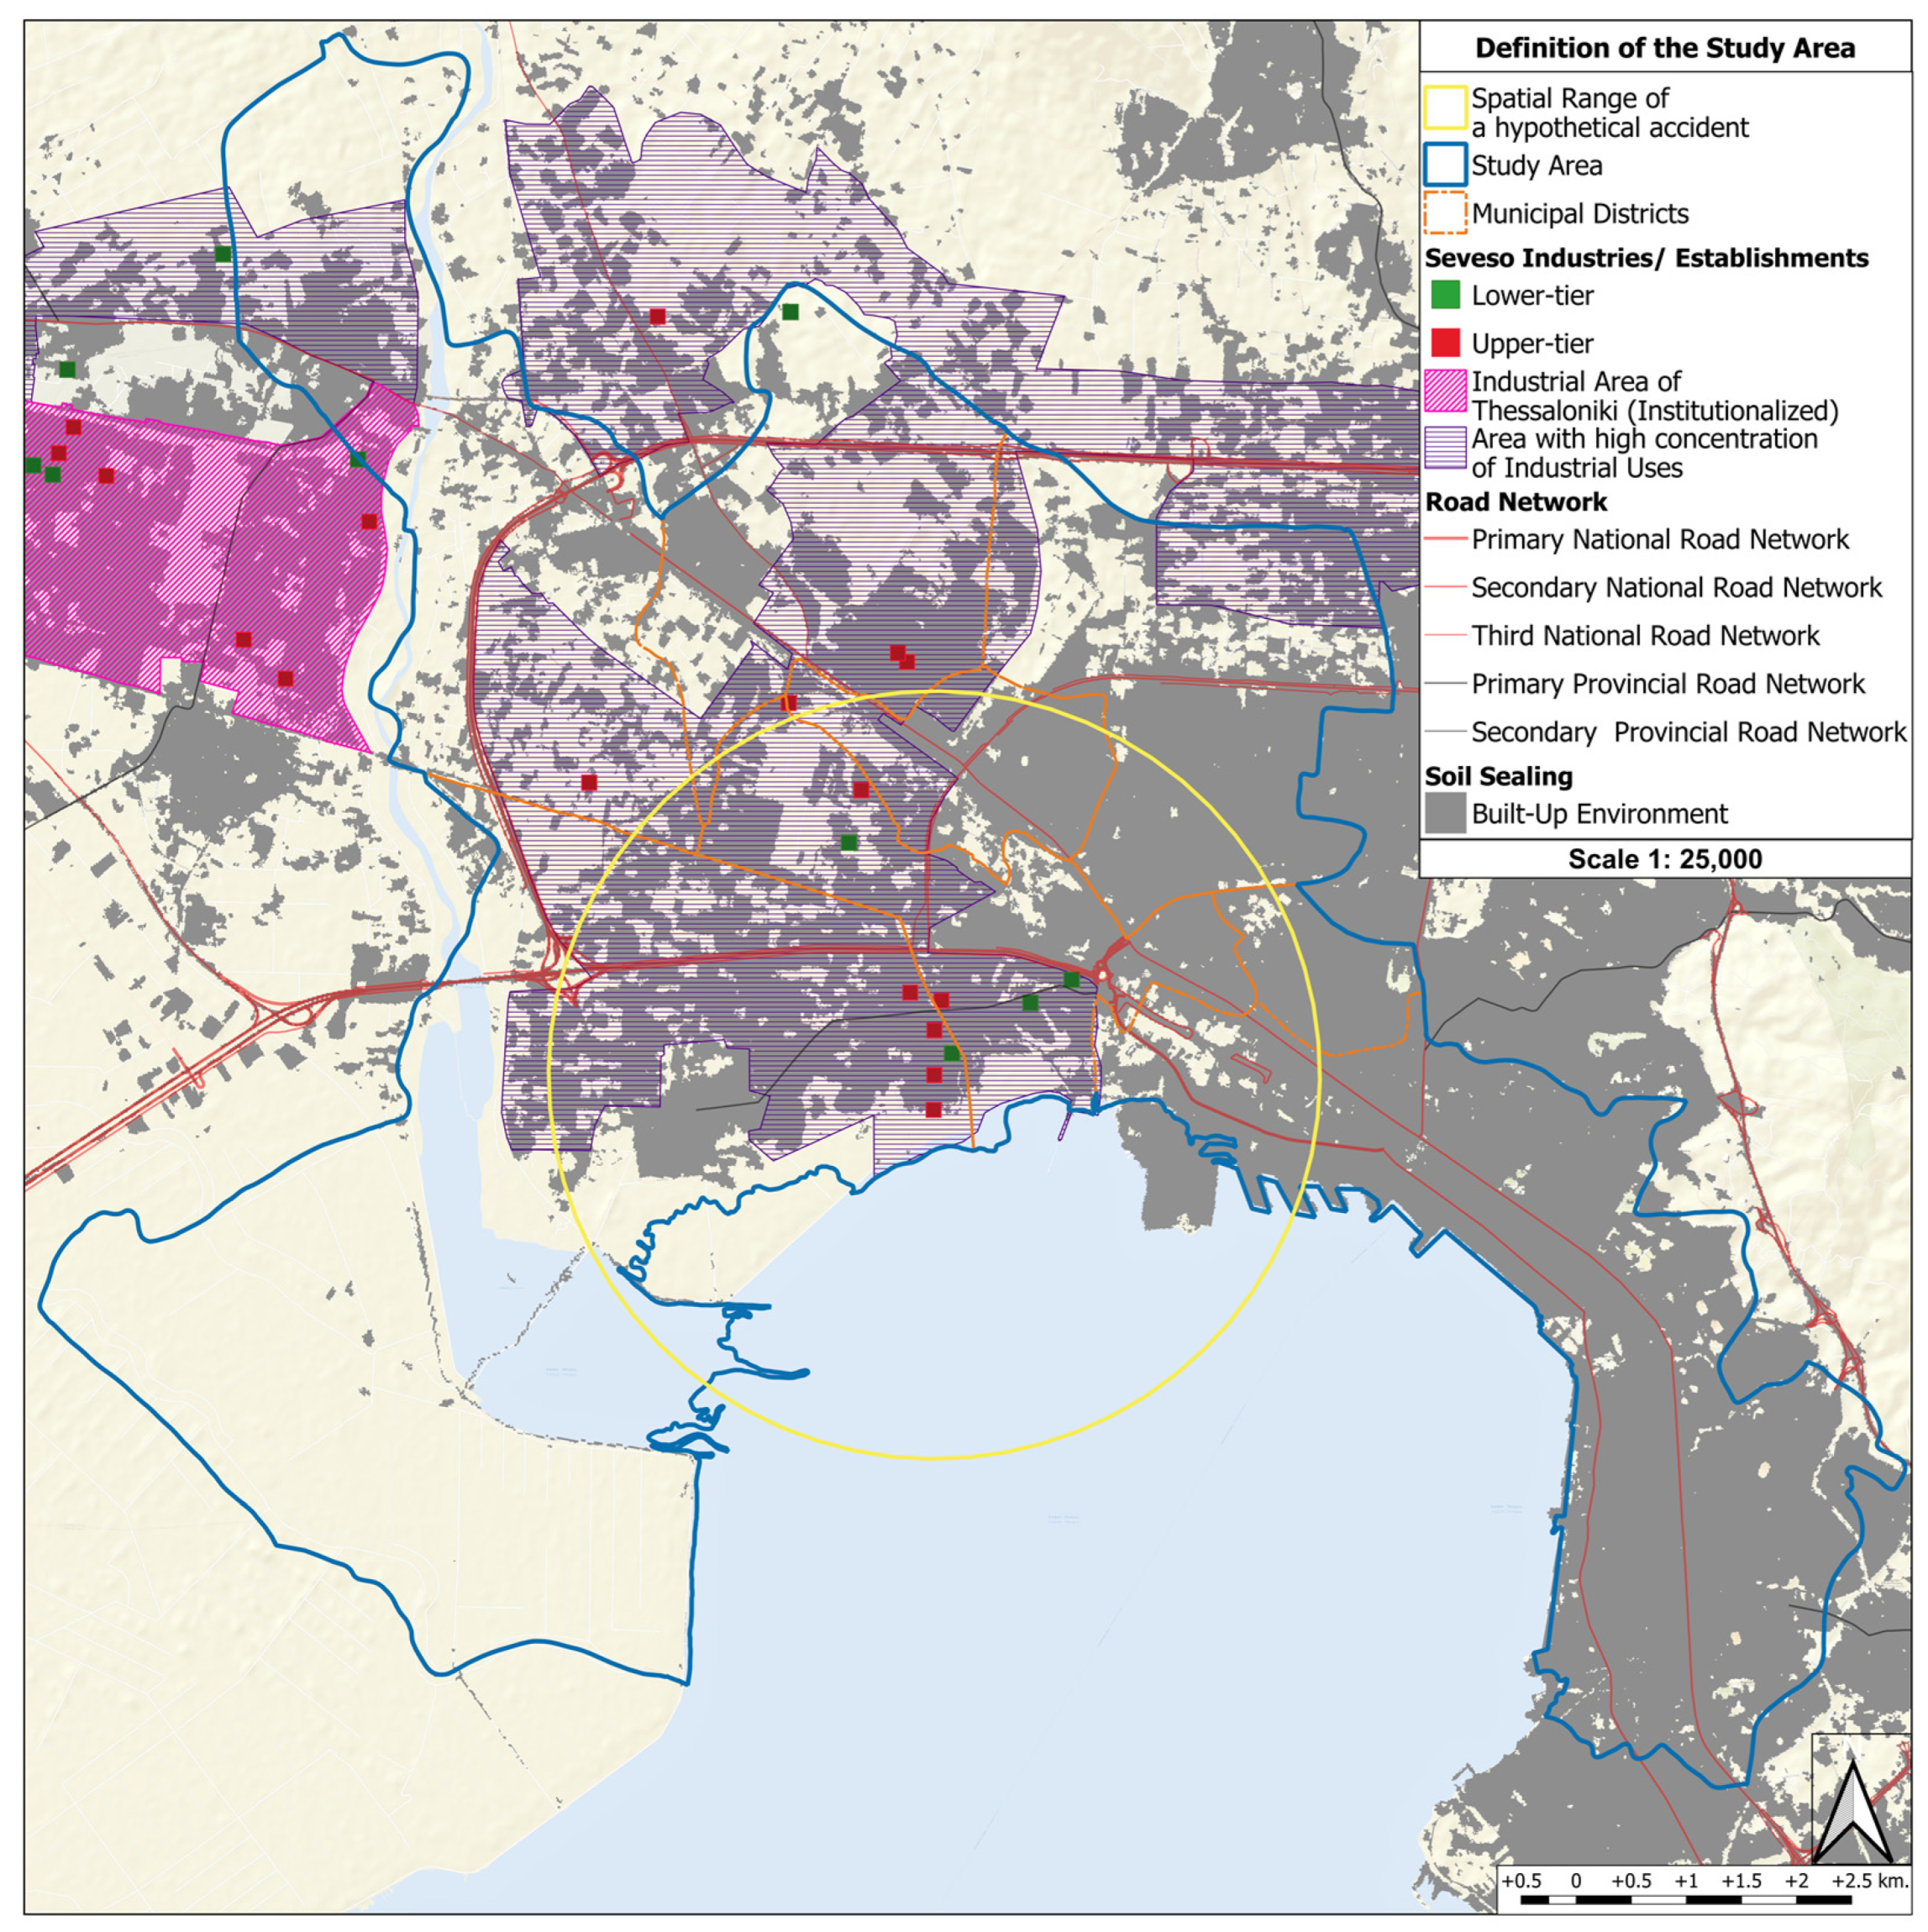
The wider area of western Thessaloniki was considered to be the case study as it is an area adjacent to a Seveso site (according to the corresponding Seveso Directive) and includes an agglomeration of high-risk industrial facilities. It is important to note that this area happens to include significant natural protected areas such as the Axios Delta estuary, complex water ecosystems, national parks, etc. In addition, it is an area with certain socioeconomic characteristics (i.e., low income, high illiteracy rates, etc.) that, according to [
12,
13,
14], make up a highly socially vulnerable profile.
After recording existing industrial facilities and, given the readily available data necessary to stage an industrial accident, a hypothetical accident scenario was developed, that led to the precise definition of the study area.
The estimation of the risk for an industrial accident was carried out using Aloha software [
23]. The potential zone of influence of the accident was determined by the software itself, based on user-defined inputs that included:
- i.
The number of installations in an industrial plant;
- ii.
The type and characteristics of the plant’s facilities;
- iii.
The raw and produced materials used within the industrial plant;
- iv.
The climatic and topographical conditions.
During the risk assessment there were several individual scenarios that were exam-ined in order to choose one. In several cases the lack of data led to the adoption of as-sumptions, such as the location where the hazardous substances were stored, the volume and conditions (i.e., air pressure) of the stored materials, the climatic conditions, etc. The purpose of this step of our work was not to replicate an industrial accident with accuracy but to define the affected area in order to apply the proposed indicator system. Based on the abovementioned assumptions, several scenarios were developed and the most realis-tic one that highlights the immediate and adjacent affected areas was selected.
The selected hypothetical scenario was assumed to take place in a cylindrical tank of size 30 m diameter and 9 m height. The estimated capacity of the tank was 6362 cubic meters with 80% fullness in gasoline. Gasoline was assumed to be in liquid form under pressure.
The accident was caused by a hypothetical failure in the tank environment that led to the expansion of the liquid and an explosion (Boiling Liquid Expanding Vapor Explosion (BLEVE) phenomenon). As for the ground weather conditions, it was assumed that there was a northwesterly wind of 10 m/s, the temperature was 38 degrees Celsius (average temperature in midday August) and the average humidity was 50%.
3.2. Delineation of the Study Area
For defining the study area, the following issues were considered:
- i.
The spatial extent of the risk zones from the occurrence of the (hypothetical) industrial accident, as determined by Aloha software;
- ii.
The allocation of the other industrial facilities subject to the Seveso Directive in the adjacent area;
- iii.
The spatial level at which the critical demographic, social and economic data were available.
The majority of the area located within the Aloha risk zone met the abovementioned criteria. However, a critical aspect that determined the final delineation of the study area was the availability of the statistical data needed for calculating the social vulnerability indices. Since statistical data were not available at the block level, the proposed spatial unit of analysis was the municipal districts with a significant part/area located within the Aloha risk zones.
In addition, areas fulfilling the following criteria were also included in the study area:
- i.
Adjacent municipal districts that were marginally affected by the accident event but, at the same time, had several Seveso facilities allocated within their administrative limits;
- ii.
Adjacent municipal districts containing critical transport infrastructure, such as port and railway facilities;
- iii.
Adjacent municipal districts that were marginally affected by the accident event but contain important environmental assets within their administrative limits. All environmentally and culturally protected areas as well as aquatic environments were considered as important environmental assets, which were considered as a multiplier factor for causing further contamination and negative effects on the environment.
The final study area to which the proposed indicator system was applied is shown in
Figure 2.
3.3. Definition of Indicators
To establish the indicator set, a literature review was performed to determine how to define vulnerability indicators as well as the components and factors affecting the vulnerability of an area. Several studies were examined to establish an indicative list of vulnerability assessment indicators. The proposed VAIS was based on [
4,
5,
6,
7,
9,
14,
15,
16,
17,
22]; data availability was also considered for the formulation of the final list.
The literature review indicated that there are four main criteria that should be considered when determining a vulnerability indicator set: (i) the spatial range of the accident, (ii) the socially vulnerable groups residing in an area with Seveso establishments, (iii) the environmentally vulnerable areas that will be affected and (iv) the infrastructure for which the operation is critical during an accident. On the basis of these criteria, three thematic vulnerability categories were identified: social vulnerability, environmental vulnerability and spatial vulnerability. For each one of these three vulnerability categories, specific quantitative and qualitative indicators were identified.
3.4. Attributing Weights to the Indicators
Given the diversity of the indicators identified in the previous step, which may include quantitative/qualitative variables and indicators, percentages and integers, and qualitative classifications of the variables etc., a ranking of their importance in the composition of the three thematic vulnerability categories was necessary. The ranking was achieved by assigning weights to each indicator under consideration for each thematic index.
To assign weights to the indicators, the Analytic Hierarchy Process (AHP) was applied [
24,
25].
Prof. Thomas L. Saaty initiated the Analytic Hierarchy Process (AHP) in 1977 [
26]. The AHP method has been extensively used in numerous fields to define and analyze user preferences across a wide variety of areas of application as well as to solve complex decision-making challenges.
The three steps of the approach are as follows:
Step 1: Creation of an matrix, where n is the number of elements compared. The relative values in the matrix are based on pairwise comparisons of each element with the others. Saaty’s fundamental scale (1–9), which is used for the comparisons, is a nine-point binary comparison scale where 1 is “equally important”, 3 is “slightly more important”, 5 is “much more important”, 7 represents “demonstrated importance” and 9 represents “absolutely more important.” The index ratings are 1/3, 1/5, 1/7 and 1/9 if the relation of importance is reversed. In the pairwise comparison, the intermediate values of 2, 4, 6 and 8 can also be used.
Step 2: Normalization of the matrix by dividing each value by the total sum of the vertical column to which it belongs.
Step 3: Calculation of the priority vector or weight by averaging the normalized values of the corresponding horizontal row.
Pairwise comparisons are based on the subjective judgment of the decision-maker. Checking the consistency of the comparison matrix and calculating the consistency index (
) (Equation (1)) and consistency ratio (
) (Equation (2)), which rate the consistency of the judgements, are important for determining the decision’s validity.
where the value
corresponds to the sum of the elements of the column of each criterion of the
matrix with the corresponding priority vector, and
is the number of evaluation criteria.
where
is the random consistency index; its value depends on the size of the matrix (
) [
27]. The results are acceptable and reliable when the consistency ratio (
) is less than 0.1 (
≤ 0.1).
In our study, the pairwise comparisons were based on: (i) the ranking of different indicators and variables from the literature review (e.g., [
4,
5,
17,
22]), and (ii) the critical perceptions of the authors.
3.5. Assessment Matrix
The main objective of this step was to determine the overall vulnerability of an area (spatial unit) based on the three vulnerability categories (social, environmental and spatial). To assess the vulnerability levels of each spatial unit, the Technique for Order Preference by Similarity to the Ideal Solution (TOPSIS) method was used [
28,
29]. The results of this stage contributed to the ranking of the spatial units of the study area according to their overall vulnerability level.
TOPSIS is a straightforward and computationally efficient technique for selecting the best solution from a set of alternatives, taking a set of predefined criteria into account [
25]. The method’s core idea is that the chosen solution must be as close as possible to the most desired value (ideal solution) and as far away as possible from the least desired value (the non-ideal solution). Priority can be given to alternative solutions on the basis of a comparison of the relative distance to the most and least desired values.
The following steps were followed to apply TOPSIS [
28,
29].
After we had defined the initial assessment matrix, which consisted of alternatives (spatial units) and criteria (indicators), the approach involved the following five steps. The intersection of each alternative with each criterion is shown by :
Step 1: Normalization of the initial assessment matrix.
Equation (3) was used to normalize each element of the original evaluation matrix.
where
i = 1,…,
n is the number of alternatives, and
j = 1,…,
m is the number of criteria:
Step 2: Calculation of the weighted normalized decision matrix.
Equation (4) multiplies the weights of each criterion by the weights of the normalized values of the alternatives to provide the weighted normalized decision matrix.
where
is the weight of the j-th assessment criterion.
Step 3: Determination of the ideal (
and the non-ideal (
ideal solutions using Equations (5) and (6), respectively [
30].
where
is used for the benefit criteria and
is used for the cost criteria.
Step 4: Computation of the Euclidean distance of the alternatives from the ideal and the non-ideal solutions, using Equations (7) and (8) as follows:
Step 5: Calculation of the relative closeness
) of each alternative to the ideal and the non-ideal solution through Equation (9).
A value close to 1 indicates a spatial unit with fewer vulnerability issues within the specific vulnerability category, while a low relative closeness coefficient indicates a more vulnerable spatial unit.
Step 6: Ranking the alternatives based on the order of preference (the value of the relative closeness for each one of the three vulnerability categories.
4. Results and Discussion
4.1. A Short Profile of the Study Area
The proposed indicator system was applied in the west area of the city of Thessaloniki. Thessaloniki is the second largest city in Greece (after Athens) and is one of the largest urban centers in the Balkans. Administratively speaking, the county of Thessaloniki, the largest part of which now constitutes the metropolitan area of Thessaloniki, is divided into 14 municipalities, 4 of which compose the study area. The study area covers the historic center and the western inner and outer zone of the city, with 669,326 inhabitants, accounting for 64% of the county’s population [
31]. If we exclude the central–historic municipality of Thessaloniki, the rest of the study area is inhabited by mostly working-class citizens with cheap and poor-quality housing [
32]. In addition, this area has a concentrated (more than the county’s average) immigrant population that can be up to 5.6% of the total population of the study area. In terms of the education level, the study area has, relative to the rest of the county, low literacy rates (only 21% finished primary school and 15% have an undergraduate degree, according to the 2011 Census Count). In terms of unemployment, this area has relative high unemployment rates of up to 12% [
31].
The city of Thessaloniki is an international transport node. It is connected to the two major trans-European transport networks (PATHE and Egnatia Motorway) and is a node for all major national and international rail lines. The study area includes critical transport facilities such as the commercial and passenger port and train stations. The spatial pattern of the main economic activities is dominated by industry, including clusters of wholesale, commercial and transport services located at the western edge of the study area. The study area includes a concentrated industrial zone as well as scattered industrial facilities. Agriculture is also an important economic activity in the southwest part of the county, which belongs to the large basin of Central Macedonia. Thessaloniki has some very important natural ecosystems, including the Axios Plain and the Axios–Gallikos–Loudia Delta within the study area.
4.2. VAIS
In line with the literature review, the proposed system of indicators comprised three vulnerability dimensions: social, environmental and spatial. Each of the vulnerability categories included several sub-indicators, a description of which is presented in
Table 1. It should be noted that the final list of indicators was determined by the literature review and the availability of the data.
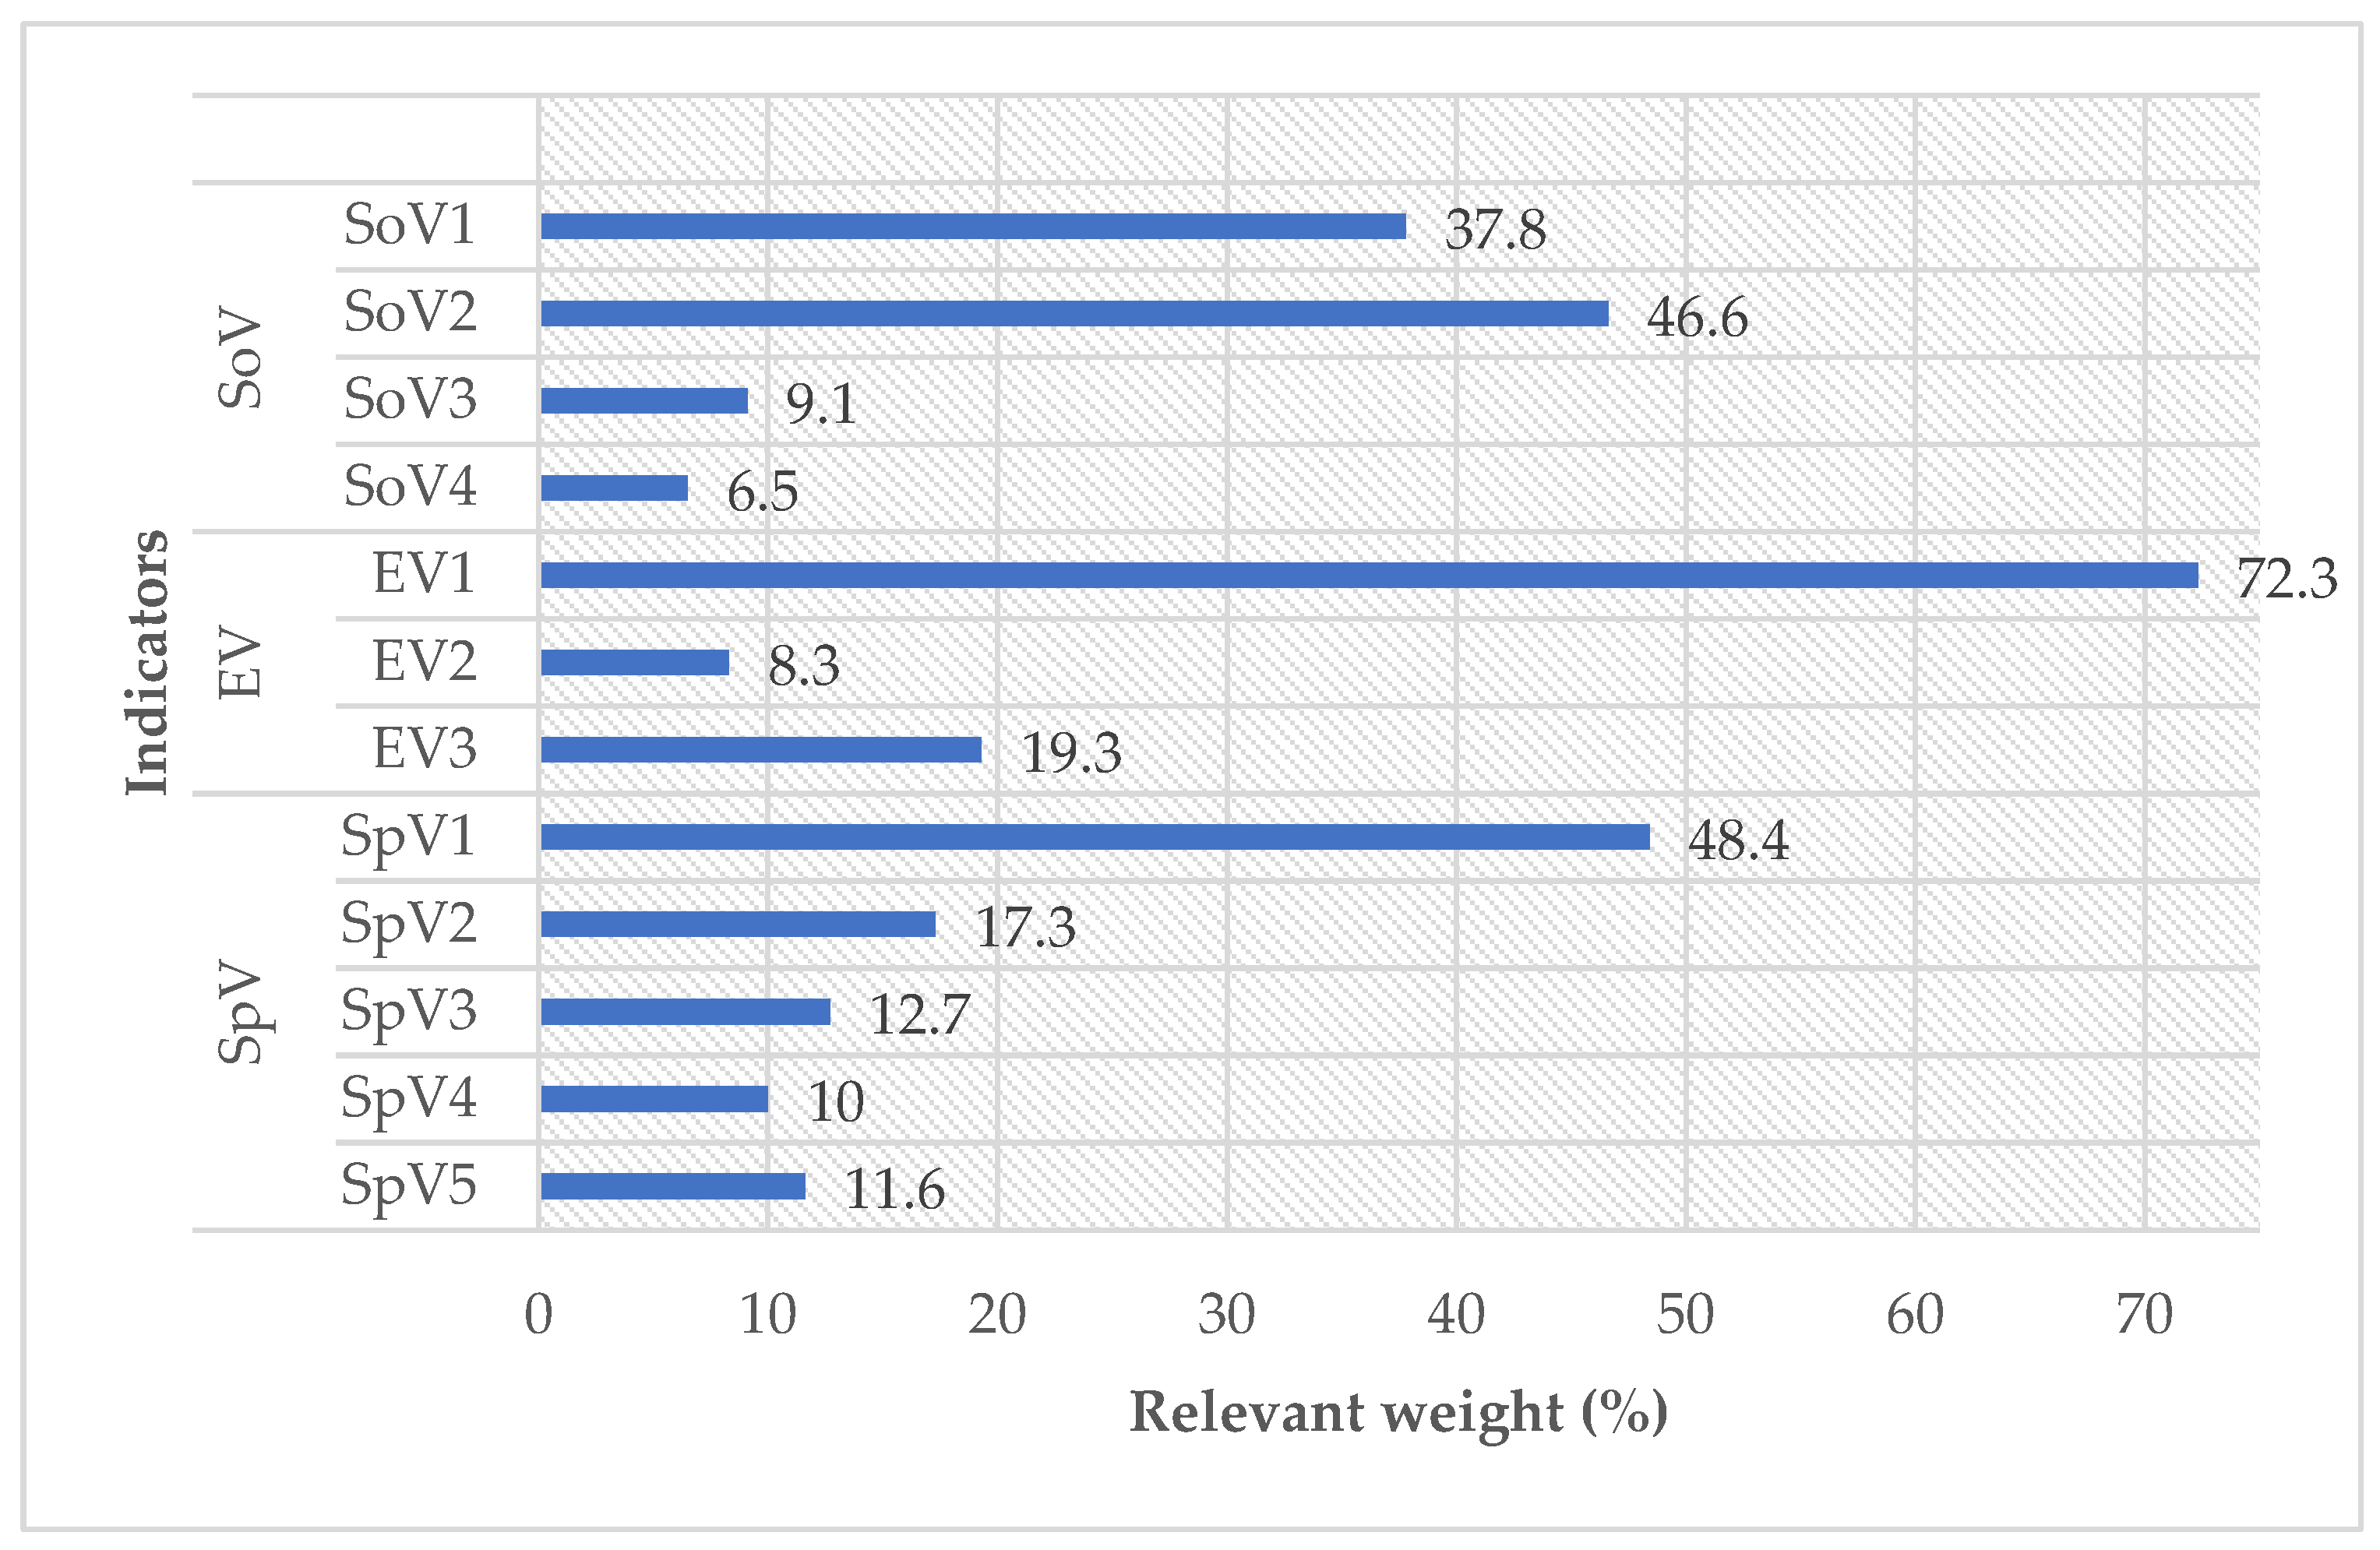
The final list of indicators included four SoV, three EV and five SpV indicators.
4.3. Indicators’ Weights
As mentioned in
Section 3, the importance of each indicator over the others was established and quantified using Saaty’s scale through pairwise comparison of the indicators. The results of the computation process described in
Section 3.4 are presented in
Figure 3. It should be noted that the computation of CR (Equation (2)) was lower than the limit of 0.1 for SoV, EV and SpV, and was used to confirm the consistency of the pairwise comparison matrices.
From
Figure 3, it can be seen that the relative weights of SoV2, EV1 and SpV1 had the largest values (equal to 46.6%, 72.4% and 48.4%, respectively, of SoV, EV and SpV), indicating that the age of the population, the environmental protection status and the accident’s spatial range were the most important indicators for determining the vulnerability ranking of the MDs in the study area.
Regarding SoV, the indicator SoV2 was next, with a relative weight equal to 46.6%, while the rest of the indicators, in decreasing order of priority, were ranked as follows: SoV3 and SoV4. Thus, educational level and economic status did not contribute significantly to the vulnerability ranking of the MDs.
Continuing with EV, the rest of the indicators, in decreasing order of priority, were ranked as follows: EV3 and EV2. Therefore, proximity to critical water bodies and the percentage of the flood zone within the accident area per municipal district contributed slightly (27.6%) to the vulnerability ranking of the MDs.
Regarding SpV, the indicator SpV2 was ranked second, with a relative weight equal to 17.3%, while the rest of the indicators were ranked as follows, in decreasing order of priority: SpV3, SpV5 and SpV4. It should be noted that the relative weights of SpV1, SpV2 and SpV3 corresponded to 78.4%, and therefore the vulnerability of an MD strongly depends on the accident’s spatial range, the population density and the number of educational facilities.
4.4. Vulnerability Ranking of the Municipal Districts
The ranking of the MDs for each of the vulnerability components, based on the relative closeness (
), is shown in
Table 2.
The application of TOPSIS for the social vulnerability indicator system highlighted that the MDs of Diavata and Kalochori (MD6 and MD7) were the most socially vulnerable ones, with MD6 in first place in the column. On the other hand, the MDs of Evosmos and Thessaloniki (MD4 and MD1) emerged as the least socially vulnerable areas in the case of a major accident. If we take the weights assigned to each indicator alongside the characteristics of MD6 into account, as indicated by indicators’ values in the assessment matrix, it can be concluded that the application of TOPSIS highlighted what was also observed in the analysis. Similarly, in the case of MD4, the TOPSIS results verified the initial findings from the calculated variables.
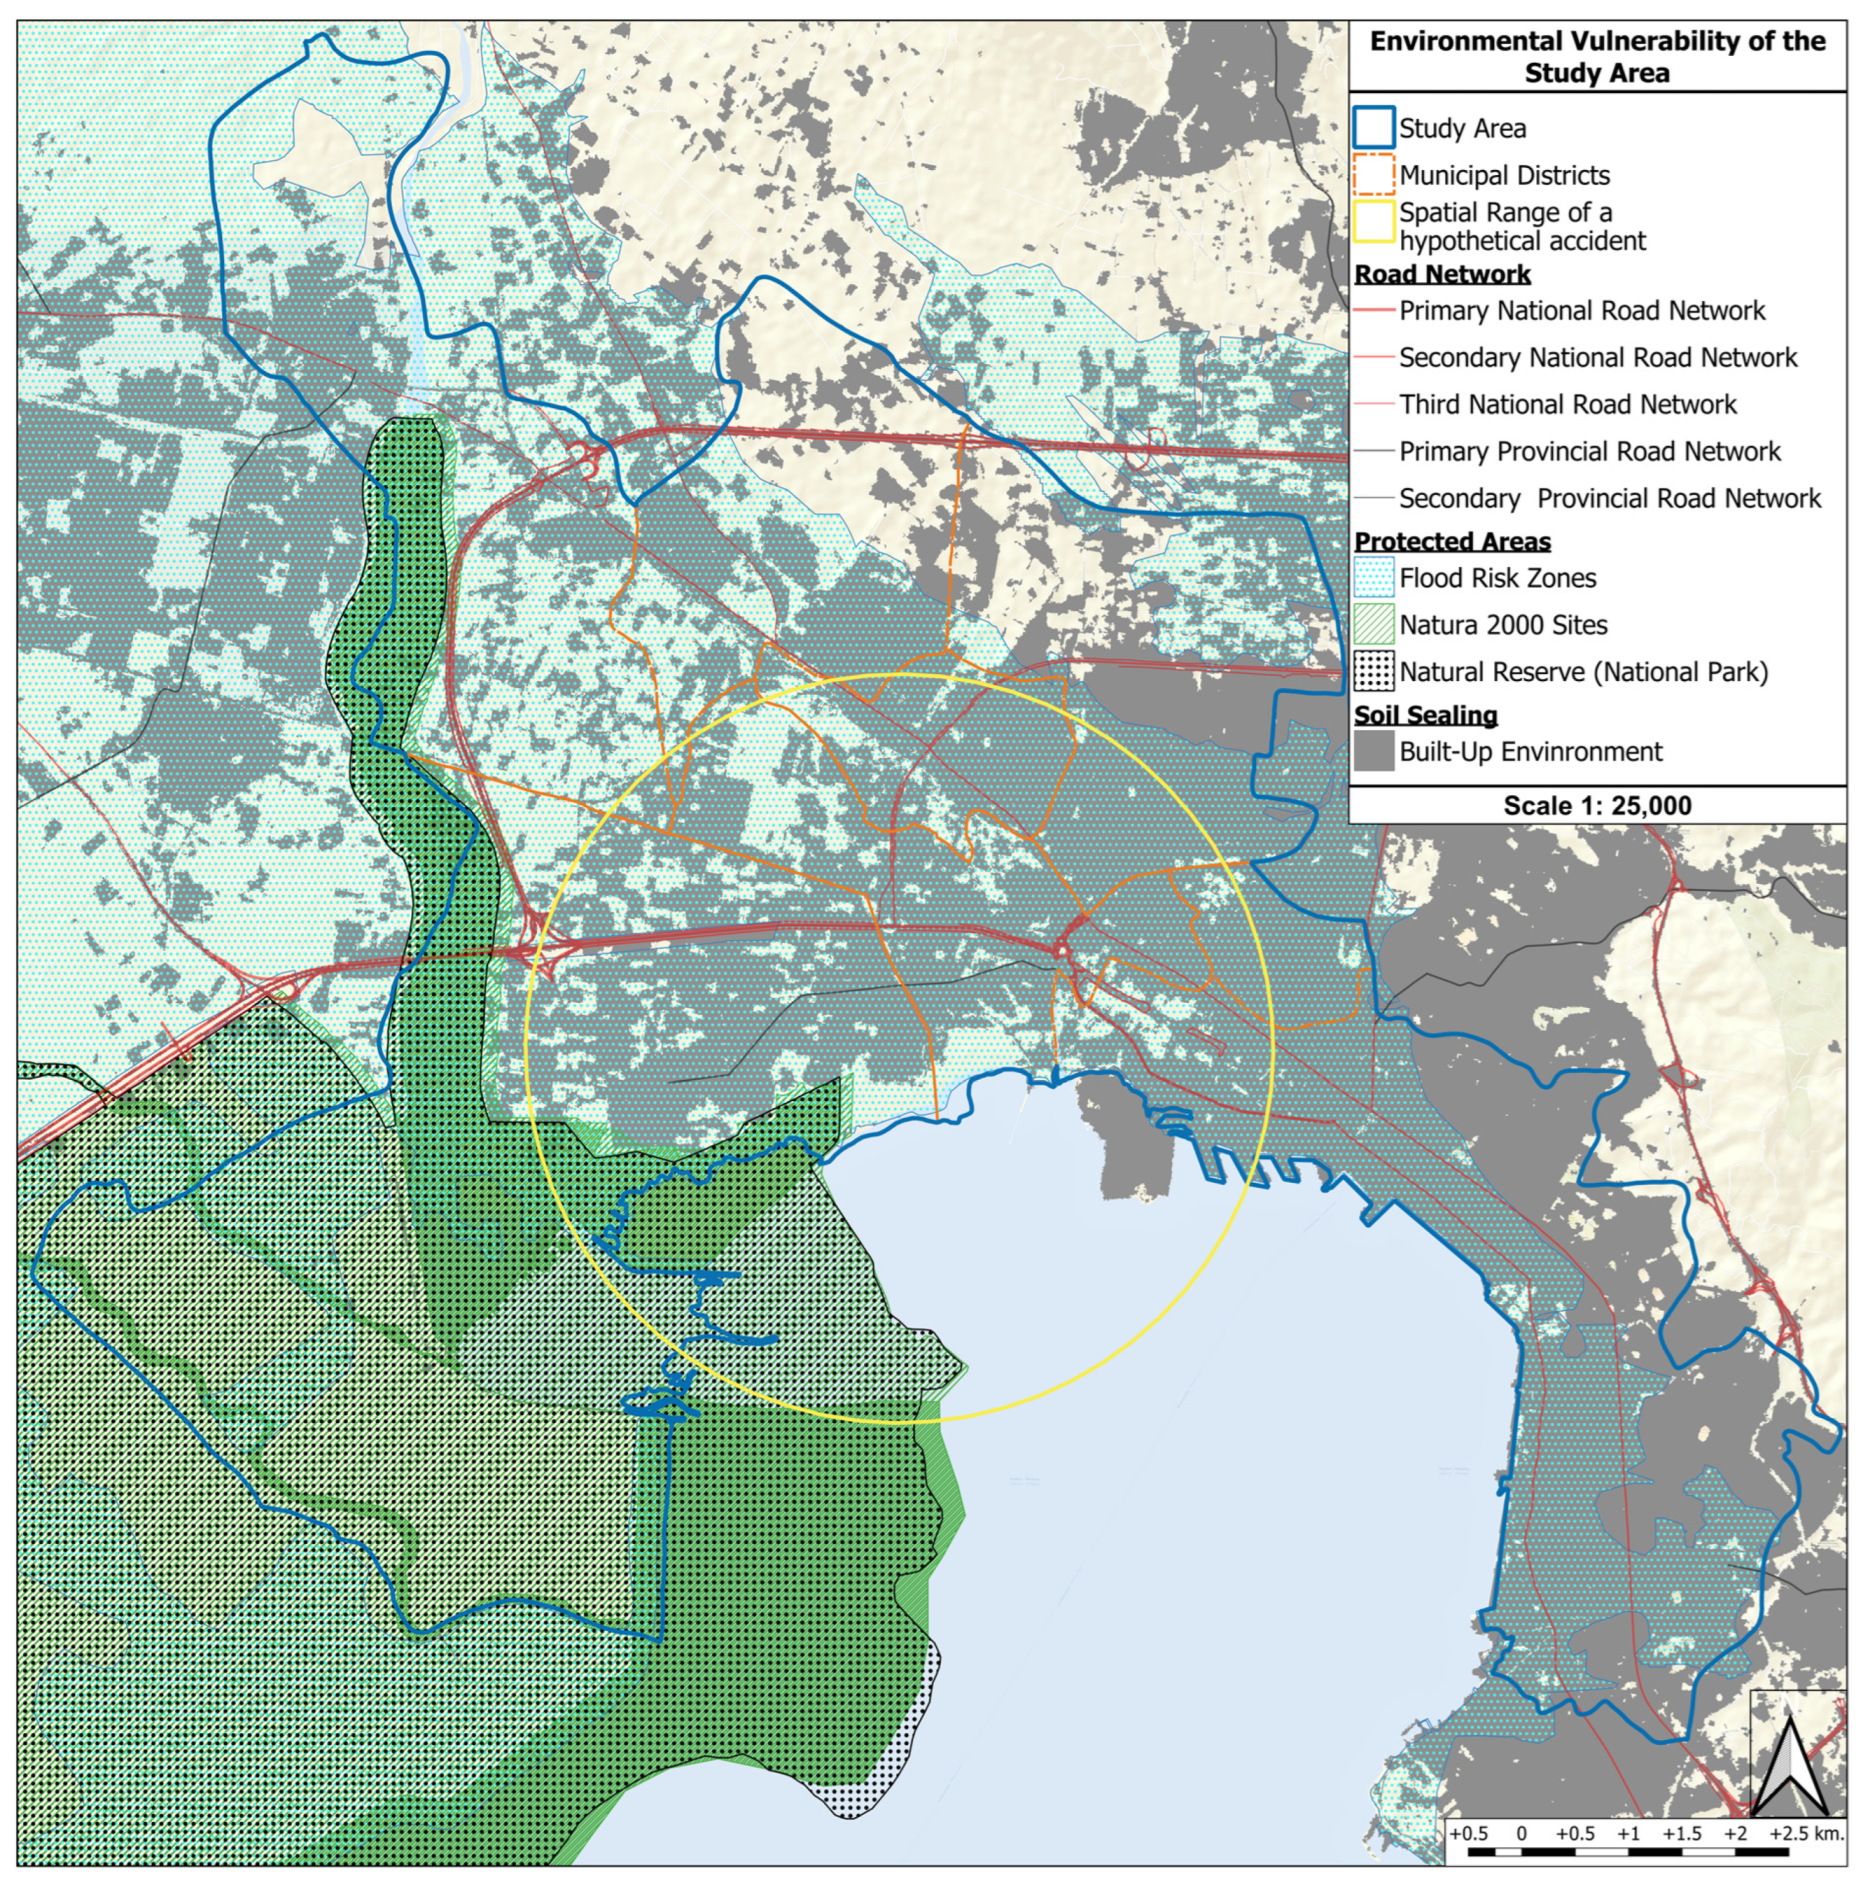
Regarding environmental vulnerability, Kalochori (MD7) was recorded as the most environmentally vulnerable area, while Diavata (MD6) was identified as the least environmentally vulnerable area. The results of the TOPSIS analysis were also in line with the primary data, especially considering the fact that MD7 has the most sensitive and ecologically valuable environmental elements that are expected to be affected by the occurrence of a major accident.
The following map (
Figure 4) depicts the areas of environmental vulnerability in the study area. Within the accident’s range, the majority of the MDs, especially the MDs of Kalochori, Menemeni, Elefterio Kordelio, Evosmos, Ampelokipi and Thessaloniki (MD7, MD3, MD5, MD4, MD2, MD1), included areas with a high flood risk. MD7, which emerged as the most environmentally vulnerable unit, includes, in addition to areas with a high flood risk, the protected area of NATURA and a natural reserve (national park). It also has a coastline where valuable wetlands are located. The MDs of Menemeni and Thessaloniki (MD3 and MD1) are also in proximity to the sea, increasing their environmental vulnerability.
In terms of spatial vulnerability, Kalochori (MD7) was recorded as the most vulnerable municipal district, while Ampelokipoi (MD2) was the least vulnerable district. The second most spatially vulnerable area was the MD of Menemeni (MD3). The results derived from the application of TOPSIS were once more in line with the calculated indicators. In particular, considering that Kalochori and Menemeni are the areas that would be directly influenced by the occurrence of an accident and that a number of Seveso facilities and critical infrastructure are located here, this classification accurately reflects the relative spatial vulnerability.
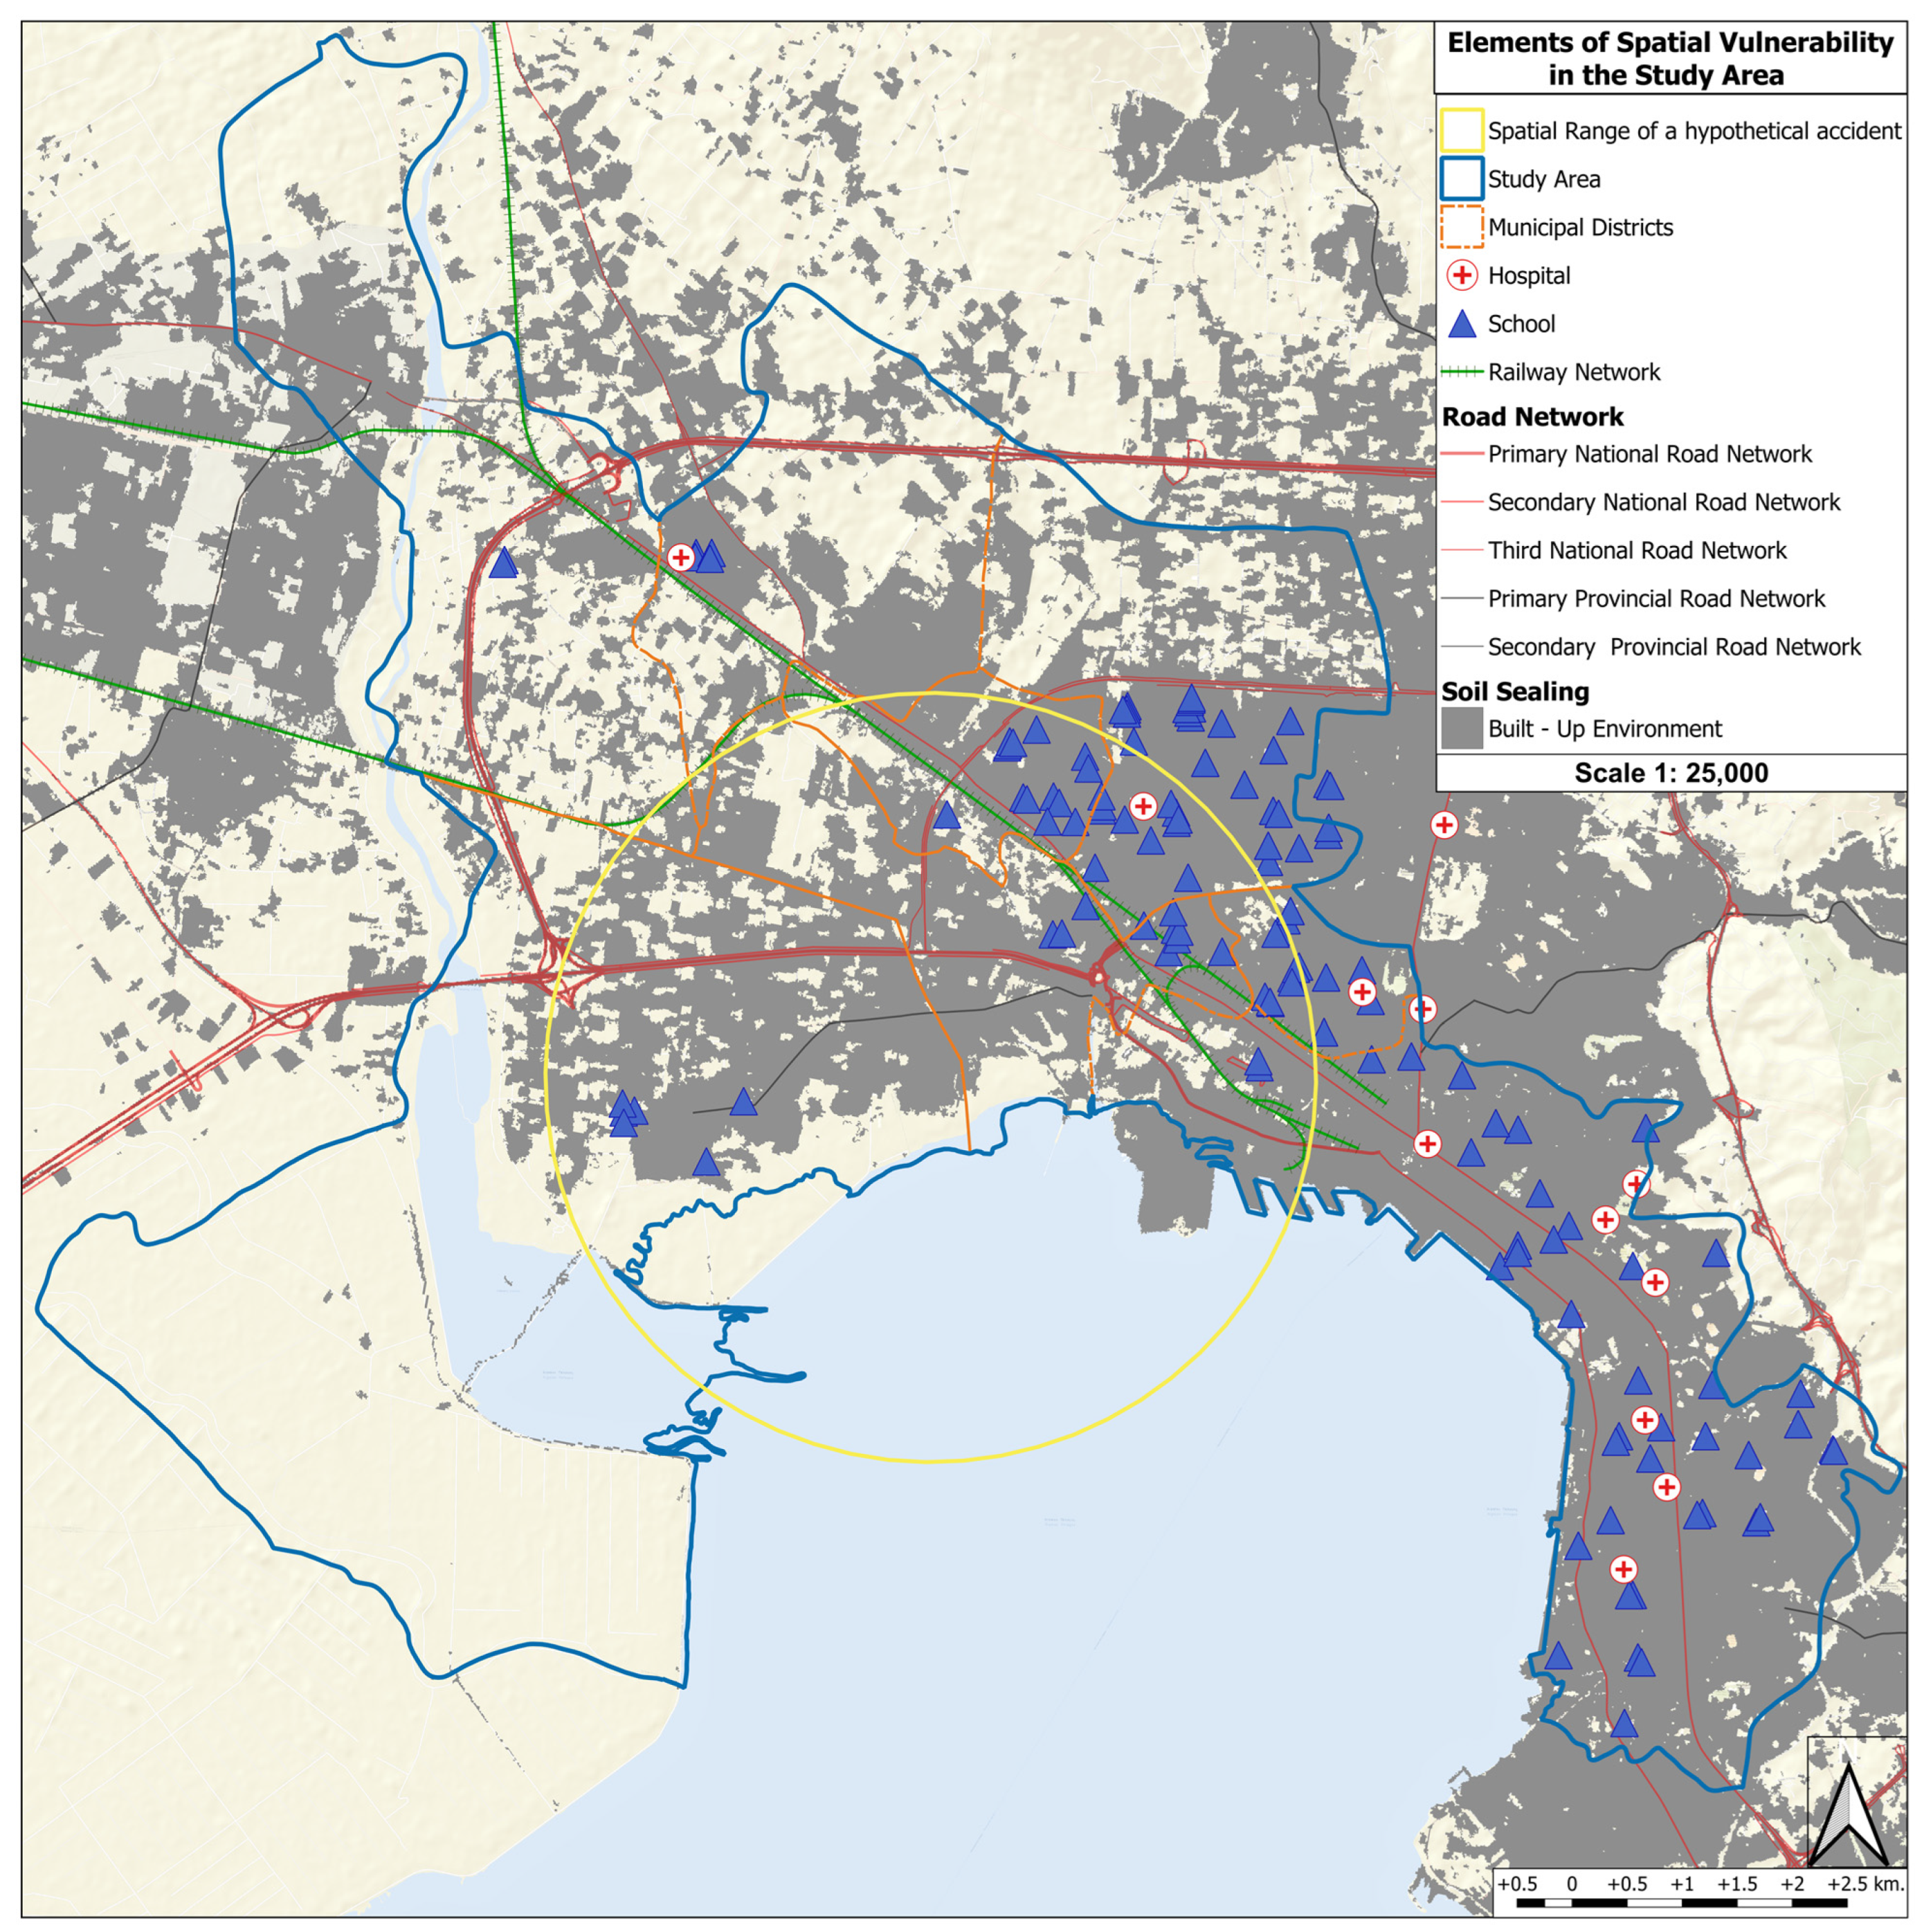
The following map (
Figure 5) depicts the elements of spatial vulnerability. For the MDs of Kalochori and Menemeni (MD7 and MD3), which are highlighted as the most spatially vulnerable areas, it is noted that a large part of their area is located within the accident’s range. In the same MDs, a substantial number of Seveso facilities are located, as well as critical elements of the transport infrastructure, such as primary roads and the rail network. The MDs of Thessaloniki and Elelefterio Kordelio (MD1 and MD5) also have a substantial amount of critical infrastructure within their jurisdiction, such as health facilities and schools, which, combined with the transport infrastructure, ranked them third and fourth in terms of spatial vulnerability.
Based on these classification results, the MD of Kalochori (MD7) was the most vulnerable MD in the study, while the least vulnerable ones varied, depending on the vulnerability category considered. The differences in the individual vulnerability categories (social, environmental and spatial), which resulted in intermediate vulnerability rankings, were expected, especially considering the heterogeneity of the MDs within the study area.
5. Conclusions
Spatial planning can provide the context for assessing and preventing the consequences of large-scale industrial accidents. The risk of an industrial accident’s occurrence, and the need to avoid, reduce and mitigate such accidents are directly linked to its spatial sphere of influence. The need to assess risk is associated with critical spatial and socioeconomic features, and risk can be seen as a key component of spatial planning policies.
This study has provided a methodological approach for deploying an appropriate set of indicators that could be used to determine the vulnerability of areas hosting Seveso facilities, contributing to spatial planning, decision-making and the creation of spatial policies and developmental trajectories.
The proposed Vulnerability Assessment Indicator System (VAIS), which measures the vulnerability of the areas located near Seveso facilities, is based on three aspects of vulnerability associated with the areas around Seveso facilities, namely the social, environmental and spatial vulnerability. Each aspect includes several indicators. Multicriteria analysis methods (AHP and TOPSIS) were used to rank the municipal districts (MDs) of the study area on the basis of their vulnerability.
According to the results, the relative weights of SoV2, EV1 and SpV1 had the largest values within the social, environmental and spatial aspects of vulnerability, respectively, indicating that the population’s age, the environmental protection status and the accident’s spatial range are the most important assessment indicators for determining the vulnerability ranking of MDs in the study area. In terms of the vulnerability ranking of the examined areas, there was a convergence regarding MD7, which had the highest vulnerability and therefore requires more attention during planning processes. This MD includes numerous Seveso facilities as well as a number of sensitive areas (e.g., protected areas and water bodies) that were indicated through the selected indicators of the VAIS.
This study tried to use an integrated system of indicators for assessing the vulnerability of areas near Seveso establishments. The whole methodology may prove to be a very helpful instrument in decision-making processes when used either by individuals or relevant authorities who are qualified to design and implement a site-specific security management system. It should be noted that, to the authors’ knowledge, this is the first time that all three aspects of vulnerability (social, environmental, and spatial) have been considered in an integrated system of indicators.
A weakness of the proposed methodology is the lack of specific expertise and knowledge in assessing the risk of an industrial facility, and the lack of deployment of a precise hypothetical scenario of a large-scale industrial accident that could precisely identify the spatial range and the consequences of the accident, and the exact study area. In addition, the inability to access fine-grain demographic data (i.e., in building blocks) has limited a detailed evaluation of the problem and the possibility of obtaining more precise results regarding the site, the study area and the vulnerability ranking. The reliability and accuracy of the data is of utmost importance. On the one hand, the examined Seveso industrial facilities should provide an exact inventory of the hazardous chemicals; on the other, several aspects that describe the SoV, such as the demographic data, may vary from time to time, as some of the residents in industrial areas reside there temporarily. In order to implement a vulnerability-based integrated risk management approach, close cooperation among industries, regulatory bodies and the local community is required.
Further research should include (i) the formulation of various hypothetical accident scenarios in the study area and a comparison of the MDs’ vulnerability rankings, and (ii) quantification of the pairwise comparisons based on the needs and specifications of the relevant stakeholders and/or policy-makers. The applicability of the VAIS and the generalizability of the results to other case studies will also enhance the reliability of the proposed methodology.


