
System Dynamics Theory Applied to Differentiated Levels of City–Industry Integration in China

Abstract
:1. Introduction
2. Methodology
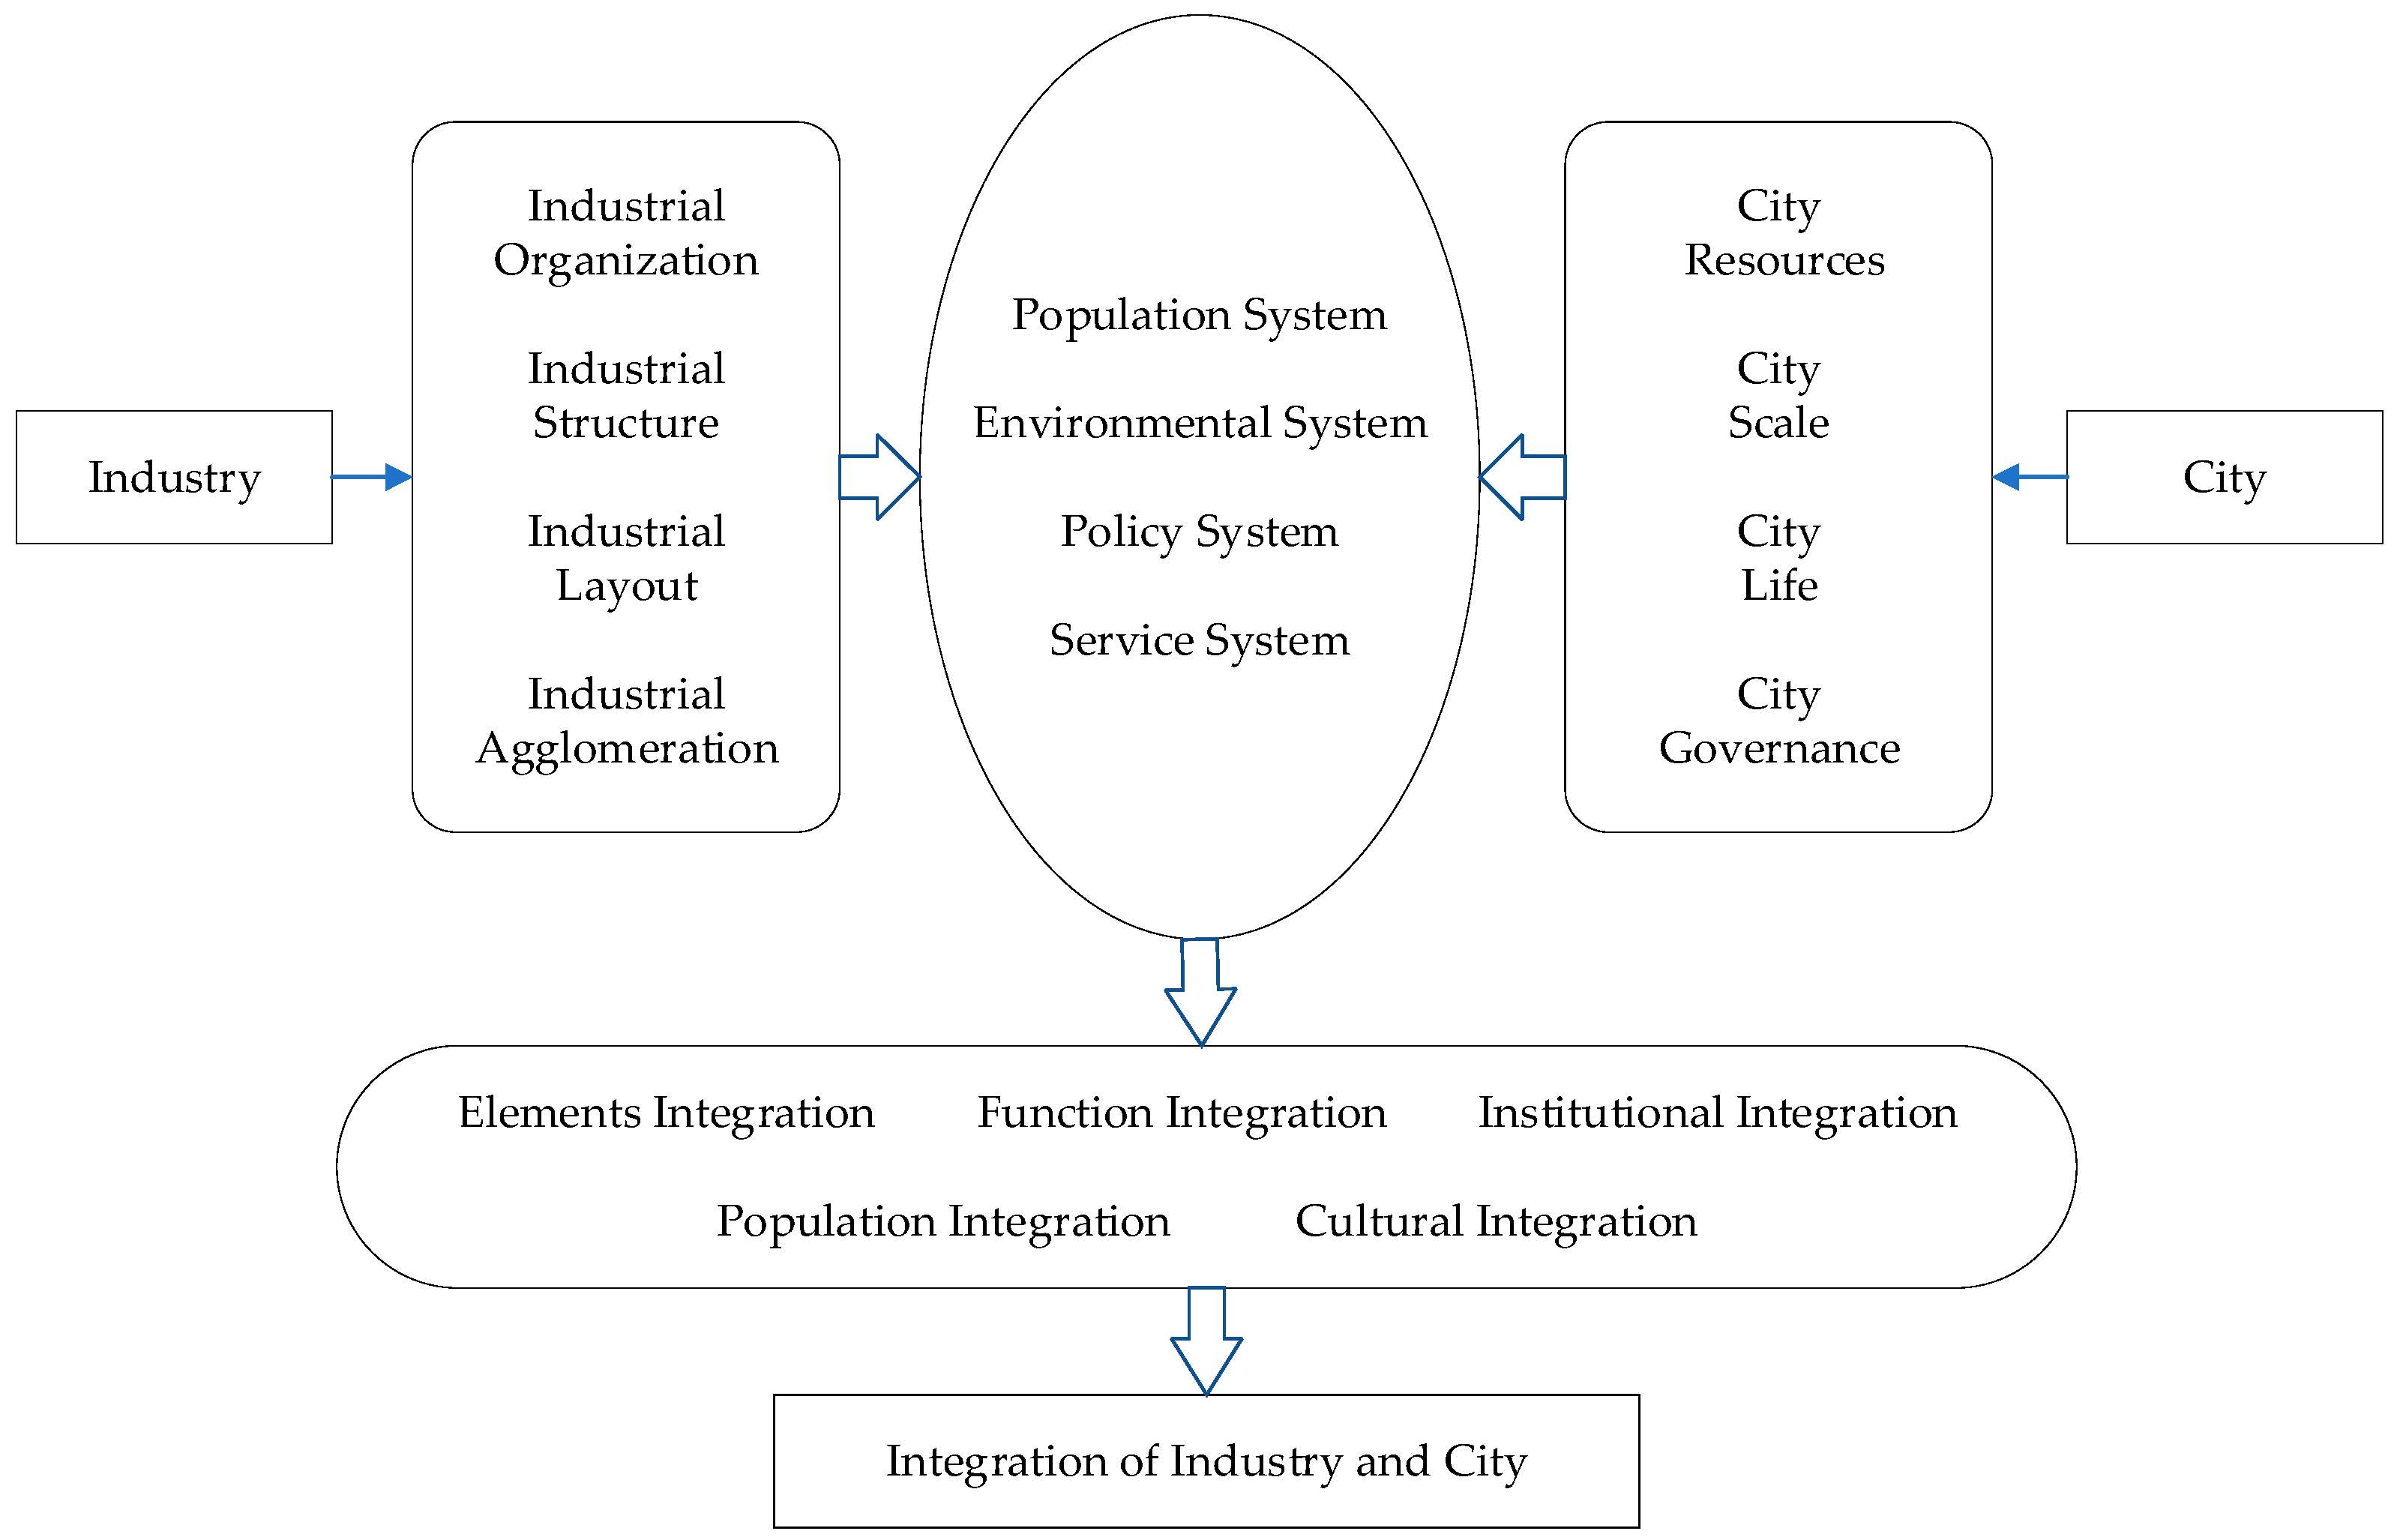
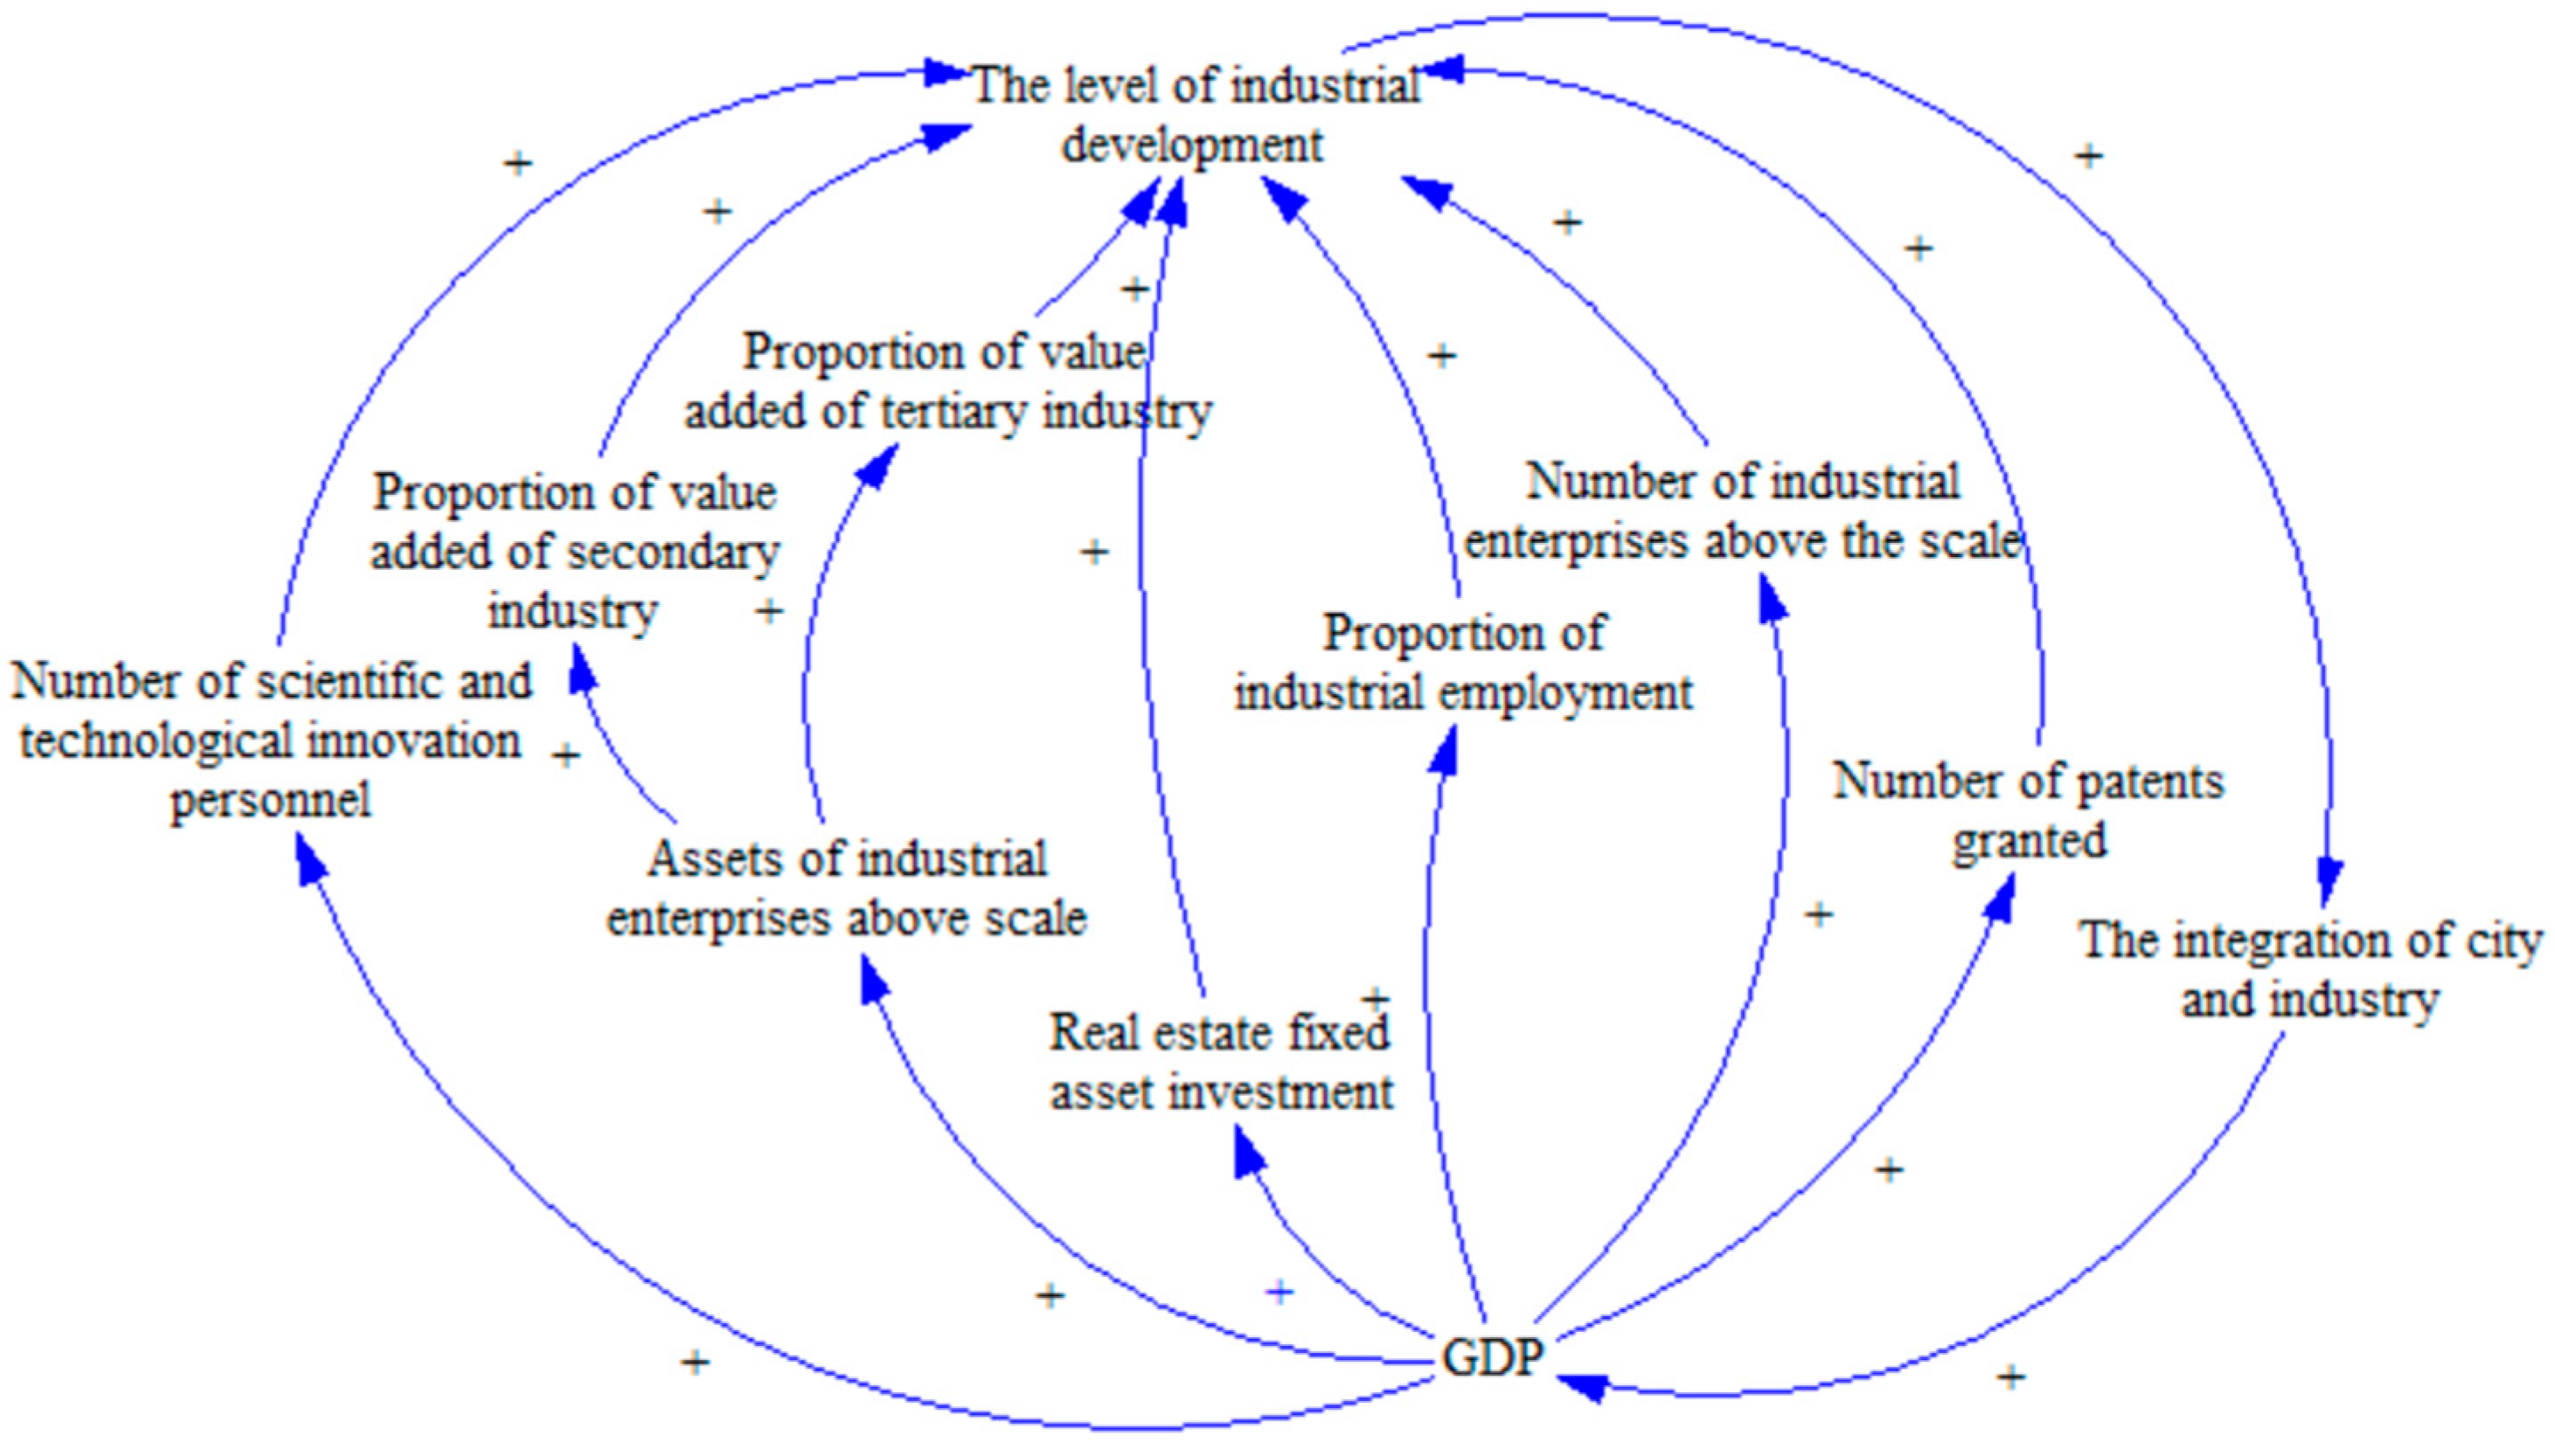
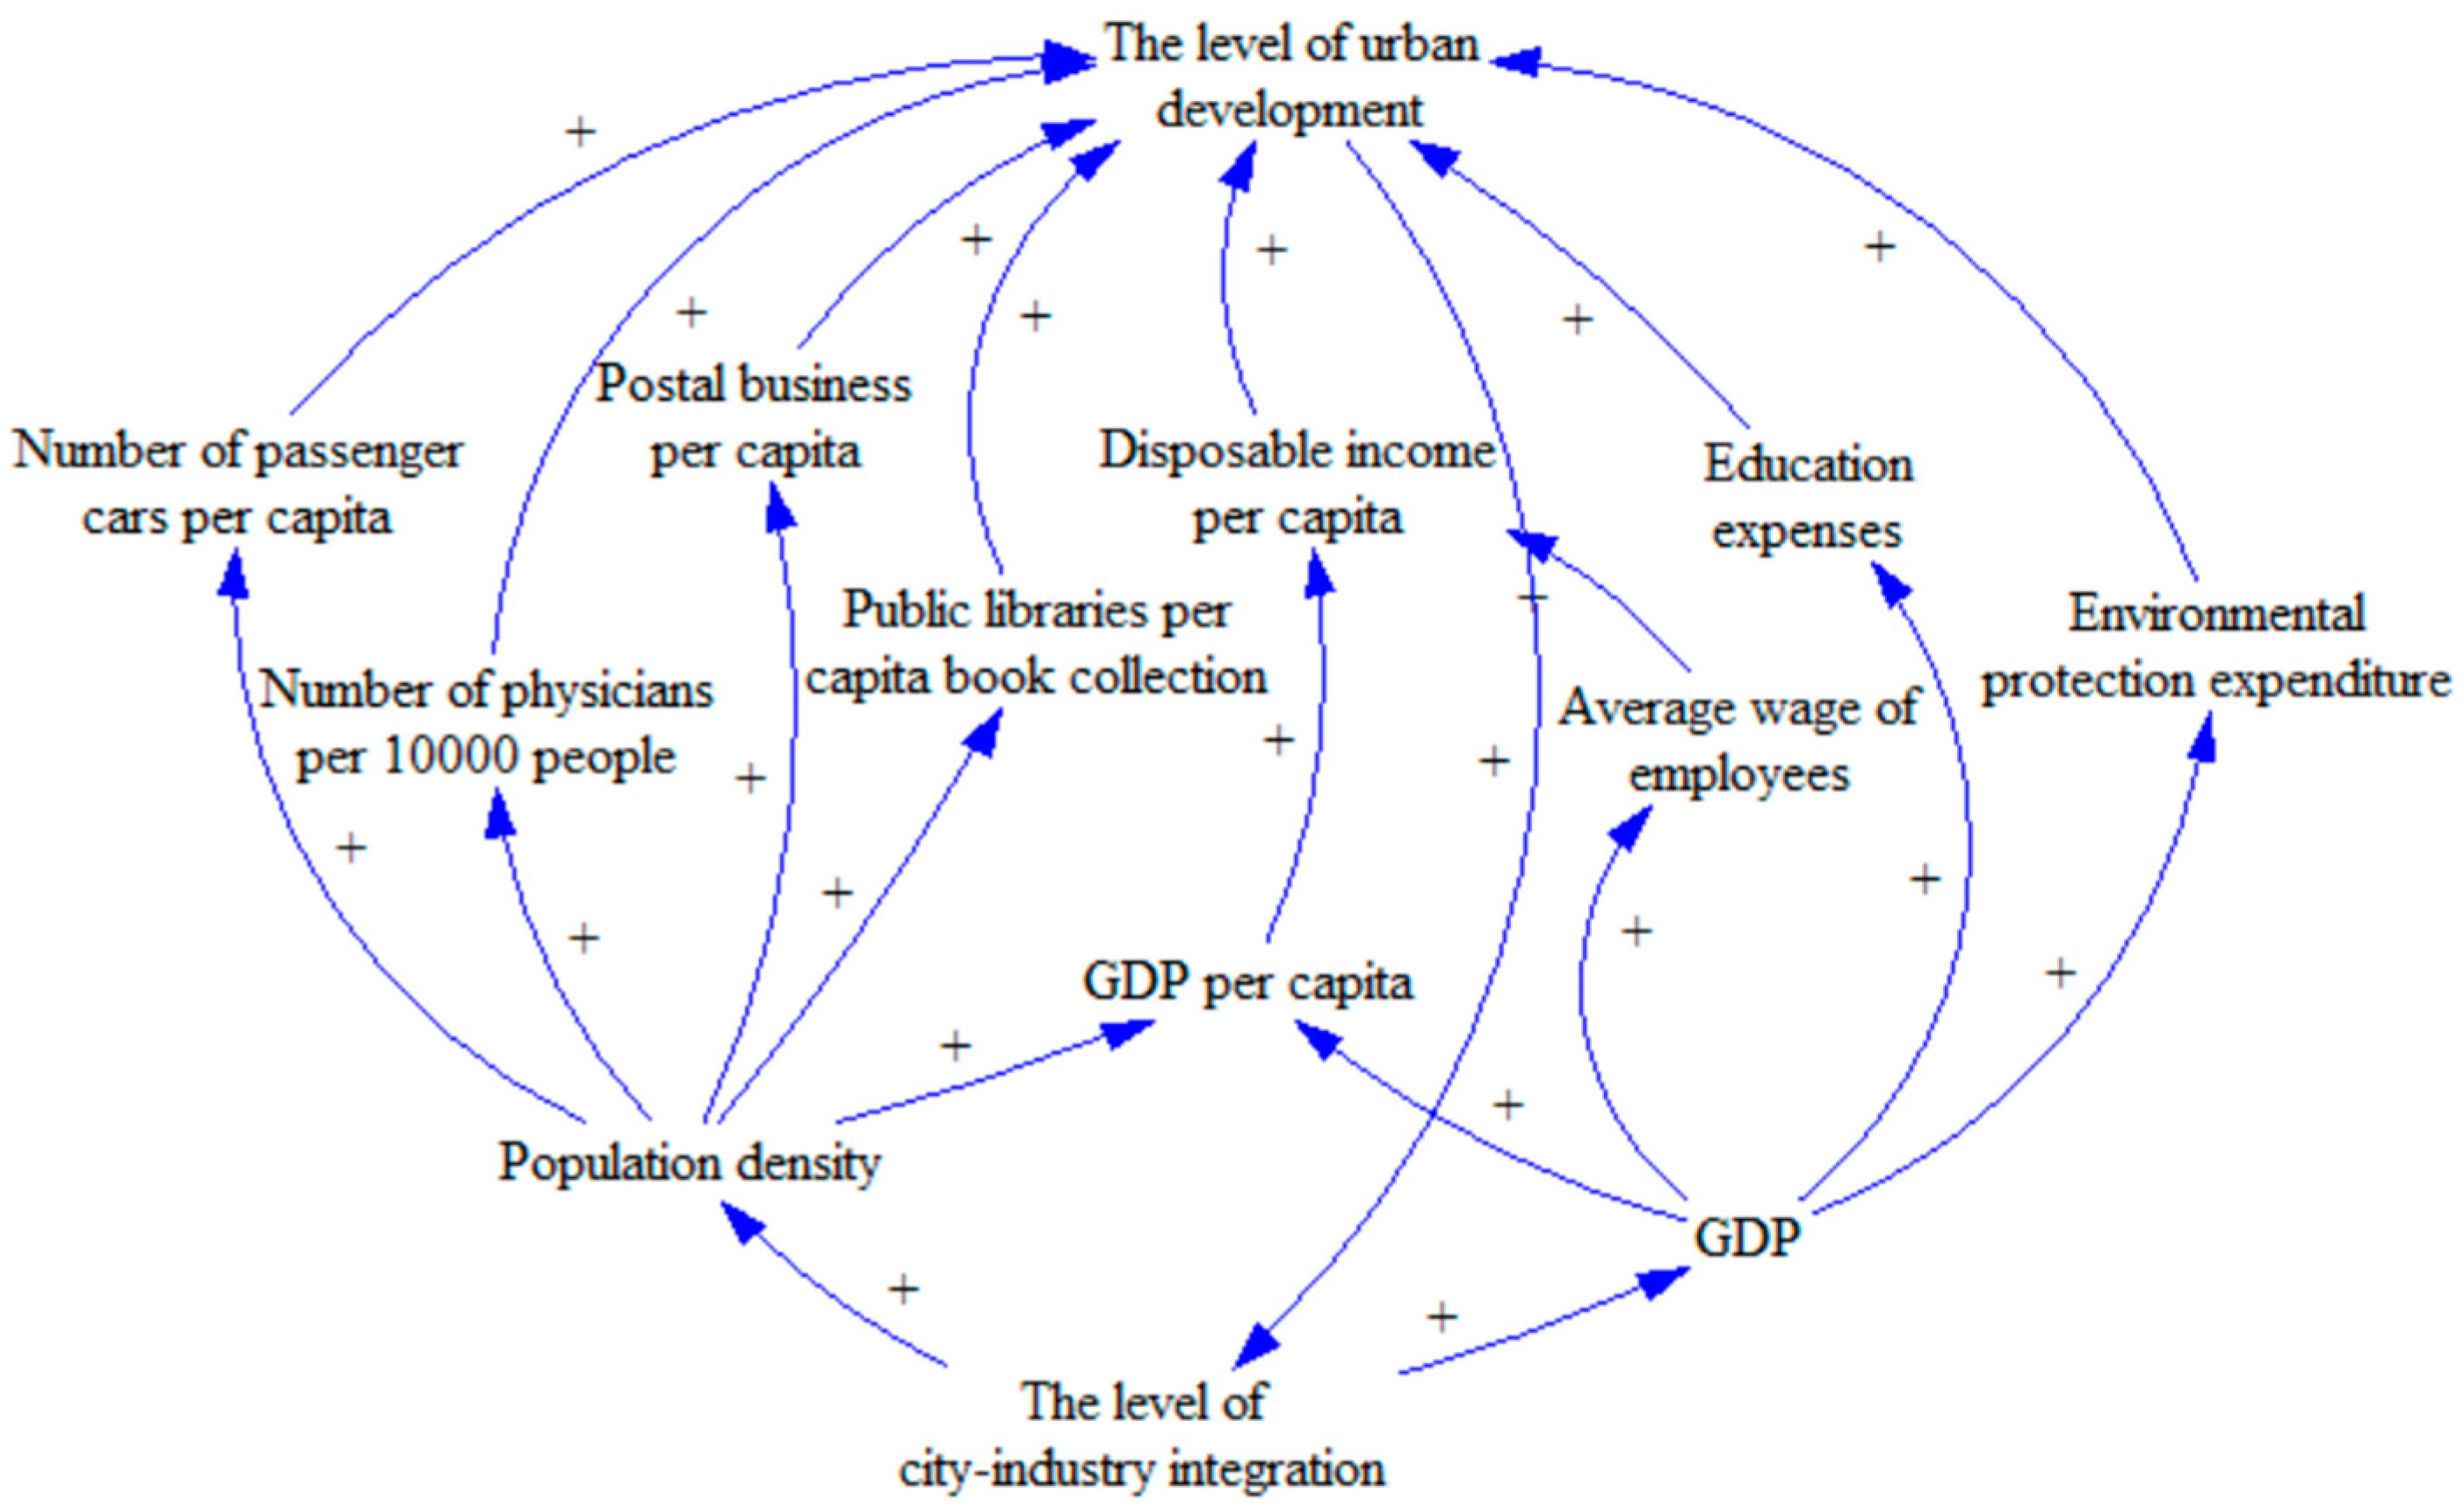
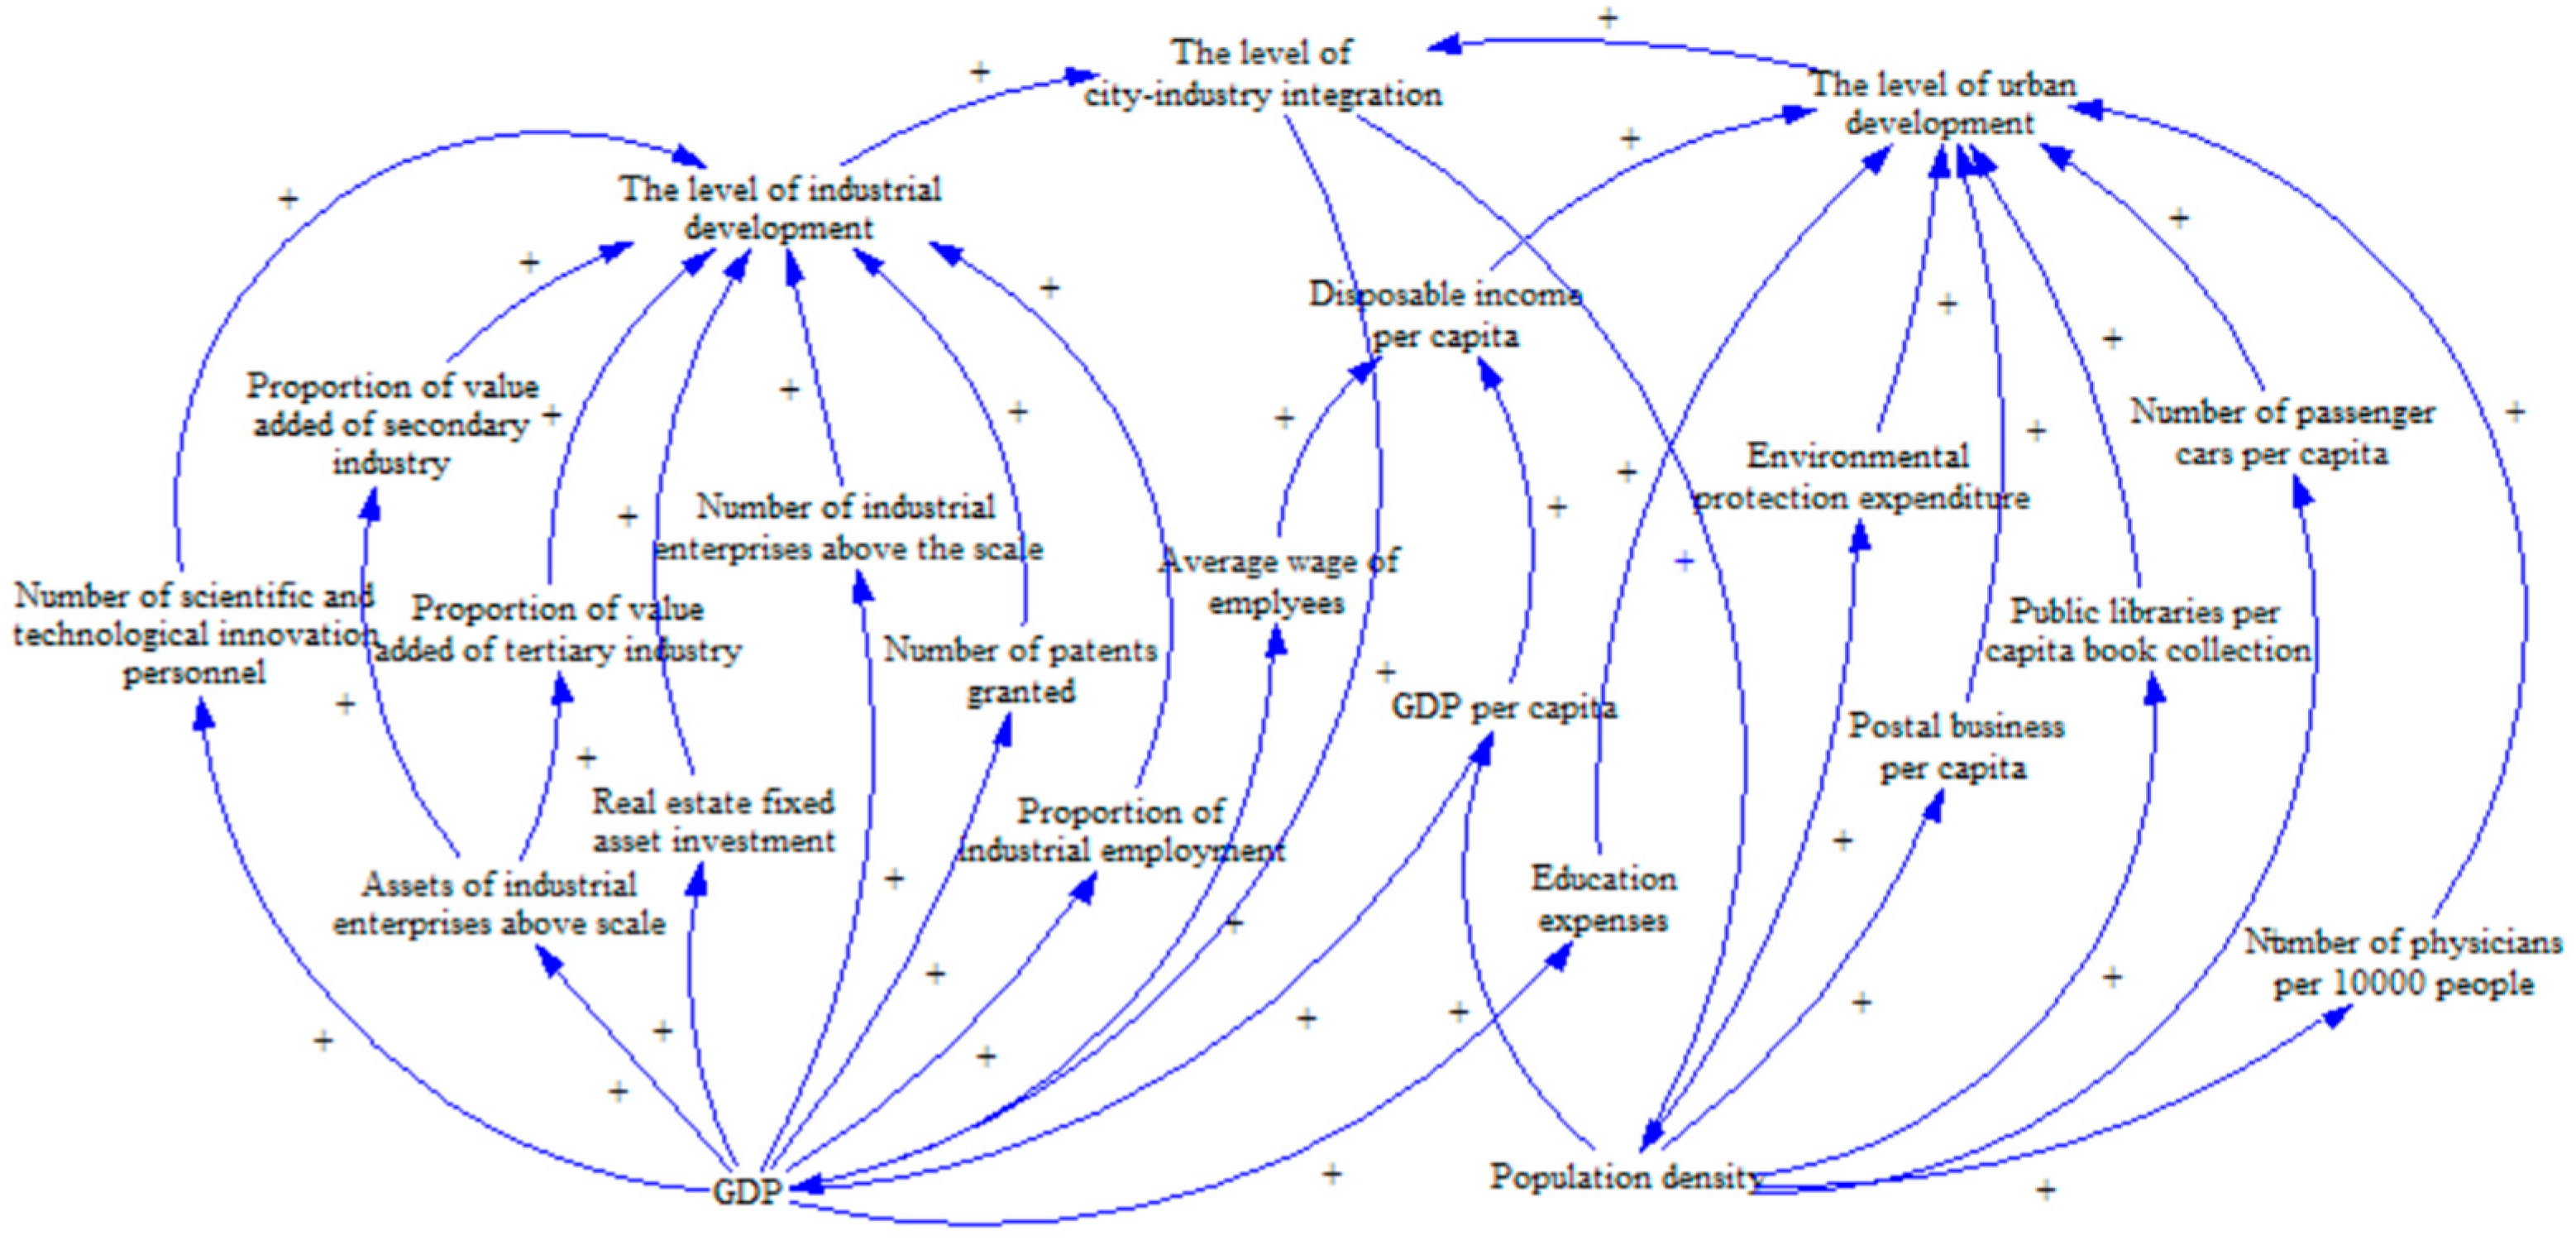
2.1. Construction of the System Dynamics Model
2.2. Construction of an Index System
2.3. Data Processing
3. Results and Discussion
3.1. Results of Factor Analysis
3.2. Results of Entropy Weight
3.3. Results of the Integration Level
4. Conclusions
Author Contributions
Funding
Institutional Review Board Statement
Informed Consent Statement
Data Availability Statement
Acknowledgments
Conflicts of Interest
Appendix A

| Province | Level of City–Industry Integration F | Ranking | ||
|---|---|---|---|---|
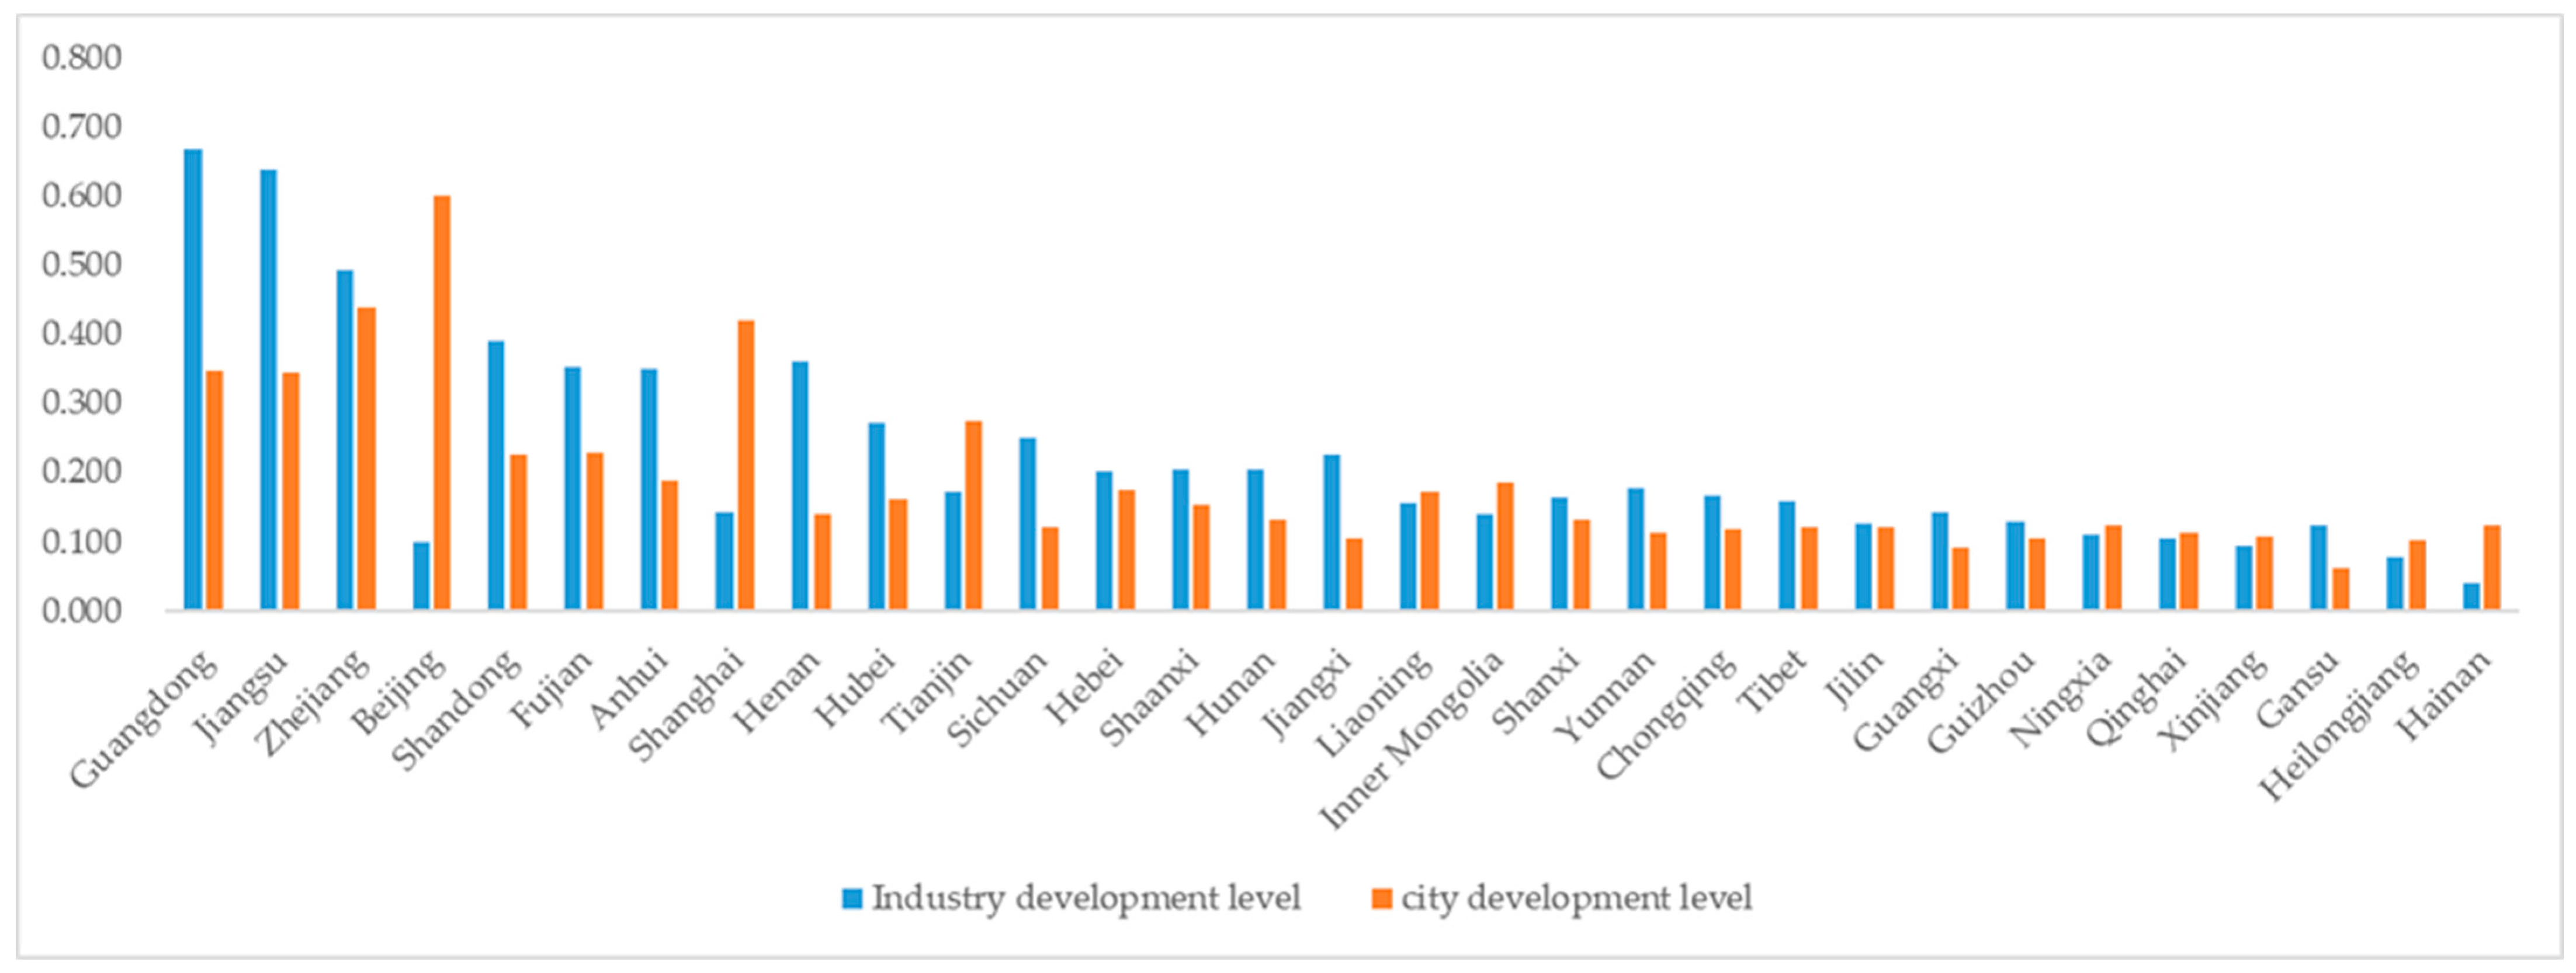
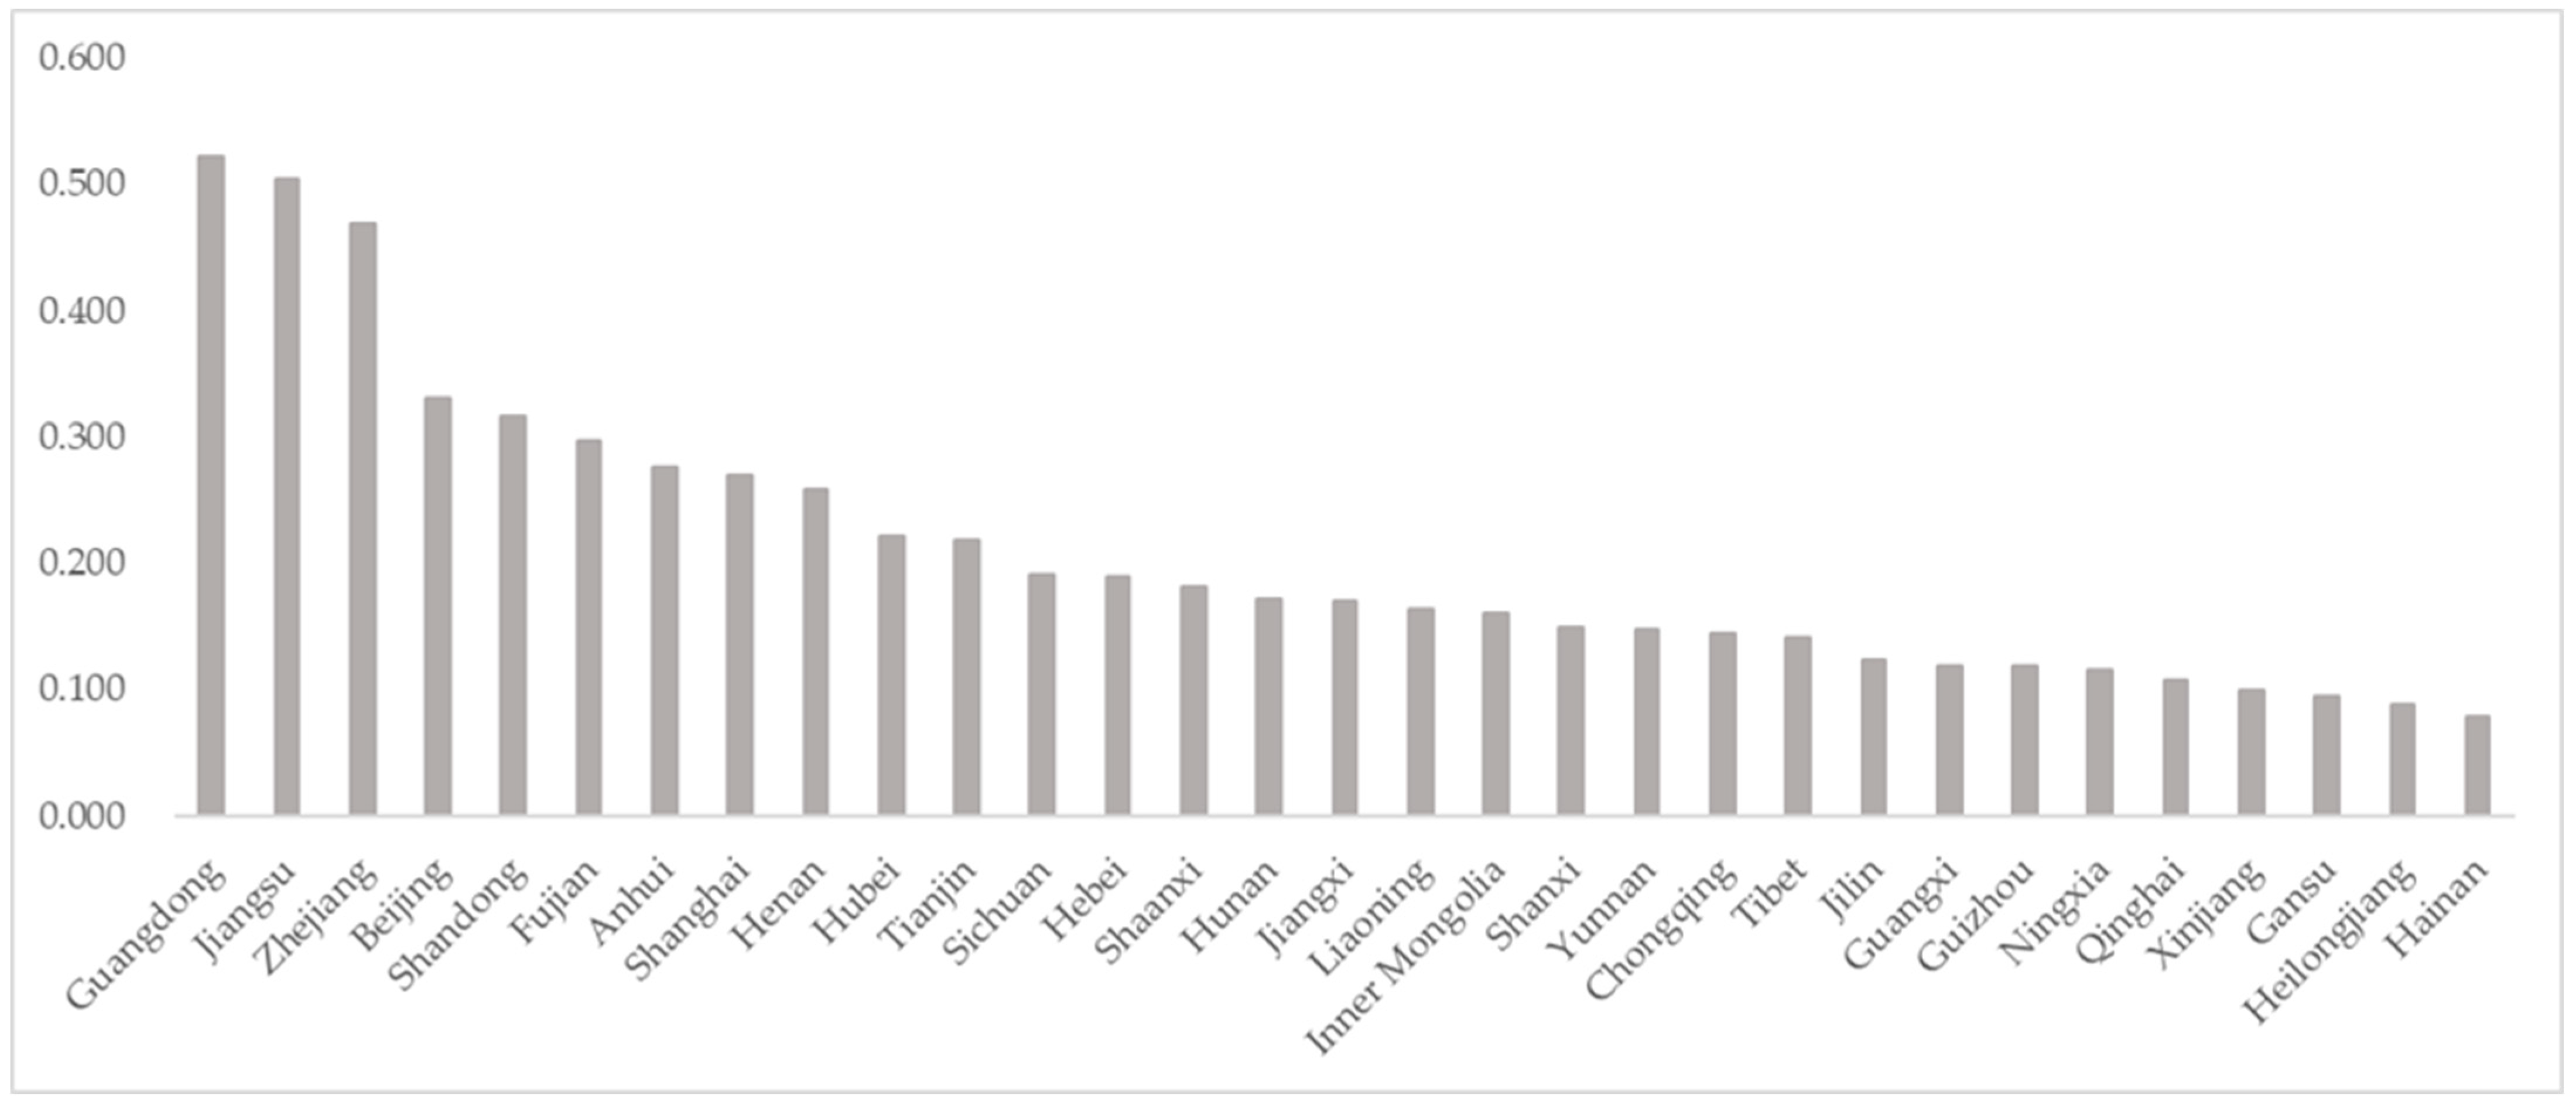
| Guangdong | 0.669 | 0.348 | 0.521 | 1 |
| Jiangsu | 0.640 | 0.344 | 0.504 | 2 |
| Zhejiang | 0.494 | 0.440 | 0.469 | 3 |
| Beijing | 0.101 | 0.601 | 0.331 | 4 |
| Shandong | 0.390 | 0.227 | 0.315 | 5 |
| Fujian | 0.354 | 0.229 | 0.296 | 6 |
| Anhui | 0.351 | 0.190 | 0.277 | 7 |
| Shanghai | 0.142 | 0.420 | 0.270 | 8 |
| Henan | 0.360 | 0.140 | 0.259 | 9 |
| Hubei | 0.272 | 0.162 | 0.222 | 10 |
| Tianjin | 0.172 | 0.274 | 0.219 | 11 |
| Sichuan | 0.251 | 0.121 | 0.192 | 12 |
| Hebei | 0.202 | 0.175 | 0.190 | 13 |
| Shaanxi | 0.206 | 0.154 | 0.182 | 14 |
| Hunan | 0.205 | 0.132 | 0.171 | 15 |
| Jiangxi | 0.226 | 0.106 | 0.171 | 16 |
| Liaoning | 0.157 | 0.172 | 0.164 | 17 |
| Inner Mongolia | 0.139 | 0.185 | 0.160 | 18 |
| Shanxi | 0.164 | 0.131 | 0.149 | 19 |
| Yunnan | 0.178 | 0.114 | 0.148 | 20 |
| Chongqing | 0.168 | 0.119 | 0.145 | 21 |
| Tibet | 0.159 | 0.120 | 0.141 | 22 |
| Jilin | 0.125 | 0.122 | 0.124 | 23 |
| Guangxi | 0.142 | 0.092 | 0.119 | 24 |
| Guizhou | 0.129 | 0.105 | 0.118 | 25 |
| Ningxia | 0.110 | 0.123 | 0.116 | 26 |
| Qinghai | 0.104 | 0.113 | 0.108 | 27 |
| Xinjiang | 0.093 | 0.107 | 0.100 | 28 |
| Gansu | 0.123 | 0.062 | 0.095 | 29 |
| Heilongjiang | 0.077 | 0.101 | 0.088 | 30 |
| Hainan | 0.039 | 0.124 | 0.078 | 31 |
References
- Lewis, W.A. Economic development with unlimited supplies of labour. Manch. Sch. 1954, 22, 139–191. [Google Scholar] [CrossRef]
- Chenergy, H.B.; Syrquin, M.; Elkington, H. Patterns of Development: 1950–1970; Economic Science Press: Beijing, China, 1988. [Google Scholar]
- Jacobs, J. The Economy of Cities; Citic Press: Beijing, China, 1969. [Google Scholar]
- Mao, S.H.; Zhang, Y.H.; Mao, Y.N. Coopetition analysis in industry upgrade and urban expansion based on fractional derivative gray Lotka-Volterra model. Soft Comput. 2021, 25, 11485–11507. [Google Scholar] [CrossRef]
- Chen, Z.B.; Zhang, W.H.; Wang, J. Evaluation of Urban Industry-Education Integration Based on Improved Fuzzy Linguistic Approach. Math. Probl. Eng. 2021, 14, 661367. [Google Scholar] [CrossRef]
- Wang, X.J.; Zhu, Q. Science and Technology Innovation Promotes the Development of City-Industry Integration in Resource-based Cities: A Logical Framework. In Proceedings of the International Conference on Energy Development and Environmental Protection (EDEP), Nanjing, China, 17–19 August 2018; Volume 174, pp. 72–77. [Google Scholar]
- Huang, J.P.; Lin, C.L.; Gao, Y.; Chen, C.L. A Study of Lacquerware Industry’s Upgrading and Sustainability Strategies from the Perspective of GVCs-Using China Fuzhou Lacquerware Industry as Example. Sustainability 2021, 13, 4937. [Google Scholar] [CrossRef]
- Zhang, H.; Wei, X. Border effects within a city and regional coordinated development in emerging economies. Financ. Res. Lett. 2022, 50, 103304. [Google Scholar] [CrossRef]
- Gan, L.; Shi, H.; Hu, Y.; Lev, B.; Lan, H. Coupling coordination degree for urbanization city-industry integration level: Sichuan case. Sustain. Cities Soc. 2020, 58, 102136. [Google Scholar] [CrossRef]
- Wang, X.; Su, L.; Guo, B.; Li, X. Research on the measurement of city-industry integration in high-tech zones based on factor cluster analysis. Sci. Technol. Prog. Countermeas. 2013, 30, 26–29. [Google Scholar]
- Jiang, Y.N. Research on the Model and Evaluation System of City-Industry Integration in Provincial Development Zones; Nanjing University: Nanjing, China, 2014. [Google Scholar]
- Zheng, B.H.; Zhu, J.X. Evaluation of industry-city integration in national innovation demonstration zones. Stat. Decis. Mak. 2016, 18, 65–68. [Google Scholar]
- Sun, J.X.; Lin, Y.X. The path of city-industry integration in suburban development zones from the perspective of spatial economics. Urban Plan. 2015, 39, 54–63. [Google Scholar]
- Gan, L.; Wei, L.; Huang, S.; Lev, B.; Jiang, W. Evaluation of City-Industry Integration Development and Regional Differences under the New Urbanization: A Case Study of Sichuan. Appl. Sci. 2022, 12, 4698. [Google Scholar] [CrossRef]
- Tang, S.F. Measurement and path optimization of integrated city-industry development-Guangxi as an example. Bus. Econ. Res. 2020, 8, 158–161. [Google Scholar]
- An, J.; Wang, R.C. Coupled and coordinated evaluation of city-industry integration in national-level new areas—The case of Zhoushan Islands New Area and Qingdao West Coast New Area. Resour. Dev. Mark. 2021, 37, 287–293. [Google Scholar]
- Shi, Y.S.; Li, J.Q.; Li, B.; Hang, T.Y. A New Approach to Evaluate the Integrated Development of City and Industry: The Cases of Shanghai and the Kangqiao Industrial Park. Buildings 2022, 12, 1851. [Google Scholar] [CrossRef]
- Liu, H.L.; Silva, E. Examining the dynamics of the interaction between the development of creative industries and urban spatial structure by agent-based modelling: A case study of Nanjing, China. Urban Stud. 2018, 55, 1013–1032. [Google Scholar] [CrossRef]
- Tang, X.H. Evaluation and Suggestions of Industry-City Integration in Development Zones from the Perspective of Urban Renewal. Econ. Issues Explor. 2014, 8, 144–149. [Google Scholar]
- Huang, H.; Zhang, W.X.; Cui, Y.N. Evaluation and Countermeasures of Industry-City Integration in Development Zones in the Context of Transformation and Upgrading—Shanxi as an Example. Econ. Issues 2018, 11, 110–114. [Google Scholar]
- Li, Y.X.; Zhang, Z.Y. Study on the measurement of city-industry integration and threshold effect in western region. Stat. Decis. Mak. 2021, 37, 86–90. [Google Scholar]
- Zhou, Z.J.; Zhou, G.H.; Wang, Y.B.; Xiao, J. Study on the measurement of city-industry integration in the city cluster around Changzhutan. J. Nat. Sci. Hunan Norm. Univ. 2016, 39, 8–13. [Google Scholar]
- Wang, X.; Wang, Y.H.; Su, L.; Guo, B.; Wang, S.W. Construction and evaluation of the index system for the in-tegration degree of national high-tech zone industry-city—Based on factor analysis and entropy value method. Sci. Technol. Manag. 2014, 35, 79–88. [Google Scholar]
- Zhang, J.Q.; Shen, S.W. Evaluation of city-industry integration in the middle reaches of Yangtze River urban agglomeration. Shanghai Econ. Res. 2017, 3, 109–114. [Google Scholar]
- Hao, H.M.; Ruan, L.; Yin, J.; Zhang, L.; Long, Y. Evaluation of urban industrial service facilities support based on industrial land survey data—Jiangsu Changzhou City as an example. Geogr. Res. Dev. 2021, 40, 88–93. [Google Scholar]
- Shi, B.J.; Deng, Y.J. Research on the dynamic coupling and coordinated development of industry-city integration and ecology in the development process of resource-based cities. Ecol. Econ. 2017, 33, 122–125. [Google Scholar]
- Zhang, K.H.; Fang, N. Evaluation of the coordination degree of city-industry integration in the process of new urbanization in Hubei Province. J. Zhongnan Univ. Econ. Law 2014, 3, 43–48. [Google Scholar]
- Zhang, Y.; Yang, Y.W. Research on the coupling and coordination of tourism industry and urbanization construction from the perspective of city-production integration—Enshizhou as an example. J. Southwest Univ. Natl.-Ties (Humanit. Soc. Sci. Ed.) 2016, 37, 125–129. [Google Scholar]
- Xu, H.F.; Wang, X.D. Does modern service industry help promote urbanization?—An analysis of PVAR model based on the perspective of industry-city integration. China Manag. Sci. 2020, 28, 195–206. [Google Scholar]
- Wang, F. Research on the evaluation of industry-city integration development in industrial agglomerations based on combined empowerment and four-grid quadrant method. Ecol. Econ. 2014, 30, 36–41+46. [Google Scholar]
- Su, L.; Guo, B.; Li, X. Fuzzy hierarchical comprehensive evaluation of the city-industry integration of high-tech parks—The case of Shanghai Zhangjiang High-tech Park. Ind. Technol. Econ. 2013, 32, 12–16. [Google Scholar]
- Liu, Z.K. Study on the integrated development of Industry and City based on Grey correlation Analysis: A case study of Suzhou Port. China Logist. Purch. 2022, 19, 40–42. [Google Scholar]
- Bertalanffy, L. General systems theory.; Qiu, T., Translator; Social Science Literature Press: Beijing, China, 1987. [Google Scholar]
- Lu, P. Systems theory and causal networks. Power Technol. 1985, 09, 73–74. [Google Scholar]
- Sun, Y.; Li, L.; Shi, H.; Chong, D.Z. The transformation and upgrade of China’s manufacturing industry in Industry 4.0 era. Syst. Res. Behav. Sci. 2020, 37, 734–740. [Google Scholar] [CrossRef]
- Dai, Z.H.; Niu, Y.; Zhang, H.R.; Niu, X.D. Impact of the Transforming and Upgrading of China’s Labor-Intensive Manufacturing Industry on the Labor Market. Sustainability 2022, 14, 13750. [Google Scholar] [CrossRef]
- Wang, S.H.; Lei, L.; Xing, L. Urban circular economy performance evaluation: A novel fully fuzzy data envelopment analysis with large datasets. J. Clean. Prod. 2021, 324, 129214. [Google Scholar] [CrossRef]
- Barile, S.; Ciasullo, M.V.; Landolo, F.; Landi, G.C. The city role in the sharing economy: Toward an integrated framework of practices and governance models. Cities 2021, 119, 103409. [Google Scholar] [CrossRef]
- Li, T.C.; Shi, Z.Y.; Han, D.R. Does renewable energy consumption contribute to the development of low-carbon economy? Evidence from China. Environ. Sci. Pollut. Res. 2021, 28, 54891–54908. [Google Scholar] [CrossRef]
- Cong, H.B.; Duan, W.; Wu, F.X. City-industry integration and its welfare effects during the new-type urbanization. China Ind. Econ. 2017, 11, 62–80. [Google Scholar]
- Aarstad, J.; Kvitastein, O.A. Enterprise R&D investments, product innovation and the regional industry structure. Reg. Stud. 2020, 54, 366–376. [Google Scholar]
- Zhang, M.D.; Li, Y.; Guo, R.; Yan, Y.R. Heterogeneous Effects of Urban Sprawl on Economic Development: Empirical Evidence from China. Sustainability 2022, 14, 1582. [Google Scholar] [CrossRef]
- Wang, X.; Wang, Y.H.; Su, L.; Guo, B.; Wang, S.W. Index evaluation system on the degree of production-city integration in high-tech zones in China: Based on factor analysis and entropy-based weight. Sci. Sci. Manag. S. T 2014, 35, 79–88. [Google Scholar]
- Tan, F.F.; Yang, L.X.; Lu, Z.H.; Niu, Z.Y. Impact of urban innovation on urban green development in China’s Yangtze River Economic Belt: Perspectives of scale and network. Environ. Sci. Pollut. Res. 2022, 29, 73878–73895. [Google Scholar] [CrossRef]
- Wang, X.; Li, B.Z.; Yin, S. The Convergence Management of Strategic Emerging Industries: Sustainable Design Analysis for Facilitating the Improvement of Innovation Networks. Sustainability 2020, 12, 900. [Google Scholar] [CrossRef] [Green Version]
- Zhang, Q.; Zhang, Z.; Jin, X.; Zeng, W.; Lou, S.; Jiang, X.; Zhang, Z. Entropy-based method for evaluating spatial distribution of form errors for precision assembly. Precis. Eng. -J. Int. Soc. Precis. Eng. Nanotechnol. 2019, 60, 374–382. [Google Scholar] [CrossRef]
- Yan, R.; Tong, W.; Jiaona, C.; Alteraz, H.A.; Mohamed, H.M. Evaluation of Factors Influencing Energy Consumption in Water Injection System Based on Entropy Weight-Grey Correlation Method. Appl. Math. Nonlinear Sci. 2021, 6, 269–280. [Google Scholar] [CrossRef]


| First-Level Index | Second-Level Indicators | Unit | Characteristic | Source and Reference |
|---|---|---|---|---|
| Industry Development Level | The proportion of value added to secondary industry | % | Positive | CMD [39] |
| The proportion of value added to tertiary industry | % | Positive | CMD [39] | |
| Assets of industrial enterprises above the scale | Billion | Positive | CIED [40] | |
| Real estate fixed assets investment | Billion | Positive | CRD [40] | |
| Number of scientific and innovative personnel | People | Positive | CRD [41] | |
| Number of patents granted | Pieces | Positive | CRD [41] | |
| Above-scale industry number of business units | Individual | Positive | CIED [30] | |
| The proportion of industrial employees in active population | % | Positive | NBS [30] | |
| Ubran Development Level | GDP per capita | Yuan | Positive | CMD [28] |
| Disposable income per capita | Yuan | Positive | CMD [28] | |
| Population density | People/km2 | Centering | CRD [42] | |
| Number of physicians per 10,000 people | People/10,000 | Positive | CRD [42] | |
| Number of passenger cars per capita | Vehicle/person | Positive | CRD [43] | |
| Postal business per capita | Billion Yuan/10,000 people | Positive | CRD [43] | |
| Education expenses | Million Yuan | Positive | CRD [28] | |
| Environmental protection expenditure | Million Yuan | Positive | CRD [44] | |
| Public libraries per capita book collection | Books/10,000 people | Positive | CRD [45] | |
| Average wage of employees | Yuan | Positive | NBS [28] |
| Ingredients | Initial Eigenvalue | Extraction of the Sum of Squares of Loads | Sum of Squared Rotating Loads | ||||||
|---|---|---|---|---|---|---|---|---|---|
| Total | Percentage of Variance | Cumulative % | Total | Percentage of Variance | Cumulative % | Total | Percentage of Variance | Cumulative % | |
| Industry Development Level | |||||||||
| 1 | 4.754 | 59.428 | 59.428 | 4.754 | 59.428 | 59.428 | 4.698 | 58.728 | 58.728 |
| 2 | 1.773 | 22.157 | 81.584 | 1.773 | 22.157 | 81.584 | 1.816 | 22.699 | 81.427 |
| 3 | 1.013 | 12.664 | 94.248 | 1.013 | 12.664 | 94.248 | 1.026 | 12.821 | 94.248 |
| 4 | 0.195 | 2.435 | 96.683 | ||||||
| 5 | 0.163 | 2.042 | 98.725 | ||||||
| 6 | 0.053 | 0.661 | 99.386 | ||||||
| 7 | 0.035 | 0.436 | 99.822 | ||||||
| 8 | 0.014 | 0.178 | 100.000 | ||||||
| Urban Development Level | |||||||||
| 9 | 4.950 | 49.505 | 49.505 | 4.950 | 49.505 | 49.505 | 4.378 | 43.782 | 43.782 |
| 10 | 1.805 | 18.053 | 67.557 | 1.805 | 18.053 | 67.557 | 2.317 | 23.165 | 66.948 |
| 11 | 1.479 | 14.789 | 82.347 | 1.479 | 14.789 | 82.347 | 1.540 | 15.399 | 82.347 |
| 12 | 0.646 | 6.462 | 88.808 | ||||||
| 13 | 0.426 | 4.260 | 93.069 | ||||||
| 14 | 0.237 | 2.373 | 95.441 | ||||||
| 15 | 0.181 | 1.808 | 97.250 | ||||||
| 16 | 0.141 | 1.411 | 98.661 | ||||||
| 17 | 0.100 | 0.999 | 99.659 | ||||||
| 18 | 0.034 | 0.341 | 100.000 | ||||||
| Ingredients | |||
|---|---|---|---|
| 1 | 2 | 3 | |
| Industry Development Level | |||
| The proportion of secondary industry value added | 0.009 | 0.501 | 0.027 |
| The proportion of value added to tertiary industry % | 0.065 | −0.541 | 0.067 |
| Assets of industrial enterprises above the scale | 0.210 | −0.011 | −0.096 |
| Real estate fixed assets investment | 0.199 | 0.019 | 0.073 |
| Number of scientific and innovative personnel | 0.215 | −0.095 | −0.015 |
| Number of patents granted | 0.211 | −0.048 | −0.041 |
| Number of industrial enterprise units above the scale | 0.195 | 0.076 | 0.041 |
| The proportion of industrial employees in active population | −0.023 | −0.028 | 0.979 |
| Urban Development Level | |||
| GDP per capita | 0.214 | −0.012 | −0.030 |
| Disposable income per capita | 0.222 | −0.030 | −0.016 |
| Population density | −0.109 | 0.018 | 0.639 |
| Number of physicians per 10,000 people | 0.077 | −0.047 | 0.499 |
| Number of passenger cars per capita | 0.136 | 0.092 | −0.037 |
| Postal business per capita | 0.100 | 0.191 | −0.006 |
| Education business expenses | −0.094 | 0.463 | −0.054 |
| Environmental protection expenditure | −0.097 | 0.446 | 0.045 |
| Public library collections per capita | 0.213 | −0.081 | −0.018 |
| Average wage of employees | 0.252 | −0.168 | −0.042 |
| Tier 1 Indicators | Weighting w |
|---|---|
| Industry Development Level | 0.540 |
| Level of urban development | 0.460 |
Disclaimer/Publisher’s Note: The statements, opinions and data contained in all publications are solely those of the individual author(s) and contributor(s) and not of MDPI and/or the editor(s). MDPI and/or the editor(s) disclaim responsibility for any injury to people or property resulting from any ideas, methods, instructions or products referred to in the content. |
© 2023 by the authors. Licensee MDPI, Basel, Switzerland. This article is an open access article distributed under the terms and conditions of the Creative Commons Attribution (CC BY) license (https://creativecommons.org/licenses/by/4.0/).
Share and Cite
Li, Y.; Cao, X.; Cui, C. System Dynamics Theory Applied to Differentiated Levels of City–Industry Integration in China. Sustainability 2023, 15, 3987. https://doi.org/10.3390/su15053987
Li Y, Cao X, Cui C. System Dynamics Theory Applied to Differentiated Levels of City–Industry Integration in China. Sustainability. 2023; 15(5):3987. https://doi.org/10.3390/su15053987
Chicago/Turabian StyleLi, Yunchang, Xia Cao, and Can Cui. 2023. "System Dynamics Theory Applied to Differentiated Levels of City–Industry Integration in China" Sustainability 15, no. 5: 3987. https://doi.org/10.3390/su15053987