
Twenty Years of Urban Reforestation: Overstory Development Structures Understory Plant Communities in Lexington, KY, USA

Abstract
:1. Introduction
2. Materials and Methods
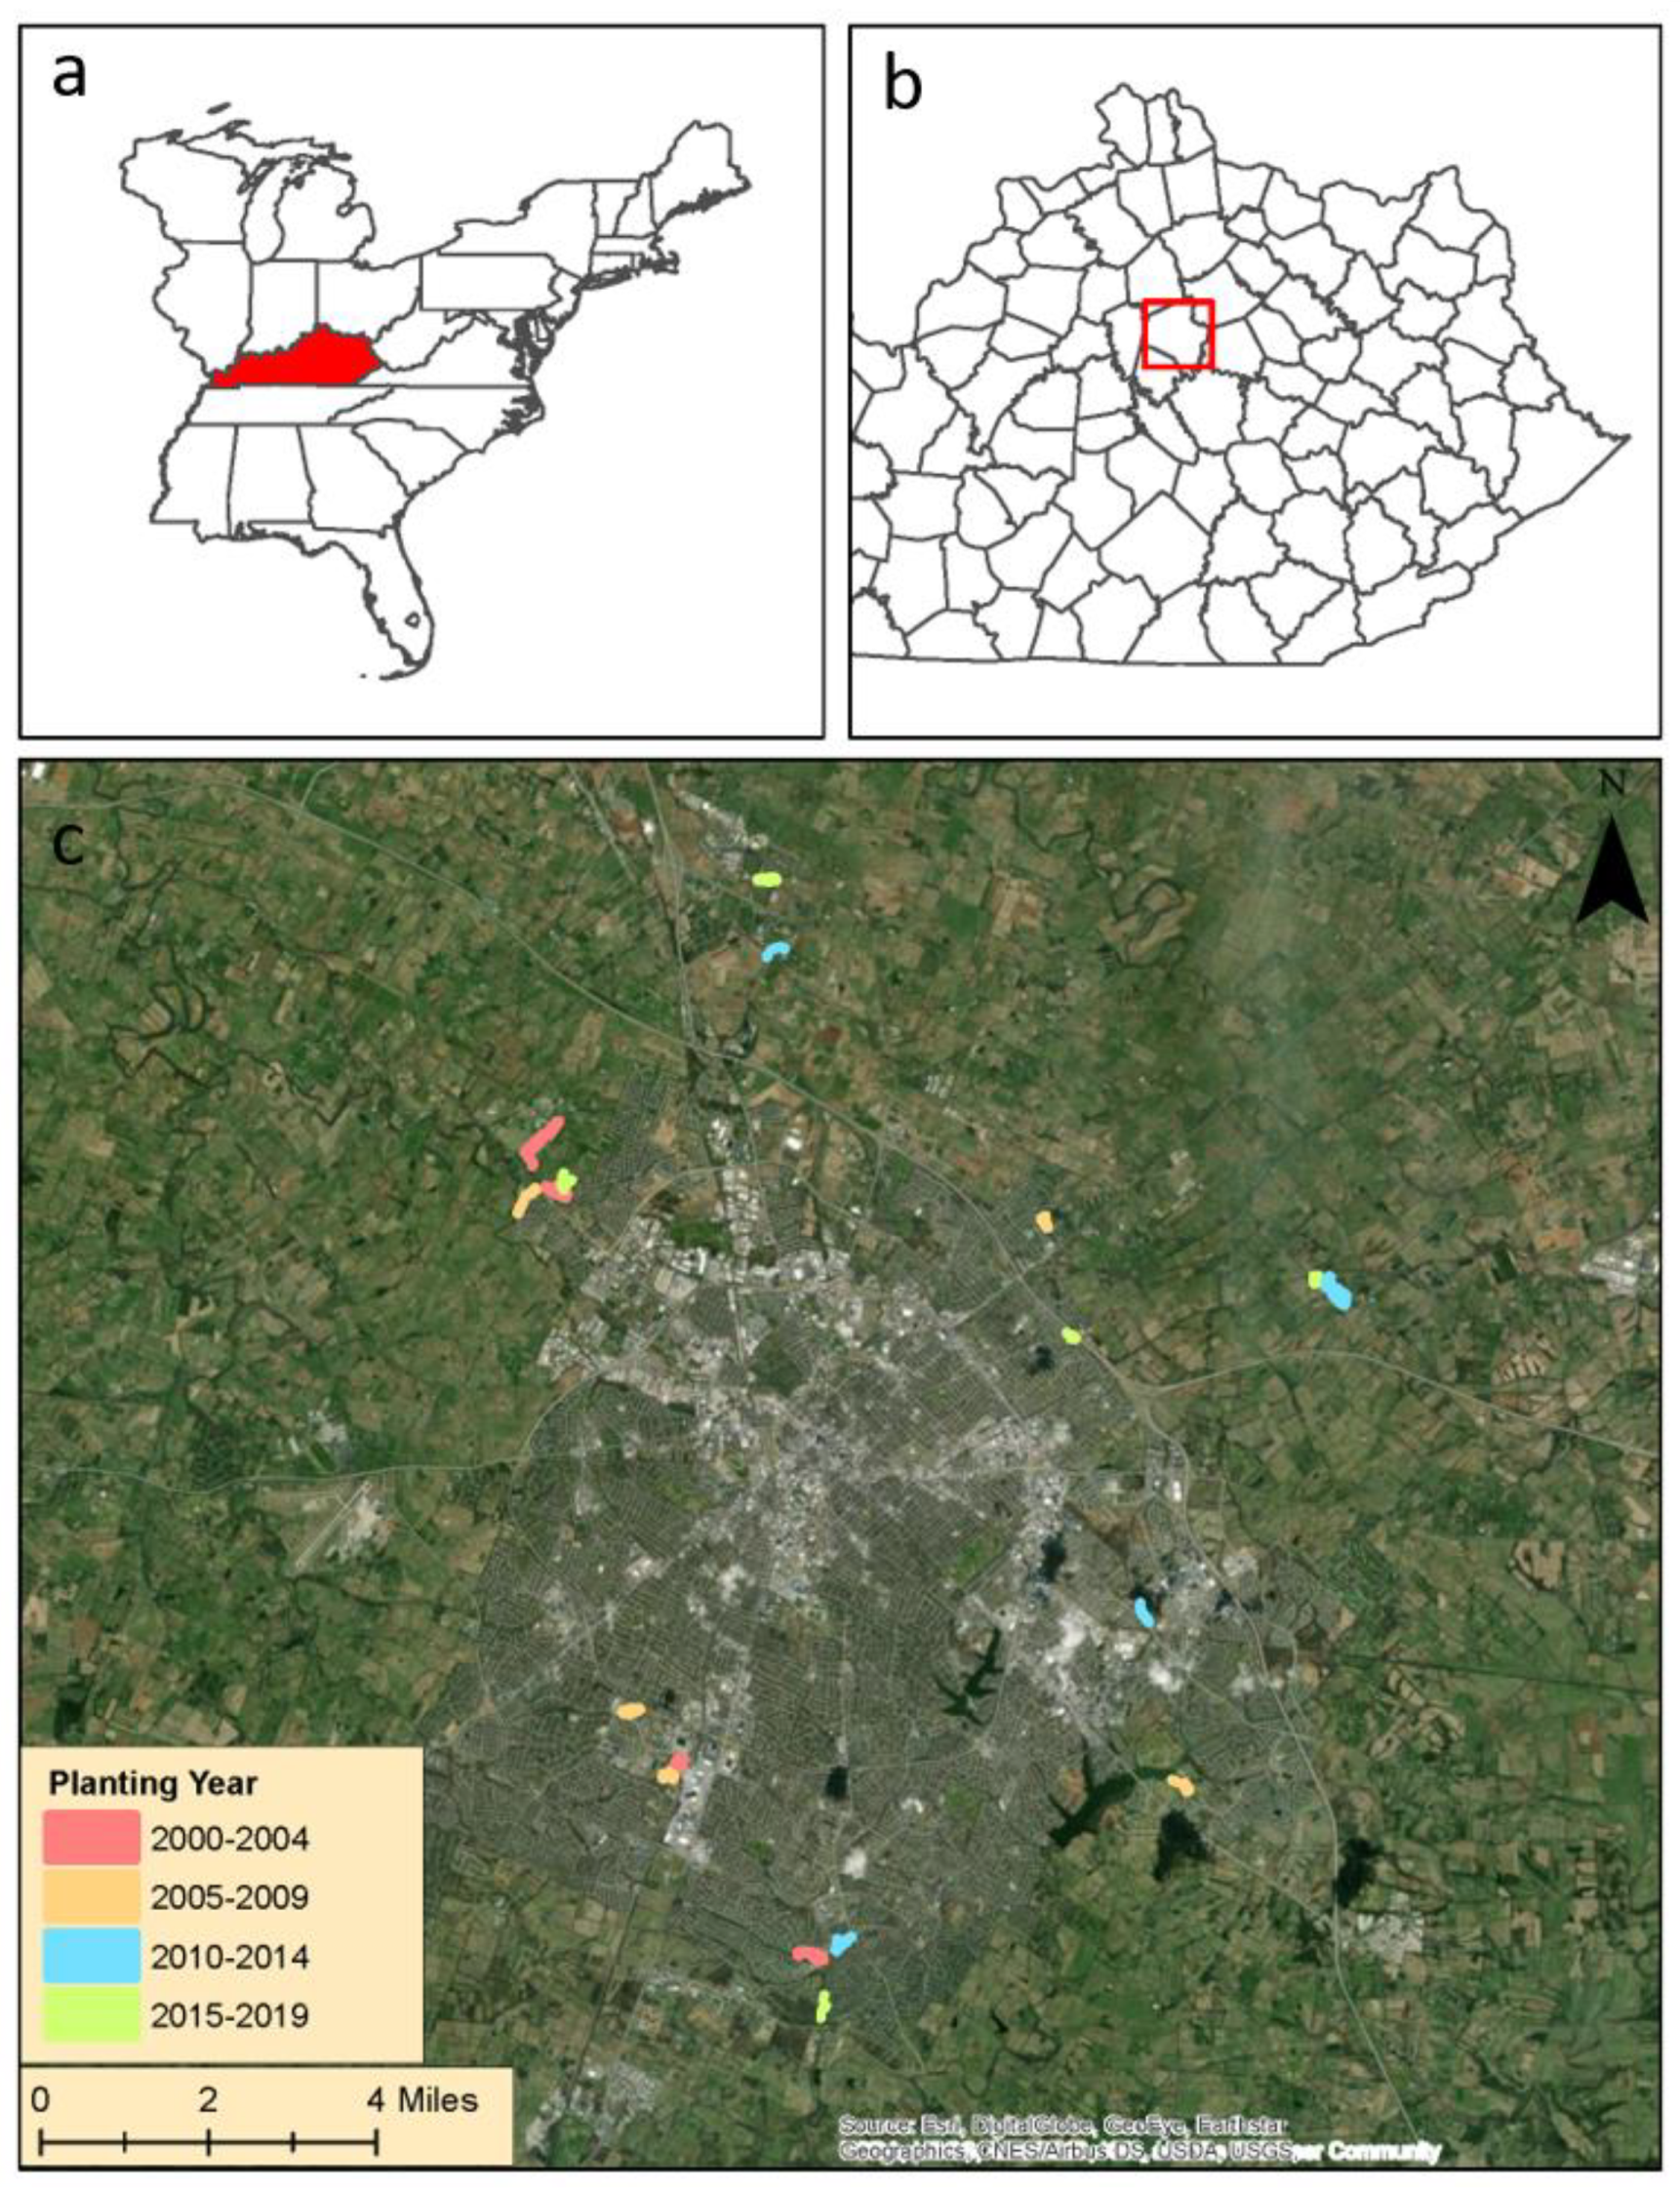
2.1. Study Sites
2.2. Sampling
2.3. Statistical Analysis
2.3.1. Chronosequence Diversity Patterns
2.3.2. Invasive Plant Species Prevalence
2.3.3. Nonmetric Multidimensional Scaling
3. Results
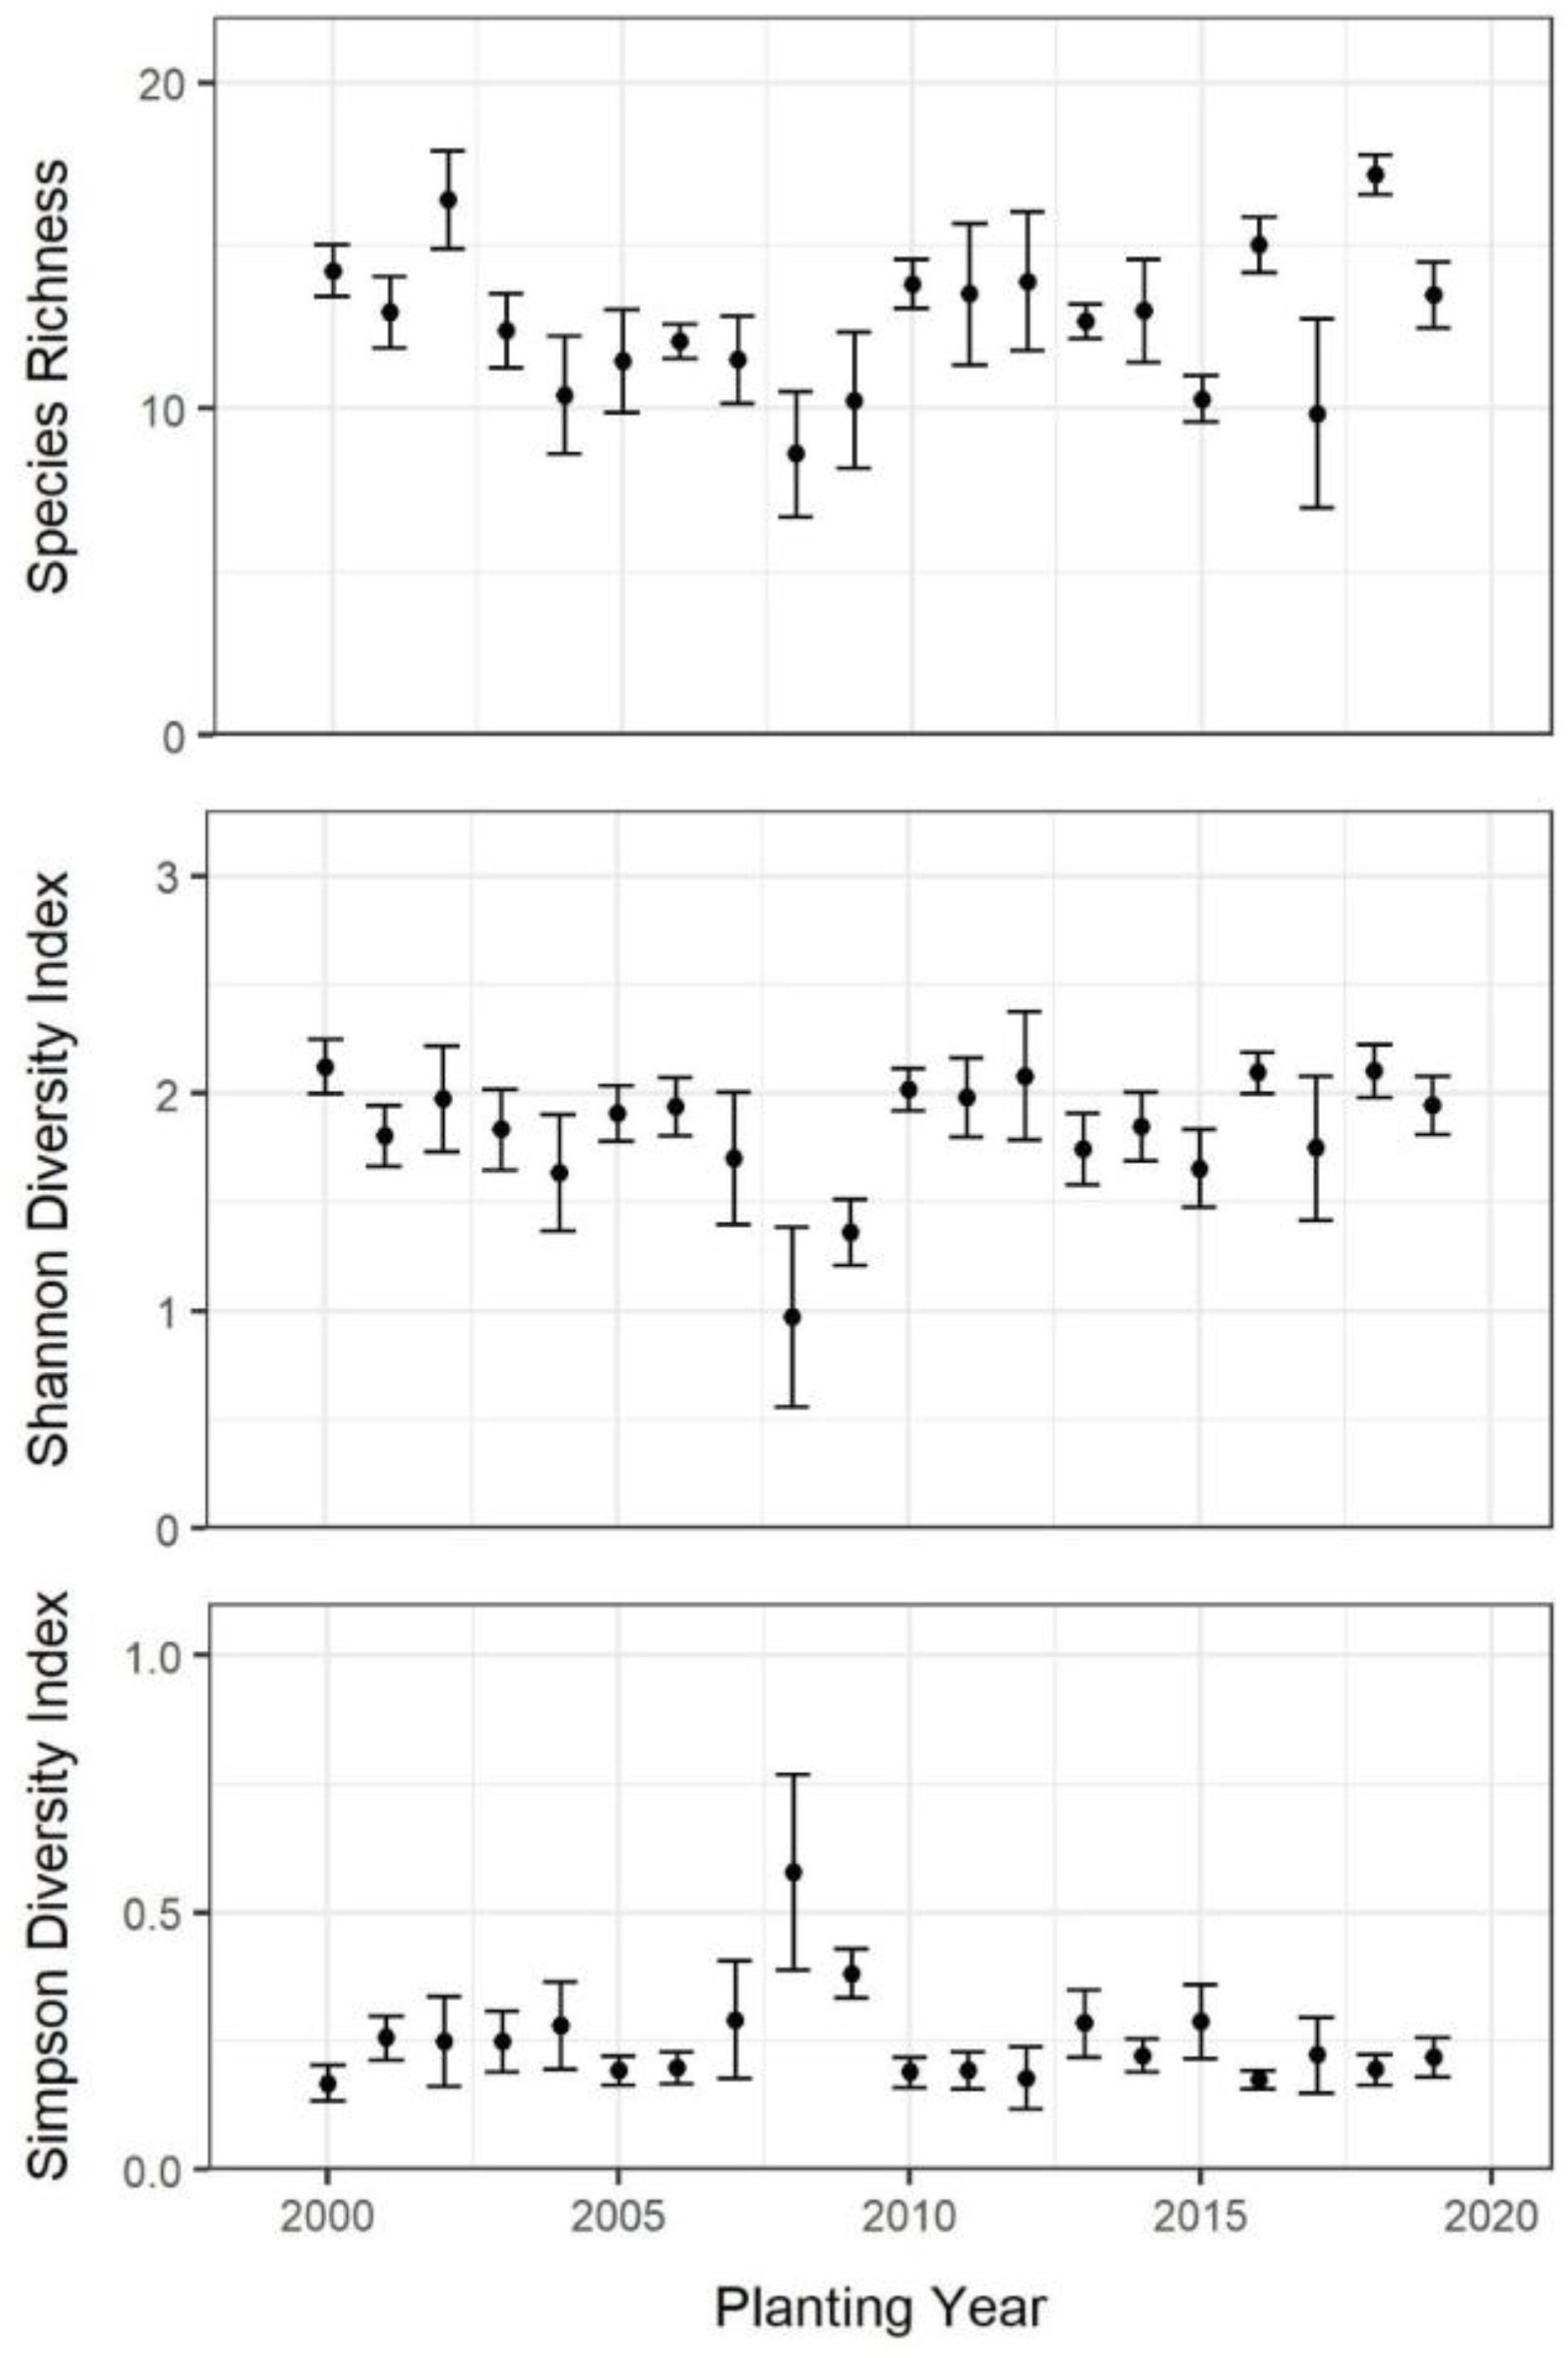
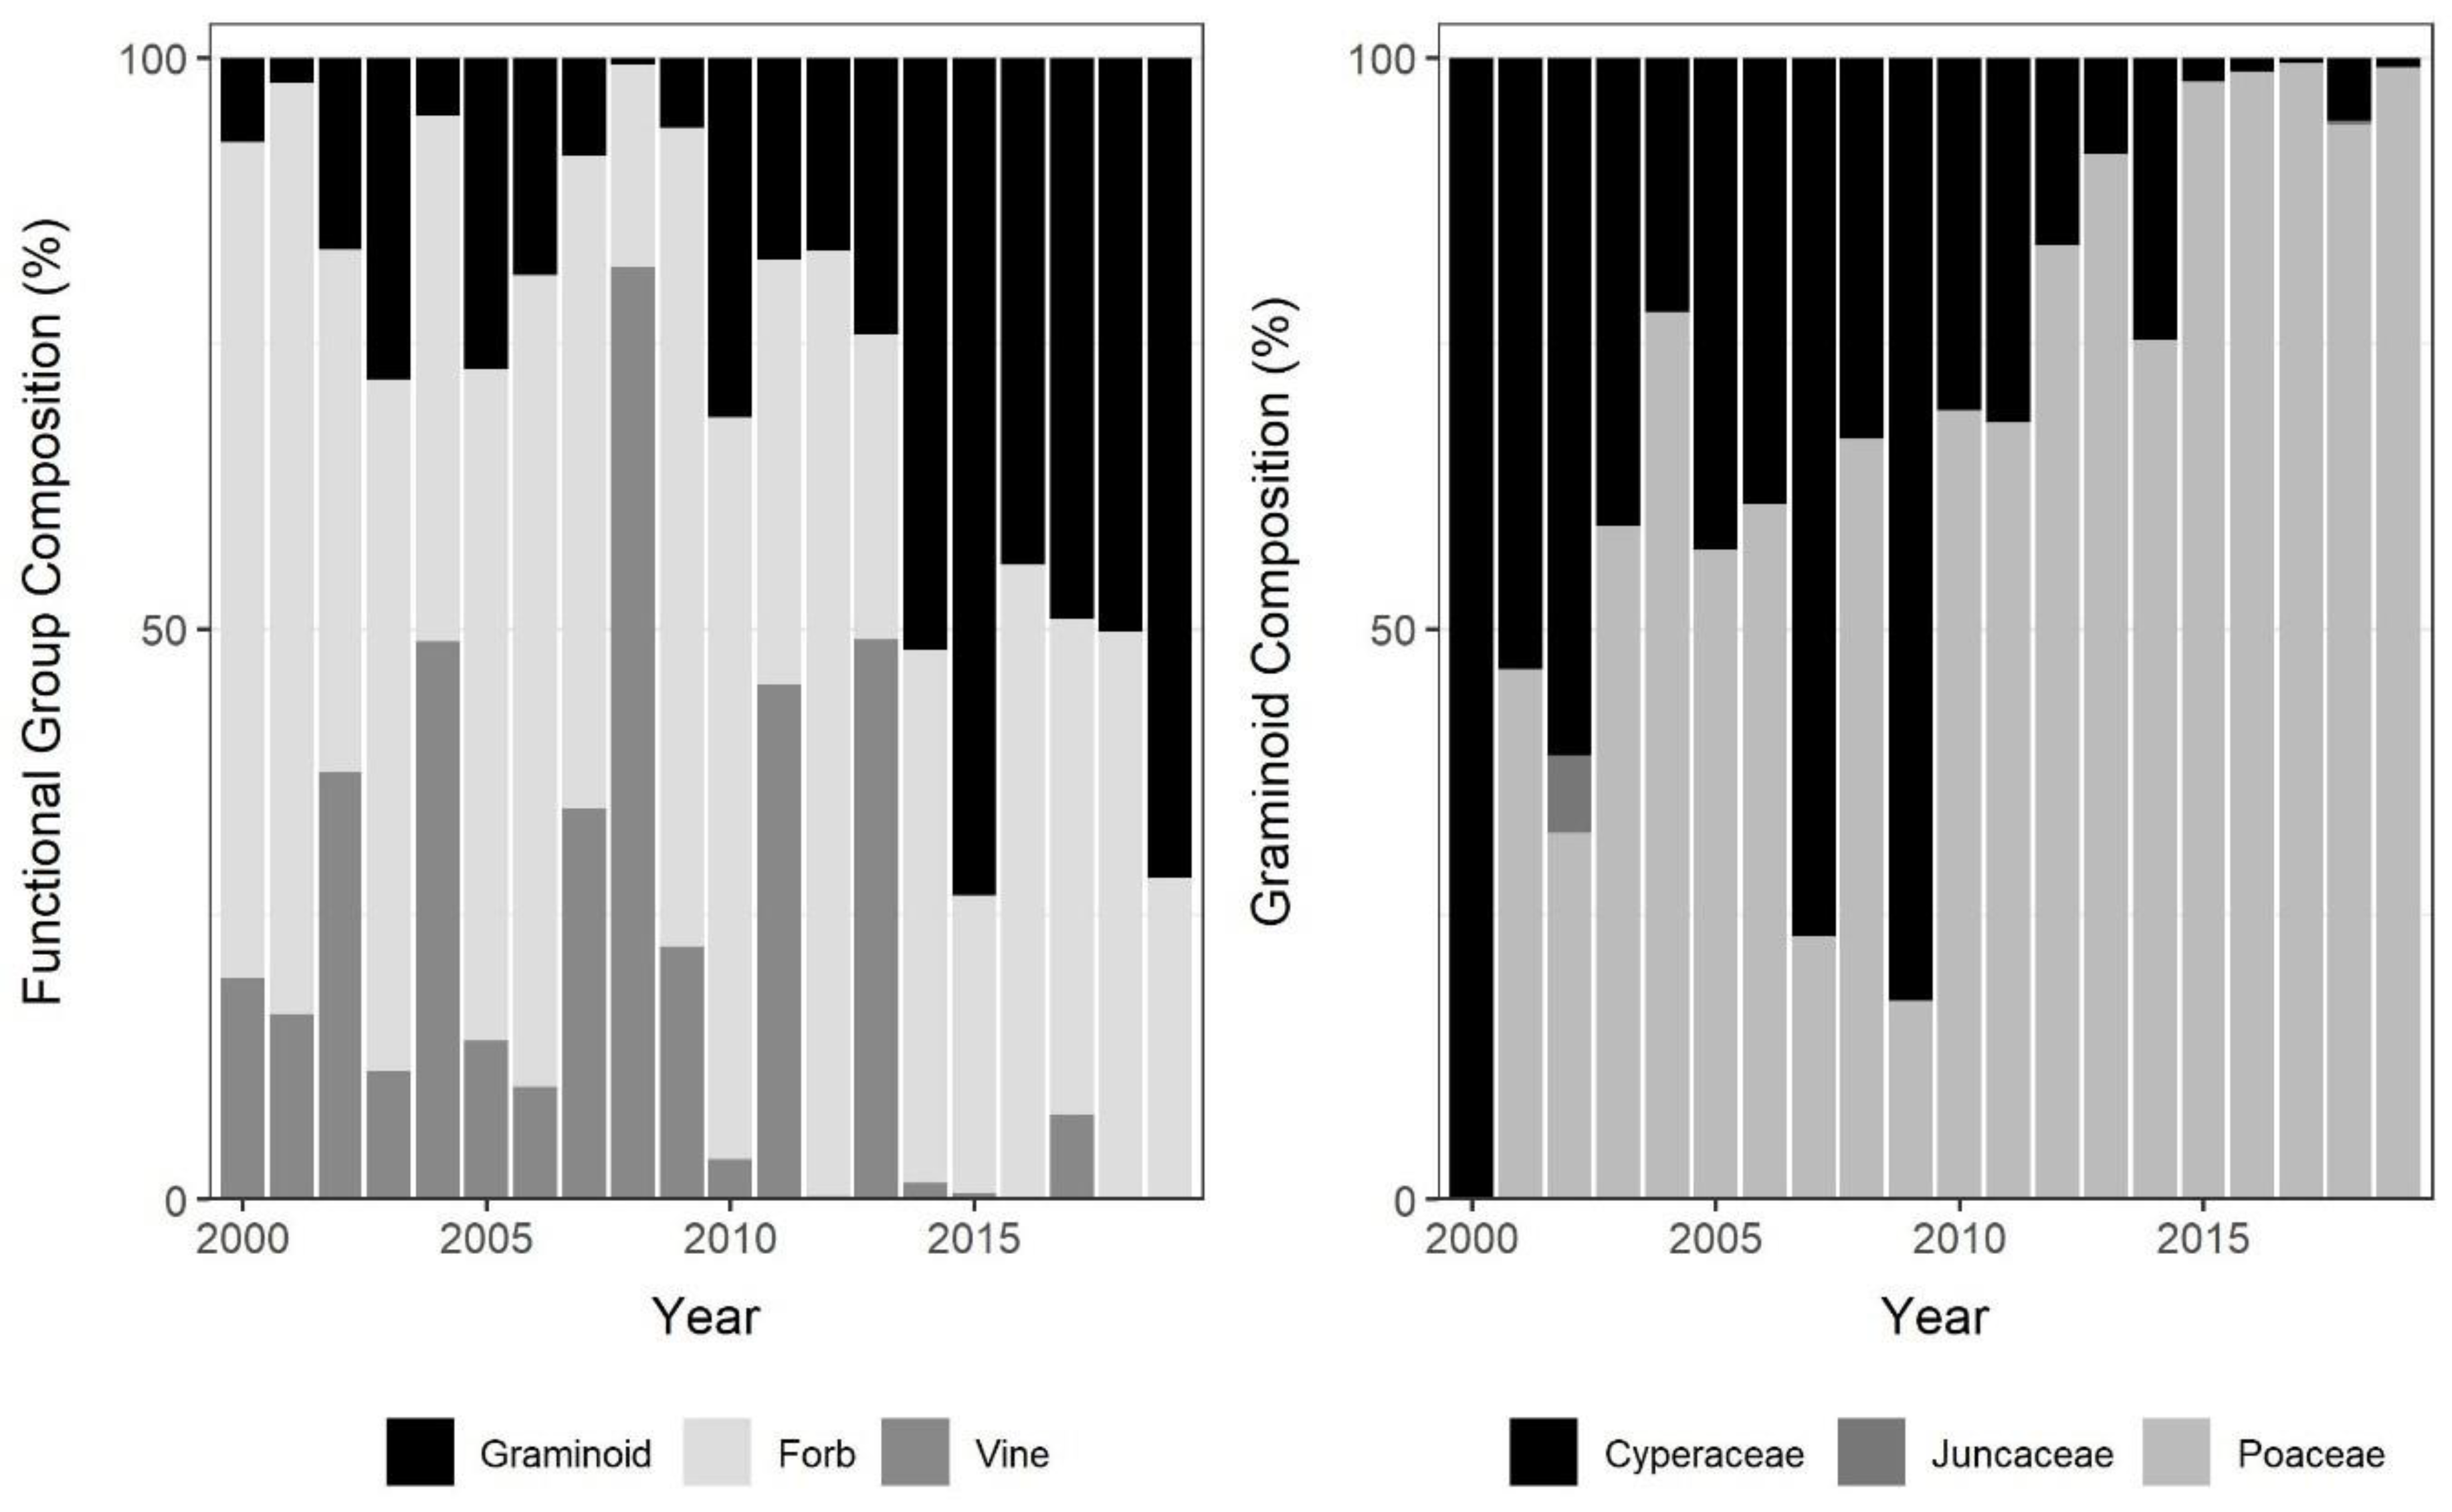
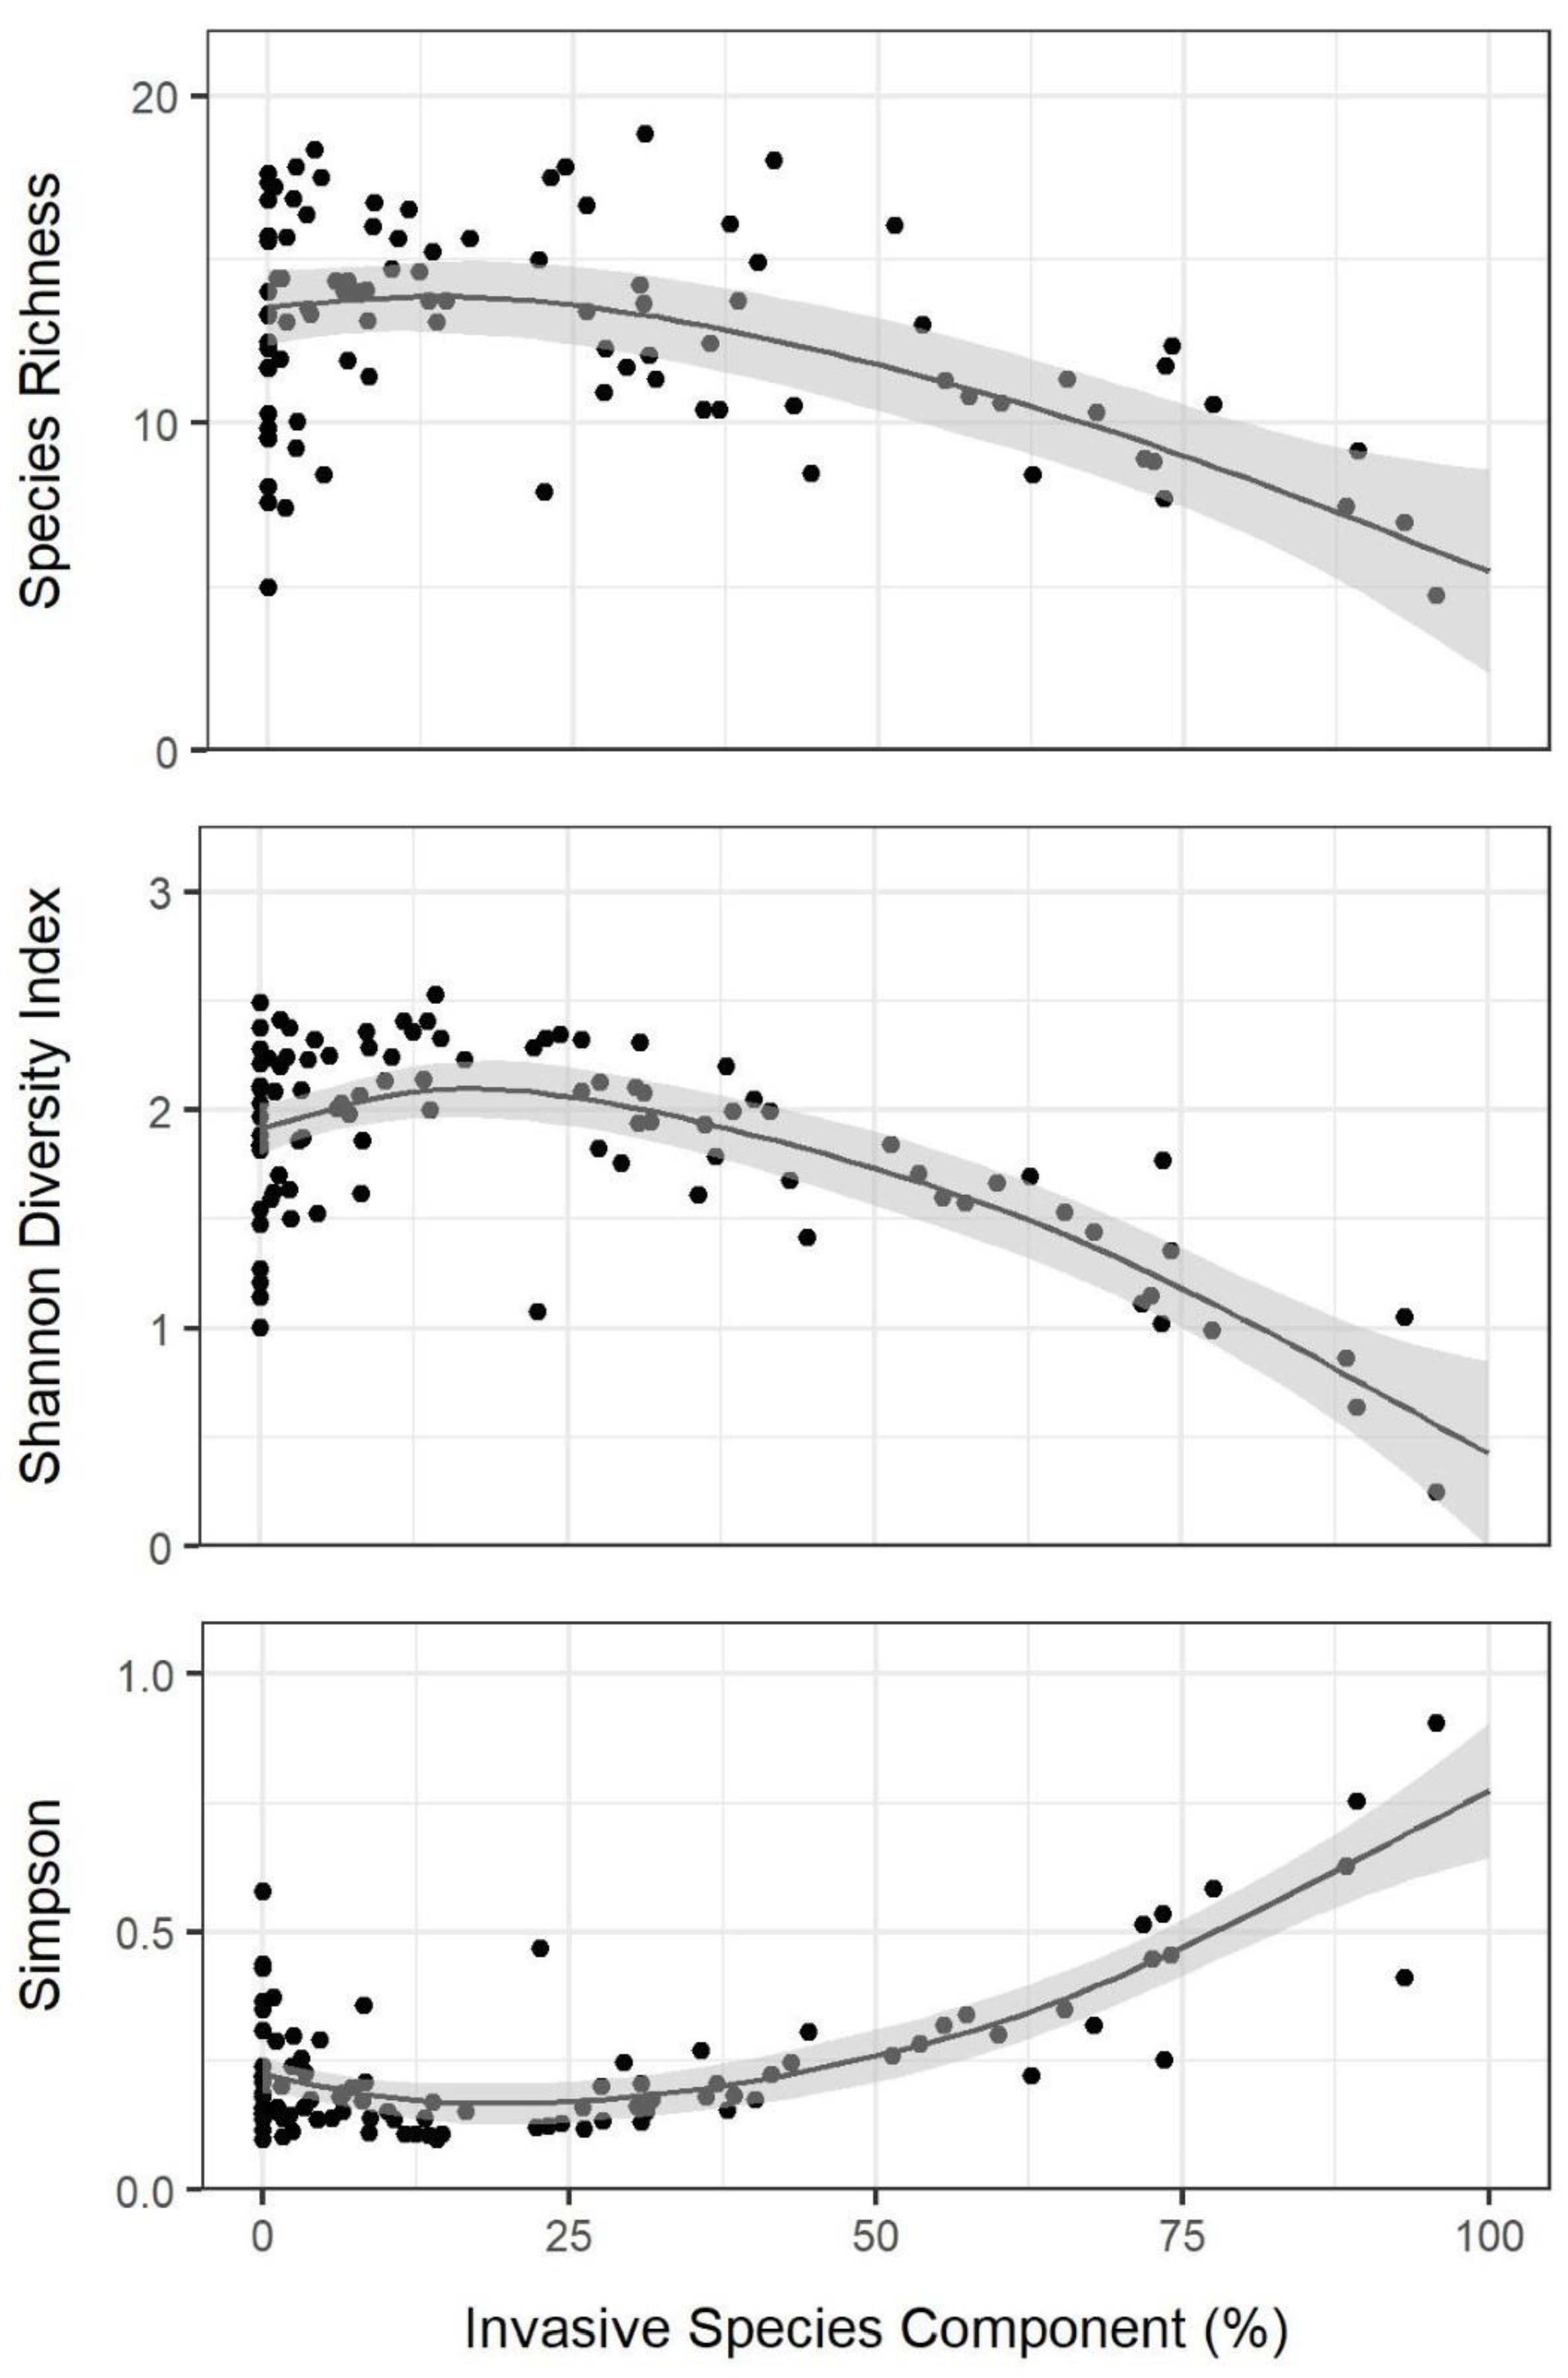
3.1. Chronosequence Diversity Patterns
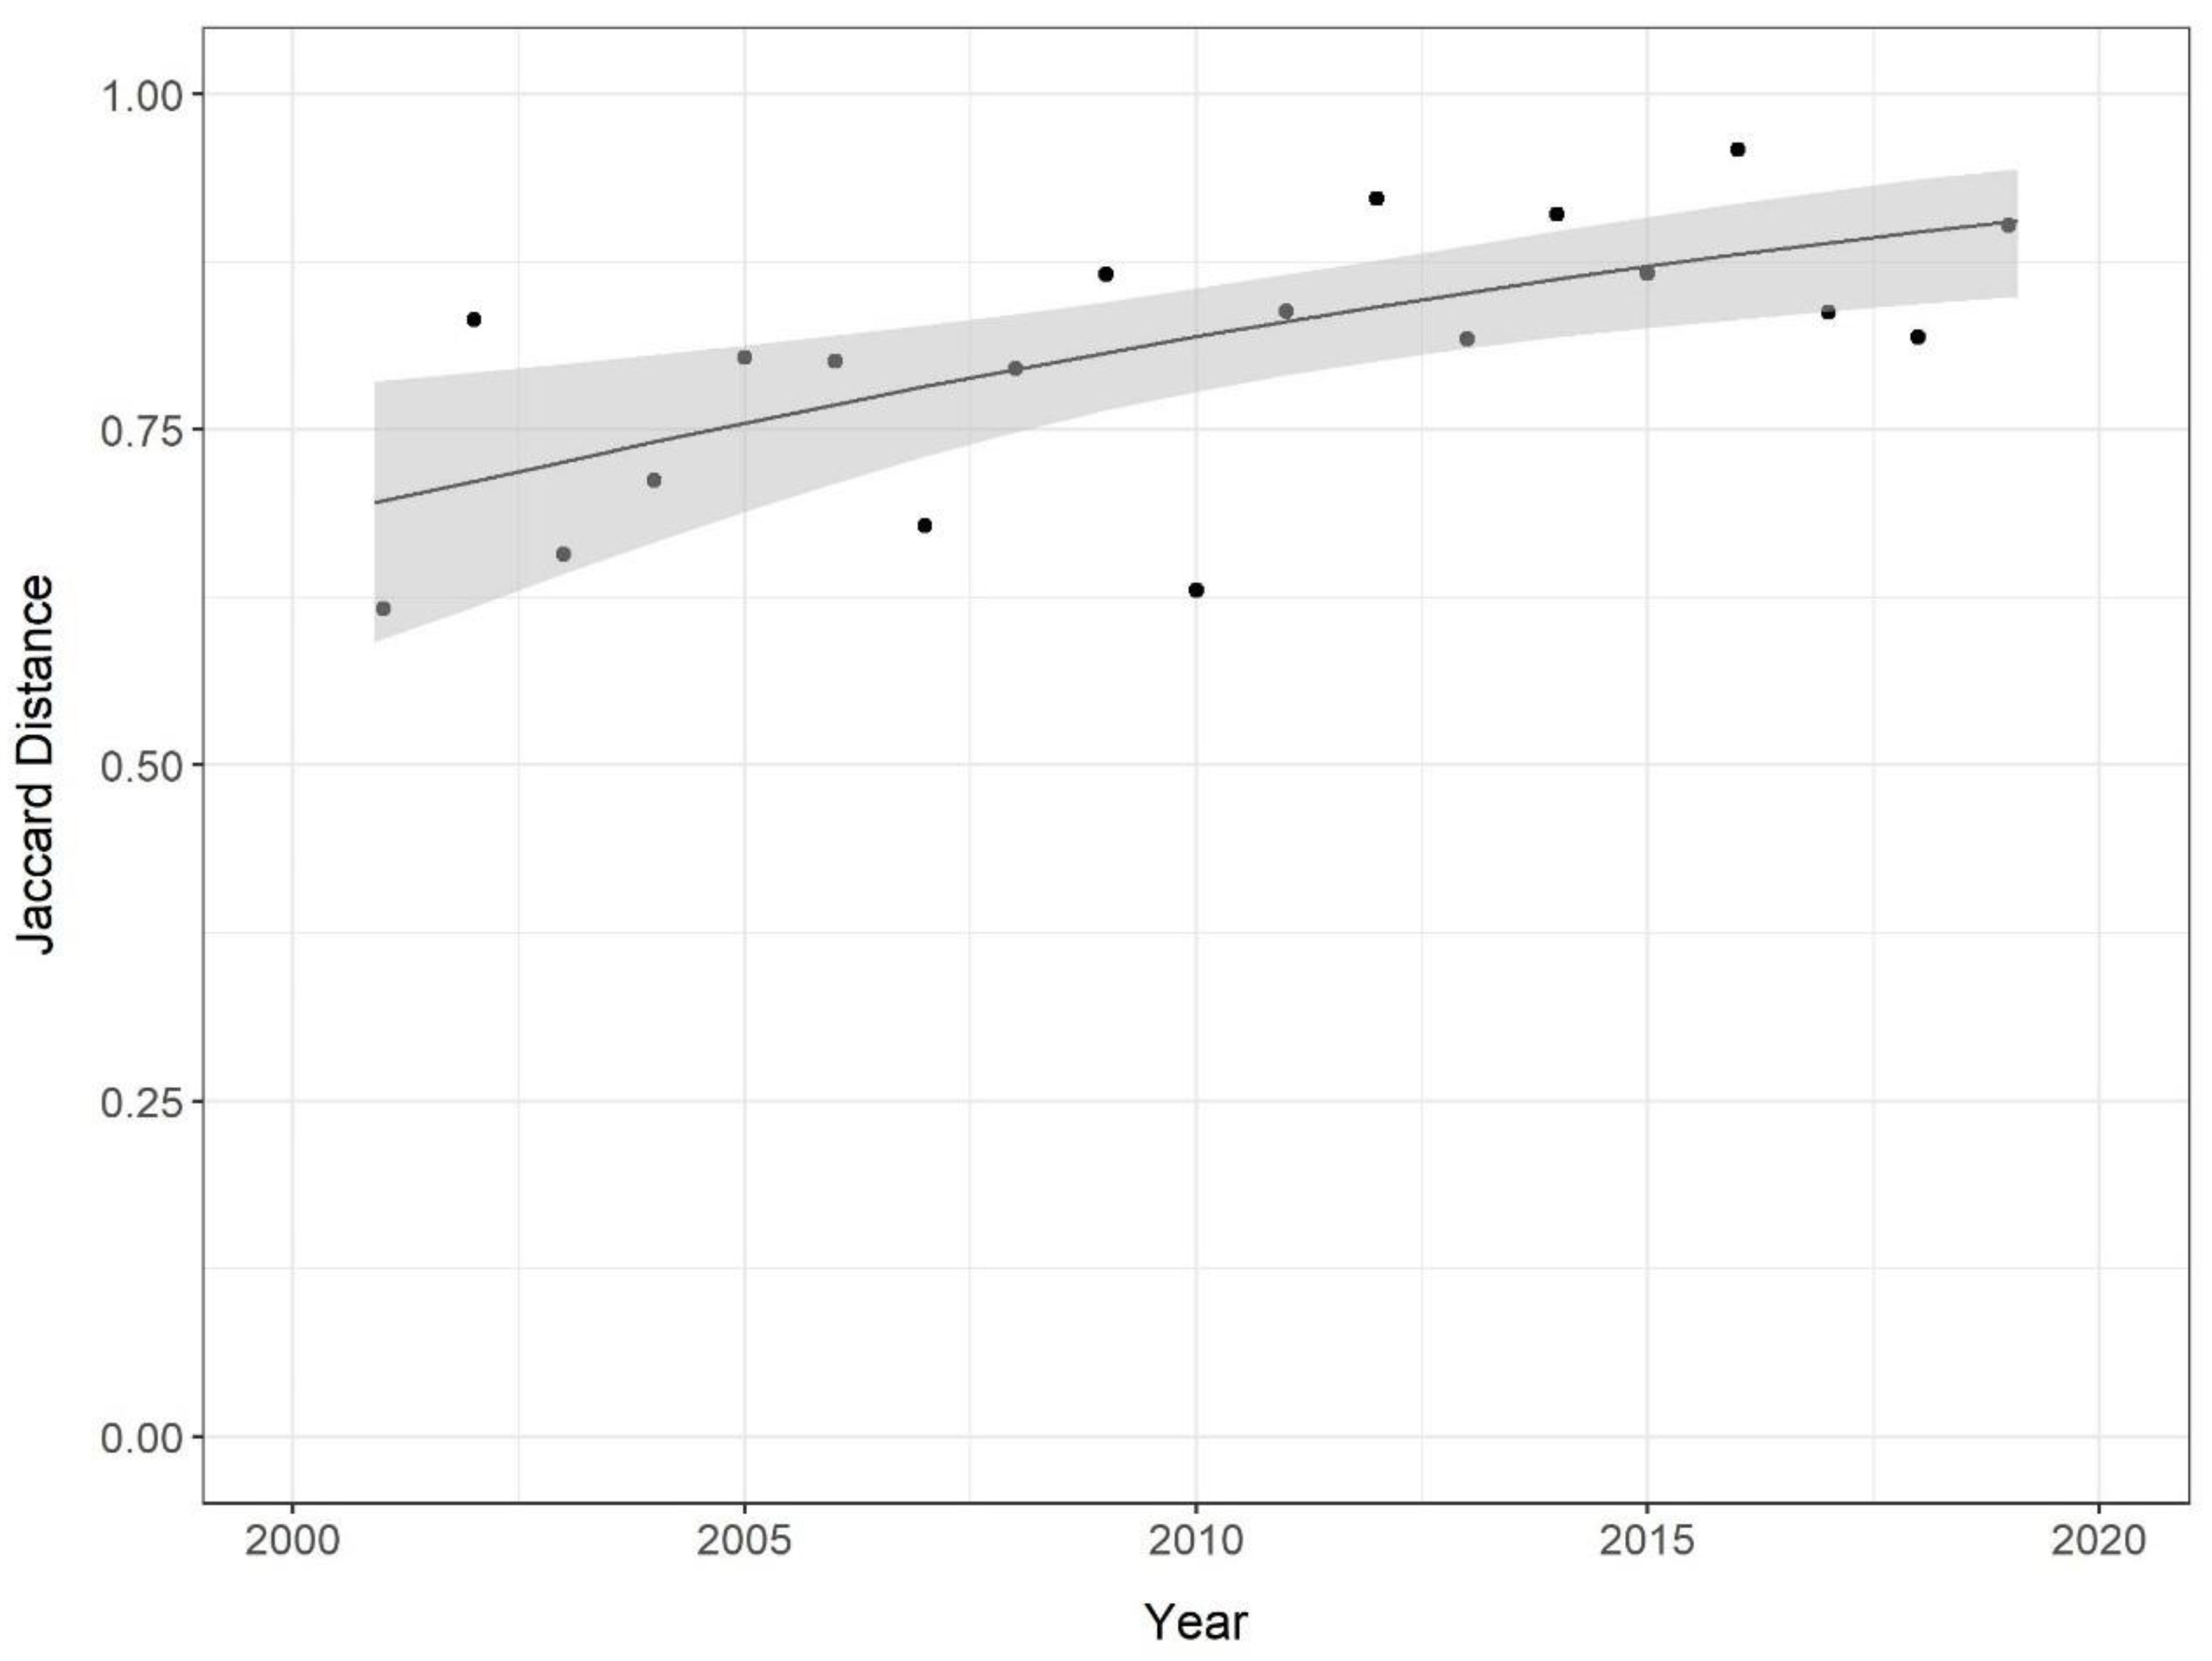
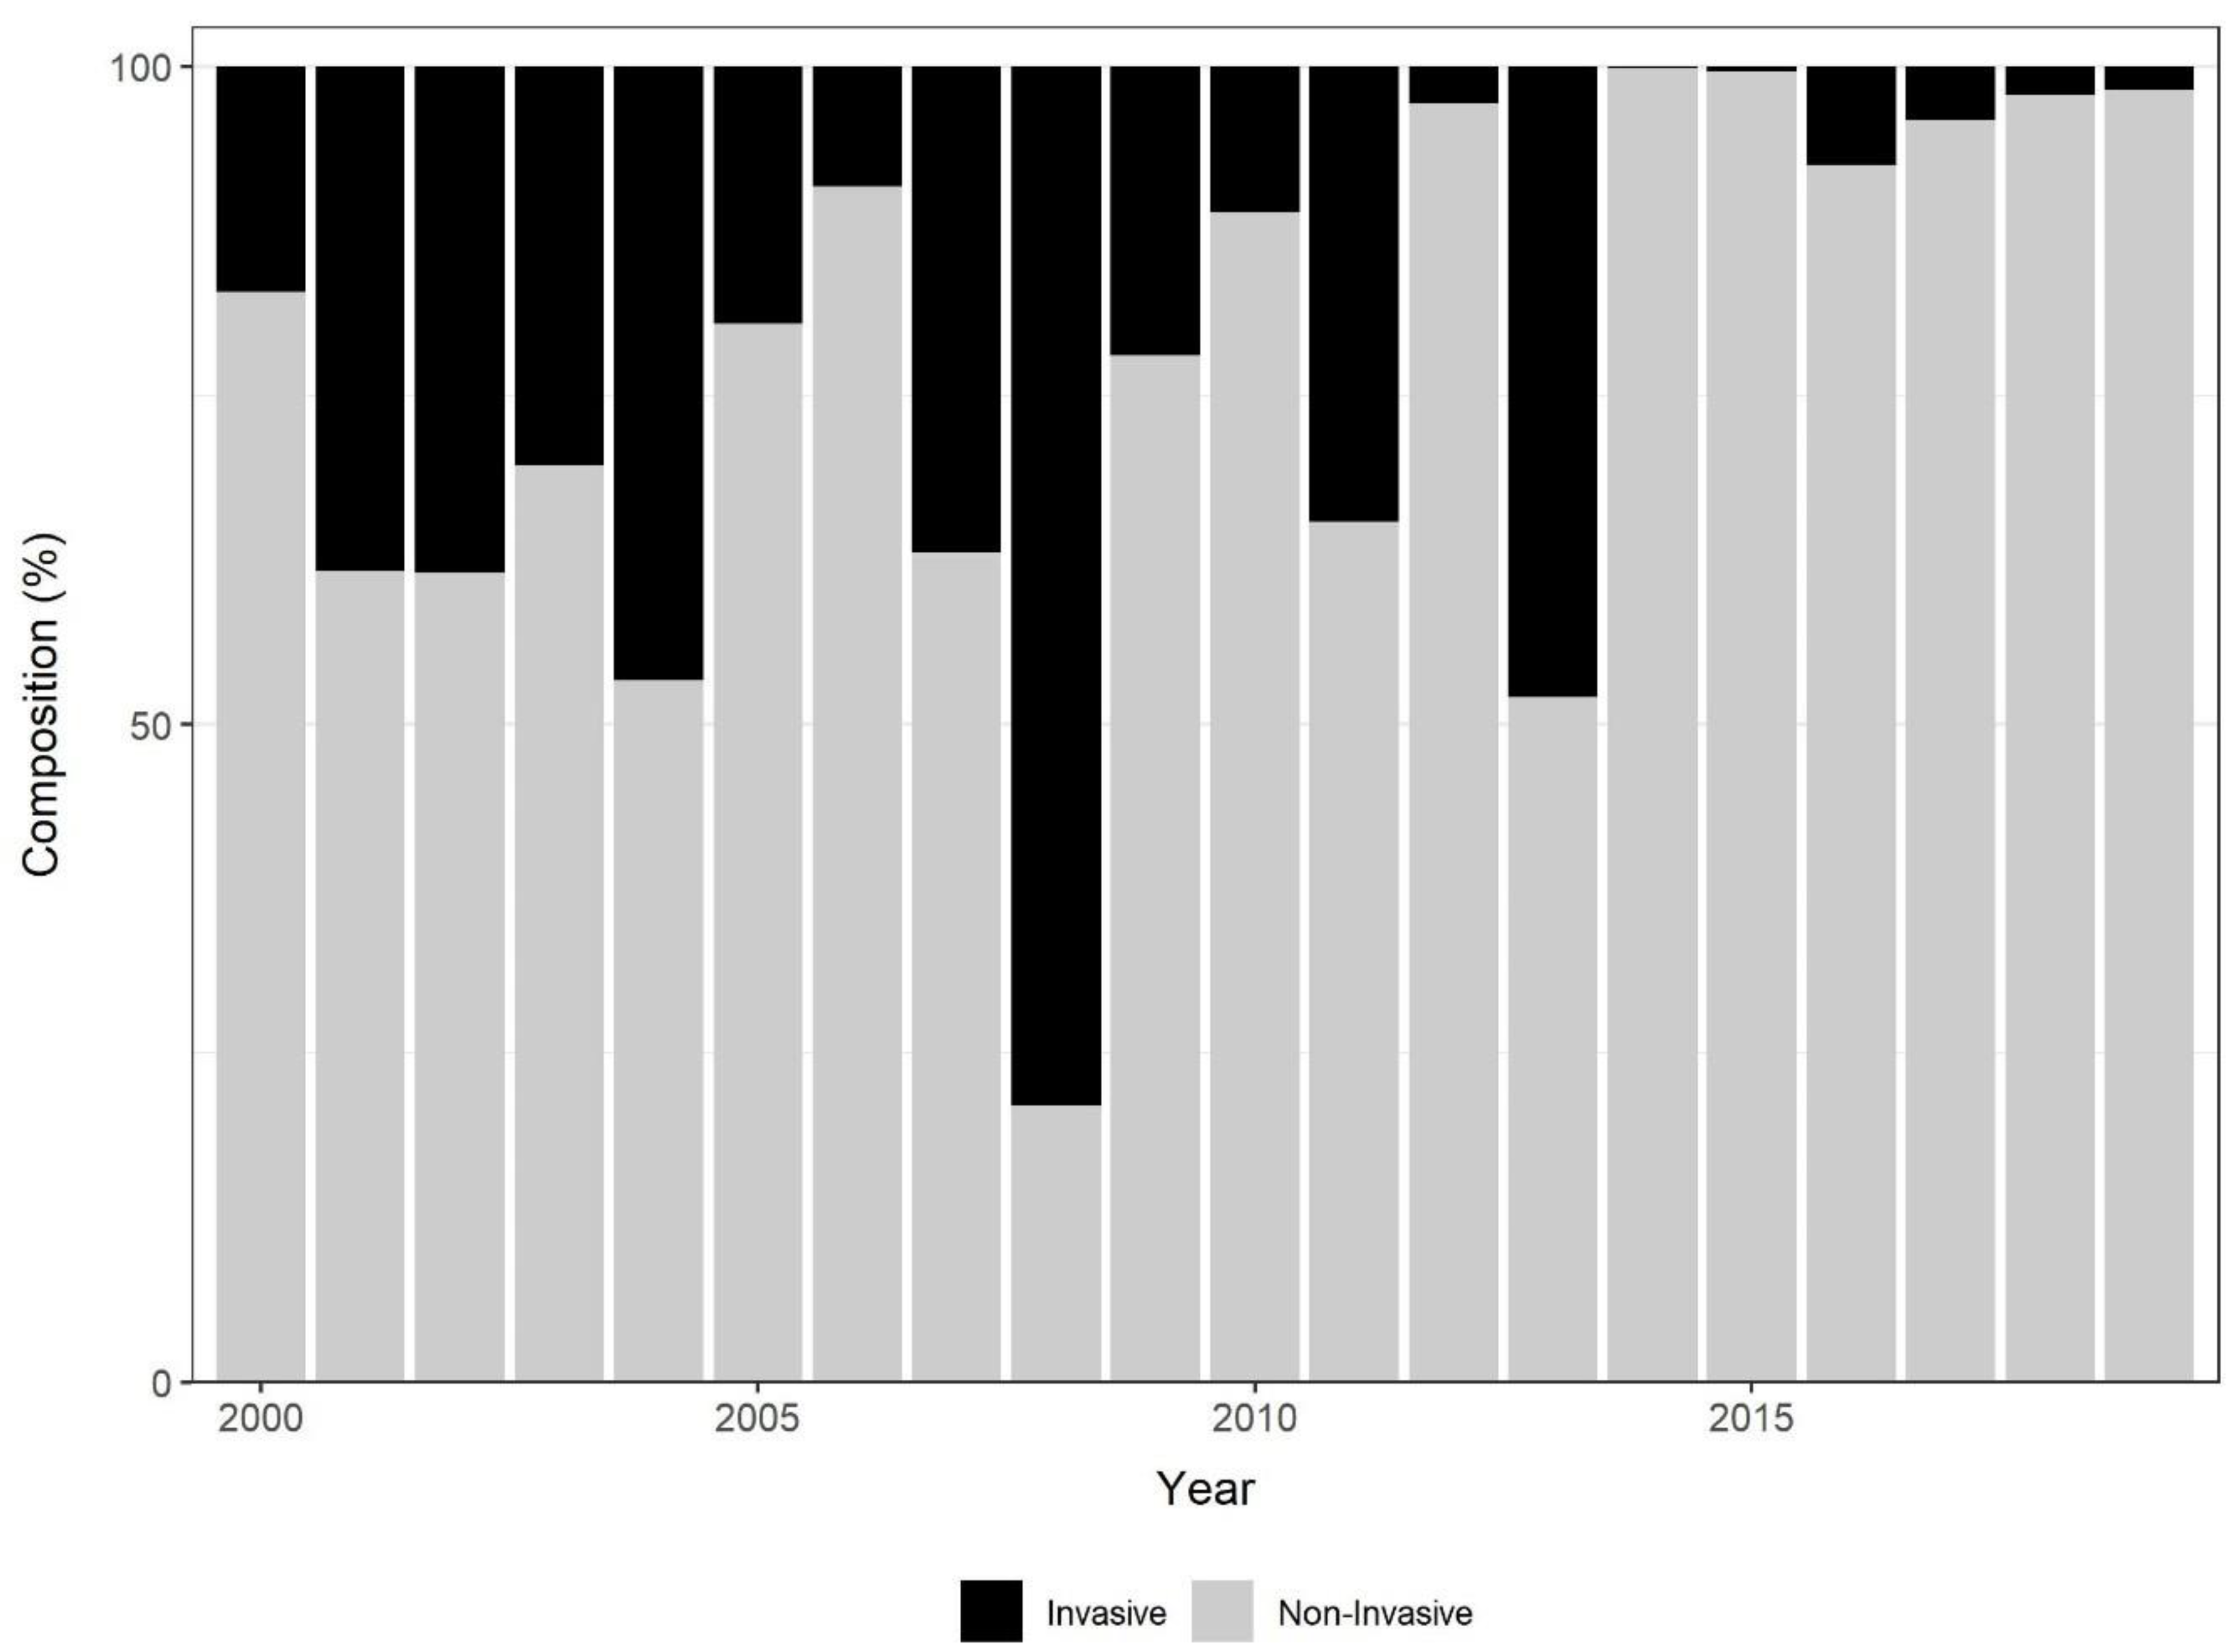
3.2. Invasive Species Prevalence
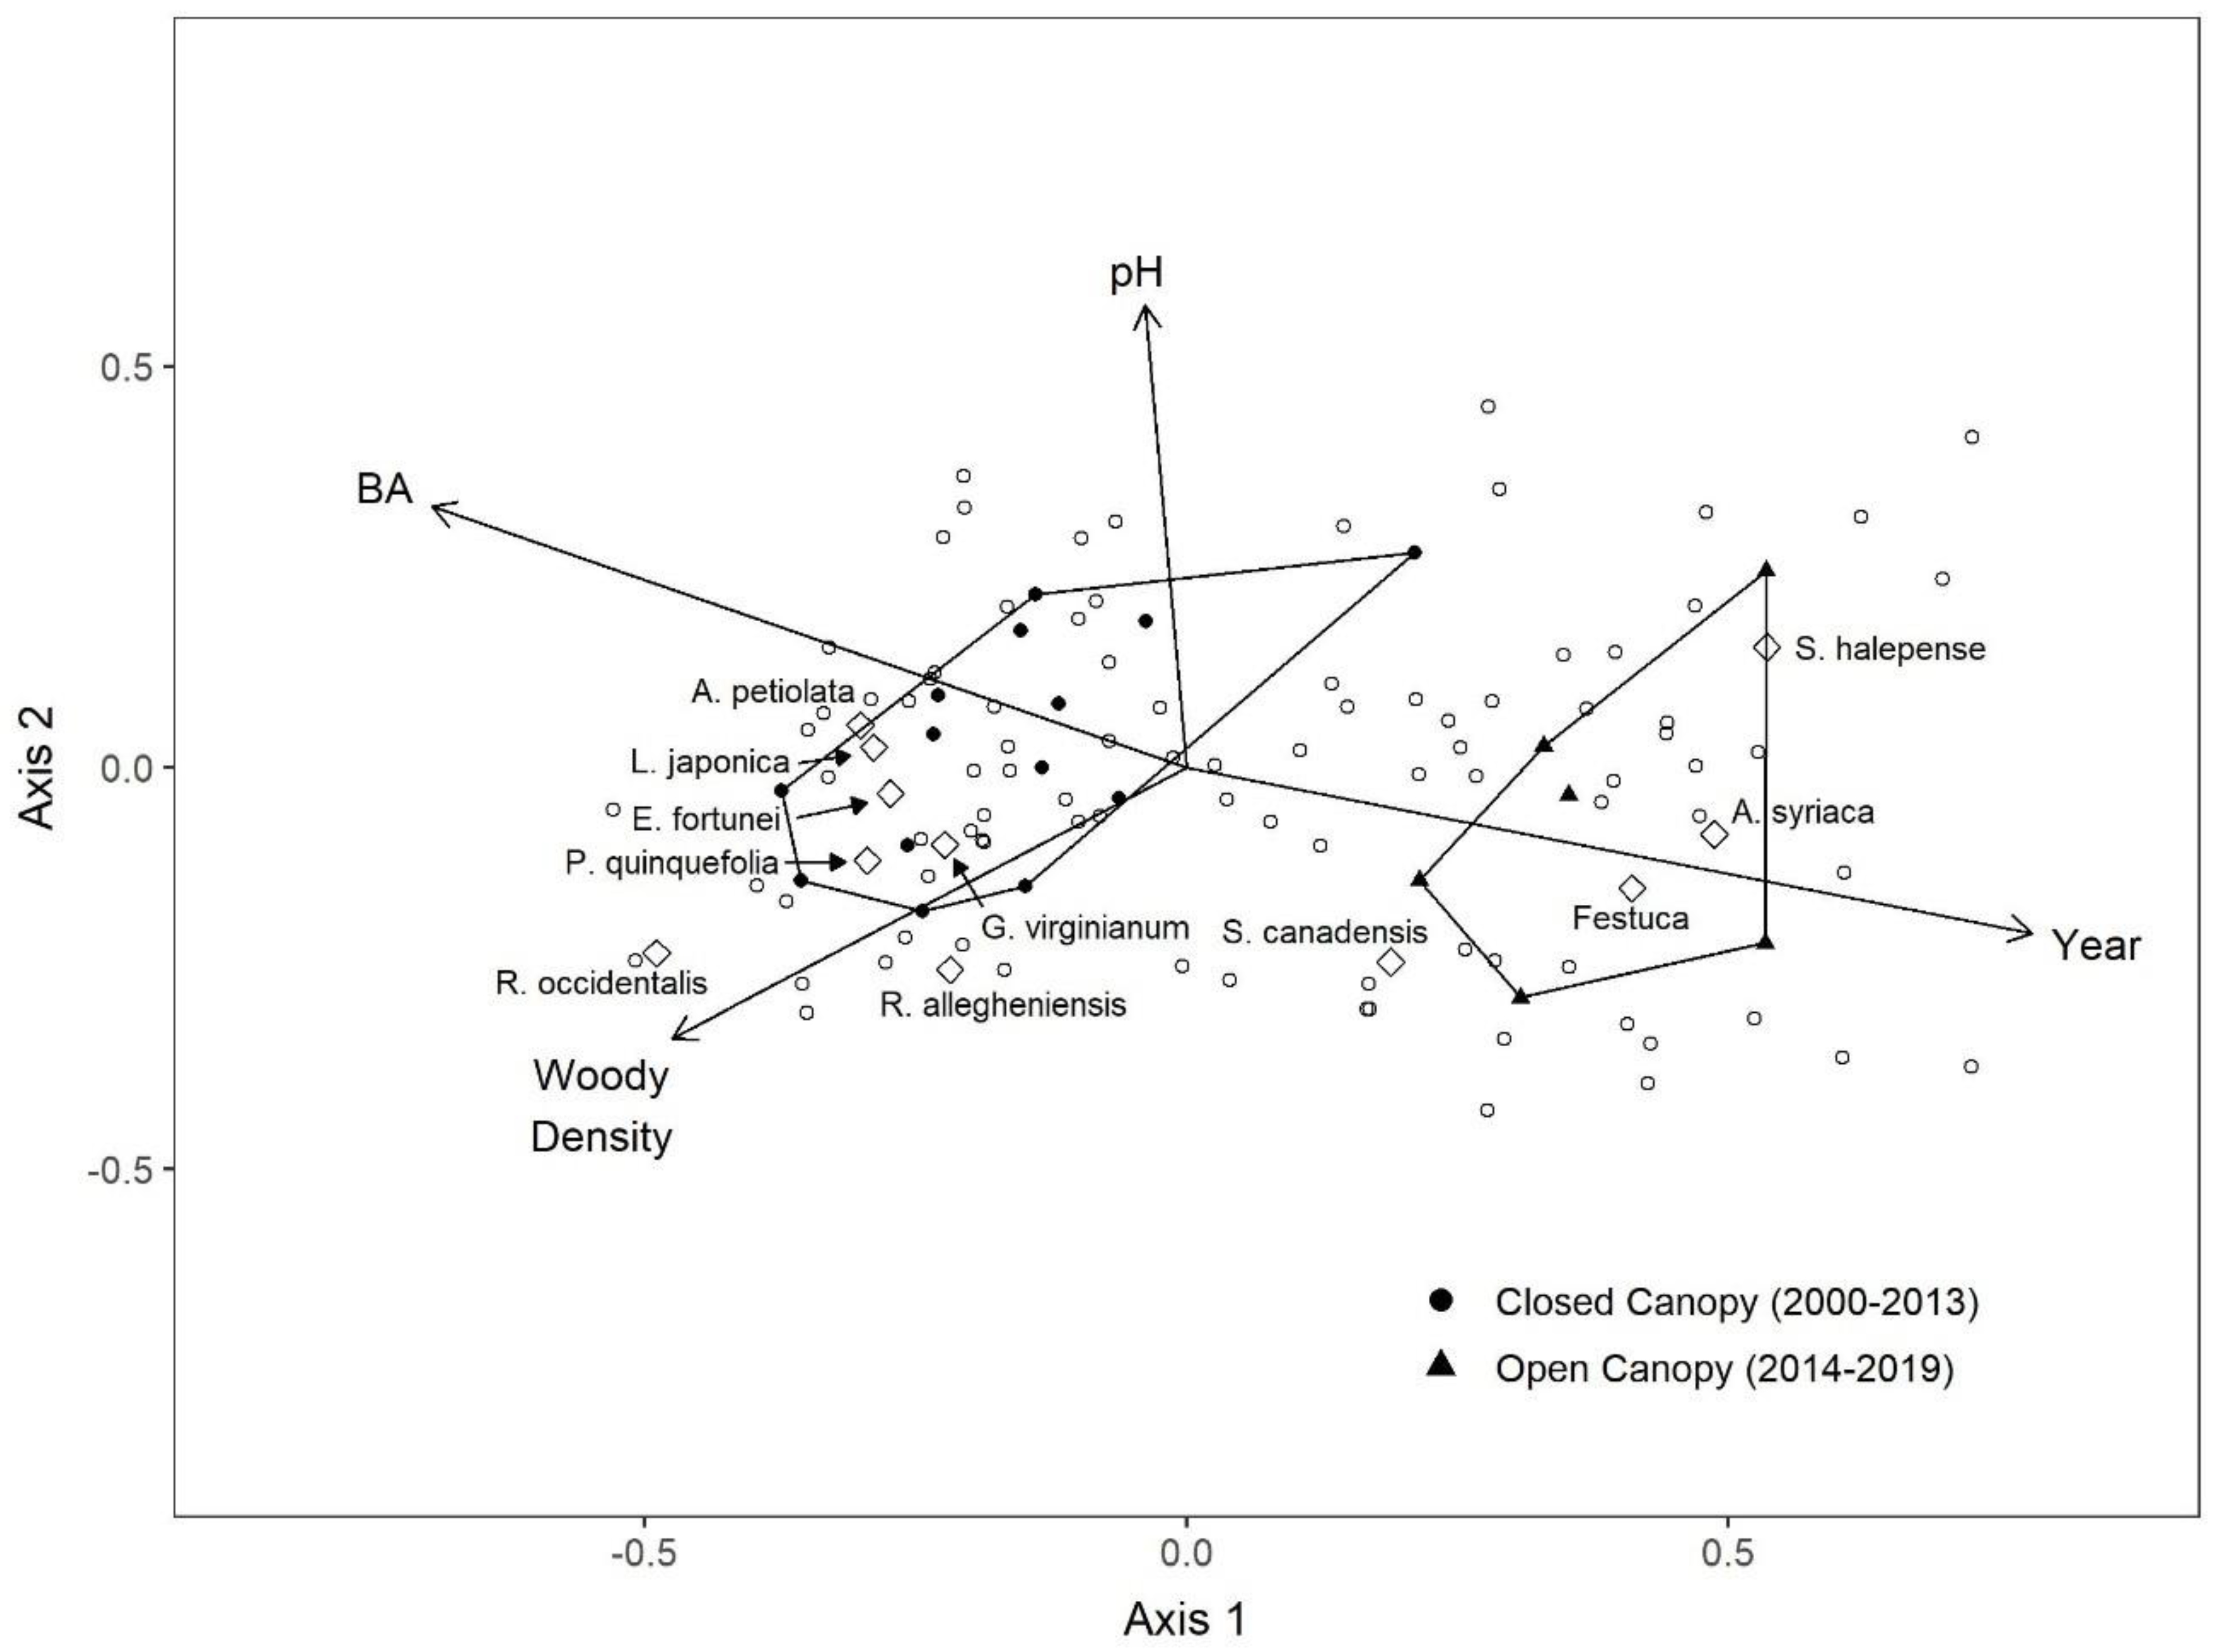
3.3. NMDS
4. Discussion
Author Contributions
Funding
Institutional Review Board Statement
Informed Consent Statement
Data Availability Statement
Acknowledgments
Conflicts of Interest
References
- Eurostat. Urban Europe. Statistics on Cities, Towns and Suburbs; European Commission: Luxembourg, 2016; Available online: http://ec.europa.eu/eurostat/web/products-statistical-books/-/KS-01-16-691 (accessed on 29 March 2019).
- Statista. Forecast on the Degree of Urbanization in the United States from 2000 to 2050. Statista. 2018. Available online: https://www.statista.com/statistics/678561/urbanization-in-the-united-states/ (accessed on 21 December 2022).
- Cannon, W.F.; Horton, J.D. Soil geochemical signature of urbanization and industrialization–Chicago, Illinois, USA. Appl. Geochem. 2009, 24, 1590–1601. [Google Scholar] [CrossRef]
- Pouyat, R.V.; Yesilonis, I.D.; Szlavecz, K.; Csuzdi, C.; Hornung, E.; Korsós, Z.; Russell-Anelli, J.; Giorgio, V. Response of forest soil properties to urbanization gradients in three metropolitan areas. Landsc. Ecol. 2008, 23, 1187–1203. [Google Scholar] [CrossRef]
- Zhang, X.; Han, L.; Wei, H.; Tan, X.; Zhou, W.; Li, W.; Qian, Y. Linking urbanization and air quality together: A review and a perspective on the future sustainable urban development. J. Clean. Prod. 2022, 346, 130988. [Google Scholar] [CrossRef]
- Peters, N.E. Effects of urbanization on stream water quality in the city of Atlanta, Georgia, USA. Hydrol. Process. Int. J. 2009, 23, 2860–2878. [Google Scholar] [CrossRef]
- Deilami, K.; Kamruzzaman, M.; Liu, Y. Urban heat island effect: A systematic review of spatio-temporal factors, data, methods, and mitigation measures. Int. J. Appl. Earth Obs. Geoinf. 2018, 67, 30–42. [Google Scholar] [CrossRef]
- LeBlanc, R.T.; Brown, R.D.; FitzGibbon, J.E. Modeling the effects of land use change on the water temperature in unregulated urban streams. J. Environ. Manag. 1997, 49, 445–469. [Google Scholar] [CrossRef]
- Fuller, D.O. Forest fragmentation in Loudoun County, Virginia, USA evaluated with multitemporal Landsat imagery. Landsc. Ecol. 2001, 16, 627–642. [Google Scholar] [CrossRef]
- Duguay, S.; Eigenbrod, F.; Fahrig, L. Effects of surrounding urbanization on non-native flora in small forest patches. Landsc. Ecol. 2007, 22, 589–599. [Google Scholar] [CrossRef]
- Markovchick-Nicholls, L.I.S.A.; Regan, H.M.; Deutschman, D.H.; Widyanata, A.; Martin, B.; Noreke, L.; Ann Hunt, T.I.M.O.T.H.Y. Relationships between human disturbance and wildlife land use in urban habitat fragments. Conserv. Biol. 2008, 22, 99–109. [Google Scholar] [CrossRef]
- Scolozzi, R.; Geneletti, D. A multi-scale qualitative approach to assess the impact of urbanization on natural habitats and their connectivity. Environ. Impact Assess. Rev. 2012, 36, 9–22. [Google Scholar] [CrossRef]
- Murray, M.H.; Sánchez, C.A.; Becker, D.J.; Byers, K.A.; Worsley-Tonks, K.E.; Craft, M.E. City sicker? A meta-analysis of wildlife health and urbanization. Front. Ecol. Environ. 2019, 17, 575–583. [Google Scholar] [CrossRef]
- Walsh, C.J.; Roy, A.H.; Feminella, J.W.; Cottingham, P.D.; Groffman, P.M.; Morgan, R.P. The urban stream syndrome: Current knowledge and the search for a cure. J. N. Am. Benthol. Soc. 2005, 24, 706–723. [Google Scholar] [CrossRef]
- Horn, H.S. The ecology of secondary succession. Annu. Rev. Ecol. Syst. 1974, 5, 25–37. [Google Scholar] [CrossRef]
- Anderson, E.C.; Minor, E.S. Vacant lots: An underexplored resource for ecological and social benefits in cities. Urban For. Urban Green. 2017, 21, 146–152. [Google Scholar] [CrossRef]
- Oldfield, E.E.; Warren, R.J.; Felson, A.J.; Bradford, M.A. Challenges and future directions in urban afforestation. J. Appl. Ecol. 2013, 50, 1169–1177. [Google Scholar] [CrossRef]
- Lexington-Fayette Urban County Government. Reforest the Bluegrass. Available online: https://www.lexingtonky.gov/reforest-bluegrass (accessed on 21 December 2022).
- Kentucky Geological Survey. Bluegrass Region. Available online: https://www.uky.edu/KGS/geoky/regionbluegrass.htm (accessed on 21 December 2022).
- Bryant, W.S.; Wharton, M.E.; Martin, W.H.; Varner, J.B. The Blue Ash-Oak Savanna: Woodland, a Remnant of Presettlement Vegetation in the Inner Bluegrass of Kentucky. Castanea 1980, 45, 149–165. [Google Scholar]
- Fralish, J.S. The Keystone Role of Oak and Hickory in the Central Hardwood Forest; Gen. Tech. Rep. SRS-73; US Department of Agriculture, Forest Service, Southern Research Station: Asheville, NC, USA, 2004; pp. 78–87. [Google Scholar]
- Alexander, H.D.; Siegert, C.; Brewer, J.S.; Kreye, J.; Lashley, M.A.; McDaniel, J.K.; Paulson, A.K.; Renninger, H.J.; Varner, J.M. Mesophication of oak landscapes: Evidence, knowledge gaps, and future research. BioScience 2021, 71, 531–542. [Google Scholar] [CrossRef]
- Swanston, C.; Brandt, L.A.; Janowiak, M.K.; Handler, S.D.; Butler-Leopold, P.; Iverson, L.; Thompson, F.R., III; Ontl, T.A.; Shannon, P.D. Vulnerability of forests of the Midwest and Northeast United States to climate change. Clim. Chang. 2018, 146, 103–116. [Google Scholar] [CrossRef]
- Herms, D.A.; McCullough, D.G. Emerald ash borer invasion of North America: History, biology, ecology, impacts, and management. Annu. Rev. Entomol. 2014, 59, 13–30. [Google Scholar] [CrossRef] [Green Version]
- Haavik, L.J.; Jones, J.S.; Galligan, L.D.; Guldin, J.M.; Stephen, F.M. Oak decline and red oak borer outbreak: Impact in upland oak-hickory forests of Arkansas, USA. For. Int. J. For. Res. 2012, 85, 341–352. [Google Scholar] [CrossRef]
- Campbell, J.; Ruch, D.G.; Meijer, W. The flora and vegetation of Raven Run Nature Sanctuary, Fayette County, Kentucky. Proc. Indiana Acad. Sci. 1995, 104, 139–184. [Google Scholar]
- Bartha, S.; Meiners, S.J.; Pickett, S.T.; Cadenasso, M.L. Plant colonization windows in a mesic old field succession. Appl. Veg. Sci. 2003, 6, 205–212. [Google Scholar] [CrossRef]
- Štajerová, K.; Šmilauer, P.; Brůna, J.; Pyšek, P. Distribution of invasive plants in urban environment is strongly spatially structured. Landsc. Ecol. 2017, 32, 681–692. [Google Scholar] [CrossRef]
- Laband, D.N.; Lockaby, B.G.; Zipperer, W.C. Ch 5 in Laband. Urban-Rural Interfaces: Linking People and Nature. Available online: https://acsess.onlinelibrary.wiley.com/doi/abs/10.2136/2012.urban-rural.c5 (accessed on 4 May 2022).
- Van Kleunen, M.; Essl, F.; Pergl, J.; Brundu, G.; Carboni, M.; Dullinger, S.; Early, R.; González-Moreno, P.; Groom, Q.J.; Hulme, P.E.; et al. The changing role of ornamental horticulture in alien plant invasions. Biol. Rev. 2018, 93, 1421–1437. [Google Scholar] [CrossRef]
- Culley, T.M.; Hardiman, N.A. The beginning of a new invasive plant: A history of the ornamental Callery pear in the United States. BioScience 2007, 57, 956–964. [Google Scholar] [CrossRef] [Green Version]
- McNeish, R.E.; McEwan, R.W. A review on the invasion ecology of Amur honeysuckle (Lonicera maackii, Caprifoliaceae) a case study of ecological impacts at multiple scales1. J. Torrey Bot. Soc. 2016, 143, 367–385. [Google Scholar] [CrossRef] [Green Version]
- Coombs, G.; Gilchrist, D.; Watson, P. An assessment of the native and invasive horticultural plants sold in the mid-Atlantic region. Nativ. Plants J. 2020, 21, 74–82. [Google Scholar] [CrossRef]
- Smith, L.M.; Hall, S. Extended leaf phenology may drive plant invasion through direct and apparent competition. Oikos 2016, 125, 839–848. [Google Scholar] [CrossRef]
- Rounsaville, T.J.; Baskin, C.C.; Roualdes, E.A.; McCulley, R.L.; Arthur, M.A. Seed dynamics of the liana Euonymus fortunei (Celastraceae) and implications for invasibility1. J. Torrey Bot. Soc. 2018, 145, 225–236. [Google Scholar] [CrossRef]
- Bauer, J.T.; Reynolds, H.L. Restoring native understory to a woodland invaded by Euonymus fortunei: Multiple factors affect success. Restor. Ecol. 2016, 24, 45–52. [Google Scholar] [CrossRef]
- Rodgers, V.L.; Stinson, K.A.; Finzi, A.C. Ready or not, garlic mustard is moving in: Alliaria petiolata as a member of eastern North American forests. Bioscience 2008, 58, 426–436. [Google Scholar] [CrossRef] [Green Version]
- Stinson, K.; Kaufman, S.; Durbin, L.; Lowenstein, F. Impacts of garlic mustard invasion on a forest understory community. Northeast. Nat. 2007, 14, 73–88. [Google Scholar] [CrossRef]
- Jacobs, S.L.; Hackworth, Z.J.; Comer, K.; Wittenbraker, W.; Maugans, J.J.; Jensen, K.L.; Sena, K.L. Species and Height of Understory Trees and Shrubs in a Chronosequence of Reforested Urban Sites; ver 1; Environmental Data Initiative: Lexington, KY, USA, 2021. [Google Scholar] [CrossRef]
- Jones, R.L. Plant Life of Kentucky: An Illustrated Guide to the Vascular Flora; University Press of Kentucky: Lexington, KY, USA, 2005. [Google Scholar]
- SPAC. Soil and Plant Analysis Council. Soil and Plant Analysis Council. Soil pH, and exchangeable acidity and aluminum. In Soil Analysis Handbook of Reference Methods; CRC Press: Boca Raton, FL, USA, 2000; Chapter 3. [Google Scholar]
- SPAC. Soil and Plant Analysis Council. Phosphorus. In Soil Analysis Handbook of Reference Methods; CRC Press: Boca Raton, FL, USA, 2000; Chapter 6. [Google Scholar]
- SPAC. Soil and Plant Analysis Council. Major cations (potassium, calcium, magnesium, and sodium). In Soil Analysis Handbook of Reference Methods; CRC Press: Boca Raton, FL, USA, 2000; Chapter 7. [Google Scholar]
- Miller, W.P.; Miller, D.M. A micro-pipette method for soil mechanical analysis. Commun. Soil Sci. Plant Anal. 1987, 18, 1–15. [Google Scholar] [CrossRef]
- Burt, R.; Reinsch, T.G.; Miller, W.P. A micro-pipette method for water dispersible clay. Commun. Soil Sci. Plant Anal. 1993, 24, 2531–2544. [Google Scholar] [CrossRef]
- Nelson, D.W.; Sommers, L.E. Total carbon, organic carbon, and organic matter. In Methods of Soil Analysis, Part 2. Chemical and Microbiological Properties, 2nd ed.; Page, A.L., Miller, R.H., Keeney, D.R., Eds.; ASA-SSSA: Madison, WI, USA, 1982. [Google Scholar]
- Sena, K.L.; Hackworth, Z.J.; Lhotka, J.M. Forest development over a twenty-year chronosequence of reforested urban sites. Forests 2021, 12, 614. [Google Scholar] [CrossRef]
- Jacobs, S.L.; Hackworth, Z.J.; Comer, K.; Wittenbraker, W.; Maugans, J.J.; Jensen, K.L.; Sena, K.L. Chemical and Physical Characteristics of Soil Samples Collected from a Chronosequence of Reforested Urban Sites; ver 1; Environmental Data Initiative: Lexington, KY, USA, 2021. [Google Scholar] [CrossRef]
- Hurlbert, S.H. The nonconcept of species diversity: A critique and alternative parameters. Ecology 1971, 52, 577–586. [Google Scholar] [CrossRef] [Green Version]
- Simberloff, D. Properties of the rarefaction diversity measurement. Am. Nat. 1972, 106, 414–418. [Google Scholar] [CrossRef]
- Heck, K.L., Jr.; van Belle, G.; Simberloff, D. Simberloff. Explicit calculation of the rarefaction diversity measurement and the determination of sufficient sample size. Ecology 1975, 56, 1459–1461. [Google Scholar] [CrossRef]
- R Core Team. R: A Language and Environment for Statistical Computing; R Foundation for Statistical Computing: Vienna, Austria, 2022. [Google Scholar]
- Gelman, A.; Hill, J. Data Analysis Using Regression and Multilevel/Hierarchical Models; Cambridge University Press: Cambridge, UK, 2006. [Google Scholar]
- Bartoń, K. MuMIn: Multi-Model Inference. R Package. Version 1.46.0. 2022. Available online: https://CRAN.R-project.org/package=MuMIn (accessed on 4 May 2022).
- Wood, S. Mgcv: Mixed GAM Computation Vehicle with Automatic Smoothness Estimation. R Package Version 1.8-40. 2022. Available online: https://CRAN.R-project.org/package=mgcv (accessed on 4 May 2022).
- Oksanen, J.; Simpson, G.; Blanchet, F.; Kindt, R.; Legendre, P.; Minchin, P.; O’Hara, R.; Solymos, P.; Stevens, M.; Szoecs, E.; et al. Vegan: Community Ecology Package. R Package Version 2.6-2. 2022. Available online: https://CRAN.R-project.org/package=vegan (accessed on 4 May 2022).
- Elliott, K.J.; Boring, L.R.; Swank, W.T. Changes in vegetation structure and diversity after grass-to-forest succession in a southern Appalachian watershed. Am. Midl. Nat. 1998, 140, 219–232. [Google Scholar] [CrossRef] [Green Version]
- Sena, K.; Barton, C.; Hall, S.; Angel, P.; Agouridis, C.; Warner, R. Influence of spoil type on afforestation success and natural vegetative recolonization on a surface coal mine in Appalachia, United States. Restor. Ecol. 2015, 23, 131–138. [Google Scholar] [CrossRef]
- Templeton, L.K.; Neel, M.C.; Groffman, P.M.; Cadenasso, M.L.; Sullivan, J.H. Changes in vegetation structure and composition of urban and rural forest patches in Baltimore from 1998 to 2015. For. Ecol. Manag. 2019, 454, 117665. [Google Scholar] [CrossRef]
- Doroski, D.A.; Felson, A.J.; Bradford, M.A.; Ashton, M.P.; Oldfield, E.E.; Hallett, R.A.; Kuebbing, S.E. Factors driving natural regeneration beneath a planted urban forest. Urban For. Urban Green. 2018, 29, 238–247. [Google Scholar] [CrossRef]
- Hawthorne, T.L.; Elmore, V.; Strong, A.; Bennett-Martin, P.; Finnie, J.; Parkman, J.; Harris, T.; Singh, J.; Edwards, L.; Reed, J. Mapping non-native invasive species and accessibility in an urban forest: A case study of participatory mapping and citizen science in Atlanta, Georgia. Appl. Geogr. 2015, 56, 187–198. [Google Scholar] [CrossRef]
- Godefroid, S.; Koedam, N. Distribution pattern of the flora in a peri-urban forest: An effect of the city–forest ecotone. Landsc. Urban Plan. 2003, 65, 169–185. [Google Scholar] [CrossRef]
- Nuzzo, V. Invasion pattern of herb garlic mustard (Alliaria petiolata) in high quality forests. Biol. Invasions 1999, 1, 169–179. [Google Scholar] [CrossRef]
- Mattingly, K.Z. Recovery of forest floor diversity after removal of the nonnative, invasive plant Euonymus fortunei. J. Torrey Bot. Soc. 2016, 143, 103–116. [Google Scholar] [CrossRef]
- Barto, E.K.; Cipollini, D. Garlic mustard (Alliaria petiolata) removal method affects native establishment. Invasive Plant Sci. Manag. 2009, 2, 230–236. [Google Scholar] [CrossRef]
- Herold, J.; Anderson, M.R.; Bauer, J.T.; Borowicz, V.; Anderson, R.C. Comparison of the effect of early and late removal of second-year garlic mustard (Alliaria petiolata) on first-year plants and deciduous forest spring and summer dominant herbaceous groundlayer species in central Illinois, USA. Ecol. Restor. 2011, 29, 225–233. [Google Scholar] [CrossRef]
- Barlow, K.M.; Mortensen, D.A.; Drohan, P.J. Soil pH influences patterns of plant community composition after restoration with native-based seed mixes. Restor. Ecol. 2020, 28, 869–879. [Google Scholar] [CrossRef]
- Pouyat, R.V.; Szlavecz, K.; Yesilonis, I.D.; Groffman, P.M.; Schwarz, K. Chemical, physical, and biological characteristics of urban soils. Urban Ecosyst. Ecol. 2010, 55, 119–152. [Google Scholar]
- Johnson, A.L.; Tauzer, E.C.; Swan, C.M. Human legacies differentially organize functional and phylogenetic diversity of urban herbaceous plant communities at multiple spatial scales. Appl. Veg. Sci. 2015, 18, 513–527. [Google Scholar] [CrossRef]
- de la Pena, E.; Baeten, L.; Steel, H.; Viaene, N.; De Sutter, N.; De Schrijver, A.; Verheyen, K. Beyond plant–soil feedbacks: Mechanisms driving plant community shifts due to land-use legacies in post-agricultural forests. Funct. Ecol. 2016, 30, 1073–1085. [Google Scholar] [CrossRef]


| Covariate | Description (Units) | Mean ± SE (Extrema) |
|---|---|---|
| Basal Area | Basal area of plantation (m2 ha−1) | 9.4 ± 0.9 (0, 39.9) |
| Carbon | Soil carbon concentration (%) | 3.5 ± 0.1 (1.4, 6.7) |
| Calcium | Soil calcium concentration (mg kg−1) | 3126.9 ± 127.1 (918.5, 7024.0) |
| Canopy | Presence of open or closed canopy (Sena et al., 2021) | - |
| Clay | Soil clay content (%) | 15.0 ± 0.4 (0.6, 30.5) |
| Developed | Developed landcover within 1 km (%) | 59.7 ± 0.03 (3.7, 98.6) |
| Magnesium | Soil magnesium concentration (mg kg−1) | 213.0 ± 6.9 (69.0, 497.5) |
| Nitrogen | Soil nitrogen concentration (%) | 0.3 ± 0.01 (0.1, 0.6) |
| pH | Soil pH | 5.6 ± 0.1 (4.0, 7.1) |
| Phosphorus | Soil phosphorus concentration (mg kg−1) | 161.8 ± 8.0 (16.5, 400.0) |
| Potassium | Soil potassium concentration (mg kg−1) | 149.3 ± 7.5 (42.5, 353.0) |
| Sand | Soil sand content (%) | 16.4 ± 0.4 (9.0, 33.6) |
| Silt | Soil silt content (%) | 68.6 ± 0.6 (41.0, 80.0) |
| TWI | Topographic wetness index | 6.1 ± 0.02 (5.6, 6.7) |
| Woody Density | Density of woody stems with tree/shrub architecture (stems ha−1) | 3928 ± 3812 (0, 17,297) |
| Woody Height | Height of woody stems with tree/shrub architecture (cm) | 98.8 ± 6.1 (0, 285) |
| Year | Year of tree planting | (2000, 2019) |
| Zinc | Soil zinc concentration (mg kg−1) | 6.2 ± 1.1 (1.1, 102.5) |
| Response Variable | EDF | F | p | R2 |
|---|---|---|---|---|
| Species Richness | 2.6 | 16.9 | <0.001 | 0.22 |
| Shannon Diversity Index | 3.4 | 31.9 | <0.001 | 0.52 |
| Simpson Diversity Index | 3.5 | 41.6 | <0.001 | 0.6 |
| Covariate | Axis 1 | Axis 2 |
|---|---|---|
| Basal Area | −0.65 (0.002) | 0.21 (0.37) |
| Carbon | 0.1 (0.69) | −0.16 (0.5) |
| Calcium | 0.09 (0.71) | 0.36 (0.12) |
| Clay | 0.21 (0.37) | 0.04 (0.87) |
| Developed | −0.24 (0.3) | 0.22 (0.34) |
| Magnesium | −0.07 (0.76) | −0.28 (0.23) |
| Nitrogen | 0.09 (0.7) | −0.17 (0.47) |
| pH | 0.08 (0.72) | 0.52 (0.02) |
| Phosphorus | −0.1 (0.68) | 0.03 (0.89) |
| Potassium | −0.14 (0.57) | −0.24 (0.31) |
| Sand | 0.34 (0.15) | 0.18 (0.44) |
| Silt | −0.2 (0.39) | −0.11 (0.63) |
| TWI | 0.36 (0.12) | −0.13 (0.59) |
| Woody Density | −0.64 (0.002) | −0.18 (0.45) |
| Woody Height | −0.21 (0.37) | 0.04 (0.62) |
| Year | 0.75 (0.0002) | −0.12 (0.62) |
| Zinc | −0.3 (0.19) | 0.39 (0.09) |
| Covariate | Axis 1 | Axis 2 | p | R2 |
| Basal Area | −0.906 | 0.423 | <0.001 | 0.591 |
| pH | −0.066 | 0.998 | 0.033 | 0.333 |
| Planting Year | 0.967 | −0.256 | <0.001 | 0.652 |
| Understory Density | −0.814 | −0.580 | 0.029 | 0.339 |
Disclaimer/Publisher’s Note: The statements, opinions and data contained in all publications are solely those of the individual author(s) and contributor(s) and not of MDPI and/or the editor(s). MDPI and/or the editor(s) disclaim responsibility for any injury to people or property resulting from any ideas, methods, instructions or products referred to in the content. |
© 2023 by the authors. Licensee MDPI, Basel, Switzerland. This article is an open access article distributed under the terms and conditions of the Creative Commons Attribution (CC BY) license (https://creativecommons.org/licenses/by/4.0/).
Share and Cite
Sena, K.L.; Hackworth, Z.J.; Maugans, J.; Lhotka, J.M. Twenty Years of Urban Reforestation: Overstory Development Structures Understory Plant Communities in Lexington, KY, USA. Sustainability 2023, 15, 1985. https://doi.org/10.3390/su15031985
Sena KL, Hackworth ZJ, Maugans J, Lhotka JM. Twenty Years of Urban Reforestation: Overstory Development Structures Understory Plant Communities in Lexington, KY, USA. Sustainability. 2023; 15(3):1985. https://doi.org/10.3390/su15031985
Chicago/Turabian StyleSena, Kenton L., Zachary J. Hackworth, Julia Maugans, and John M. Lhotka. 2023. "Twenty Years of Urban Reforestation: Overstory Development Structures Understory Plant Communities in Lexington, KY, USA" Sustainability 15, no. 3: 1985. https://doi.org/10.3390/su15031985