Article

From Natural Woods to High Density Materials: An Ecofriendly Approach

Dipartimento per lo Sviluppo Sostenibile e la Transizione Ecologica, Università degli Studi del Piemonte Orientale, Piazza S. Eusebio, 5-13100 Vercelli, Italy
*
Author to whom correspondence should be addressed.
Sustainability 2023, 15(3), 2055; https://doi.org/10.3390/su15032055
Submission received: 5 December 2022 / Revised: 12 January 2023 / Accepted: 17 January 2023 / Published: 21 January 2023
(This article belongs to the Special Issue Sustainable Use of Forest Biomass for Fuel and Chemical Productions)

Abstract

:
Recently, different methods have been proposed to develop wood materials, termed “densified woods”, with density increment and improvement in mechanical proprieties. Almost all the proposed methods involve the use of reducing agents and strong bases. In this work, a new method has been developed involving the use of less polluting agents. The formation of densified woods is divided into two steps: delignification involves the removal of lignin, hemicelluloses, and shorter chains of cellulose, whereas densification involves the plastering of the delignified woods. The obtained materials showed a density increase of two to four times. The obtained densified woods were characterized by spectroscopic, microscopic, and thermogravimetric techniques and mechanical tests. The characterizations aimed at determining the variations of chemical and structural compositions of the samples after delignification and densification processes, showing, respectively, a decrease in lignin and a significant increase in the density and force necessary to bring the materials to yield. The final density of wood was two to three times higher and the force necessary to reach the yield point reached more than three times the initial one for some of the studied samples. These characterizations showed how different woods, with different properties, reach comparable densities and final mechanical properties after delignification and densification process. The increased mechanical properties of the materials allow their application in place of other composite woody materials.

1. Introduction

Wood derives from the xylem of the plants. This organ has two functions: (i) it transfers and stores water, mineral salts, sugar, hormones, and (ii) it supports the plant [1]. Over time, when xylem grows, lignin fills the space between cellulose and hemicellulose to confer rigidity and strength to the wood [2]. Given its natural origin, it is not possible to identify every single component and its exact percentage composing the wood, since it derives from living organisms. The chemical composition of wood components is related to many factors: among these, the most influential are the species and age of the tree, the climate, the type of soil, and the availability of water and nutrients, but it is possible to identify three major classes of compounds which can group all the components that form wood: carbohydrates (cellulose, hemicellulose, and free sugars such as D-glucose, D-fructose, and low polymerization degree polysaccharides) with a 65–75% concentration, lignin is 18–35% of the woody mass and inorganic compounds are about 4–10% [3]. Each plant species is characterized by different percentages of cellulose and lignin which impart different chemical, physical, and mechanical properties to the wood [4,5,6]. Density is the parameter that can be easily related to the percentage of cellulose and lignin contained in wood; every wood has its own characteristic density and the main density values are compared in Figure 1. Wood can be classified such as Softwood and Hardwood on the base of the different percentage of monomers that form the lignin. Softwood (generally deriving from conifers, e.g., pine, fir, and spruce) and hardwood (generally deriving from deciduous, e.g., oak, mahogany, and birch) present differences in term of density, moisture adsorption, aging, and mechanical properties [7].
In the last few years, a lot of different methods were proposed to produce a wood material with density increment and an improvement of its mechanical proprieties. All wood densification processes known in literature involve a first step of lignin removal (delignification) with different solubilization techniques. All currently known delignification processes involve the use of strong bases (such as NaOH) capable of hydrolyzing the ethereal bridges constituting the lignin structure, among the reagents that are mostly used in the delignification phases we can find Na2SO3, H2O2, and choline chloride. Delignification processes using Na2SO3 and H2O2 require the use of strong bases, such as NaOH, at high concentrations [8,9,10,11]. The removal of the lignin fraction can be carried out applying various conditions such as: using selective oxidizing agents [9], or reagents that can break ether groups to form fragments of lignin with polar groups which can increase their solubility [11], and, lastly, employing high temperatures, strong bases, and compounds able to make the reaction environment as nonpolar as possible to increase the amount of removed lignin [10]. The goal of all these delignification processes is to expose the cellulose chains, present in the woody material, by removing the lignin that covers them, to allow a better interaction among the cellulose chains. Other possibilities, not yet sufficiently detailed by the literature, include the use of bleaching agents [12]. Regardless of the technique used in the delignification phase to obtain densified woods, it is necessary to subject the material to physical treatments, e.g., applying pressures, to obtain the approach of the cellulose chains and the formation of new interactions. After the physical treatments, the chains of cellulose can form hydrogen bonds with neighboring chains, increasing the mechanical properties of the material [8,9,10,11]. After densification process, the woody materials can be called “densified wood” and their mechanical performances can be the same or superior compared to different metal alloy [8].
The combination of chemical and physical processes (e.g., delignification and pressing processes of wooden materials) leads to the formation of natural materials with higher densities and mechanical properties than the starting materials. As demonstrated in the literature, the final densities of the materials that underwent these treatments showed an increase that fluctuated between +23% and +135% [13].
In this work, it was decided to use two different types of wood. The first studied wood belongs to silver fir (Abies alba), while the second studied wood belongs to red larch (Larix decidua). These two woods differ from each other because of the different percentages of lignin, cellulose, density, and mechanical properties. Mechanical and physical properties of untreated fir and larch wood are known in the literature (e.g., traction resistance, compression resistance, aging, humidity adsorption) [14,15]. The woods deriving from silver fir and red larch are two of the principal types of wood produced in Italy.

2. Materials and Methods

2.1. Preliminary Phase

Fir and larch woods were used because their mechanical and chemical properties, in terms of composition, are known; moreover, they are readily available on the market. Commercial fir and larch wood were used to allow a direct comparison with the same woods produced industrially.
Fir and larch wood samples were cut into specimens of a known size (2.00 ± 0.05 × 2.00 ± 0.03 × 3.85 ± 0.11 cm), dried at a temperature of 50 °C up to a constant weight, and the density was calculated based on the weight and volume. The average weight, volume, and density of the two specimens are reported in Table 1.
Delignification process was carried out by placing woody materials in 30 mL of solution containing 2.0 g of NaOH and 5.0 mg of Anthraquinone. The solution and woody materials were heated at 170 °C for 24 h. In a successive delignification process, the samples were washed with water until the solution was completely discolored. Samples were dried to constant weight at 50 °C.
Two different densification process were carried out, the first densification process was divided into two steps, the first step subjected the wood sample to a pressure of 8 MPa for 3 h at room temperature (25 °C), the second step increased the temperature to 90 °C for 3 min maintaining pressure at 8 MPa. The second densification process was divided into three steps. In the first step, the wood sample was immersed in a TEOS bath for 24 h at a temperature of −20 °C. In the second step, the wood samples were pressed at 8 MPa for 3 h at a temperature of 40 °C, successively; in the third step, the samples were heated to 140 °C for 3 min maintaining pressure at 8 MPa.

2.2. Scanning Electron Microscopy (SEM)

SEM images at different magnification were recorded by means of a FEI Quanta 200 (Hillsboro, OR, USA) Scanning Electron Microscope equipped with an EDAX (Mahwah, NJ, USA) Energy Dispersive Spectroscope (EDS) detector attachment, using a tungsten filament as electron source at 20 kV. The instrument was used in Low Vacuum mode (90 Pa of water pressure in chamber) to avoid samples’ metallization.

2.3. Thermogravimetry (TGA)

TGA analyses were performed on a Setaram (Caluire, France) LABSYS evo (TGA, DTA/DSC) under N2 (gas flow rate 40 mL/min), heating the samples from 30 °C to 700 °C with a rate of 5 °C/min. TGA analysis was carried out on 10 mg of sample.

2.4. X-ray Fluorescence Spectrometry (XRF)

XRF measurements were performed with an EDXRF Thermo Fisher Scientific (Waltham, MA, USA) NITON spectrometer XL3T-900 GOLDD model, equipped with an Ag tube (max. 50 kV, 100 μA, 2 W), a large area SDD detector, with an energy resolution of about 136 eV at 5.9 keV. The analyzed spot had an average diameter of 3 mm and was focused by a CCD camera, with a working distance of 2 mm. Total time of analysis was 240 s. The instrument was held in position with a moving stage allowing micrometric shifts to reach the desired probe-to-sample distance; the stage was laid on a tripod. The obtained spectra were processed with the commercial software WinAxil, derived by the academic software QXAS from IAEA.

2.5. Attenuated Total Reflectance Infrared Spectroscopy (ATR-FTIR)

ATR-FTIR analyses were carried out by using an IR Nicolet 5700 (Thermo Fisher Scientific, Waltham, MA, USA) spectrometer with 64 scans, a resolution of 4 cm−1 in a spectral range 4000–400 cm−1.

2.6. Micro-Infrared (Micro-IR)

Micro-IR characterizations were carried out by means of a Nicolet iN10 (Thermo Fisher Scientific, Waltham, MA, USA) spectrometer, considering the spectral range 4000–500 cm−1, with 64 scans and a spectral resolution of 4 cm−1, working in reflectance mode; Norton–Beer function was the applied apodization function.

3. Results

3.1. Wood Delignification

The delignification of the samples was carried out by placing the woody material in contact with 30 mL of solution containing 2.0 g of NaOH and 5.0 mg of anthraquinone, a double concentration than that proposed in the literature [10]. Increased NaOH and anthraquinone concentrations were necessary due to the larger sample size. The solutions and the samples were placed at 170 °C and the time was increased up to 24 h. After this, the delignified material and the solution were separated. The samples were washed with plenty of water until the washing waters were completely discolored. After this operation, the delignified wood sample was left to dry overnight at 50 °C and subsequently weighed to verify the percentage of weight lost during the delignification process.

3.2. Wood Densification

The densification process is a physical and not a chemical process [8,9,10,11]. During this step, the delignified sample is subjected to an external pressure in a tangential direction to the sample. In this phase, the chemical nature of the material is not altered but new intermolecular interactions, which impart physical and mechanical properties to these materials, are created. In this work, two different densification processes were applied. In relation to the first procedure, the sample underwent a pressure of 8 MPa for a time of 3h at room temperature and a subsequent pressing step at a pressure of 8 MPa for a time of 3 min at a temperature of 90 °C. The second process involves a first pressing at a pressure of 8 MPa, for a time of 3 h at a temperature of 40 °C, and a second pressing phase at 8 MPa for 3 min at 140 °C.
The second densification process was applied to the samples after immersing them in a tetraethyl orthosilicate (TEOS) bath for 24 h at −20 °C. The exposure of the delignified samples to TEOS bath causes the material soaking in the siliceous precursor, which can react leading to the formation of siliceous bridges among the cellulose chains during the pressing phase. The different densification processes that were used are shown in Figure 2.
Every densification method was replicated six times. All samples, after the densification process, were weighed and measured for the calculation of volume. The density was calculated on the basis of the mass and volume. The obtained density increments are about ten times higher than the same density increase values found in the literature, obtained using other delignification and densification methods. Table 2 shows the average increase values of the two different woods after the densification processes. The values found in the available literature are in the range of +25% and +135% [13,15,16].
During the delignification and densification processes, the wood sample colors increasingly turned towards darker shades. This color change is due to the oxidation—at least partial—of the polyphenolic components and to a different structuration of the lignin fragments. Moreover, the lignin fragments which polymerize, with a different structure, can keep the cellulose chains bonded together [12,17].

3.3. Characterization

After the densification of the woods, the characterization of the prepared materials was carried out. All the used techniques aim at describing the chemical–physical properties of the surfaces of the prepared densified woods. For each used technique, the characterization of the starting materials and of the samples at each process step was carried out.

3.3.1. Scanning Electron Microscopy

Characterization by Scanning Electron Microscopy (SEM) was used to determine the surface morphology of the studied materials, the size of the cellulose fibers, and their organization before and after each stage of the process. SEM images of the samples before treatments show an ordered arrangement of the fibers inside the material: fibers are alternated with porosities with a diameter of a few tens of micrometers. These last are due to water evaporation from the cells and the tissues. After the delignification process, the materials underwent a strong chemical attack, which led to a structural alteration. After the densification processes, SEM images were acquired to determine if there was a further modification of the material structures compared to the delignified ones. SEM images of samples before and after delignification process are reported in Figure 3.
After the densification process, the cellulose fibers that form the material take on an extremely homogenous conformation. Observing the material from the external side of the specimen, it is almost impossible to notice the presence of fibers even at higher magnifications. This homogenous conformation is provided by the collapse of the cellular structure [15,16]. SEM images of all samples after densification process are reported in Figure 4.
As for the densified samples, after immersion in the TEOS bath, the use of SEM images provided extremely important information. From the acquired images, it is possible to notice that the presence of siliceous particles with a low diameter (<8 µm) is negligible (FPT and LPT samples) since the formation of siliceous aggregates would be in opposition to the goal of the work. The immersion of samples in a TEOS bath is necessary to impregnate the wood with the siliceous precursor, which can react with the hydroxyl groups of the cellulose chains by bridging and forming chemical bonds during the densification phase. During this step of the process, the operating temperature can cause the formation of amorphous silica aggregates on the surface, preventing or limiting the formation of siliceous bridges between the cellulose chains.

3.3.2. X-ray Fluorescence Spectrometry

This type of characterization was exploited to determine the amount of silicon contained in samples after immersion in the TEOS bath. Even if silicon is a light element, and its Kα is at the limit of the technique’s detectability, it is possible to obtain semi-quantitative results as reported in the literature [18]. Experimentally, the two materials before treatments were compared with the series of densified samples after immersion in TEOS bath. Silicon is not detected in the wood samples after densification treatments (Table 3).
On the contrary, it is possible to verify the presence of silicon inside the samples of densified wood after immersion in TEOS bath even if the silicon concentration % is very low.
These data indicate that silicon, even if in very low percentages, is present inside the material.

3.3.3. Thermogravimetric Analysis

After the previous characterizations, Thermogravimetric analyses (TGA) were carried out on the samples to evaluate the thermal stability and weight loss of the three classes of main components that form the wood: lignin, cellulose, and hemicellulose. Cellulose thermal degradation depends on the type of the studied material [19]. The hemicelluloses tend to be subject to thermal degradation together with the cellulose, therefore it is not possible to evaluate the thermal degradation temperature of these two components separately. The variation of the thermal decomposition temperature of cellulose and hemicellulose, for the different woody materials, provides indications about the composition of the cell walls that originally formed the living tissues. Thermal degradation related to lignin is less evident than the one related to cellulose. Lignin, when exposed to high temperatures, tends to acquire a more conjugated structure while maintaining the ethereal bridges that connect the monomer molecules [20]. The presence of lignin, which covers the cellulose chains and fibers, is evident from the temperatures at the beginning of the degradation of the studied materials. Following the delignification processes, it is possible to note that there is a variation in the temperature at which the thermal decomposition begins, due to a lower stabilization of the cellulose by the lignin that covers it [20].
Comparing the thermogravimetric profile of the cellulose standard with the profiles of the two untreated wood samples, it is possible to note that the LN sample presents a profile that is closest to that of pure cellulose. This result indicates a lower presence of hemicelluloses in the starting material. On the contrary, the FN sample has a lower start and higher end degradation-temperature, compared to the comparison standard: this indicates the presence of cellulose and hemicellulose chains with different lengths inside the material. The thermogravimetric profiles of the delignified FD and LD samples show a lower degradation initiation temperature than that of the same materials before the delignification treatment, an indication of the lower percentage of lignin, that stabilized the cellulose chains, compared to the starting material. It can also be seen that, after the delignification, there is a more marked similarity between the two profiles than in the untreated samples. The thermogravimetric profiles of the densified samples apparently show that there are no marked differences at temperatures below about 352 °C. This result indicates how the interactions among the cellulose chains are the same in the two different materials, regardless of the type of starting wood. At temperatures above 352 °C, the curves have a similar behavior but different percentages of weight loss; this is attributable to a different percentage composition of mineral salts within the materials and to a different concentration % of residual lignin. From the TGA profiles of the densified samples after immersion in the TEOS bath, it is possible to note that the thermal degradation temperature is the same for the two different samples. The presence of silicon does not cause differences between the two materials. Compared to the densified samples, in the absence of TEOS, the different percentages in weight loss of the two samples are attributable to different percentages of residual lignin, different amounts of mineral salts, and a different percentage of cellulose inside the material treated with TEOS [19]. Comparing the thermogravimetric profiles of the two woods after each process step, it is possible to note that there is an evident variation in the thermal degradation temperature among the untreated woods and the subsequent steps. As previously reported, this variation is attributable to the removal of the lignin that covered the cellulose chains, stabilizing them before the delignification process. After the delignification, it is possible to observe a uniformity in the shape of the curves of each individual material. The thermogravimetric profiles of cellulose, natural wood (FN and LN), delignified (FD and LD), densified (FP and LP), and densified with TEOS (PPT and LPT) are shown in Figure 5.

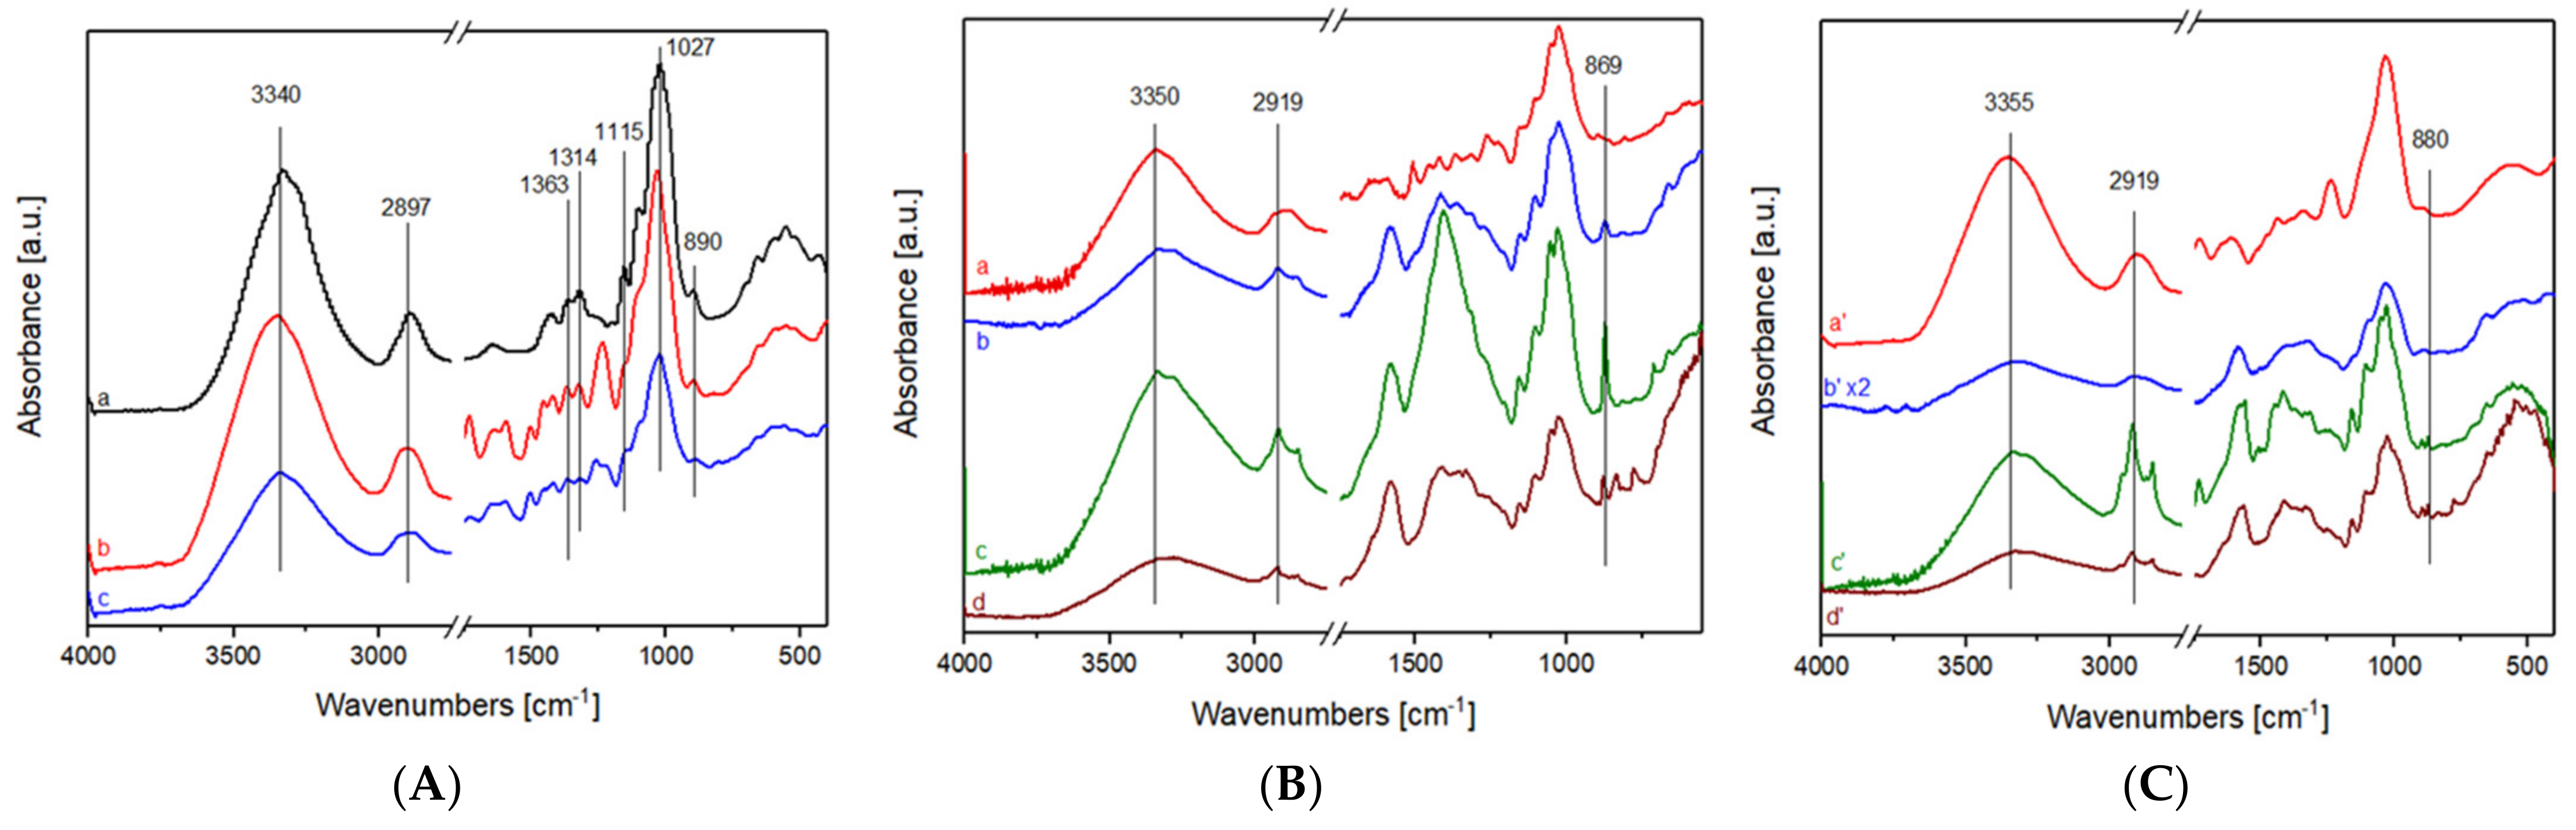
3.3.4. Infrared Spectroscopy in Attenuated Total Reflectance (FTIR-ATR)
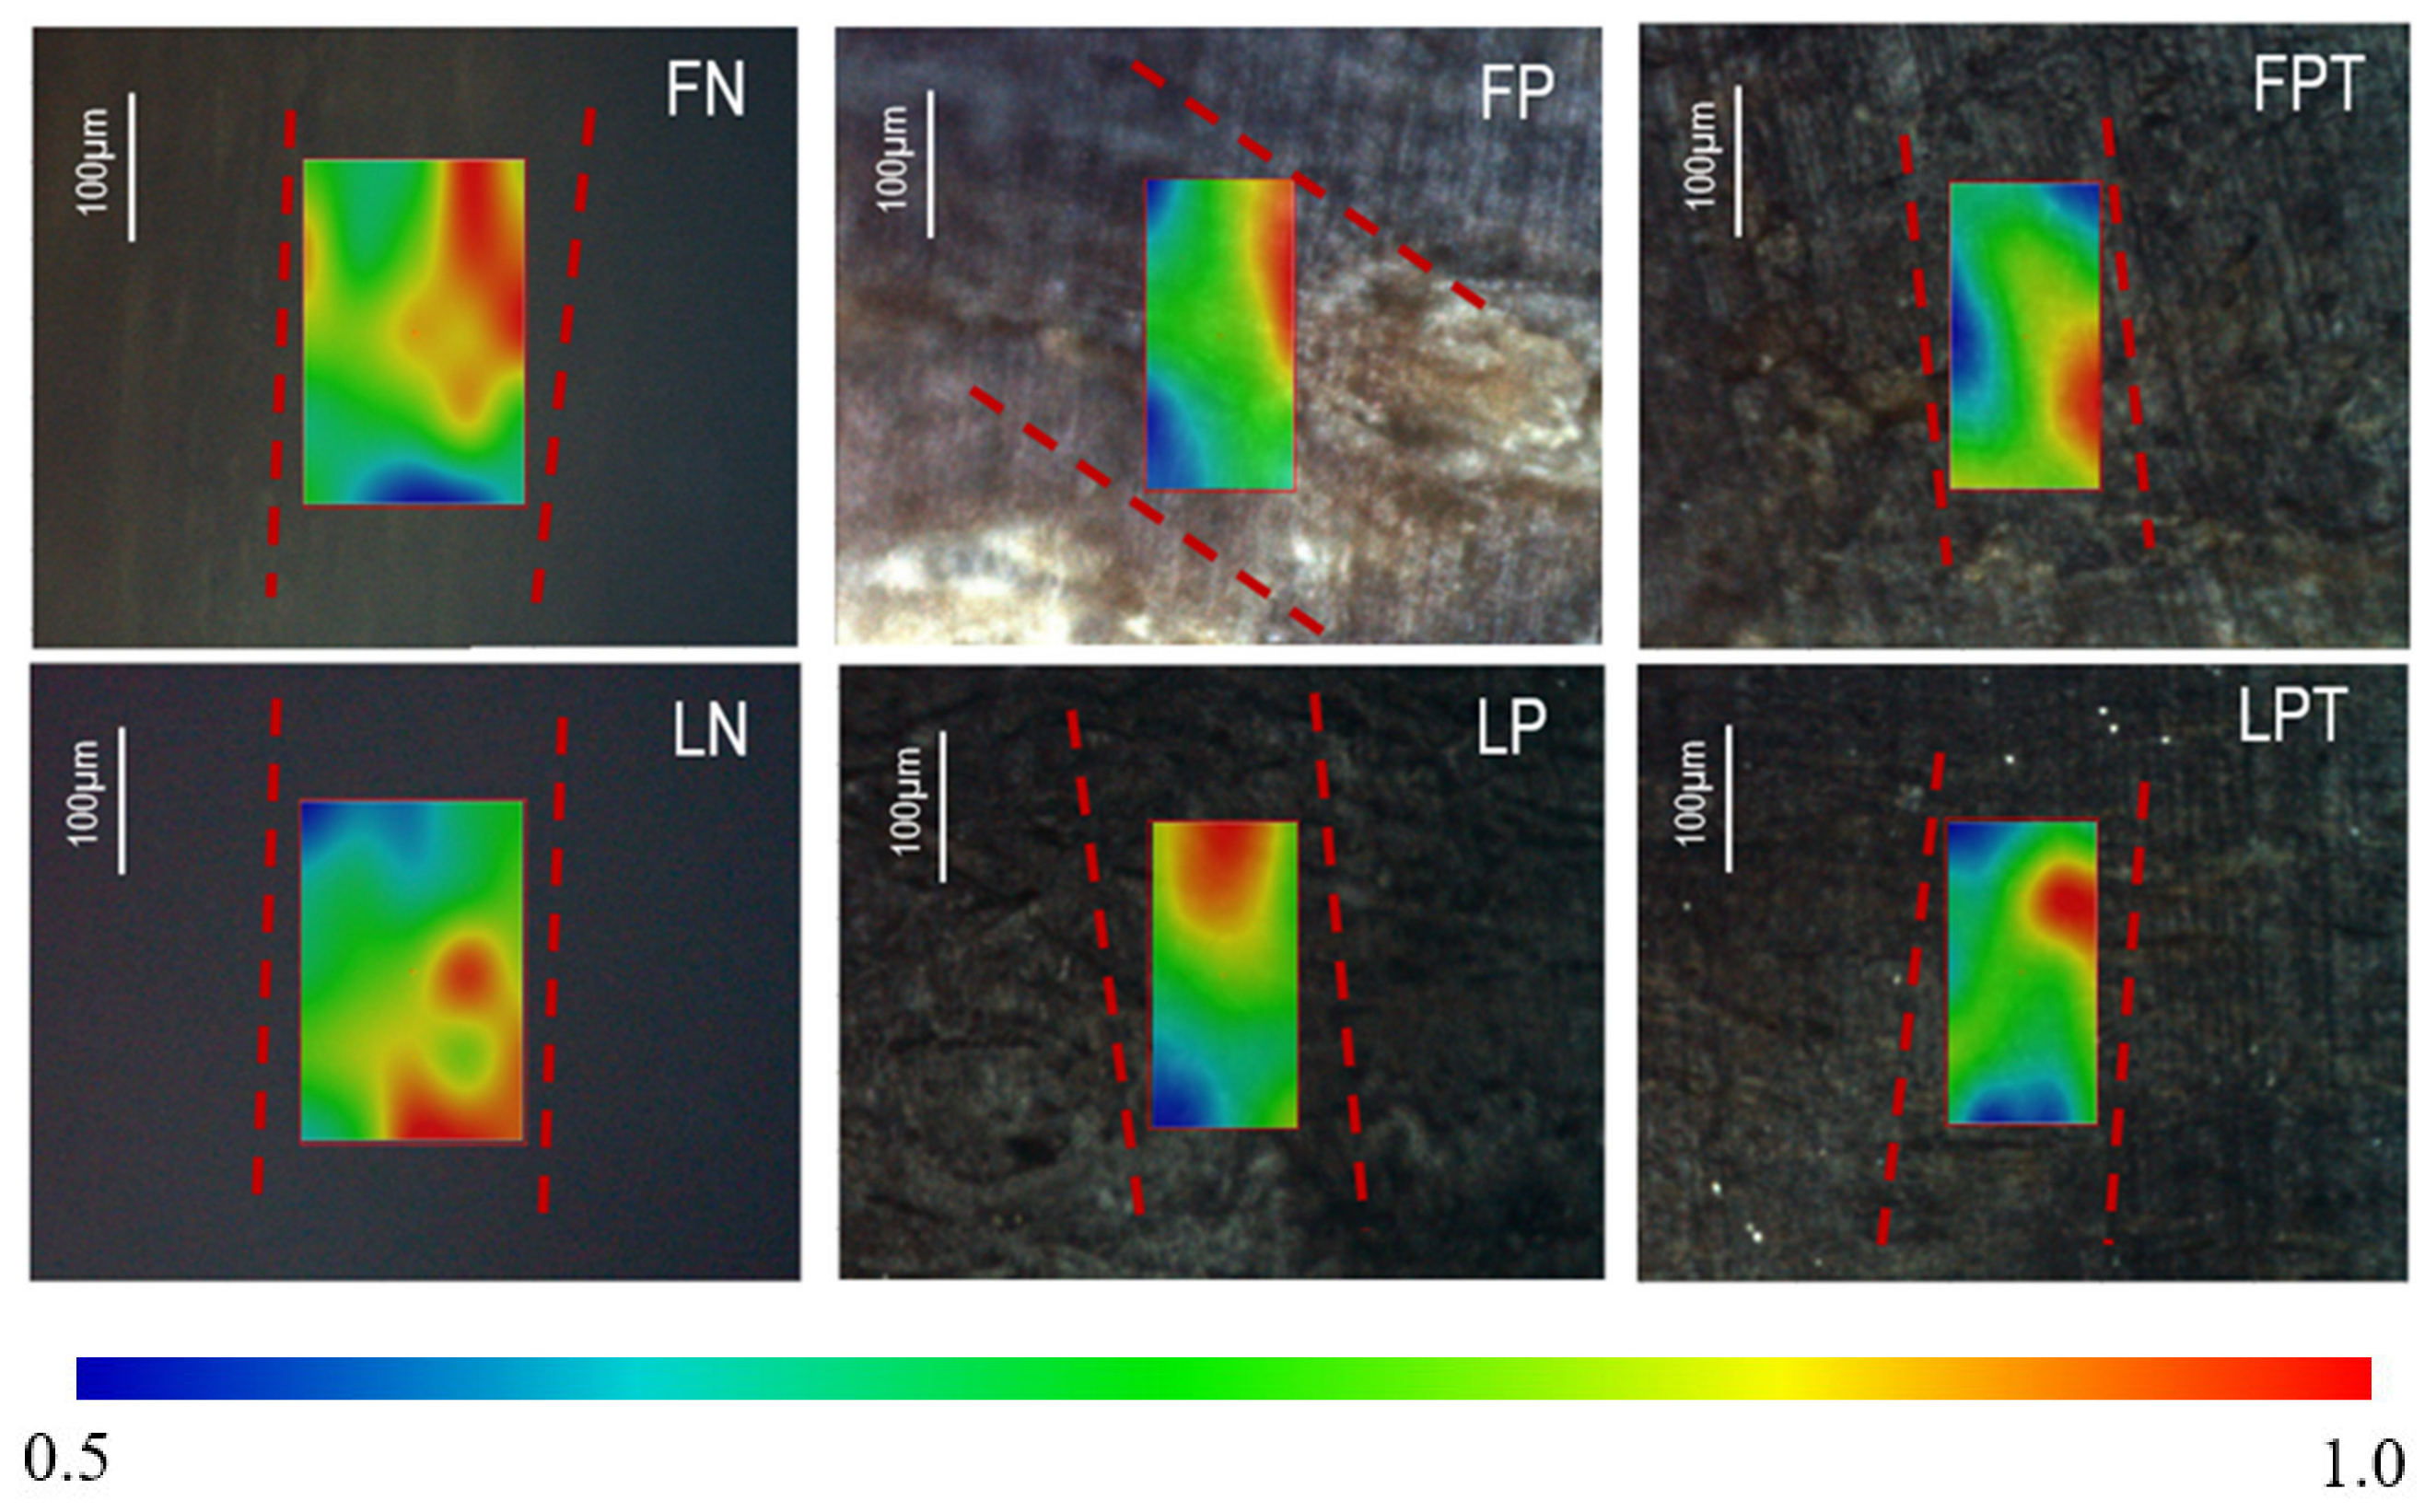
Infrared Spectroscopy in Attenuated Total Reflectance (FTIR-ATR) is a widely used technique for characterizing the surfaces of materials. In this work, it was decided to use FTIR-ATR to investigate the surface modifications of the materials after the delignification and densification treatments. This variant of FT-IR spectroscopy has been used since the 1980s in the paper industry and for the characterization of wood and plant materials [21].
The first samples to be characterized were the fir and larch natural samples before each treatment (FN and LN, respectively). From the obtained spectrum, it was possible to assign the peaks to the cellulose component that composes the materials. The spectra of the FN and LN samples and the corresponding assignments are reported in Figure 5a [3,22,23,24,25,26,27].
From the spectra, regarding FN and LN samples, it is possible to observe that the two materials do not present significant differences except in terms of composition % of lignin and cellulose, which are responsible for the differences in signal strength. The position of the peaks and their assignments are recognized in the literature [3,22,23,24,25,26,27].
Given the great variability of lignin composition and structure, it is extremely difficult to corelate the movements of the molecules that compose it to the corresponding peaks. The only peak that can be related to the fraction of lignin contained in the material is present at about 900 cm−1, ascribed to the out of the plane-bending motions of the C-H bonds of the aromatic rings. This peak cannot be used as a parameter of the presence or absence of lignin due to the inhomogeneity of the material: in fact, the intensity of the peak varies considerably depending on the point of analysis. After the delignification phase, a characterization was carried out under the same conditions of the untreated samples with the aim of evaluating the modifications of the surface. Lignin removal involves a greater exposure of cellulose fibers. The portion of the spectrum that is most affected by the delignification processes is that at high frequencies. In this spectral range, it is possible to note that there is a variation in the shape and intensity of the band related to the hydroxyl groups that are most exposed after lignin removal. In the 4000 cm−1 and 2750 cm−1 spectral range the variation in the shape of the band ascribed to the stretching motions of the hydroxyl groups is very evident, compared to the same band in the starting material. Moreover, the peak which has a maximum at 2919 cm−1, related to the stretching motions of the C-H bonds of cellulose, residual hemicelluloses, and any sugars, appears more defined. The spectra of densified fir (FP) and densified larch (LP) wood materials are shown (Figure 6). In the spectra of the densified samples, it is immediately evident that there is a greater resolution in the peaks; moreover, the intensities and shades of the bands are much more resolute and evident than the corresponding untreated and delignified samples. The approach and the strongest interaction between the chains and the cellulose fibers can be deduced from the shape of the band related to the stretching of the hydroxyl groups, cellulose chains interact with each other to form hydrogen bonds that hold the chains together. Considering the peak ascribed to the stretching motions of the C-H bonds, which has a maximum at 2919 cm−1, it is possible to note that after the densification process there is the appearance of a well-defined peak This phenomenon is more evident in the series of densified samples obtained from larch wood.
In relation to the samples after immersion in the TEOS bath, it is not possible to ascertain the presence and positions of the silicon atoms in the structure of the material. Densified wood samples after immersion in the TEOS bath (FPT and LPT, respectively) are shown in Figure 5. From the spectra of these samples, it is possible to see how, in the high frequency region (4000–2750 cm−1) there is a much wider band than the corresponding band present for densified wood in the absence of TEOS. This band broadening is due to the presence of silanol groups on the surface of the densified materials. In the 1750 and 1000 cm−1 spectral range, only the peak related to the cellulose chain motions is observed, as reported in the literature [3,7,22,23,24,25,26,27,28].
In the high frequency range, between 4000 and 2750 cm−1, only two bands are observed: one band lies at 3340 cm−1 and is associated to the stretching motions of the hydroxyl groups present on the surface of the material, whereas the second one, observed at 2897 cm−1, is associated to the stretching motions of the CH and CH2 groups of the cellulose chains. In the 1750–400 cm−1 range, there are multiple characteristic cellulose bands: the 1363 cm−1 band is related to the symmetrical bending motions of the CH2 groups, whereas the 1314 cm−1 band is associated to the bending motions of the hydroxyl groups present on the surface of the material. The peak at 1027 cm−1 is produced by the vibrations of the CO bonds of the ethereal groups of the structures of glucose and the β-1,4 bonds that join the glucose units. The peak at 890 cm−1 is related to the stretching motions of the glucose units that form the cellulose [3].

3.3.5. Micro-IR

This type of characterization was used with the aim of determining the distribution changes of the hydroxyl groups on the surface of the woods, using IR mapping, following the delignification and densification processes. The presence, numbers, and distribution of hydroxyl groups on the woods’ surface modify the surface properties of the material. Of note in the literature, in the modification of woody materials caused by thermal treatment, the main change is in the number and distribution of hydroxyl groups on the surface of woody materials [29].
The first materials analyzed were the two materials as they are (FN and LN). From the maps, it is possible to observe how there are areas with a different signal density of the hydroxyl groups on the surface of the materials. Subsequently, the surfaces were mapped and the differences on the hydroxyl bands of the FD and LD samples were evaluated after the delignification processes. In terms of the FD material, there is an increase in the intensity of the hydroxyl band (Figure 6). For the LD sample, the increase is less evident but for both materials it is possible to state that a greater quantity of hydroxyl groups is observed and that this is attributable to the removal of lignin. For comparison, the materials that have undergone the densification process were also analyzed. It is possible to notice how, even for the previous materials, there is no homogeneity in the distribution of the hydroxyl groups on the surface of the material. In addition, for densified materials, following immersion in the TEOS bath, they were found to be superficially inhomogeneous in the distribution of hydroxyl groups. The maps obtained from the distributions of the FT-IR spectra of the 3500 cm−1 band are shown in Figure 7. It can be seen that the inhomogeneous hydroxyl distribution is present in all the samples. The colors in the maps show values of absorbance between 0.5 (blue zone) and 1.0 (red zone).

3.3.6. Mechanical Traction Tests

The data obtained from the mechanical traction tests on the characterized samples were compared with analogous materials found in the literature [30].
All materials were tested at a tensile speed of 1 mm/min. The first conducted tests were performed on the two starting woods (FN and LN) obtaining, for the larch wood, a yield stress (equal to 1060.9 N) about five times higher than for fir wood (225.3 N). Densified woods, subjected to traction under the same conditions, show a strong increase in the forces necessary for yielding, highlighting how these materials acquire much higher mechanical properties than the corresponding starting woods. The necessary stress values of the studied materials are shown in Table 4.
As can be seen from the data reported in Table 4, it is evident that the densified samples starting from fir wood show a greater increase in the force necessary to yield the material than any analogous material obtained starting from larch wood. These data are attributable to a lower percentage of lignin in the samples, as found in the literature [10].

4. Discussion

Moisture content was measured before and after every step of the process maintaining the samples at 50 °C until constant weight. Its value was around 3% w/w, consequently it was considered negligible. At every step, characterizations and mechanical tests were carried out on different days to verify the reproducibility of the process and making the environmental factors (such as temperature and air humidity) negligible.
The results obtained after the densification process led to a greater increase in density than the values found up to now in the literature [13]. Increased density values are shown in Table 2.
For fir wood, the final density is three times the initial one, while for larch wood the final density is 10% higher than the starting one; in both cases, the final density values are comparable to each other. These data suggest that in this condition of delignification and densification a limit value is present to reach the density.
The characterizations carried out on the materials allowed the determination of how the structures of the wood vary during each phase of the process. Following the densification processes, SEM images provided data about the strong cohesion of the single fibers: in fact, they were indistinguishable even at high magnifications. SEM images show that some anatomical structures (such as uncollapsed cells) typically present in wood, are still present on the surface of densified wood. These cells are more prevalent in densified fir wood than in densified larch wood.
From the infrared spectra, it is possible to relate the removal of the lignin to the variations in the shape and intensity of the stretching band of the hydroxyl groups of the cellulose molecules. The variation of the band related to the stretching of the hydroxyl groups is also an indicator of the formation of hydrogen bonds between the cellulose chains stronger than those of the starting material. FT-IR mappings allow the evaluation of the distribution of these groups on the surface of the material in each phase of the process. However, it is evident that there is an inhomogeneous distribution of the surface hydroxyl groups in the starting material and in the densified materials.
TGA analyses allow the evaluation of the thermal stability of the studied materials, providing significant results: the correlation between the thermal degradation temperature and the percentage of lignin within the material appears evident. The decrease in the degradation temperature, corresponding to the inflection of the curve, indicates a lack of thermal stabilization by the lignin and a greater possibility of the cellulose to participate in thermal degradation processes which are impossible in the material as it is.
The results obtained by XRF analysis allow the semi-quantitative determination of the amount of silicon contained in the samples of the two PT series. Silicon is a light element for which XRF generates only a semi-quantitative response. These results combined to SEM images of the same samples allow us to suppose the formation of a silicon network between the cellulose chains, while only a part of the siliceous precursor formed amorphous silica aggregates on the surface of the material. Moreover, it is possible to notice how the samples of fir wood have a greater quantity of silicon inside them, after the densification process. This fact is attributable to the greater porosity of fir wood compared to larch wood. The presence of greater porosity, combined with the delignification process, helps to improve the diffusibility of TEOS in the material. The results obtained from the mechanical traction tests allow the determination of the increase in the mechanical properties of the two different woods after the densification processes. The most significant increase, equal to three times the initial value, is observed in fir treated-wood, whereas there is not such a high increase in the mechanical properties in densified materials derived from larch wood.

5. Conclusions

From the FT-IR spectra and mapping, the interactions between cellulose chains and the superficial distribution of hydroxyl groups were determined. The high interactions between cellulose chains and the low distribution of hydroxyl groups on samples’ surfaces explain the high-density values obtained.
TGA analyses show the decrease in the degradation temperatures for all samples after delignification and densification, confirming the decrease in concentration of lignin after processing.
SEM images demonstrate the cohesion of the fibers in all samples. In the PT series samples, SEM images confirm the absence of silica aggregates on the surface of the woody materials. The XRF data confirm the presence of silicon atoms in the samples treated with TEOS.
The mechanical traction test shows the increase in force necessary for yielding the materials. The increment is more evident for densified fir wood (three time the initial one) while the densified larch wood shows the increment of the force necessary to yield +10% of the initial one.
The materials obtained demonstrate that it is possible to obtain a natural material with high density and high mechanical properties without reverting to using the composite material currently used as reinforcement in the construction industry.

Author Contributions

Conceptualization, A.M. and G.G.; methodology, F.G.; software, A.C.; validation, A.M. and A.C.; formal analysis, F.G.; investigation, F.G.; resources, G.G.; data curation, A.M.; writing—original draft preparation, A.M.; writing—review and editing, M.A.; visualization, M.A.; supervision, M.A.; project administration, G.G. All authors have read and agreed to the published version of the manuscript.

Funding

This research received no external funding.

Institutional Review Board Statement

Not applicable.

Informed Consent Statement

Not applicable.

Data Availability Statement

Not applicable.

Acknowledgments

The authors would like to thank A. Agostino (Università degli Studi di Torino) for carrying out XRF measurements, and A. Odasso (uvex Cagi srl., Ceva, Italy) for carrying out mechanical tests.

Conflicts of Interest

The authors declare no conflict of interest.

References

  1. Von Arx, G.; Crivellaro, A.; Prendin, A.L.; Čufar, K.; Carrer, M. Quantitative Wood Anatomy—Practical Guidelines. Front. Plant Sci. 2016, 7, 781. [Google Scholar] [CrossRef]
  2. Zakzeski, J.; Bruijnincx, P.C.A.; Jongerius, A.L.; Weckhuysen, B.M. The Catalytic Valorization of Lignin for the Production of Renewable Chemicals. Chem. Rev. 2010, 110, 3552–3599. [Google Scholar] [CrossRef] [PubMed]
  3. Chen, C.; Luo, J.; Qin, W.; Tong, Z. Elemental Analysis, Chemical Composition, Cellulose Crystallinity, and FT-IR Spectra of Toona Sinensis Wood. Mon. Chem. Chem. Mon. 2014, 145, 175–185. [Google Scholar] [CrossRef]
  4. Jones, P.D.; Schimleck, L.R.; Peter, G.F.; Daniels, R.F.; Clark, A. Nondestructive Estimation of Wood Chemical Composition of Sections of Radial Wood Strips by Diffuse Reflectance near Infrared Spectroscopy. Wood Sci. Technol. 2006, 40, 709–720. [Google Scholar] [CrossRef]
  5. Chandrasekaran, S.R.; Hopke, P.K.; Rector, L.; Allen, G.; Lin, L. Chemical Composition of Wood Chips and Wood Pellets. Energy Fuels 2012, 26, 4932–4937. [Google Scholar] [CrossRef]
  6. Curling, S.F.; Clausen, C.A.; Winandy, J.E. Relationships between Mechanical Properties, Weight Loss, and Chemical Composition of Wood during Incipient Brown-Rot Decay. For. Prod. J. 2002, 52, 34–39. [Google Scholar]
  7. Fodil Cherif, M.; Trache, D.; Brosse, N.; Benaliouche, F.; Tarchoun, A.F. Comparison of the Physicochemical Properties and Thermal Stability of Organosolv and Kraft Lignins from Hardwood and Softwood Biomass for Their Potential Valorization. Waste Biomass Valorization 2020, 11, 6541–6553. [Google Scholar] [CrossRef]
  8. Wang, J.; Minami, E.; Asmadi, M.; Kawamoto, H. Effect of Delignification on Thermal Degradation Reactivities of Hemicellulose and Cellulose in Wood Cell Walls. J. Wood Sci. 2021, 67, 19. [Google Scholar] [CrossRef]
  9. Chen, Y.; Dang, B.; Jin, C.; Sun, Q. Processing Lignocellulose-Based Composites into an Ultrastrong Structural Material. ACS Nano 2019, 13, 371–376. [Google Scholar] [CrossRef]
  10. Liu, Y.; Li, B.; Mao, W.; Hu, W.; Chen, G.; Liu, Y.; Fang, Z. Strong Cellulose-Based Materials by Coupling Sodium Hydroxide–Anthraquinone (NaOH–AQ) Pulping with Hot Pressing from Wood. ACS Omega 2019, 4, 7861–7865. [Google Scholar] [CrossRef] [Green Version]
  11. Chen, Z.; Dang, B.; Luo, X.; Li, W.; Li, J.; Yu, H.; Liu, S.; Li, S. Deep Eutectic Solvent-Assisted In Situ Wood Delignification: A Promising Strategy To Enhance the Efficiency of Wood-Based Solar Steam Generation Devices. ACS Appl. Mater. Interfaces 2019, 11, 26032–26037. [Google Scholar] [CrossRef] [PubMed]
  12. Akkuş, M.; Budakçı, M. Determination of Color-Changing Effects of Bleaching Chemicals on Some Heat-Treated Woods. J. Wood Sci. 2020, 66, 68. [Google Scholar] [CrossRef]
  13. Cencin, A.; Zanetti, M.; Urso, T.; Crivellaro, A. Effects of an Innovative Densification Process on Mechanical and Physical Properties of Beech and Norway Spruce Veneers. J. Wood Sci. 2021, 67, 15. [Google Scholar] [CrossRef]
  14. Sonderegger, W.; Kránitz, K.; Bues, C.-T.; Niemz, P. Aging Effects on Physical and Mechanical Properties of Spruce, Fir and Oak Wood. J. Cult. Herit. 2015, 16, 883–889. [Google Scholar] [CrossRef]
  15. Krisdianto, K.; Balfas, J. Anatomical Changes of Kekabu Wood (Bombax ceiba L.) Due to Mechanical Densification. Indones. J. For. Res. 2005, 2, 27–36. [Google Scholar] [CrossRef]
  16. Darwis, A.; Wahyudi, I.; Dwianto, W.; Cahyono, T.D. Densified Wood Anatomical Structure and the Effect of Heat Treatment on the Recovery of Set. J. Indian Acad. Wood Sci. 2017, 14, 24–31. [Google Scholar] [CrossRef]
  17. Mayer, I.; Koch, G. Element Content and PH Value in American Black Cherry (Prunus serotina) with Regard to Colour Changes during Heartwood Formation and Hot Water Treatment. Wood Sci. Technol. 2007, 41, 537–547. [Google Scholar] [CrossRef]
  18. Morgan, T.J.; George, A.; Boulamanti, A.K.; Álvarez, P.; Adanouj, I.; Dean, C.; Vassilev, S.V.; Baxter, D.; Andersen, L.K. Quantitative X-Ray Fluorescence Analysis of Biomass (Switchgrass, Corn Stover, Eucalyptus, Beech, and Pine Wood) with a Typical Commercial Multi-Element Method on a WD-XRF Spectrometer. Energy Fuels 2015, 29, 1669–1685. [Google Scholar] [CrossRef]
  19. Sebio-Puñal, T.; Naya, S.; López-Beceiro, J.; Tarrío-Saavedra, J.; Artiaga, R. Thermogravimetric Analysis of Wood, Holocellulose, and Lignin from Five Wood Species. J. Therm. Anal. Calorim. 2012, 109, 1163–1167. [Google Scholar] [CrossRef]
  20. Wang, J.; Minami, E.; Asmadi, M.; Kawamoto, H. Thermal Degradation of Hemicellulose and Cellulose in Ball-Milled Cedar and Beech Wood. J. Wood Sci. 2021, 67, 32. [Google Scholar] [CrossRef]
  21. Leclerc, D.F.; Trung, T.P. Vibrational Spectroscopy in the Pulp and Paper Industry. In Handbook of Vibrational Spectroscopy; Chalmers, J.M., Ed.; John Wiley and Sons, Ltd.: Chichester, UK, 2006. [Google Scholar]
  22. Colom, X.; Carrillo, F.; Nogués, F.; Garriga, P. Structural Analysis of Photodegraded Wood by Means of FTIR Spectroscopy. Polym. Degrad. Stab. 2003, 80, 543–549. [Google Scholar] [CrossRef]
  23. Adel, A.M.; El–Wahab, Z.H.A.; Ibrahim, A.A.; Al–Shemy, M.T. Characterization of Microcrystalline Cellulose Prepared from Lignocellulosic Materials. Part I. Acid Catalyzed Hydrolysis. Bioresour. Technol. 2010, 101, 4446–4455. [Google Scholar] [CrossRef] [PubMed]
  24. Schwanninger, M.; Rodrigues, J.C.; Pereira, H.; Hinterstoisser, B. Effects of Short-Time Vibratory Ball Milling on the Shape of FT-IR Spectra of Wood and Cellulose. Vib. Spectrosc. 2004, 36, 23–40. [Google Scholar] [CrossRef]
  25. Hu, G.; Cateto, C.; Pu, Y.; Samuel, R.; Ragauskas, A.J. Structural Characterization of Switchgrass Lignin after Ethanol Organosolv Pretreatment. Energy Fuels 2012, 26, 740–745. [Google Scholar] [CrossRef]
  26. Pandey, K.; Pitman, A. FTIR Studies of the Changes in Wood Chemistry Following Decay by Brown-Rot and White-Rot Fungi. Int. Biodeterior. Biodegrad. 2003, 52, 151–160. [Google Scholar] [CrossRef]
  27. Pandey, K.K. A Study of Chemical Structure of Soft and Hardwood and Wood Polymers by FTIR Spectroscopy. J. Appl. Polym. Sci. 1999, 71, 1969–1975. [Google Scholar] [CrossRef]
  28. Popescu, C.-M.; Singurel, G.; Popescu, M.-C.; Vasile, C.; Argyropoulos, D.S.; Willför, S. Vibrational Spectroscopy and X-Ray Diffraction Methods to Establish the Differences between Hardwood and Softwood. Carbohydr. Polym. 2009, 77, 851–857. [Google Scholar] [CrossRef]
  29. Rautkari, L.; Hill, C.A.S.; Curling, S.; Jalaludin, Z.; Ormondroyd, G. What Is the Role of the Accessibility of Wood Hydroxyl Groups in Controlling Moisture Content? J. Mater. Sci. 2013, 48, 6352–6356. [Google Scholar] [CrossRef]
  30. Sun, J.; Zhao, R.; Zhong, Y.; Chen, Y. Compressive Mechanical Properties of Larch Wood in Different Grain Orientations. Polymers 2022, 14, 3771. [Google Scholar] [CrossRef]
Figure 1. Comparison of density of different types of woods.
Sustainability 15 02055 g001
Figure 2. Scheme of densification process.
Sustainability 15 02055 g002
Figure 3. SEM images of fir and larch sample surfaces before (FN: Natural Fir; LN: Natural Larch) and after (FD: Delignified Fir; LD: Delignified Larch) the delignification process. All images were recorded at 1000× magnification.
Sustainability 15 02055 g003
Figure 4. SEM images of fir and larch sample surfaces after densification step (FP: Densified Fir; LP: Densified Larch) and after densification in presence of TEOS (FPT: Densified Fir with TEOS; LPT: Densified Larch with TEOS). All images were recorded at 1000× magnification.
Sustainability 15 02055 g004aSustainability 15 02055 g004b
Figure 5. Comparison of the thermogravimetric profile of fir (FN) and larch (LN) woods with a cellulose sample (a) and their first derivates (b); thermogravimetric profile of fir wood (c) before treatments (FN), after delignification process (FD), after densification (FP) and after densification with TEOS (FPT) and their first derivates (d); thermogravimetric profile of larch wood I before treatments (LN), after delignification process (LD), after densification (LP) and after densification with TEOS (LPT) (e) and their first derivates (f).
Sustainability 15 02055 g005
Figure 6. (A) FTIR-ATR spectra of (a) cellulose compared with (b) larch wood and (c) fir wood; (B) FTIR-ATR spectra of fir wood (a) before treatments FN, (b) after delignification process FD, (c) after densification FP and (d) after densification with TEOS FPT; (C) FTIR-ATR spectra of larch wood (a’) before treatments ’N, (b’) after delignification process LD, (c’) after densification LP and (d’) after densification with TEOS LPT.
Sustainability 15 02055 g006
Figure 7. Infrared distribution on the samples surface band at 3500 cm−1 of fir wood before treatments (FN), after densification (FP) and after densification with TEOS (FPT) and larch wood before treatments (LN), after densification (LP) and after densification with TEOS (LPT); the contours of the analyzed fibers are highlighted with red dotted lines.
Sustainability 15 02055 g007
Table 1. Average weight, volume and density of fir and larch samples.
SampleWeight (g)Volume (cm3)Density (g/cm3)
Fir7.00 ± 0.2615.20 ± 0.450.488 ± 0.014
Larch8.77 ± 0.3811.90 ± 0.470.735 ± 0.011
Table 2. Average increase values of woody samples after densification process.
SampleStarting Density
(g/cm3)
Final Density
(g/cm3)
Increase
(%)
Densified fir0.48 ± 0.011.60 ± 0.09340.32 ± 24.45
Densified fir with TEOS1.46 ± 0.19303.60 ± 38.60
Densified larch 0.73 ± 0.021.64 ± 0.03224.86 ± 5.05
Densified larch with TEOS1.48 ± 0.12197.78 ± 16.68
Table 3. Silicon concentrations % contained in the densified woods (FP and LP) and samples containing TEOS (FPT and LPT).
SampleSi (Atomic %)
FP-
FPT0.166 ± 0.061
LP-
LPT0.043 ± 0.005
Table 4. Comparison of the forces necessary to reach the yield point between the original fir and larch wood samples (FN and LN) with the corresponding densified materials (FP and LP) and densified with TEOS (FPT and LPT).
SampleForce at Yield (N)
Natural fir225.3
Densified fir densified911.1 ± 42.1
Densified fir with TEOS841.9 ± 269.6
Natural larch1060.9
Densified larch1166.9 ± 72.1
Densified larch with TEOS1005.2 ± 119.3
Disclaimer/Publisher’s Note: The statements, opinions and data contained in all publications are solely those of the individual author(s) and contributor(s) and not of MDPI and/or the editor(s). MDPI and/or the editor(s) disclaim responsibility for any injury to people or property resulting from any ideas, methods, instructions or products referred to in the content.

