Article

The Effect of Cellulose Crystalline Structure Modification on Glucose Production from Chemical-Composition-Controlled Biomass

1
Forest Industrial Materials Division, Forest Products and Industry Department, National Institute of Forest Science, Seoul 02455, Republic of Korea
2
Department of Forest Science, College of Agriculture and Life Science, Seoul National University, Seoul 08826, Republic of Korea
3
Research Institute of Agriculture and Life Sciences, College of Agriculture and Life Sciences, Seoul National University, Seoul 08826, Republic of Korea
*
Author to whom correspondence should be addressed.
Sustainability 2023, 15(7), 5869; https://doi.org/10.3390/su15075869
Submission received: 14 February 2023 / Revised: 6 March 2023 / Accepted: 9 March 2023 / Published: 28 March 2023
(This article belongs to the Special Issue Sustainable Use of Forest Biomass for Fuel and Chemical Productions)

Abstract

:
The crystalline structure is a biomass recalcitrance factor that hinders chemical or biological access to degrade the plant cell-wall structure. However, controversy persists over whether a ratio of the crystalline region, the crystallinity index, is a critical biomass recalcitrance factor. In this study, an alkaline treatment modified from mercerization was adopted to alleviate the crystalline structure in the xylem of eucalyptus, along with hemicellulose and lignin removal via autohydrolysis and acid–chlorite treatment, respectively. Then, the glucose yield of the treated solid residues was used as a parameter of biomass recalcitrance. The alkaline treatment successfully reduced the crystallinity index, and the maximal reduction ratio was 84.9% when using an 8% sodium hydroxide solution. However, the reduction ratio of the crystallinity index was dependent on the remaining lignin content in the treated solid residues. Additionally, the lignin removal ratio showed critical influence to improve the glucose yield that was even observed in the treated solid residue having a low reduction ratio of the crystallinity index. Consequently, the cellulose crystalline structure is minimally involved with biomass recalcitrance, especially cellulase activity, at least in eucalyptus.

1. Introduction

Crystallinity is a unique characteristic of cellulose that has an approximately a 5 μm long chain without substitution in the side groups [1]. Crystalline regions have substantial inter- and intramolecular hydrogen bonds [2]. This structure does not allow for facile decomposition into monomer glucose due to strong hydrophobic and low-reactivity properties [3]. For these reasons, cellulase cannot easily hydrolyze the crystalline region in cellulose fibril compared to the amorphous region [4]. Therefore, the cellulose crystallinity of lignocellulosic biomass is a recalcitrant factor and an inhibitor of glucose production via enzymatic hydrolysis [5]. The glucose from lignocellulosic biomass is a representative source of renewable and sustainable fuels and chemicals using biological pathways [6]. Furthermore, these ecofriendly products can contribute to establishing a feasible biorefinery process that replaces the fossil-fuel-based industry through a circular economy with a carbon-neutral society [7].
In previous studies, various types of feedstock, such as Avicel, filter paper, cotton, and bacterial cellulose, were employed to evaluate the effect of cellulose crystallinity on cellulase activity [8]. As a result, the efficiency of enzymatic hydrolysis increased and the crystallinity index decreased. Previous articles reported that cellulose crystallinity significantly affects the efficiency of enzymatic hydrolysis, especially in the initial step for cellulase adhesion onto cellulose fibrils [9]. The adsorption capacity of endoglucanase towards cellulose was enlarged when the substrate had a low crystallinity index [10]. Cellulases typically prefer the amorphous region to the crystalline region when they hydrolyzes the cellulose fibril; thus, the crystallinity index increases due to increasing the ratio of the remaining crystallinity region [11]. Nevertheless, the correlation between cellulose crystallinity and the recalcitrance of lignocellulosic biomass against enzyme activity is still debated, unlike the cases of hemicellulose and lignin [12]. There are inconclusive findings on the effect of the crystallinity index, and an obvious relationship was not found in some studies [13].
Chemical methods for decomposing the cell wall structure of lignocellulosic biomass typically increase the crystallinity index because the amorphous regions of cellulose are more suitably decomposed than the crystalline region is [14]. The chemically pretreated solid fraction tends to contain a significant amount of the crystalline region that might reduce the cellulose accessibility of cellulase. Therefore, the rigid and strict properties of crystalline structure should be modified to facilitate the enzymatic hydrolytic process.
Mercerization is a typical fiber treatment that was developed to modify the hydrophobicity of natural fibers such as the interfacial linkage between the fiber and matrix, surface wettability and roughness, and a reduction in moisture absorption [15]. Through the benefits of mercerization, it is widely used in the textile industry [16]. Mercerization is one of the alkaline treatment processes with a concentrated aqueous solution using a strong base catalyst, leading to a significant level of fiber swelling that relaxes the cellulose crystalline structure [17]. Cellulose I is a native form of cellulose that has a monoclinic crystalline lattice and can be transformed into different structures, such as cellulose II or alkali cellulose, via mercerization [18]. Sodium hydroxide shows a good level of cellulose swelling because the Na+ ion has a suitable diameter to expand pores in the lattice planes, even the smallest one, by penetrating the microfibril structure during the mercerization reaction [19]. For the reaction, the typical range of sodium hydroxide concentration is from 1% to 25% based on the weight of the solution with approximately 60 min of reaction time [20]. In addition, other types of alkali reagents were subjected to evaluate the cellulose swelling efficiency depending on the concentration [2].
The measurement methods of the crystallinity index have been researched for several decades because cellulose crystallinity is recognized as an important property to determine the reactivity of a sample [21]. To date, four types of methods for evaluation of crystallinity index have been developed: (1) the X-ray diffraction (XRD) peak height (Segal) method, (2) XRD deconvolution method, (3) XRD amorphous subtraction (Ruland–Vonk) method, and (4) C4 peak separation method using nuclear magnetic resonance [22]. Among them, the Segal method is a simple and fast analysis, and provides an intuitive comparison between cellulosic feedstocks [23].
In this study, we conducted autohydrolysis and acid–chlorite treatment to control the amount of hemicellulose and lignin content in Eucalyptus pellita. Then, the treated solid residues were immersed in the concentrated sodium hydroxide solution to mitigate the crystalline structure of solid residues (alkaline treatment). These processes were subsequently performed, and the scheme is illustrated in Figure 1. The crystallinity index of the solid residue was determined with the Segal method, and evaluated before and after the results of enzymatic hydrolysis. Lastly, the glucose yield was used to investigate the relationships of the crystallinity index. A scheme of the subsequent treatment to modify the crystalline structure and to produce glucose from E. pellita is illustrated in Figure 1.

2. Materials and Methods

2.1. Feedstock Preparation

The feedstock of this study, Eucalyptus pellita, was grown with artificial forestation in Indonesia. The stem of four-year-old E. pellita was harvested and milled to a 0.5 mm particle size with a twin extruder. The prepared feedstock had 59.3% moisture content and was kept at 4 °C until for using subsequent processes.

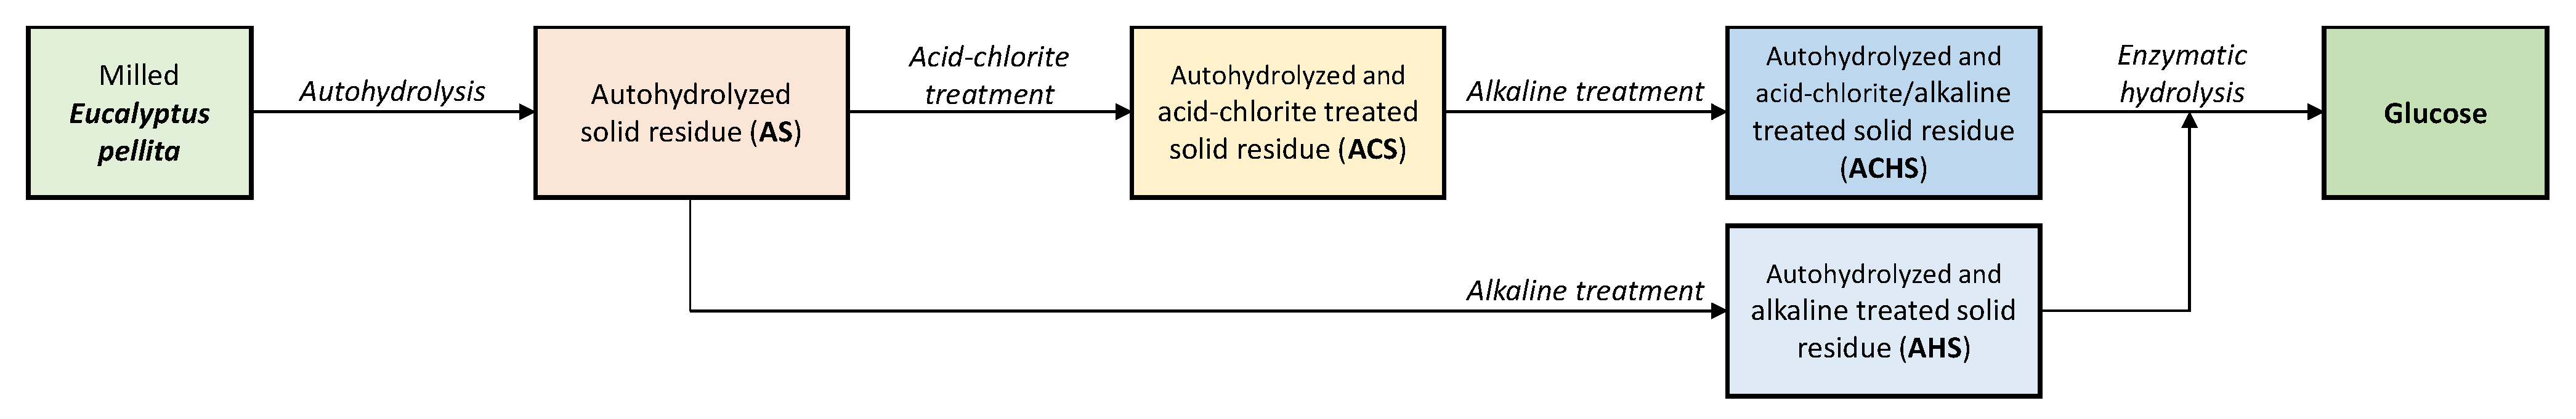
2.2. Autohydrolysis and Acid–Chlorite Treatment

The methods of autohydrolysis and acid–chlorite treatment were from a previous study that described the reaction conditions in detail [24].
First, 50.0 g (oven-dried weight) of the milled E. pellita was used for the autohydrolytic process, and the solid-to-liquid ratio was 1:10 (w/v). The slurry was reacted at the targeted temperature (160 or 170 °C) with a retention time of 10 or 50 min using a stainless steel batch-type reactor. The autohydrolyzed solid residue (AS) and liquid hydrolysate were separated with filter paper after the reaction and quenching steps.
Then, 15.0 g (oven-dried weight) of AS was employed for the acid–chlorite treatment by mixing it with 150 mL of distilled water in a 1 L volume Erlenmeyer flask. The dosage of the acid–chlorite reagents, sodium chlorite (g), and acetic acid (mL) was paired at four input levels (1.5 g–0.3 mL, 2.5 g–0.5 mL, 4.0 g–0.8 mL, and 4.0 g–0.8 mL with 2 times), while the reaction temperature and time were constant in all conditions. After the reaction, the autohydrolyzed and acid–chlorite-treated solid residues (ACSs) were separated with a filter paper with a washing step using distilled water.

2.3. Alkaline Treatment

The milled E. pellita, AS, and ACS were used as samples for the alkaline treatment. First, 4 g (oven-dried weight) of the samples was mixed with 8% or 12% (w/w) of a sodium hydroxide solution in a conical tube. The alkaline treatment was conducted at 0 °C for 60 or 180 min by using an ice chamber. The slurries were thoroughly stirred using a glass stick during the reaction. After the reaction, the conical tubes were centrifuged at 12,000× g rpm for 10 min to separate the solid and liquid fractions (mega 17R, HANIL SME Co., LTD, Anyang-si, Republic of Korea). Then, the solid fractions (autohydrolyzed and alkaline-treated solid residue (AHS) and the autohydrolyzed and acid–chlorite/alkaline treated solid residue (ACHS)) were washed with plenty of distilled water. Lastly, they were lyophilized for 72 h (FD8508, Ilshinbiobase, Seoul, Republic of Korea) and pulverized (RT-02SF, Rong Tsong, Taiwan) before enzymatic hydrolysis.

2.4. Enzymatic Hydrolysis

Samples with a total of 1.0 g (oven-dried weight) of milled E. pellita, AHS, and ACHS were used as substrates and enzymatically hydrolyzed by using a commercial cellulase complex, Cellic CTec2 (Novozyme Korea, Seoul, Republic of Korea). The cellulase complex comprised 10 filter paper units per g of glucan in the substrate and mixed with 50 mM of sodium acetate buffer (pH 5.0). The enzymatic hydrolytic conditions were 50 °C for 72 h in a hybridization incubator (combi-D24, FINEPCR, Gunpo-si, Republic of Korea). After the hydrolysis, the glucose content in the mixture was determined to calculate the glucose yield as follows:
Glucose   yield   ( % ) = Glucose   content   in   the   filtrate   ( g ) Glucose   content   in   the   feedstock   ( g ) × 100

2.5. Chemical Composition Analysis

The methods of chemical composition analysis were described in a previous study in detail [25].
Lignin contents in the milled E. pellita and solid residues were determined with the laboratory analytical procedure of the National Renewable Energy Laboratory (NREL). A toal of 0.3 g (oven-dried weight) of the samples was mixed with 3.0 mL of 72% sulfuric acid solution at 30 °C for 1 h. Then, 84.0 mL of distilled water was used to dilute the mixture until a 4% sulfuric acid solution had been produced. Next, the mixture was reacted by using an autoclave at 121 °C for 1 h, and the solid fraction was separated with a glass filter and weighed to determine the amount of acid-insoluble lignin. Meanwhile, the filtrate was used to determine the amount of acid-soluble lignin by using a UV–visible spectrophotometer (UV-1601 PC, Shimadzu, Japan). Monomeric sugars (glucose, xylose, mannose, galactose, and arabinose) in the filtrate and liquid fraction of enzymatic hydrolysis were determined by using ion exchange chromatography (ICS2500, Thermo Dionex, Sunnyvale, CA, USA) equipped with a CarboPac PA-1 column (250 × 4 mm) and a pulsed amperometric detector (HP 1100, Hewlett Packard, Palo Alto, CA, USA). A potassium hydroxide solution was used as an eluent with a 1.0 mL/min of flow rate, and the analysis temperature was 40 °C.
Hemicellulose and lignin removal ratio were calculated as follows:
Hemicellulose   removal   ratio   ( % ) = Sum   of   xylan , mannan , galactan , arabinan   content   in   the   solid   residues   ( g ) Sum   of   xylan , mannan , galactan , arabinan   content   in   the   feedstock   ( g ) × 100
Lignin   removal   ratio   ( % ) = Sum   of   acid insoluble   and   acid   soluble   lignin   content   in   the   solid   residues   ( g ) Sum   of   acid insoluble   and   acid soluble   lignin   content   in   the   feedstock   ( g ) × 100

2.6. Crystallinity Index Determination

The crystallinity index of the milled E. pellta, AS, ACS, ACHS, and AHS was determined by using an X-ray diffractometer (D8 ADVANCE with DAVINCI, Bruker, Germany) equipped with an LYNXEYE XE detector. A sealed-tube Cu Ka source was used with a wavelength of 1.5418 A (40 kV voltage and 40 mA current via a generator). Scans were set from 2θ = 3° to 50° with 0.02 of step size, at 0.5 s per step.
The crystallinity index was determined with the Segal method and calculated with the peak height ratio of the 002 peaks (I002) and minimal peak (IAM) intensity as follows:
Crystallinity   index   ( % ) = ( ( I 002 I AM )   ÷   I 002 ) × 100
I002 = maximal intensity in 002 plane peak;
IAM = minimal intensity between the 002 and 110 plane peaks;
The reduction ratio of the crystallinity index (RCI) was calculated with the following formula:
Reduction   ratio   of   the   crystallinity   index   ( % ) = The   crystallinity   index   after   the   alkaline   treatment   ( % ) The   crystallinity   index   before   the   alkaline   treatment   ( % )

2.7. Statistical Analysis

All statistical verification, modeling, and plotting for the empirical data in this study were processed with open-source-based computing software R Studio (Build 382) with the stats and plot3D packages.

3. Results and Discussion

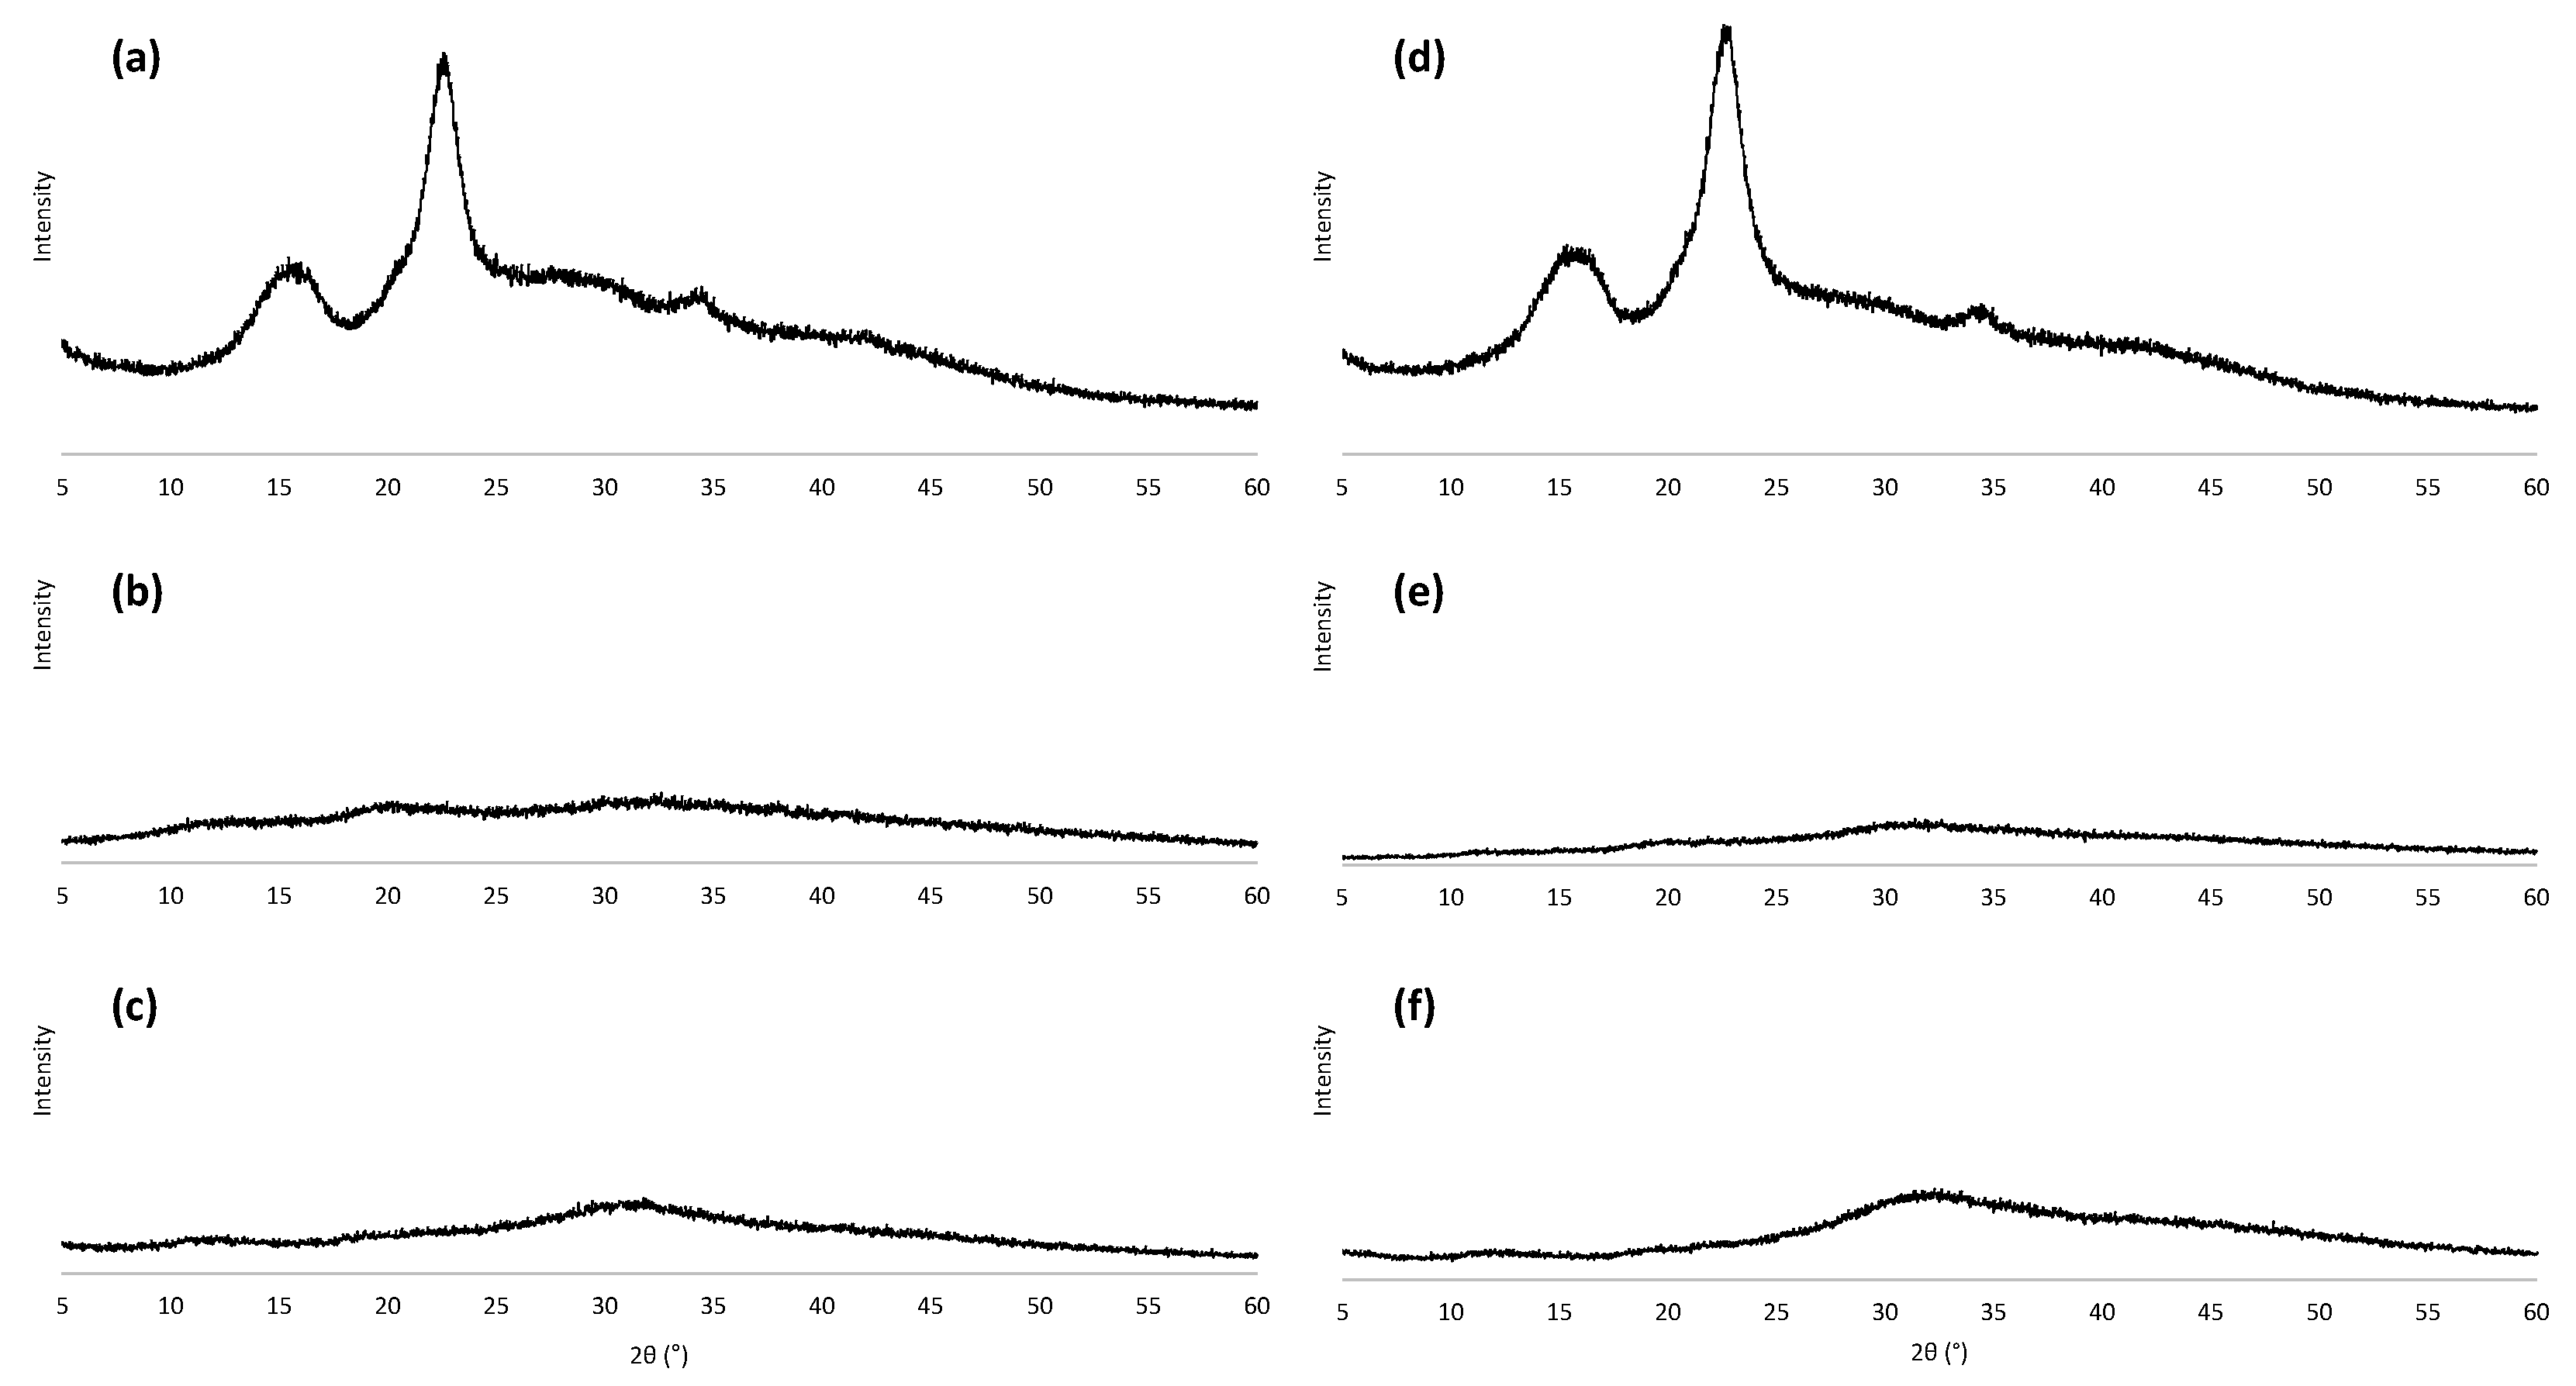
3.1. Changes in Crystallinity Index Depending on Autohydrolytic Conditions before Alkaline Treatment

Autohydrolysis, which uses heat energy without catalysts, was conducted to control the hemicellulose content in the milled E. pellita. It showed selective hemicellulose isolation from lignocellulosic biomass in a previous study [25]. The hemicellulose fraction in a sample can affect the crystallinity index and glucose production using cellulase [26]. Thus, three autohydrolytic conditions were selected that showed approximately 30% intervals of the hemicellulose removal ratio (HRR) of the autohydrolyzed solid residue (AS) (Table 1).
The crystallinity index of the milled E. pellita (59.7%) slightly increased through autohydrolysis (up to 69.6%). The breakaway of the hemicellulose fraction from biomass leads to an increase in the crystallinity index due to a decrease in the amorphous region [27]. However, the increase in the crystallinity index was not significant compared to the changes in HRR. For instance, the difference in HRR between the conditions of 160 °C for 50 min and 170 °C for 50 min was approximately 30%, and that of the crystallinity index was similar. Therefore, the crystallinity index could not be reduced through autohydrolysis alone.

3.2. Changes in Crystallinity Index Depending on Autohydrolytic Conditions after Alkaline Treatment

The alkaline treatment was conducted to alleviate the crystalline structure in AS. Two conditions of the alkaline treatment were designed by changing the sodium hydroxide concentration (8% or 12%) corresponding to the stirring time (1 or 3 h); the latter condition (12% of sodium hydroxide solution for 3 h stirring) aimed at the entire collapse of the crystalline structure.
Through both alkaline treatment conditions, the crystallinity index of autohydrolyzed and alkaline-treated solid residue (AHS) was significantly less than that of AS (Table 1). The crystallinity index of AHS ranged from 12.9% to 23.8%, and it was similar in the two alkaline treatment conditions when the autohydrolytic condition was the same. This means that the 8% of sodium hydroxide solution could suitably alleviate the crystalline structure of AS.
The X-ray diffractograms showed changes in the crystalline structures of AS and AHS (Figure 2). In the case of AS, the maximal intensity of the crystalline region at 22.7° (I002) and the (101) lattice plane at around 15° was obvious (Figure 2a,d). This means that the crystalline and amorphous regions were distinguished in the cellulose fibril [2]. These diffractograms were very similar to the feedstock’s diffractogram (not presented in this paper), which corresponded to the results of the crystallinity index in Table 1. However, AHS had no distinct peaks, including the I002 or (101) plane in the X-ray diffractograms (Figure 2b,c,e,f). Thus, the crystalline region in AS seemed to be collapsed through the alkaline treatment. An intensive swelling in cellulose fibril was reported in previous studies that had conducted the alkaline treatment using sodium hydroxide [28]. The sodium ion (Na+) had a small diameter with which to penetrate the cellulose lattice planes [29]. When the cellulosic material dissolves in sodium hydroxide solution, the sodium ion can settle between the lattice structures connected by hydrogen bonds [30]. A new cellulose lattice structure, Na–cellulose I lattice, can be formed via the substitution of the hydroxyl moiety in cellulose to the O–Na group, leading to the expansion of the molecular dimension [19]. Therefore, the alkaline treatment completely collapsed the crystalline structure in E. pellita, and the boundary between the crystalline and amorphous regions was ambiguous.

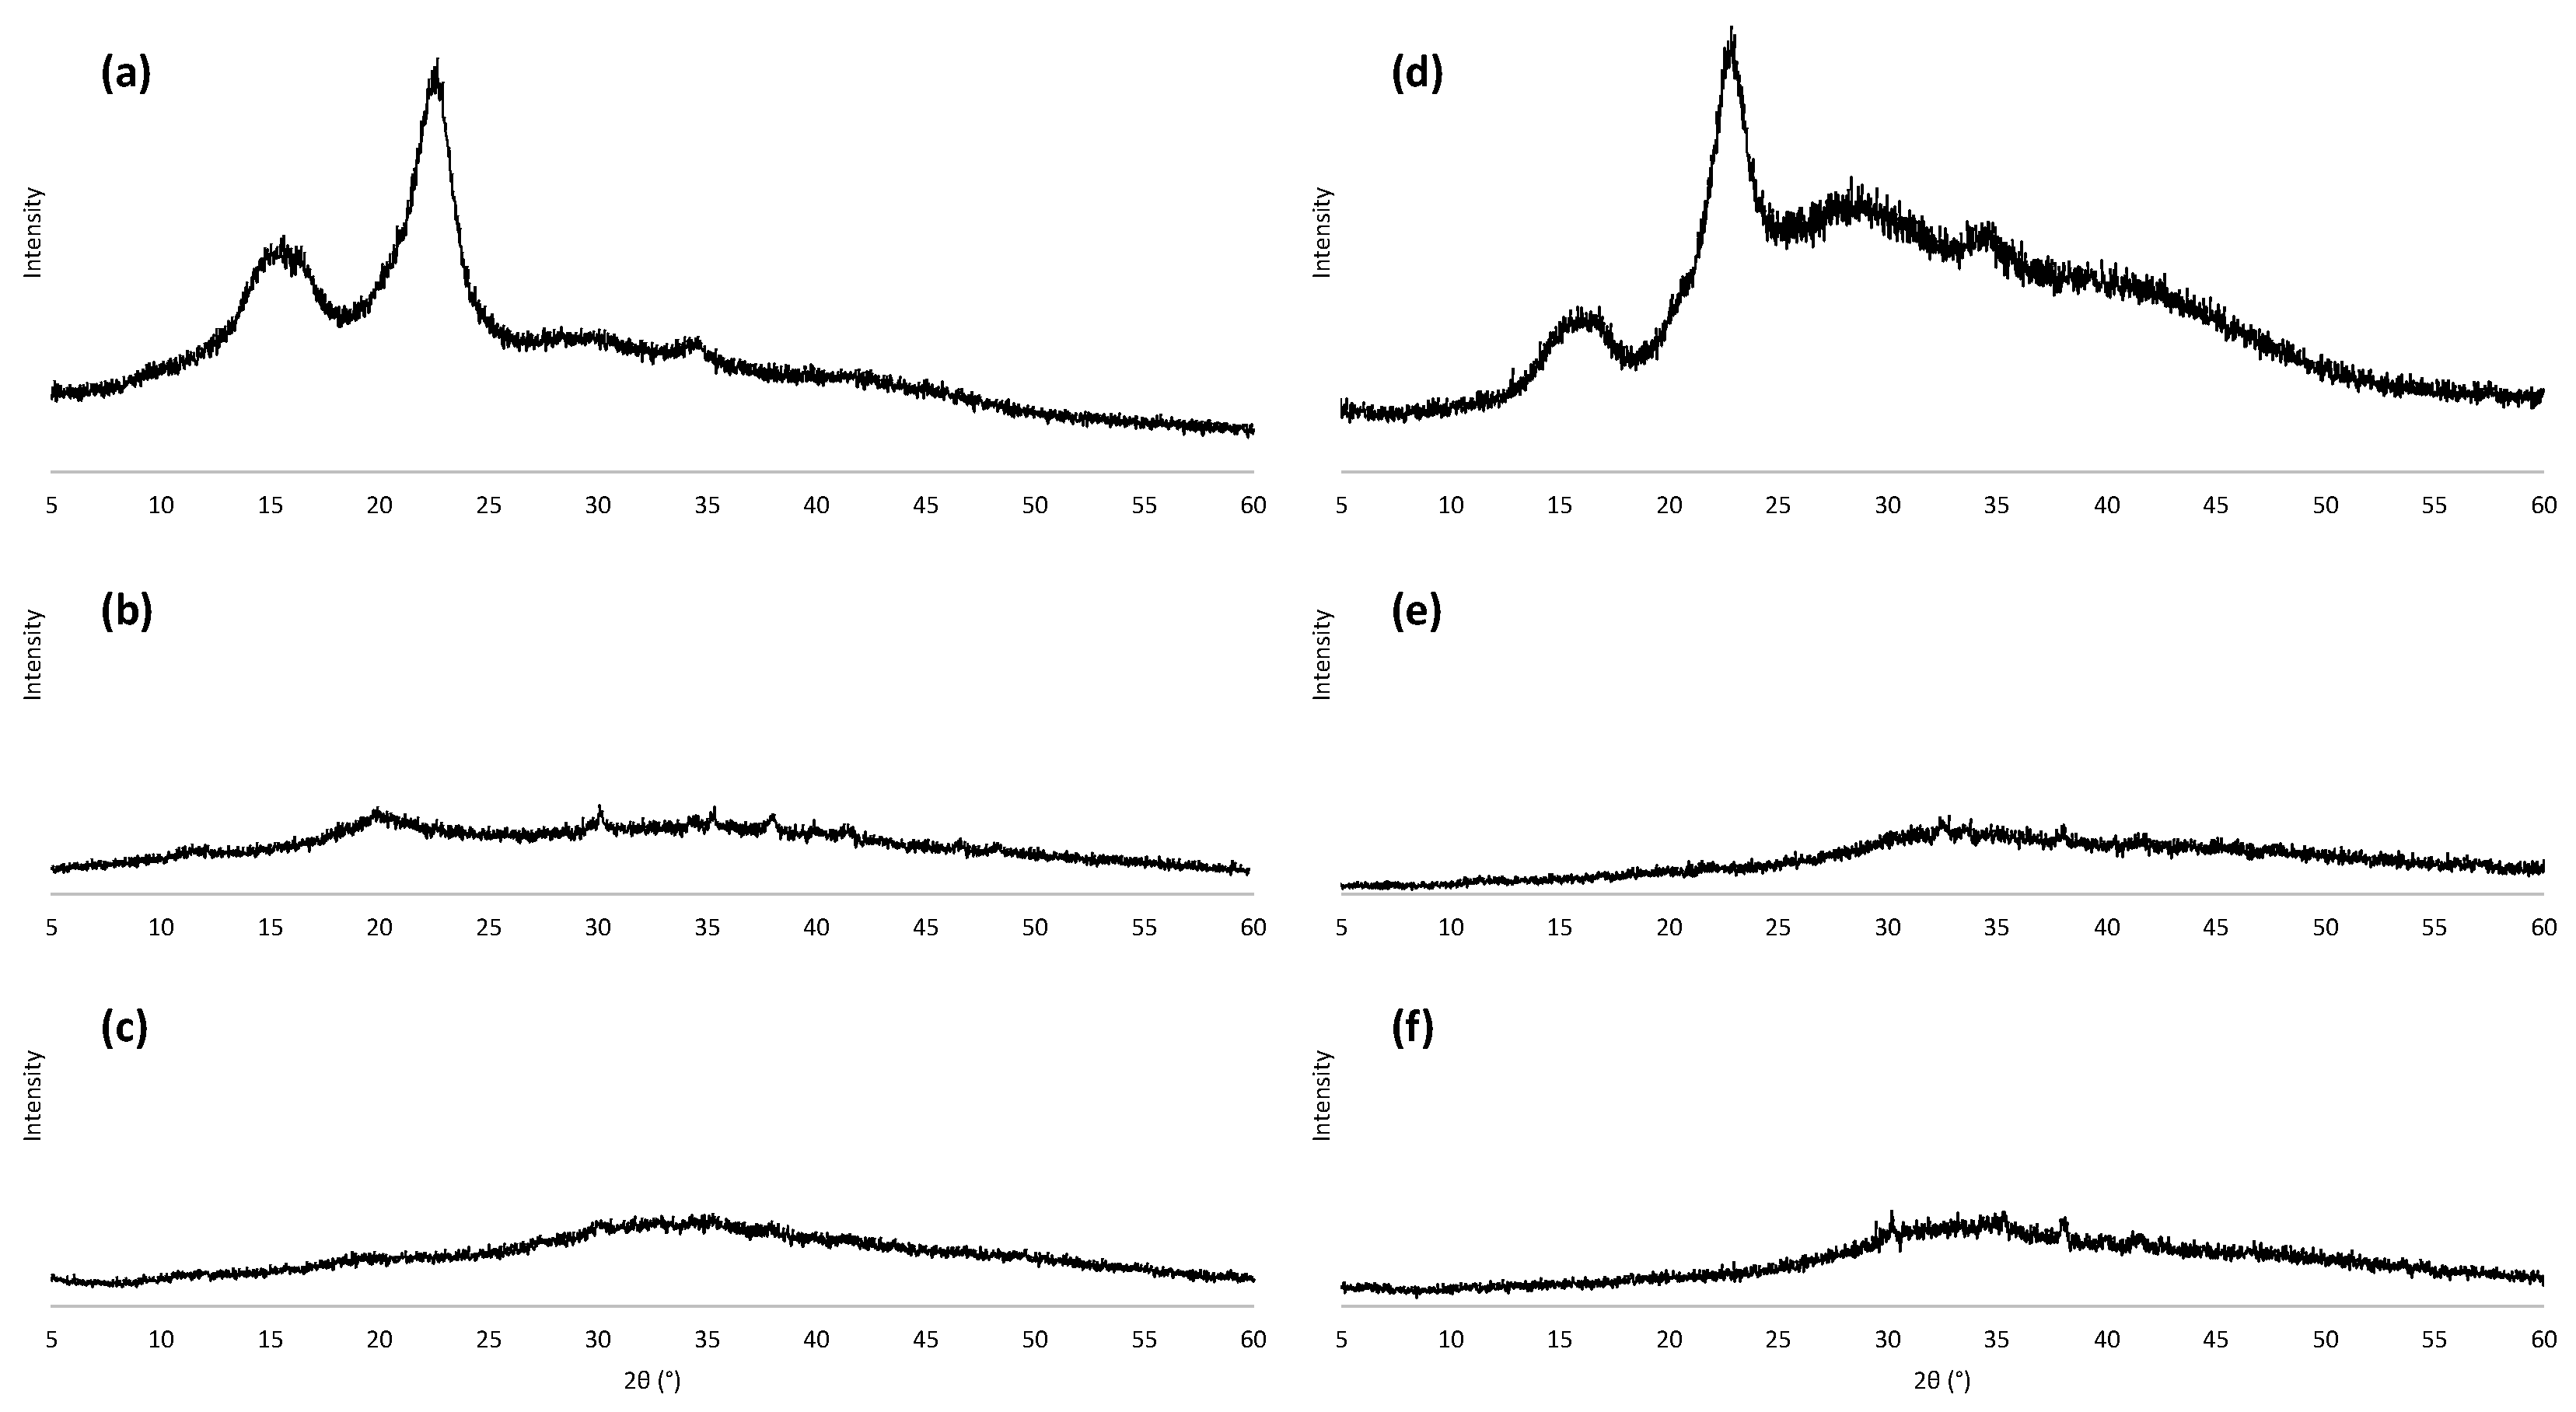
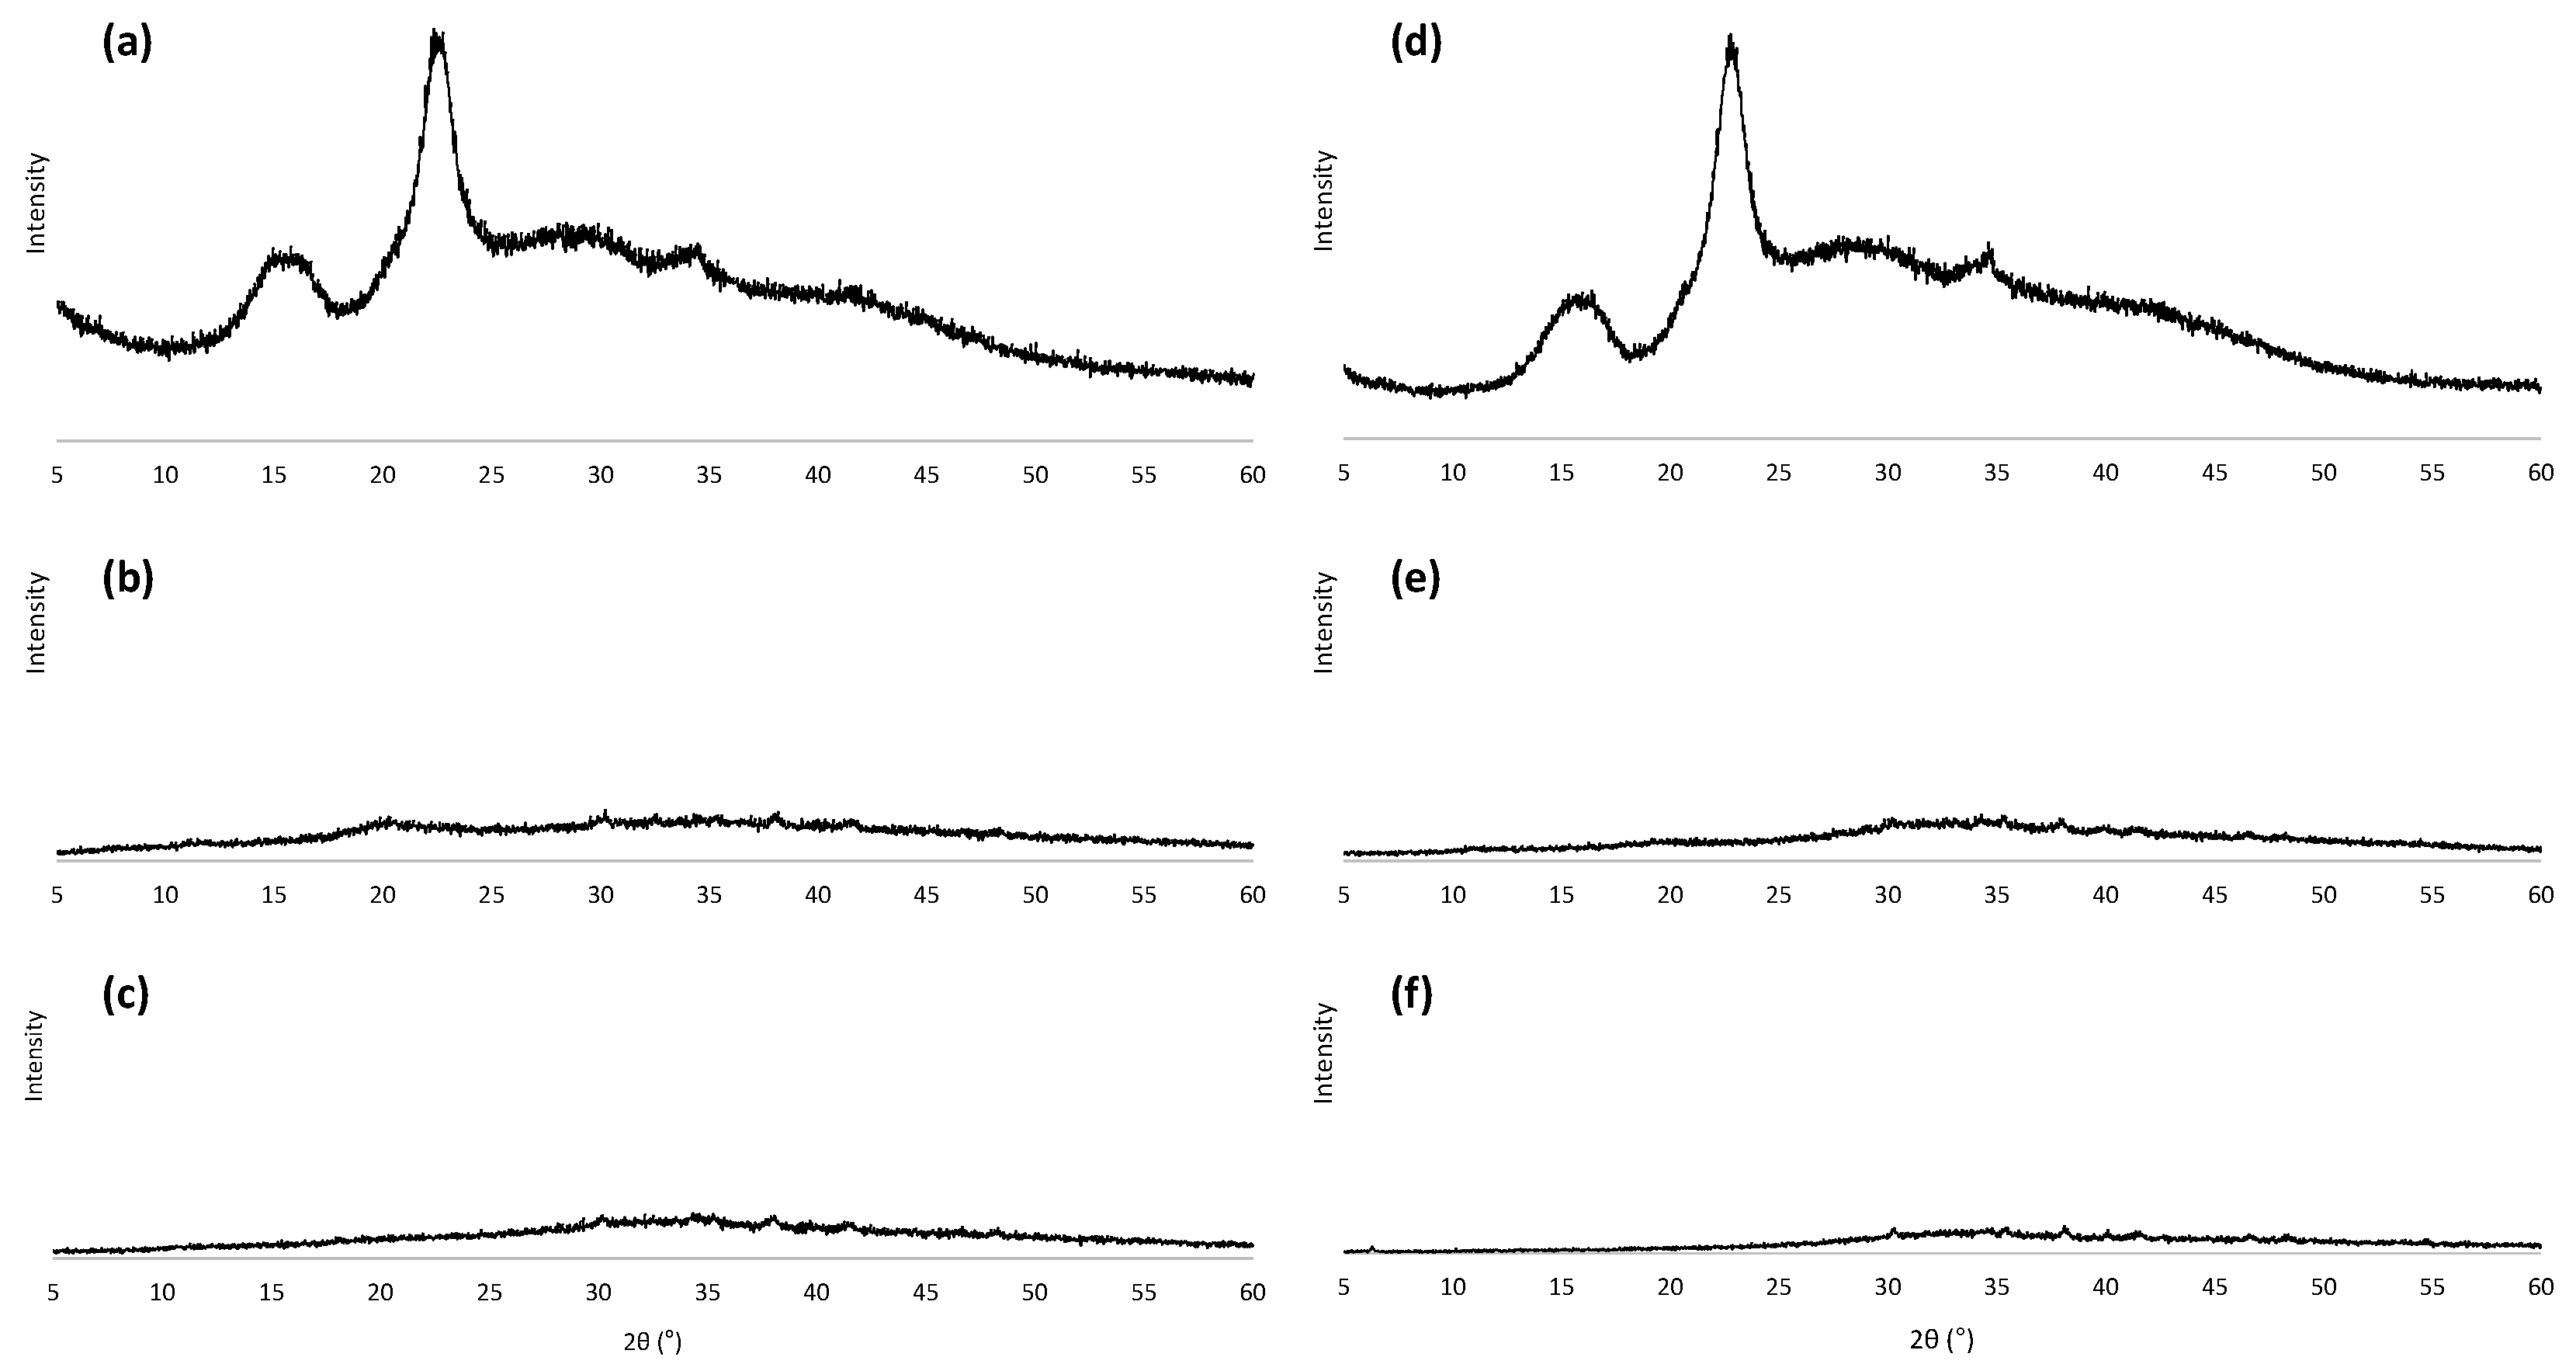
3.3. Changes in Crystallinity Index Depending on the Conditions of Autohydrolysis and Sodium Chlorite Treatment before Alkaline Treatment

The AS were subjected to the acid–chlorite treatment to control the lignin content. The acid–chlorite treatment is a modified method from holocellulose determination in biomass by Wise [31]. The Wise method was fundamentally designed to eliminate the lignin fraction in biomass and to measure the amount of pristine holocellulose, the sum of cellulose and hemicellulose. In this study, we modified the Wise method by controlling the dosages of the reagents, sodium chlorite, and acetic acid, namely, the acid–chlorite treatment. Thus, the autohydrolyzed and acid–chlorite treated solid residue (ACS), which had various ranges of HRR and lignin removal ratio (LRR), was produced via the combination of autohydrolysis and acid–chlorite treatment (Table 2).
The acid–chlorite treatment increased the crystallinity index of all ASs. The crystallinity index of ACS proportionally increased as the reagent dosage of the acid–chlorite treatment increased when the AS was treated on the same autohydrolytic condition. Similar to the removal result of hemicellulose, the lignin removal led to an increase in the relative proportion of the crystalline region in the biomass [32]. Therefore, the highest crystallinity index (81.5%) was observed when the conditions of the autohydrolysis and acid–chlorite treatment were the harshest (170 C for 50 min/4.0 g of sodium chlorite and 0.8 mL of acetic acid with twice input).

3.4. Changes in Crystallinity Index Depending on the Conditions of Autohydrolysis and Sodium Chlorite Treatment after Alkaline Treatment

The 12 types of ACS were produced by combining the 3 conditions of autohydrolysis and 4 conditions of acid–chlorite treatment. Then, they were employed in the two conditions of alkaline treatment. The crystallinity index of the autohydrolyzed and acid–chlorite/alkaline treated solid residue (ACHS) was more reduced than that of ACS (Table 2). The X-ray diffractogram of ACS showed a clear peak in the I002 plane regardless of reagent dosage for the acid–chlorite treatment (Figure 3a,d). The severity of autohydrolysis also increased (Figure 4a,d). However, the distinct peaks of ACS diminished through the alkaline treatment, which was similar to the cases of AS and AHS in Figure 2. Thus, the crystalline structure of ACS was quite damaged by the alkaline treatment regardless of the preceding treatments. The damaged crystalline structure was reported by previous studies using the alkaline treatment [2,28]. One of the studies, which used cotton linter pulp, presented similarly shaped diffractograms after sodium hydroxide/glycerin treatment [2]. Another study used tea-leaf waste fiber to produce cellulose nanocrystals that also showed a similar diffractogram after alkaline treatment with a 4% sodium hydroxide solution [28].
To find the changes in the crystallinity index after the alkaline treatment, the reduction ratio of the crystallinity index (RCI) was calculated with Equation (5). The RCI ranged from 62.2% to 88.4% and seemed similar to the results of the two alkaline treatment conditions. A paired t-test was conducted to check the significance of both RCIs, and the p-value was approximately 0.1, which represents no statistical difference. So, the mean value of RCI to estimate the correlation of HRR and LRR is shown in Table 2. The multivariate linear regression model showed that the RCI values were more strongly subordinated to LRR changes (Table 3). This linear regression model showed statistical validation via the p- (<0.0001) and R-squared (0.9361) values. This demonstrates the evident correlation between LRR and RCI (p-value < 0.0001), while HRR had no significance to RCI (Figure 5). This means that lignin affected the relative proportion over the crystalline region in cellulose microfibrils more than hemicellulose did. Lignin is typically considered one of the major factors contributing the biomass recalcitrance by acting as a physical barrier for cellulose [33]. Meanwhile, lignin removal is a critical factor to increase the crystallinity index, which is also one of the biomass recalcitrance factors. Therefore, the effect of lignin removal with changes in the crystallinity index on the recalcitrance of E. pellita was evaluated via enzymatic hydrolysis using ACHS in the next section.

3.5. Glucose Yield Depending on Treatment Conditions

A high glucose yield was observed via the large reagent dosages in the acid–chlorite treatment (Table 4 and Table 5). This means that the LRR led to an improvement in glucose yield due to the several negative effects of lignin on the enzyme activities, such as blocking the cellulose access and irreversible absorption [9]. The glucose yield did not increase in the highest reagent dosage (4.0 g of sodium chlorite and 0.8 mL of acetic acid with twice input) of the acid–chlorite treatment even though the LRR steadily increased. An extreme level of LRR may not need to achieve a high glucose yield from lignocellulosic biomass [34].
The change in glucose yield strongly relied on the LRR regardless of controlling the crystallinity index because the glucose yield increased as an increase in the crystallinity index that did not correspond to one of the recalcitrance factors (Table 4 and Table 5). It corresponded to the two-way analysis of variance (ANOVA) results for glucose yield to LRR and RCI as independent factors (Table 6 and Table 7). LRR showed a strong significance for improving glucose yields in both alkaline treatment conditions. Meanwhile, RCI had no statistical significance in the glucose yield in the two conditions. At least in this study, biomass recalcitrance was not alleviated by controlling the crystallinity index and it seemed to not be correlated with glucose yield.
Consequently, the cellulose crystalline structure was not a significant hindrance factor to the cellulase activity by controlling the crystallinity index using sodium hydroxide. The glucose production from lignocellulosic biomass could be improved through the control of its chemical composition, especially lignin, with statistical analysis regardless of changes in the crystallinity index.

4. Conclusions

The effect of the crystallinity index on biomass recalcitrance was evaluated via alkaline treatment and enzymatic hydrolysis. For this purpose, various solid residues were prepared through autohydrolysis and acid–chlorite treatment to control the hemicellulose and lignin content in E. pellita. The removal of hemicellulose and lignin led to a significant increase in the crystallinity index. Then, the alkaline treatment successfully reduced the crystallinity index by attenuating the crystalline region. However, a decrease in the crystallinity index could not drive the improvement in glucose yield via enzymatic hydrolysis. Meanwhile, the crystallinity index and glucose yield relied on the lignin removal ratio. Overall, the crystallinity index showed a relatively low influence on biomass recalcitrance and was negligible to improve glucose production.

Author Contributions

Conceptualization, S.-K.J. and I.-G.C.; methodology, S.-K.J. and H.J.; software, S.-K.J.; validation, S.-K.J. and H.J.; formal analysis, S.-K.J.; investigation, S.-K.J.; resources, I.-G.C.; data curation, S.-K.J.; writing—original draft preparation, S.-K.J.; writing—review and editing, H.J.; visualization, S.-K.J.; supervision, I.-G.C.; project administration, I.-G.C.; funding acquisition, H.J. All authors have read and agreed to the published version of the manuscript.

Funding

This research was funded by the National Institute of Forest Science, grant number FP0700-2022-01-2023 and the National Foundation of Korea, grant number 2021M3H4A3A02086904.

Institutional Review Board Statement

Not applicable.

Informed Consent Statement

Not applicable.

Data Availability Statement

Data sharing not applicable.

Conflicts of Interest

The authors declare no conflict of interest.

References

  1. Mazeau, K. On the external morphology of native cellulose microfibrils. Carbohydr. Polym. 2011, 84, 524–532. [Google Scholar] [CrossRef]
  2. Li, K.; Yang, H.; Jiang, L.; Liu, X.; Lang, P.; Deng, B.; Li, N.; Xu, W. Glycerin/NaOH Aqueous Solution as a Green Solvent System for Dissolution of Cellulose. Polymers 2020, 12, 1735. [Google Scholar] [CrossRef]
  3. Chundawat, S.P.; Bellesia, G.; Uppugundla, N.; da Costa Sousa, L.; Gao, D.; Cheh, A.M.; Agarwal, U.P.; Bianchetti, C.M.; Phillips Jr, G.N.; Langan, P. Restructuring the crystalline cellulose hydrogen bond network enhances its depolymerization rate. J. Am. Chem. Soc. 2011, 133, 11163–11174. [Google Scholar] [CrossRef]
  4. He, M.; Zhao, Y.; Duan, J.; Wang, Z.; Chen, Y.; Zhang, L. Fast contact of solid–liquid interface created high strength multi-layered cellulose hydrogels with controllable size. ACS Appl. Mater. Interfaces 2014, 6, 1872–1878. [Google Scholar] [CrossRef]
  5. Phitsuwan, P.; Sakka, K.; Ratanakhanokchai, K. Improvement of lignocellulosic biomass in planta: A review of feedstocks, biomass recalcitrance, and strategic manipulation of ideal plants designed for ethanol production and processability. Biomass Bioenergy 2013, 58, 390–405. [Google Scholar] [CrossRef]
  6. Xu, S.; Wang, R.; Gasser, T.; Ciais, P.; Peñuelas, J.; Balkanski, Y.; Boucher, O.; Janssens, I.A.; Sardans, J.; Clark, J.H. Delayed use of bioenergy crops might threaten climate and food security. Nature 2022, 609, 299–306. [Google Scholar] [CrossRef]
  7. Liao, Y.; Koelewijn, S.-F.; Van den Bossche, G.; Van Aelst, J.; Van den Bosch, S.; Renders, T.; Navare, K.; Nicolaï, T.; Van Aelst, K.; Maesen, M. A sustainable wood biorefinery for low–carbon footprint chemicals production. Science 2020, 367, 1385–1390. [Google Scholar] [CrossRef]
  8. McLean, B.W.; Boraston, A.B.; Brouwer, D.; Sanaie, N.; Fyfe, C.A.; Warren, R.A.J.; Kilburn, D.G.; Haynes, C.A. Carbohydrate-binding modules recognize fine substructures of cellulose. J. Biol. Chem. 2002, 277, 50245–50254. [Google Scholar] [CrossRef] [Green Version]
  9. Saini, J.K.; Patel, A.K.; Adsul, M.; Singhania, R.R. Cellulase adsorption on lignin: A roadblock for economic hydrolysis of biomass. Renew. Energy 2016, 98, 29–42. [Google Scholar] [CrossRef]
  10. Xiao, Z.; Gao, P.; Qu, Y.; Wang, T. Cellulose-binding domain of endoglucanase III from Trichoderma reesei disrupting the structure of cellulose. Biotechnol. Lett. 2001, 23, 711–715. [Google Scholar] [CrossRef]
  11. Gupta, R.; Lee, Y. Mechanism of cellulase reaction on pure cellulosic substrates. Biotechnol. Bioeng. 2009, 102, 1570–1581. [Google Scholar] [CrossRef]
  12. Puri, V.P. Effect of crystallinity and degree of polymerization of cellulose on enzymatic saccharification. Biotechnol. Bioeng. 1984, 26, 1219–1222. [Google Scholar] [CrossRef]
  13. Lynd, L.R.; Weimer, P.J.; Van Zyl, W.H.; Pretorius, I.S. Microbial cellulose utilization: Fundamentals and biotechnology. Microbiol. Mol. Biol. Rev. 2002, 66, 506–577. [Google Scholar] [CrossRef] [Green Version]
  14. Mansfield, S.D.; Mooney, C.; Saddler, J.N. Substrate and enzyme characteristics that limit cellulose hydrolysis. Biotechnol. Prog. 1999, 15, 804–816. [Google Scholar] [CrossRef]
  15. Ku, H.; Wang, H.; Pattarachaiyakoop, N.; Trada, M. A review on the tensile properties of natural fiber reinforced polymer composites. Compos. Part B Eng. 2011, 42, 856–873. [Google Scholar] [CrossRef] [Green Version]
  16. Wang, H.; Postle, R.; Kessler, R.; Kessler, W. Removing pectin and lignin during chemical processing of hemp for textile applications. Text. Res. J. 2003, 73, 664–669. [Google Scholar] [CrossRef]
  17. Bledzki, A.; Gassan, J. Composites reinforced with cellulose based fibres. Prog. Polym. Sci. 1999, 24, 221–274. [Google Scholar] [CrossRef]
  18. John, M.J.; Anandjiwala, R.D. Recent developments in chemical modification and characterization of natural fiber-reinforced composites. Polym. Compos. 2008, 29, 187–207. [Google Scholar] [CrossRef]
  19. Mwaikambo, L.Y.; Ansell, M.P. Chemical modification of hemp, sisal, jute, and kapok fibers by alkalization. J. Appl. Polym. Sci. 2002, 84, 2222–2234. [Google Scholar] [CrossRef]
  20. Symington, M.C.; Banks, W.M.; West, O.D.; Pethrick, R. Tensile testing of cellulose based natural fibers for structural composite applications. J. Compos. Mater. 2009, 43, 1083–1108. [Google Scholar] [CrossRef] [Green Version]
  21. Zhao, H.; Kwak, J.H.; Wang, Y.; Franz, J.A.; White, J.M.; Holladay, J.E. Effects of crystallinity on dilute acid hydrolysis of cellulose by cellulose ball-milling study. Energy Fuels 2006, 20, 807–811. [Google Scholar] [CrossRef]
  22. Park, S.; Baker, J.O.; Himmel, M.E.; Parilla, P.A.; Johnson, D.K. Cellulose crystallinity index: Measurement techniques and their impact on interpreting cellulase performance. Biotechnol. Biofuels 2010, 3, 1–10. [Google Scholar] [CrossRef] [Green Version]
  23. Segal, L.; Creely, J.J.; Martin Jr, A.; Conrad, C. An empirical method for estimating the degree of crystallinity of native cellulose using the X-ray diffractometer. Text. Res. J. 1959, 29, 786–794. [Google Scholar] [CrossRef]
  24. Jang, S.-K.; Choi, J.-H.; Kim, J.-H.; Kim, H.; Jeong, H.; Choi, I.-G. Statistical analysis of glucose production from Eucalyptus pellita with individual control of chemical constituents. Renew. Energy 2020, 148, 298–308. [Google Scholar] [CrossRef]
  25. Jang, S.-K.; Kim, J.-H.; Choi, J.-H.; Cho, S.-M.; Kim, J.-C.; Kim, H.; Choi, I.-G. Evaluation of xylooligosaccharides production for a specific degree of polymerization by liquid hot water treatment of tropical hardwood. Foods 2021, 10, 463. [Google Scholar] [CrossRef]
  26. Xu, N.; Zhang, W.; Ren, S.; Liu, F.; Zhao, C.; Liao, H.; Xu, Z.; Huang, J.; Li, Q.; Tu, Y. Hemicelluloses negatively affect lignocellulose crystallinity for high biomass digestibility under NaOH and H 2 SO 4 pretreatments in Miscanthus. Biotechnol. Biofuels 2012, 5, 1–12. [Google Scholar] [CrossRef] [Green Version]
  27. Kanchanalai, P.; Temani, G.; Kawajiri, Y.; Realff, M.J. Reaction kinetics of concentrated-acid hydrolysis for cellulose and hemicellulose and effect of crystallinity. BioResources 2016, 11, 1672–1689. [Google Scholar] [CrossRef]
  28. Abdul Rahman, N.H.; Chieng, B.W.; Ibrahim, N.A.; Abdul Rahman, N. Extraction and characterization of cellulose nanocrystals from tea leaf waste fibers. Polymers 2017, 9, 588. [Google Scholar] [CrossRef] [Green Version]
  29. Lindman, B.; Karlström, G.; Stigsson, L. On the mechanism of dissolution of cellulose. J. Mol. Liq. 2010, 156, 76–81. [Google Scholar] [CrossRef]
  30. Li, X.; Tabil, L.G.; Panigrahi, S. Chemical treatments of natural fiber for use in natural fiber-reinforced composites: A review. J. Polym. Environ. 2007, 15, 25–33. [Google Scholar] [CrossRef]
  31. Wise, L.E. Chlorite holocellulose, its fractionation and bearing on summative wood analysis and on studies on the hemicelluloses. Pap. Trade J. 1946, 122, 35–43. [Google Scholar]
  32. Yoshida, M.; Liu, Y.; Uchida, S.; Kawarada, K.; Ukagami, Y.; Ichinose, H.; Kaneko, S.; Fukuda, K. Effects of cellulose crystallinity, hemicellulose, and lignin on the enzymatic hydrolysis of Miscanthus sinensis to monosaccharides. Biosci. Biotechnol. Biochem. 2008, 72, 805–810. [Google Scholar] [CrossRef] [PubMed] [Green Version]
  33. Li, Q.; Fu, C.; Liang, C.; Ni, X.; Zhao, X.; Chen, M.; Ou, L. Crop lodging and the roles of lignin, cellulose, and hemicellulose in lodging resistance. Agronomy 2022, 12, 1795. [Google Scholar] [CrossRef]
  34. Przybysz Buzała, K.; Kalinowska, H.; Małachowska, E.; Boruszewski, P.; Krajewski, K.; Przybysz, P. The effect of lignin content in birch and beech kraft cellulosic pulps on simple sugar yields from the enzymatic hydrolysis of cellulose. Energies 2019, 12, 2952. [Google Scholar] [CrossRef] [Green Version]
Figure 1. Scheme of the subsequent treatment of milled Eucalyptus pellita.
Sustainability 15 05869 g001
Figure 2. X-ray diffractograms of autohydrolyzed solid residue (AS) and autohydrolyzed and alkaline-treated solid residue (AHS). (a) AS: 160 °C for 10 min; (b) AHS: 160 °C for 10 min/8% sodium hydroxide; (c) AHS: 160 °C for 10 min/12% sodium hydroxide; (d) AS: 170 °C for 50 min; (e) AHS: 170 °C for 50 min/8% sodium hydroxide; (f) AHS: 170 °C for 50 min/12% sodium hydroxide.
Sustainability 15 05869 g002
Figure 3. X-ray diffractograms of autohydrolyzed and acid–chlorite treated solid residue (ACS) and autohydrolyzed and acid–chlorite/alkaline treated solid residue (ACHS); (a) ACS: 160 °C for 10 min/1.5 g of sodium chlorite with 0.3 mL of acetic acid; (b) ACHS: 160 °C for 10 min/1.5 g with 0.3 mL/8% sodium hydroxide; (c) ACHS: 160 °C for 10 min/1.5 g with 0.3 mL/12% sodium hydroxide; (d) ACS: 160 °C for 10 min/4.0 g with 0.8 mL (twice input); (e) ACHS: 160 °C for 10 min/4.0 g with 0.8 mL (twice input)/8% sodium hydroxide; (f) ACHS: 160 °C for 10 min/4.0 g with 0.8 mL (twice input)/12% sodium hydroxide.
Sustainability 15 05869 g003
Figure 4. X-ray diffractograms of autohydrolyzed and acid–chlorite treated solid residue (ACS) and autohydrolyzed and acid–chlorite/alkaline treated solid residue (ACHS); (a) ACS: 170 °C for 50 min/1.5 g of sodium chlorite with 0.3 mL of acetic acid; (b) ACHS: 170 °C for 50 min/1.5 g with 0.3 mL/8% sodium hydroxide; (c) ACHS: 170 °C for 50 min/1.5 g with 0.3 mL/12% sodium hydroxide; (d) ACS: 170 °C for 50 min/4.0 g with 0.8 mL (twice input); (e) ACHS: 170 °C for 50 min/4.0 g with 0.8 mL (twice input)/8% sodium hydroxide; (f) ACHS: 170 °C for 50 min/4.0 g with 0.8 mL (twice input)/12% sodium hydroxide.
Sustainability 15 05869 g004
Figure 5. Three-dimensional plot of the multiple linear regression model for the reduction ratio of the crystallinity index (RCI) to hemicellulose removal ratio (HRR) and lignin removal ratio (LRR) (red dots: empirical data of this study).
Sustainability 15 05869 g005
Table 1. Hemicellulose removal ratio (HRR) and crystallinity index of the milled E. pellita, autohydrolyzed solid residue (AS), and autohydrolyzed and alkaline treated solid residue (AHS).
Autohydrolysis ConditionsHRR (%) 1Crystallinity Index (%)
Temp. (°C)Time (min)Without Alkaline1 22 3
E. pellita059.7 ± 0.2--
1601030.065.6 ± 0.112.9 ± 1.313.5 ± 1.3
1605057.769.6 ± 0.518.9 ± 4.315.6 ± 1.2
1705086.468.9 ± 0.323.8 ± 0.922.8 ± 0.1
Values are the mean ± standard deviation. 1 HRR: hemicellulose removal ratio. 2 1: 8% (w/w) sodium hydroxide solution at 0 °C for 60 min; 3 2: 12% (w/w) sodium hydroxide solution at 0 °C for 180 min.
Table 2. Hemicellulose (HRR) and lignin removal ratio (LRR) and crystallinity index of autohydrolyzed and acid–chlorite treated solid residue (ACS), and autohydrolyzed and acid-chlorite/alkaline treated solid residue (ACHS).
Autohydrolytic ConditionsAcid–Chlorite ConditionsHRR (%) 1LRR (%) 2Crystallinity Index (%)RCI (%) 5
Sodium
Chlorite (g)
Acetic Acid (mL)Without
Alkaline
#1 3#2 4
160 °C/10 min1.50.330.030.566.0 ± 1.67.7 ± 0.812.3 ± 1.184.9
2.50.532.247.171.6 ± 1.412.1 ± 2.615.6 ± 1.581.8
4.00.832.267.872.7 ± 1.719.9 ± 0.518.7 ± 2.775.5
4.0 × 20.8 × 237.579.975.1 ± 2.927.1 ± 2.921.9 ± 0.465.7
160 °C/50 min1.50.367.636.272.0 ± 2.78.0 ± 1.313.9 ± 1.384.8
2.50.566.160.175.1 ± 0.913.1 ± 1.018.3 ± 2.779.1
4.00.872.283.977.2 ± 2.023.3 ± 0.820.1 ± 1.271.9
4.0 × 20.8 × 278.295.479.2 ± 3.027.0 ± 3.524.5 ± 1.267.5
170 °C/50 min1.50.389.437.671.6 ± 1.99.1 ± 0.814.9 ± 0.283.3
2.50.589.457.874.3 ± 0.814.1 ± 2.317.7 ± 1.178.6
4.00.888.788.879.7 ± 1.122.8 ± 0.729.9 ± 3.066.9
4.0 × 20.8 × 291.799.181.5 ± 0.729.5 ± 1.130.8 ± 0.863.0
Values are the mean ± standard deviation.1 HRR: hemicellulose removal ratio; 2 LRR: lignin removal ratio. 3 #1: 8% (w/w) sodium hydroxide solution at 0 °C for 60 min; 4 #2: 12% (w/w) sodium hydroxide solution at 0 °C for 180 min. 5 RCI: reduction ratio of the crystallinity index.
Table 3. Parameter estimates of the multiple linear regression model for the reduction ratio of the crystallinity index (RCI) to hemicellulose removal ratio (HRR) and lignin removal ratio (LRR).
VariableEstimateStandard Errort ValuePr (>|t|)
(Intercept)95.3182.25542.2701.16 × 10−11 ***
HRR0.0200.0290.6890.508
LRR−0.3270.030−10.9451.68 × 10−6 ***
Multiple R-squared value = 0.9361; adjusted R-squared value = 0.9220; p-value of the model = 4.202 × 10⁻⁶ (significant codes: ***, 0.0001).
Table 4. Glucose yield of the alkaline-treated E. pellita and autohydrolyzed and autohydrolyzed and alkaline treated solid residue (AHS).
Autohydrolytic ConditionsGlucose Yield (%)
Temp. (°C)Time (min)#1 1#2 2
E. pellita30.5 ± 2.236.0 ± 1.3
1601034.7 ± 1.539.1 ± 0.7
1605034.1 ± 0.238.9 ± 2.1
1705035.8 ± 1.139.9 ± 1.3
Values are the mean ± standard deviation. 1 #1: 8% (w/w) sodium hydroxide solution at 0 °C for 60 min; 2 #2: 12% (w/w) sodium hydroxide solution at 0 °C for 180 min.
Table 5. Glucose yield of the autohydrolyzed and sodium chlorite/alkaline-treated solid residue (ACHS).
Autohydrolytic ConditionsAcid–Chlorite ConditionsGlucose Yield (%)
Sodium
Chlorite (g)
Acetic Acid (mL)#1 1#2 2
160 °C/10 min1.50.331.3 ± 0.936.8 ± 0.2
2.50.557.2 ± 3.259.3 ± 0.6
4.00.873.4 ± 0.174.1 ± 1.7
4.0 × 20.8 × 274.6 ± 1.875.7 ± 0.3
160 °C/50 min1.50.330.9 ± 1.633.5 ± 1.3
2.50.555.6 ± 0.260.0 ± 1.2
4.00.871.1 ± 0.873.8 ± 0.9
4.0 × 20.8 × 270.6 ± 0.471.3 ± 2.4
170 °C/50 min1.50.333.2 ± 0.435.6 ± 1.4
2.50.556.5 ± 0.557.5 ± 2.5
4.00.873.4 ± 2.576.2 ± 0.7
4.0 × 20.8 × 273.1 ± 0.577.1 ± 1.6
Values are the mean ± standard deviation. 1 #1: 8% (w/w) sodium hydroxide solution at 0 °C for 60 min; 2 #2: 12% (w/w) sodium hydroxide solution at 0 °C for 180 min.
Table 6. Two-way analysis of variance for glucose yield to lignin removal ratio (LRR) and reduction ratio of the crystallinity index (RCI) (alkaline treatment condition: 8% sodium hydroxide for 1 h).
Source of VariationDegrees of FreedomSum of SquaresMean SquaresF ValuePr (>F)
LRR12778.52778.5109.0376.41 × 10−6 ***
RCI10.10.10.0030.957
LRR × RCI1394.8394.815.4910.004 **
Residuals8203.925.5
(Significant codes: ***, 0.0001; **, 0.001).
Table 7. Two-way analysis of variance for glucose yield to lignin removal ratio (LRR) and reduction ratio of the crystallinity index (RCI) (alkaline treatment condition: 12% sodium hydroxide for 3 h).
Source of VariationDegrees of FreedomSum of SquaresMean SquaresF ValuePr (>F)
LRR12631.02631.096.439.72 × 10−6 ***
RCI10.00.00.000.995
LRR × RCI1301.7301.711.060.011 *
Residuals8218.327.3
(Significant codes: ***, 0.0001; *, 0.01).
Disclaimer/Publisher’s Note: The statements, opinions and data contained in all publications are solely those of the individual author(s) and contributor(s) and not of MDPI and/or the editor(s). MDPI and/or the editor(s) disclaim responsibility for any injury to people or property resulting from any ideas, methods, instructions or products referred to in the content.

