1. Introduction
At present, popular low-carbon awareness is gradually increasing, making the new energy family car increasingly popular in China. Consequently, the consumption of power batteries is also rising year-on-year, and the number of used batteries that reach the end of their service life will continue to increase [
1,
2]. China’s power battery production and new installations grew in the first quarter of 2023 as the country’s new energy vehicle (NEV) production and sales continued to climb. According to the China Association of Automobile Manufacturers, China produced 51.2 GWh of power batteries in March, up 27 per cent year-on-year and 24 per cent sequentially. New installed capacity was 27.8 GWh, up 30 per cent year-on-year and 27 per cent sequentially [
3]. According to a research report from the China Automotive Center, pure electric vehicles make a significant contribution to carbon reduction during the fuel cycle, while power batteries account for nearly 40% of carbon emissions during the lifecycle of pure electric vehicles [
4]. Therefore, after the implementation of comprehensive electrification, the carbon reduction of the power battery itself becomes particularly important. The power battery industry should focus on low-carbon emissions in the production process, not only from the production perspective of materials and reducing processes with high carbon emissions, but also on the need for innovation throughout the entire industry chain, including the recycling process. Material recycling and cascade utilization of waste batteries are also effective measures to achieve carbon emission management in the lithium battery industry chain. At present, the domestic decommissioned power battery recycling rate is high, recycling is only the first half of the reverse supply chain, the next step is the processing and reselling of the waste battery in order to form a truly closed loop [
5]. According to the report on the Circular Economy Potential of New Energy Vehicle Batteries released by global environmental organization Greenpeace in 2030, the number of retired power batteries in China will reach 708 GWH in 2021–2030, and the effective cascade utilization of these batteries will reduce carbon emissions by nearly 33.42 million tons compared with manufacturing the same number of new batteries. The prediction of power battery retirement scale in China between 2021 and 2030 is shown in
Figure 1.
If a large number of retired power batteries are not recycled in a timely and responsible manner, they will inevitably pollute the environment, endanger human health and cause resource waste. Therefore, the recycling of power batteries has economic and social benefits. The recycling and reuse modes of retired lithium power batteries can be roughly divided into three types: cascade utilization, extraction of raw materials and repair and regeneration. The current situation is that enterprises have a high demand for power battery recycling but low profits, insufficient capacity utilization and are hampered by unfair bidding which disrupts the market. The specific issues involve numerous fields such as technology, policy standards and funding, mainly concentrated in the technical field [
6]. It is necessary to develop low-cost, low-polluting, and sustainable profit recovery technologies, which are all problems faced by the retired power battery recycling and reuse industry [
7]. In January 2022, the Political Bureau of the Central Committee of the Communist Party of China held its 36th collective learning session on “dual carbon”. The general secretary at the meeting made clear that “carbon peak and carbon neutrality” are inevitable requirements for promoting high-quality development and realizing green and low-carbon development in China. With the rapid development of China’s economy and the continuous expansion of the scale of its industrial production, the emissions of carbon dioxide are also increasing. The trends of China’s economic development and carbon dioxide emissions are shown in
Figure 2. Since 2011, China has been paying attention to environmental protection issues. The implementation of a series of environmental policies and the use of low-carbon energy have slowed down the growth rate of carbon dioxide emissions [
8].
In this context, this article focuses on the closed-loop supply chain of power batteries. By innovating low-carbon technologies to reduce carbon emissions in the power battery recycling process, it is beneficial to enhance the reuse of power batteries, promote resource recycling, and enhance the overall low-carbon capacity of the supply chain. Most scholars have studied the consideration of technological innovation in the forward supply chain, but no one has studied the consideration of innovation input in the reverse chain in the closed-loop supply chain. The situation in which enterprises are responsible for both echelon utilization and recycling in reverse supply chain is even less studied. This paper builds mathematical models based on the gaps in these two research areas. Therefore, this paper considers that echelon utilization enterprises in the reverse chain are responsible for recycling power batteries and investing in low-carbon innovation, constructs a closed-loop supply chain model of new power batteries, analyzes and examines its impact on supply chain pricing decisions and the dependence of important parameters. This provides a new direction for research into power battery closed-loop supply chains.
2. Literature Review
2.1. Research on Closed-Loop Supply Chain
The system oriented by closed-loop supply chain is greatly beyond the traditional supply chain in terms of depth and breadth. It is not simply “forward + reverse”, but involves a series of changes from the strategic layer to the operational layer, which is far more complex and difficult than the forward supply chain. Adopting closed-loop supply chain management may increase the cost of the existing links of enterprises in the short term, but enterprises can improve their competitiveness and achieve sustainable development by reducing material operating costs. At the same time, the implementation of closed-loop supply chain management needs to be supported by environmental laws and regulations and government policies, and also needs to actively guide customers’ environmental orientation. Of course, people increasingly pay attention to environmental protection and meeting customers’ green standards will become necessary in green supply chain management, which can effectively promote the coordinated development of enterprise environment and economic interests. The research directions of closed-loop supply chain mainly include operational decision-making, pricing and coordination and recycling channel management. The following work is a literature review from four aspects related to this study.
For the research on closed-loop supply chains under different recycling channels, we refer to the following literature. PD Giovanni analyzes the benefits of blockchain to circular economy, which is composed of closed-loop supply chain system and reverse Omni channel solution. By ensuring transparency, traceability, visibility and security, blockchain allows enterprises to obtain operational capabilities through closed-loop supply chain and service capabilities through reverse Omni channels, which can greatly improve business performance [
9]. Yanting Huang et al. studied the impact of dual online and offline recycling channels in closed-loop supply chains. This work also illustrates that government subsidies play a positive role in promoting recycling and the remanufacturing intentions of remanufacturers and recyclers [
10]. Regarding the closed-loop supply chain under the implementation of reward and punishment measures by the government, we refer to the following literature: Yujie Gu et al. studied the optimal decision-making of government subsidies and its impact on sustainable development in the supply chain consisting of manufacturers, retailers and third-party collectors from economic, environmental and social perspectives [
11]. Mirzaee H et al. considered a closed-loop supply chain that includes risk-averse manufacturers and risk-averse retailers under the supervision of carbon tax. Under the mean-variance framework, two manufacturer-led decentralized systems are modeled and compared to reveal whether a risk-averse manufacturer should invest in energy-saving equipment [
12]. Shen et al. argue that companies urgently need to figure out how to achieve carbon neutrality through government rewards and penalties. Therefore, a centralized and two-stage Stackelberg game model of a closed-loop supply chain (CLSC) of one manufacturer and one retailer was constructed, and the cost-sharing contract, revenue-sharing contract, and cost-revenue-sharing contract are used to coordinate it, taking into account the fairness concerns of downstream enterprises while pursuing carbon neutrality, ensuring the overall benefits of the supply chain and considering the impact of government subsidies and rewards and punishments on the carbon neutrality of the supply chain [
13].
In terms of supply chain network design, we refer to the following literature: M. Masanta A designed a multi-loop closed-loop supply chain that considered retail pricing, green innovation and marketing efforts to be linear to end-user demand, and validated an S-shaped learning curve that is believed to mitigate inaccuracies in the inspection process [
14]. Seyyed Jalaladdin Hosseini Dehshiri et al. introduced a novel Mixed Robust Stochastic, Possibilistic, and Flexible Programming approach based on credibility theory. The different attitudes of decision makers are addressed by a more flexible measurement of the optimistic and pessimistic parameters using the criterion of credibility [
15]. Seyyed Jalaladdin Hosseini Dehshiri et al. focuses on the Me measure and proposed a novel, flexible, probabilistic and stochastic programming based on robust optimization. A convex mixture of the pessimistic-optimistic views based on the Me measure was implemented. The least level of satisfaction with soft constraints is determined optimally that the need for repetitive reviews by decision makers is obviated in the proposed model. Additionally, the model controls violations of soft constraints as well as stochastic deviations, probabilistic deviations, unfulfilled demand and capacity [
16]. Chang Liu et al. considered the closed-loop supply chain network design in uncertain environments and combined flexible facility capacity and government subsidy factors. Considering the minimization of economic costs and the minimization of carbon emissions, a multi-objective multi-period multi-product mixed integer linear programming model with fixed and flexible facility capacities was constructed, respectively [
17]. Sheikh et al. used the Kano model to classify product characteristics into different categories. In their proposed mathematical model, customer demand is a function of product sales price, transportation pollution is minimized and cooperative game theory method is used to solve the mathematical model. One of the advantages of this mathematical model is that the “demand” in the design of supply chain network based on Kano model can be determined according to the satisfaction of customers. The price of the product can be determined according to the satisfaction of the customer and the manufacturer [
18]. Amir M et al. proposed a dual-channel, multi-product for the first time, multi-period, multi-echelon closed-loop SCND under uncertainty for the tire industry [
19]. Javid Moosavi et al. presents a set of up-to-date bibliometric, network, and thematic analyses to identify the influential contributors, main research streams and disruption management strategies related to the supply chain performance under COVID-19 conditions [
20].
Research on closed-loop supply chain include recycling channel research, coordination strategy research, supply chain model design considering different factors, etc. However, there is little research on the backward chain member enterprises of closed-loop supply chains considering technological innovation input. Therefore, this paper aims to fill this gap.
2.2. Research on Pricing Decisions of Closed Loop Supply Chains
Jing Yin et al. investigated the problem of maximizing economic benefits for enterprises while expanding research on pricing decision of closed loop supply chain leasing and recycling and proposed a lease-oriented closed-loop supply chain model [
21]. Liu Zhi et al. developed a model in which manufacturers sell new products through retail channels and directly through their online channels. If manufacturers decide to produce remanufactured products, they can also sell these products through their online direct channels. The dual competition of new products and remanufactured products within and between competitive channels affects the pricing decisions of manufacturers and retailers [
22]. Gang Xu et al. injected the carbon tax policy into a two-stage supply chain composed of one manufacturer and two retailers. According to the relationship between retailers (competition or cooperation) and the three power structures between two retailers and manufacturers (manufacturer Stackelberg, retailer Stackelberg and vertical Nash), six game models are established. Then, the inverse induction method is used to get the best pricing decision for each model and obtain the best profit for the supply chain members [
23]. Manyi Tan et al. studied the closed-loop supply chain decision-making problem under different sales cooperation models between electronic product manufacturers and e-commerce platforms, taking into account the role of waste electronic equipment and the environmental impact [
24]. Minh Tam Tran et al. have developed a classic newsstand model, in which retailers buy goods from suppliers and distribute them through online and offline segments. In the newsstand mode, we seek the optimal price of products in two channels, with a single cycle, random demand based on price and orders based on cycle service level, in order to maximize the profits of retailers [
25]. Jiafu Su et al. proposed three competition modes with patent protection, competition mode without patent protection and cooperation mode composed of manufacturers and remanufacturers to study the optimal cooperation strategy between manufacturers and remanufacturers [
26]. Xuan Zhao et al. studied the optimal pricing strategy for EV batteries from three different recycling channels in China, given government subsidies [
27]. Ziyuan Zhang et al. proposed a multi-level differential game model involving manufacturers, retailers and the government, designed coordination strategies under three different power structures and provided the conditions for meeting coordination parameters, which further improved the overall performance of the supply chain [
28]. Lang Liu et al. explored the influence of consumer purchase regret on the dynamic closed-loop supply chain under discrete time conditions. Based on the heterogeneity of new products and remanufactured products, a manufacturer-led, retailer-led and recycler-led closed-loop supply chain model is constructed. The findings further suggest that in order to mitigate the negative effects of purchase regret, manufacturers and merchants should fully grasp the market and improve product quality to make product pricing plans more equitable [
29]. Gong et al. applied a Stackelberg game to explore the impact of combined free-riding and reverse revenue-sharing ratios on pricing strategies and offline retailer service decisions [
30]. Mohammad Asghari et al. developed an operational and tactical plan for promoting advertising programs considering different elasticity effects [
31].
At present, there are many studies on the pricing decisions of supply chain, but most of them are the analysis of the pricing decision of forward supply chains. The pricing decisions of a closed-loop supply chain are relatively complex, and the most profitable solution is also affected by more factors. In this paper, the closed-loop supply chain considers that the cascade utilization enterprises are responsible for not only recycling waste power batteries, but also carrying out low-carbon technology innovation and selling second-use low energy storage batteries, so as to open up research ways for the reverse low-carbon innovation investment and pricing decisions of the new closed-loop supply chain.
2.3. Research on Supply Chain Considering Technological Innovation
Aiming at technological uncertainty in closed-loop supply chain, Youmei Qiu studied the competition and cooperation strategies of enterprises’ patent technology innovation and analyzed the optimization strategies of patent technology innovation under technological uncertainty [
32]. Jianling Jiao et al. discussed the impact of carbon trading schemes and technological progress on battery closed-loop supply chain models, and came to the conclusion that combining mature technology and moderately competitive cycle markets is the best way to optimize power battery decision-making [
33]. Zhiming Wei et al. deduced optimal strategies for green technology investment, stochastic demand decisions for production volumes and order volumes for an emission-dependent supply chain consisting of a manufacturer and a retailer, and coordinated the supply chain with pre-order discount contracts and option contracts. An innovative option contract based on payment options is also designed and the impact of cash flow, inventory risk allocation and carbon tax is discussed [
34]. H Saleem et al. studied the application of big data in predicting technological innovation, supply chain and SME performance and whether technological innovation plays a mediating role between big data and firm performance. They also discussed the moderating effect of information sharing on the association between big data and technological innovation [
35]. Yijun Xing et al. systematically reviewed the knowledge system of product service innovation and green supply chain management from the perspective of product life and life cycle. This study provides important insights into the contribution of product and service innovation to environmental sustainability and outlines future research directions [
36]. Yuzhou Wu et al. explored the incentive effect of government subsidies on R&D activities of listed companies of new energy vehicles from the perspective of the industry chain and suggested that the government consider the different characteristics of upstream and midstream, and the threshold effect of downstream enterprises when subsidizing net industries [
37]. R Beigizadeh, A Delgoshaii et al. proposed a three-stage framework to predict the level of technological innovation in green supply chains. The study predicted the level of technological innovation from three aspects: green investment, environmental design, and customer cooperation, and determined the weights of influencing factors [
38]. Zehua Xiang et al. explored the impact of technological innovation, big data marketing and overconfidence on supply chain member decision-making. Based on differential game theory, we propose a two-stage remanufacturing closed-supply chain dynamic model consisting of manufacturer, IRP and supplier and compare the best decisions of each member in three cases [
39]. Xiaoxue Zheng et al. adopted a new dual-format game model to develop an investment reward mechanism for ecological efficiency innovation in the supply chain and proposed profit maximization strategies and investment cooperation strategies [
40]. Hongmei Shan et al. studied the relationship between supply chain partnership and innovation performance from the perspective of knowledge management. Considering the mediating effect of knowledge sharing and the moderating effect of knowledge distance, a multi-factor conceptual model of this relationship is proposed [
41]. Marco Simonetto et al. concentrate its attention on the analysis of the benefits that enabling Industry 4.0 technologies can provide in terms of mitigating the risks in CLSCs, with a specific focus on the operational risks [
42].
Most of the literature on technological innovation of power batteries focuses on technological innovation of battery performance. There is relatively little research on the supply chain aspects that consider technological innovation. However, no matter who implements technological innovation among the nodal enterprises in the supply chain, it will be accompanied by the corresponding cost input, which will affect its own income. Therefore, it is necessary to consider technological innovation in the supply chain model and study its impact on nodal enterprises and the overall profit of the supply chain. At present, there are a few studies on the situation of considering technological innovation in forward supply chain, and it is rare to consider reverse technological innovation in closed-loop supply chain, which is why this study is necessary.
2.4. Research on Low-Carbon Supply Chains
From “environmental protection” to “low-carbon”, when the constantly advanced green concept is integrated into the diverse and changeable daily life of consumers, it reflects consumers’ constantly changing needs. The industry needs to more keenly capture consumer trends and provide solutions while creating a better life for users. In September 2020, China officially announced that it would increase its nationally determined contribution to climate change, adopt more powerful policies and measures, strive to peak carbon dioxide emissions by 2030 and strive to achieve carbon neutrality by 2060. The survey of Chinese young people’s low-carbon willingness is shown in
Figure 3.
The proportion of people who can correctly recognize low-carbon in each region of China is shown in
Figure 4.
On average, two out of three young Chinese people believe that low-carbon is strongly related to their personal lives, and 77% of young Chinese people believe that lowering carbon emissions is strongly related to their personal lives. At present, the low-carbon behavior of young people is relatively basic, mainly focusing on transportation and home life, and the low-carbon consumption of new energy products, environmental protection materials and commodities is on the rise. The proportion of low-carbon lifestyles is shown in
Figure 5 (Data source: WIETOP: Quantitative research on low-carbon people
https://wietop.com/ (accessed on 26 October 2023)).
The above content is about the investigation of people’s cognition of low-carbon willingness, and the official data are used to explain people’s cognition of low-carbon and the implementation of low-carbon behavior. This also proves that this paper considers the market demand and feasibility of enterprises to implement low-carbon innovation.
In recent years, relevant literature includes the work of Su Chu et al., which explored how to arrange the generation and pricing of supply chain members in the context of consumer green preferences and different government subsidies. A green supply chain pricing decision-making model with different forms of subsidies under different power structures was constructed. Through reverse induction and sensitivity analysis, the optimal strategies for green supply chains under different modes were analyzed, and how the government subsidy coefficient affects the optimal decision-making of green supply chains was explored [
43]. Chen Zhu et al. proposed a horizontal low-carbon supply chain, using game theory and chaos theory to explore dynamic production and emission reduction strategies under the scenario of whether manufacturers adopt green technologies or not [
44]. Hao Zou et al. considered several low-carbon technology investment manufacturers and several risk-averse retailers, incorporated the characteristics of carbon quota policy and risk aversion into the decision-making process of LSC network, and studied the effects of carbon trading price, risk avoidance coefficient and inventory capacity restriction on product flow, emission reduction rate, pricing and profit of low-emission networks [
45]. Liangjie Xia et al. incorporated consumers’ low-carbon awareness and social preferences, including relationship and status preferences, into a game of emission reduction and promotion involving a manufacturer and a retailer in the long run, and also examined the impact of some key parameters on the decision-making and performance of channel members [
46]. Jianhu Cai et al., based on the differential game theory, discussed the optimal pricing and carbon emission reduction decision-making of members from a long-term perspective, considering the influence of consumers’ low-carbon preference, cap-and-trade regulation and power structure, and pointed out that decision-making priority is not a necessary condition for Security Council members to maximize profits [
47]. Li Zhiqiang et al. studied the impact of fixed green technology investment costs and emission reduction on two-level supply chain green decision-making under the cap and trade mechanism. They developed and analyzed three Stackelberg game models, which showed that the government can use FC subsidies for developed and high emission industries to control total emissions, and adopt ER subsidies for emerging or developing industries to promote their development [
48]. Botang Li et al. proposed a genetic algorithm based on variant priority encoding. The objective of the proposed optimization model is to minimize the total cost of the network and the sum of carbon rewards and penalties when selecting facility locations and transportation routes between network nodes [
49].
The concept and technology of green, low-carbon and environmental protection are integrated into the supply chain, and a low-carbon supply chain is formed. Every link of the closed-loop supply chain can try to consider the implementation of low-carbon measures. This paper only considers the implementation of low-carbon innovation in the recycling link, and will gradually consider the supply chain operation of other links or all links to implement carpet innovation in the follow-up study.
The above content summarizes the current research status on closed-loop supply chains, supply chains considering technological innovation, low-carbon supply chains, and pricing decision-making issues in supply chains. With the continuous popularization of new energy vehicles, the demand and recycling of power batteries have taken on environmental and social importance. This article designs a new closed-loop supply chain for power batteries, and conducts low-carbon innovation while implementing recycling in the reverse supply chain. It studies the pricing problem under decentralized and centralized decision-making. Scholars now have some research in this area, which to some extent opens up new ideas for the study of closed-loop supply chains for power batteries.
3. Model Assumptions and Parameter Descriptions
3.1. Research Method
The new closed-loop supply chain model in this paper is a non-cooperative game with leaders and followers. In the case of maximizing their own interests at the same time, they change their own decisions by observing the decisions of the other party so that their own interests are not damaged. Therefore, when we conduct numerical simulation analysis, we cannot use the cooperative game model, but use the non-cooperative game model. There are many kinds of non-cooperative games, such as negative sum games, zero-sum games, Stackelberg games, etc. Among them, the Stackelberg game is a dynamic game, which focuses more on the strategy selection problem of master-slave game when the status of participants is inconsistent. Therefore, this paper uses the Stackelberg game to carry out research.
The supply chain model of this paper adopts a Stackelberg model. It is a production leadership model where there are differences in the order of action among participants. Output is determined in the following order: the leader determines an output, then the follower can observe this output, and then determine their own output based on the leader’s output [
50]. It is important to note that the leader determines his own output with full knowledge of how his followers will act, which means that the leader can know the reaction function of his followers. Therefore, it is natural for leaders to anticipate the impact of the output they decide on their followers. It is with this effect in mind that the output determined by the leader will be a profit-maximizing output constrained by the follower’s response function [
51]. Stackelberg game models can better describe the leader-follower relationship in actual decision making, and has strong explanatory power for analyzing market competition and industrial structure [
52]. This model can take into account the time series and causality between participants, which is more in line with the actual situation and more suitable for the research content of this paper.
Here is an example of the game: in a Stackelberg game model consisting of firm I (leading firm) and firm II (following firm), the firm’s decision is the output strategy. Firm I first chooses output , firm II observes and then chooses its own output . Since firm II observes before choosing , it is able to decide based on .
Firm I makes the first decision. Let be the output range of firm I and let be the output range of firm II. is a function of mapping , denoted . When the decision of firm I is , the equilibrium outcome is . The revenue (payment) function is: .
Assume that the inverse product demand function is:
. Both firms have the same constant unit cost
. Then the revenue (payment) function is:
The equilibrium solution of this Stackelberg game is calculated by backward induction, and the optimal strategy selection of firm II is solved first. Substituting
into the profit function of firm II maximizes its profit as:
From the optimized first-order condition, can be obtained.
Because firm I predicts that firm II will take
in accordance with
, then the profit maximization of firm I in the first period is:
The first-order optimal condition is obtained as follows:
Substituting
for
, we obtain:
and are the equilibrium solutions of the Stackelberg game.
In Stackelberg’s model, participants do not have any form of communication and negotiation, and they can only make decisions according to their own interests, so it is a non-cooperative game. Non-cooperative game equilibrium, Nash equilibrium, is another theory used in this paper. In the course of a game, regardless of the strategy choice of the other party, one party will choose a certain strategy, then the strategy is called the dominant strategy. A combination is defined as a Nash equilibrium if the strategy chosen by any player is the best given the strategies of all other players.
is often used to denote a game. If has players, the set of all alternative strategies for each player is called the “strategy space” and is denoted by means. denotes the strategy of the player, where j can take a finite number of values (finite strategy game) or an infinite number (infinite strategy game). The payoff of player i is then denoted by which is a multivariate function of the strategies of each player. The game with players can be written as .
Definition 1. In a game , if the strategy of any player i in a strategy combination composed of one strategy of each player is the best strategy of the combination of the strategies of the remaining players, then is said to be a Nash equilibrium of .
This study mainly uses these two basic theories to establish a closed-loop supply chain model and performs Nash equilibrium solution on it. The optimal decision of the supply chain and each nodal enterprise is obtained from the perspectives of decentralized decision making and centralized decision making, and the impact of decision variables on the overall supply chain. The income of member enterprises and the equilibrium results are analyzed.
3.2. Model Assumptions and Parameter Descriptions
Backward induction is a method of solving dynamic game equilibria, in which the actions of the players in the game are in order and the players acting later are able to observe the previous actions [
53]. The basic idea is to start from the last stage in the dynamic game, all players choose actions according to the principle of utility maximization, and then gradually backward to the previous stage until the initial stage of the game participants’ action choice [
54]. This method has high logical rigor. The essence of this approach is “forward thinking, backward reasoning”, that is, first carefully consider all the subsequent reactions that your decision may cause, and the subsequent reactions of subsequent reactions until the end of the game. Then, start with the last step and work backwards to figure out your best choice at each step [
55]. In this paper, we use this method to find the optimal strategy of each participant and solve the Nash equilibrium.
The design idea of this study is shown in
Figure 6.
This article constructs a Stackelberg game model with power battery manufacturers as the main players and cascade utilization companies as followers. Exploring the pricing decisions of a closed-loop power battery supply chain consisting of a battery manufacturer and a tier user when considering low-carbon inputs from tier users. Cascade utilization has become the main way for the rational use of waste power battery energy. Against the backdrop of carbon neutrality, promoting the full process low-carbon development of the new energy vehicle industry is becoming a focus of the industry. In carbon reduction measures, the large-scale use of recycled materials is an important means to achieve low-carbonization of batteries. Therefore, in the process of recycling and reuse, cascade utilization enterprises will consider low-carbonization investment, put waste batteries into the market after low-carbonization treatment and split the scrapped batteries before transferring them to battery manufacturers. The model is shown as
Figure 7.
Regarding the closed-loop supply chain of power batteries, the relevant symbol parameters to be used are explained in
Table 1.
To ensure the effectiveness of the model, the following assumptions are made:
- (1)
Market demand function. Most of the market demand in previous supply chain models is a linear function of retail price [
56]. We consider here that the increase of consumers’ low-carbon awareness will increase the amount of recycling, so the forward chain and reverse chain in the closed-loop supply chain adopt different demand functions and recycling functions respectively. Considering consumers’ preference for low-carbon recycling, they often choose to recycle their waste power batteries from companies with higher low-carbon treatment technologies and higher recycling prices. When the sales price of power batteries remains unchanged, the higher the low-carbon investment level of power battery closed-loop supply chain node enterprises, the greater the demand for power batteries from consumers. Therefore, using
represents the sensitivity coefficient of consumers to the low-carbon investment level of cascaded utilization enterprises, which is their low-carbon preference. Use
to represent the increase in market demand brought about by the increase in low-carbon investment by enterprises in the cascade utilization. To ensure the economic significance of the relevant expressions in the article, it is assumed that market demand is a linear function of the low-carbon investment level
of the enterprise in the reverse supply chain and the retail price
in the forward supply chain. The order quantity of new power batteries is equal to the actual market demand, and the demand function of the power battery market is as follows:
- (2)
The cost of low-carbon utilization. Echelon utilization companies are not only responsible for battery recycling but also for implementing low-carbon innovation. This is also an innovative approach of this paper. The more low-carbon utilization enterprises invest in the closed-loop supply chain of power batteries, the higher the cost [
57]. With the increase in investment in low-carbon utilization and the enhancement of consumers’ low-carbon awareness, the increasing market demand for power batteries has a greater impact on consumers. The cost of low-carbon reuse for a tiered utilization enterprise is defined as
. Where
is the coefficient of the input cost for low-carbon reuse of power batteries. In order for the input level of low-carbon utilization to have a certain boundary and the cost of low-carbon reuse to be economically significant and not lose generality, it is required that
should be sufficiently large.
- (3)
Assuming a single power battery market cycle. Both battery manufacturers and tier utilization enterprises only operate a single type of power battery, without considering the quality issues of power batteries [
58]. Cascade utilization enterprises recycle waste power batteries from consumers and carry out secondary sales after low-carbon reuse treatment to obtain additional income
. There are no other costs for producers and tier utilization enterprises except for the production costs of producers and the secondary sales costs of tier utilization enterprises. Assuming that member companies in the closed-loop supply chain of low-carbon power batteries can make low-carbon investments through their own corporate behavior. And conditional
guarantees the feasibility, generality and concavity of the relevant expressions.
4. Pricing and Low-Carbon Investment Decision Model for Closed-Loop Supply Chain of Power Batteries
The method of backward induction is used to solve the Nash equilibrium, starting from the last stage or the last sub-game of the dynamic game, and gradually working backwards to solve the dynamic game equilibrium. The basic idea is to start from the last stage in the dynamic game, all players choose actions according to the principle of utility maximization, and then gradually backward to the previous stage, until the initial stage of the game participants’ action choice. The essence of backward induction is “forward looking, backward reasoning”, that is, first carefully consider all the subsequent reactions that may be caused by their decisions, and the subsequent reactions of subsequent reactions until the end of the game; Then start with the last step and work backwards to figure out your best choice at each step. In the following, a new model of closed-loop supply chain is presented, and the Nash equilibrium solution of this model is solved by the inverse method.
In the closed-loop supply chain of power batteries led by manufacturers and followed by cascade utilization enterprises, there is a Stackelberg game between manufacturers and cascade utilization enterprises. At the same time, cascade utilization enterprises are environmentally conscious enterprises that invest in low-carbon reuse of recycled waste power batteries. Based on the above assumptions, the profit function of manufacturers, tier utilization enterprises, and power battery closed-loop supply chain is:
The decision-making process of the low-carbon closed-loop supply chain for power batteries proposed in this article that as the leading supplier in the supply chain, power battery manufacturers determine the retail price of power batteries . The manufacturer sells new power batteries to consumers, and the secondary utilization enterprise is responsible for recycling waste batteries and conducting low-carbon treatment before reselling them. Cascade utilization enterprises determine the level of low-carbon reuse investment and sell low energy storage power batteries to consumers at a price of . Assuming that all the reused power batteries are recycled and the power battery manufacturer extracts all of them for raw materials and re-inputs them into the manufacturing of new power batteries.
The Stackelberg game model composed of decisions among supply chain members can be used to solve the values of decision variables using reverse induction. Namely, power battery manufacturers will consider utilizing the response function of the enterprise in a hierarchical manner and then choose their own strategies. Easy to verify:
, We can see that
is a concave function of
. That is, there exists
such that
reaches its maximum. Let
to obtain:
The Hessian matrix of
with respect to
can be obtained by introducing Equation (6) into Equation (2):
In order to ensure that gets the maximum value at , Hessian matrix should be negative definite. Since and and condition know , then is a strictly concave function with respect to and there are theorems 1 and 2:
Theorem 1. The equilibrium solutions of the optimal retail price and the optimal scrap battery transfer price of the power battery closed-loop supply chain for echelon utilization enterprises considering low-carbon recycling are as follows: Certification: simultaneous set of first derivative equations of with respect to . That is: and . The optimal retail price of the manufacturer and the optimal recycling price of raw materials repurchased by the manufacturer from the echelon utilization enterprise can be obtained.
Theorem 2. The equilibrium solution of the echelon utilization of the closed-loop supply chain of power batteries is as follows: Certification: The and of Equations (7) and (8) are introduced into Equation (6), so as to obtain the optimal recycling price of echelon utilization enterprises and the optimal investment level of low-carbon recycling of enterprises.
The obtained optimal solution is brought into Equations (3) and (4) to obtain the third theorem.
Theorem 3. The optimal profits of manufacturers, echelon utilization enterprises and the whole supply chain in the closed-loop supply chain of power batteries are respectively: 5. Comparative Analysis of Equilibrium Results of Power Battery Closed Loop Supply Chain
Consumers often pay attention to the retail price of a product, which is a large factor affecting sales volume and purchase intensity. With the strengthening of consumers’ low-carbon awareness, this paper discusses how consumers’ sensitivity to the low-carbonization level of power batteries affects the decision variables of the supply chain and the changes in profit. A few scholars have studied the sensitivity of consumers to technological innovation in the forward supply chain, but have not considered the relationship between the implementation of low-carbon innovation in the reverse supply chain and consumers. Therefore, this must also become a new research direction.
In the closed-loop supply chain of power batteries, when echelon users carry out low-carbon reproduction, the sensitivity of consumers to low-carbon reproduction of waste power batteries, the investment degree of echelon Utilization Enterprises in low-carbon production, and the impact of the recovery rate of power batteries on the sales price of power batteries, the repurchase price of power battery manufacturers, and the cost of low-carbon innovation of enterprises are analyzed. According to the above equilibrium results, there are conditions , , and .
Proposition 1. The impact of consumers’ sensitivity coefficient to the low-carbon level of power battery recycling on the sales price of power batteries, the transfer price of manufacturers’ repurchases of waste power raw materials, the low-carbon innovation cost of echelon utilization enterprises, and the profits of manufacturers and echelon utilization enterprises are as follows: , , , , .
Proof. Find the first derivative of versus in proposition 1 to get: . Because of and denominator molecules and can be obtained. finds the first derivative of to obtain: . Because of molecules and denominator , can be obtained. finds the first derivative of to obtain: . Because , all the molecular terms are positive, and can be obtained, so holds. Other proofs are similar and will not be repeated. □
Proposition 1 indicates that as consumers’ low-carbon sensitivity increases, manufacturers’ sales prices, transfer prices after power battery recycling, low-carbon production input levels, member companies of the power battery closed-loop supply chain, and overall profits will all increase. The results indicate that increasing the level of low-carbon investment by cascade utilization enterprises in the reverse supply chain can promote the increase in the recycling volume of power batteries, thereby increasing their profits. Therefore, cascade utilization enterprises have sufficient motivation to increase the level of low-carbon investment. For manufacturers, the increasing possibility of reusing power batteries has led to an increase in the amount of waste power battery raw materials transferred to them, and the number of new batteries produced from waste raw materials has also increased. This can save investment in new raw materials and save costs. Manufacturers will encourage cascade utilization enterprises to engage in low-carbon investment by increasing the transfer price of power batteries.
Another aspect which is rarely covered by previous studies, is the consequences of the low-carbon innovation input of the reverse supply chain on decision variables and the profit trend of the supply chain.
Proposition 2. The impact of the recycling rate of power batteries on the sales price of power batteries, the transfer price of manufacturers’ repurchases of waste power raw materials, the low-carbon innovation cost of cascade utilization enterprises, and the profits of manufacturers and cascade utilization enterprises is as follows: , , , . There is a turning point: , where there is a conclusion when , and when .
Proof. Taking the first derivative of over in Proposition 2 can obtain: . Because of , the numerator , and because of the denominator , holds. Other proofs are similar and will not be repeated. □
Proposition 2 indicates that as the recycling rate increases, manufacturers’ sales prices, transfer prices after power battery recycling, low-carbon production input levels, member companies of the power battery closed-loop supply chain, and overall profits will all decrease. The results indicate that for manufacturers, the increase in the amount of power battery recycling has led to an increase in the cost of power battery transfer.
Manufacturers will ensure their own interests by reducing transfer costs. Under the condition that the total market demand remains unchanged, the number of new batteries produced from waste materials increases, and the reduction of production costs leads to a decrease in sales prices. However, the overall profit of manufacturers increases accordingly, indicating that an increase in recycling rate may lower sales and transfer prices, but overall it is beneficial for manufacturers to increase their profits. For cascade utilization enterprises, the increase in the recycling rate of waste power batteries can promote the increase in the recycling amount of power batteries, but it will also increase their recycling costs and the cost of low-carbon investment. Therefore, this has a negative effect on improving the low-carbon investment level of cascade utilization enterprises.
The profit of a cascade utilization enterprise increases first and then decreases as the recovery rate increases, indicating that there is a turning point in the impact of the recovery rate on the enterprise’s profit. Let to find . When the recovery rate value is controlled below the inflection point, the profits of the cascaded utilization enterprise will increase with the increase of the recovery rate, while above the inflection point, the profits of the cascaded utilization enterprise will decrease with the increase of the recovery rate. In the early stage of low-carbon investment, the demand for cost and recovery funds is high for enterprises that utilize cascades. To ensure profit growth, the recovery rate should not increase too fast, otherwise it will affect profits.
Proposition 3. The impact of low-carbon investment in power battery recycling by cascade utilization enterprises on the sales price of power batteries, the transfer price of manufacturers’ repurchases of waste power raw materials, the low-carbon innovation cost of cascade utilization enterprises, and the profits of manufacturers and cascade utilization enterprises are as follows: , , , , .
Proposition 3 indicates that as the cost coefficient of low-carbon production increases for cascade utilization enterprises, the sales price of manufacturers, the transfer price after power battery recycling, the level of low-carbon production input, member enterprises of the power battery closed-loop supply chain, and overall profits will all decrease. The results indicate that the cascade utilization of enterprises in the reverse supply chain increases the cost coefficient of low-carbon production, which means increasing the investment in low-carbon production. The investment cost of low-carbon production is inversely proportional to the level of investment, which means that the higher the level, the lower the cost that needs to be invested. For cascade utilization enterprises, the cost investment increases but the investment level is not high. When transferring waste raw materials to manufacturers, the effective utilization of extracted raw materials is not high, which causes manufacturers to reduce the expenditure on transfer prices and overall profits will decrease. For manufacturers, the low-carbon investment of enterprises in cascade utilization will have a negative impact on their decision-making. The lower transfer cost leads to a decrease in the selling price of the manufacturer, which will increase the purchasing intention of a certain number of market consumers, but the total profit of the manufacturer will decrease.
Proposition 4. The profit of a centralized decision-making supply chain is always higher than the profit of a hierarchical utilization enterprise and producer under decentralized decision-making, that is, and is established.
Proof. By subtracting the total profit of a centralized decision-making supply chain from the profits of a decentralized decision-making enterprise, we can obtain: . Among them, , , , and hold true, so holds true, that is to say, holds true under known conditions. □
By subtracting the total profit of the centralized decision-making supply chain from the profit of producers under decentralized decision-making, we can obtain:
. Due to , is established. Due to the fact that and , and the total market demand is much greater than and , is established. From this, it can be seen that the numerator and denominator are valid. Therefore, holds, that is, holds under known conditions.
Proposition 4 indicates that compared to decentralized decision-making, the total profit of the supply chain under centralized decision-making is higher than that obtained by node enterprises under decentralized decision-making. This indicates that adopting a centralized decision-making approach is superior to a decentralized decision-making approach in the closed-loop supply chain. The decision of retail prices, transfer prices, and low-carbon technology levels jointly by producers and tier utilization enterprises is more conducive to the overall profitability of the supply chain than making separate decisions.
6. Numerical Simulation Analysis
In this paper, the method of numerical simulation analysis is used. Using mathematical programming software combined with numerical calculation and image display methods, the decision variables and the profit trend of the supply chain and member nodes are presented in the form of curves, which is clearer and more intuitive than the data. This article constructs a closed-loop supply chain model for power batteries invested in low-carbon production by cascaded utilization enterprises, compares and analyzes the equilibrium results of the model, and verifies the above conclusions through numerical analysis and sensitivity analysis.
6.1. Parameter Selection Description
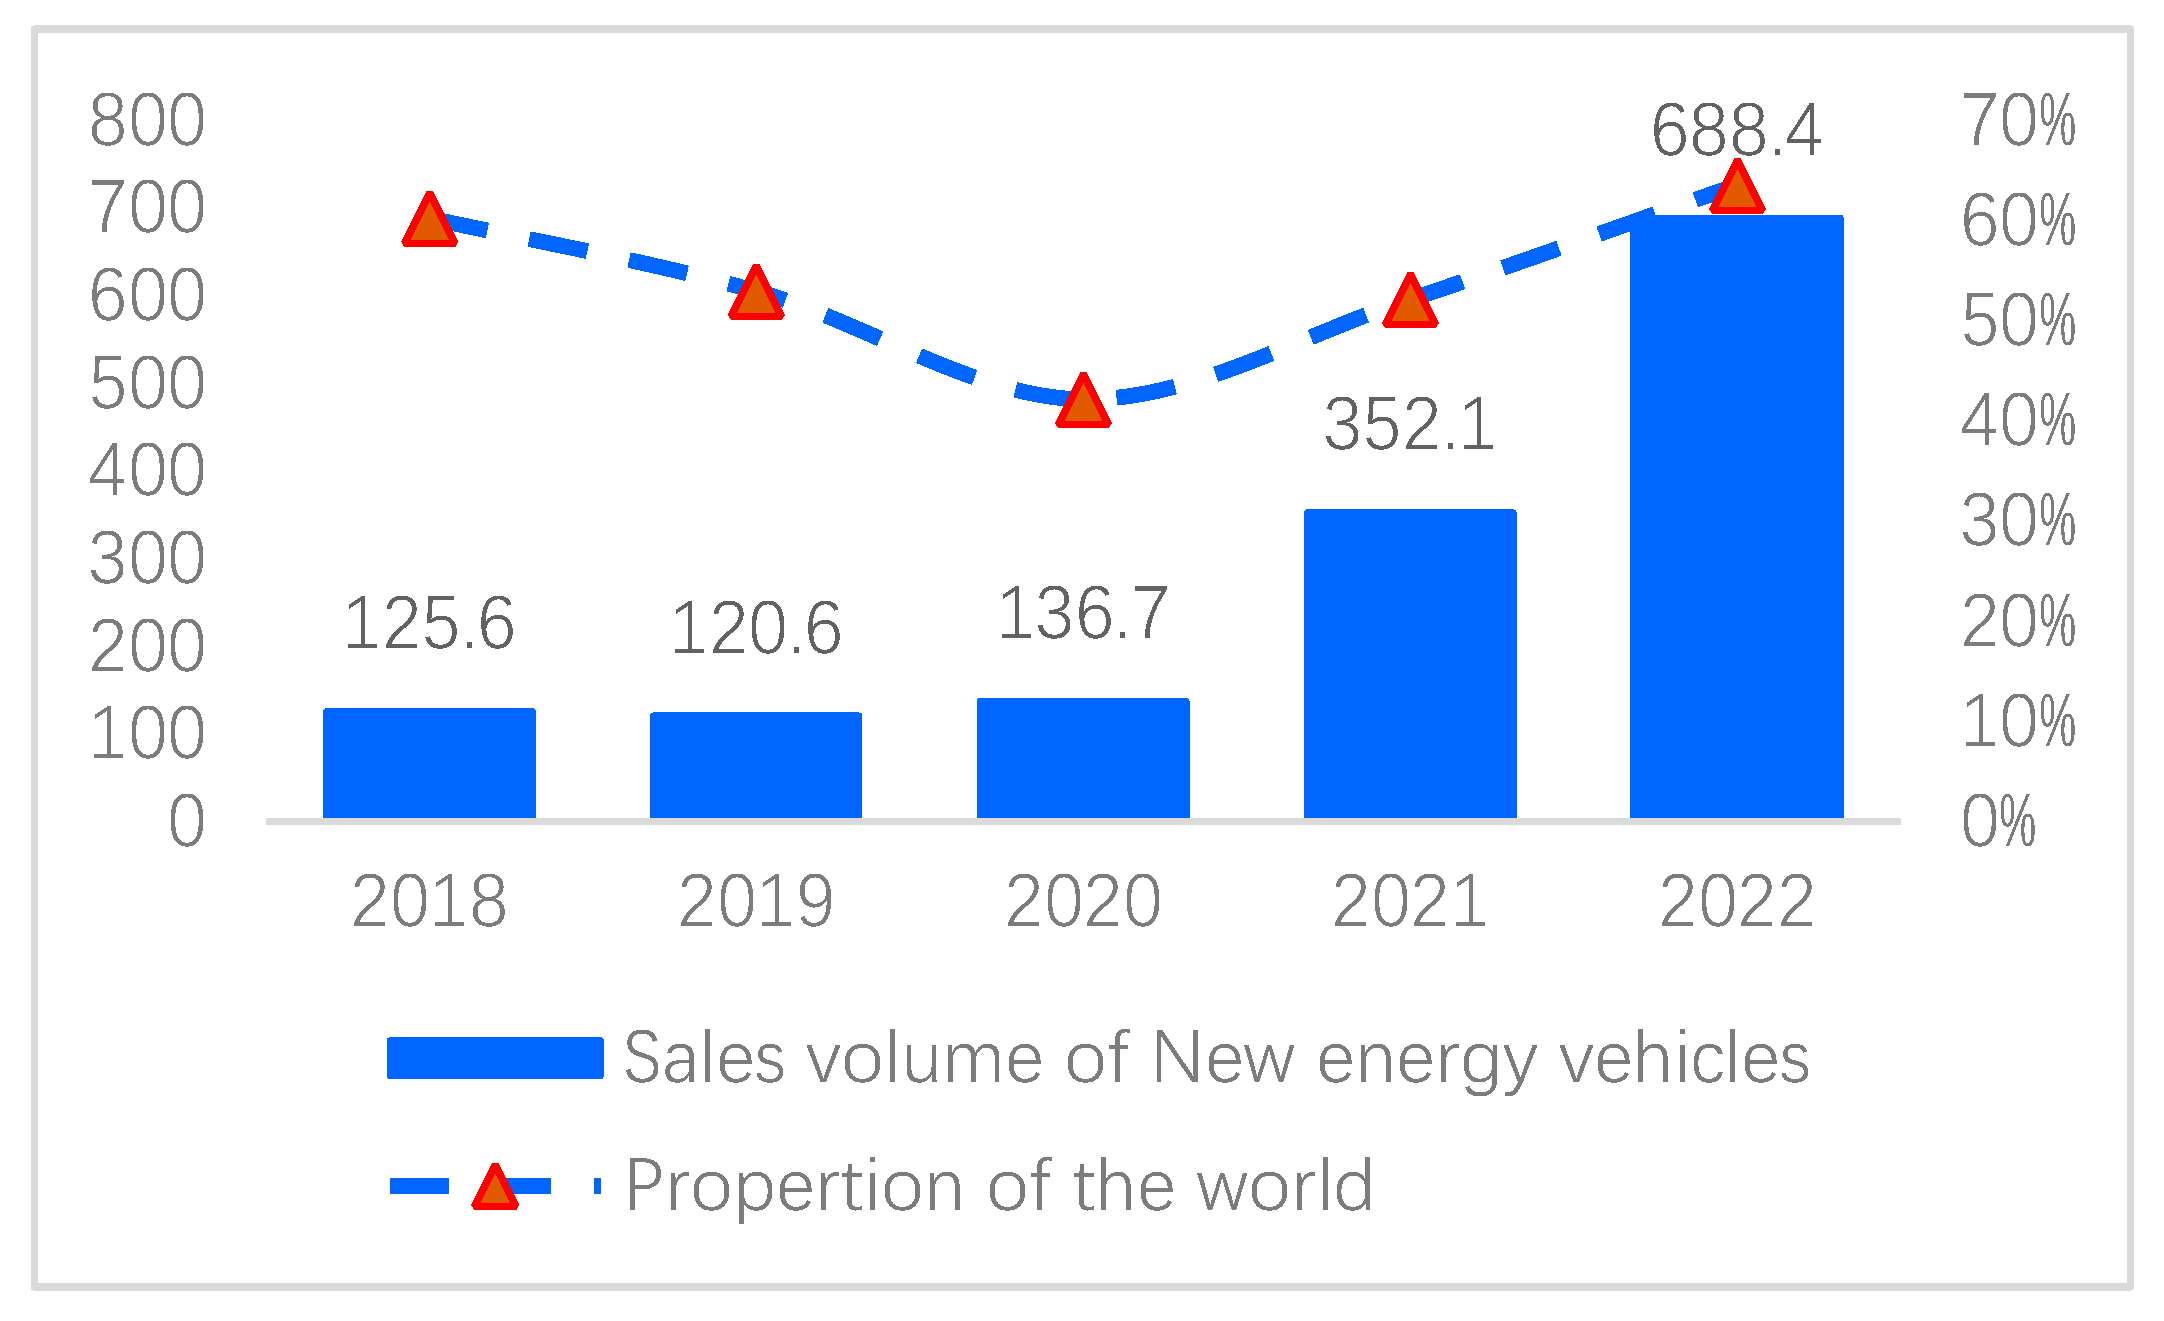
In 2022, the global sales volume of new energy vehicles reached 10.824 million units, representing a year-on-year increase of 61.6%, and the sales volume of new energy vehicles in China reached 6.884 million units, accounting for 63.6% of the global total. The outbreak of COVID-19 from 2019 to 2022 affected the global sales of new energy vehicles. In 2022, China’s new energy vehicle sales accounted for 63.6% of the world, which was similar to the 60.3% of the world in 2018 before the epidemic. The sales volume and global proportion of new energy vehicles in China from 2018 to 2022 are shown in
Figure 8.
The epidemic in the past three years has affected the data after 2019 by many factors, so this paper selects the data in 2018 for example analysis. The total sales volume of electric vehicles in China in 2018 was 1.256 million units, and the initial market size can be set as .
This article is based on the data of the “2170” lithium battery assembled in the Tesla Model 3 power car. The average production cost of the battery is 155 US dollars/kWh, and the power battery capacity within the 375 km range of the car is 50 kWh. Therefore, the unit cost of the new product is approximately 520.8.
Previous studies have shown that the unit production cost of remanufacturing is usually 10% to 75% lower than that of new products. To represent the cost savings of remanufacturing, parameter is set. Through calculation, the cost savings can be selected as: .
Previous studies have shown that the energy consumption required for remanufacturing is 20% to 60% lower than that required for new product manufacturing.
Other parameters refer to the values set by the following parameters that meet the optimal equilibrium solution of the model, as shown in
Table 2.
6.2. Analysis of the Influence of Sensitivity Coefficient of Low-Carbonization Level on the Optimal Decision
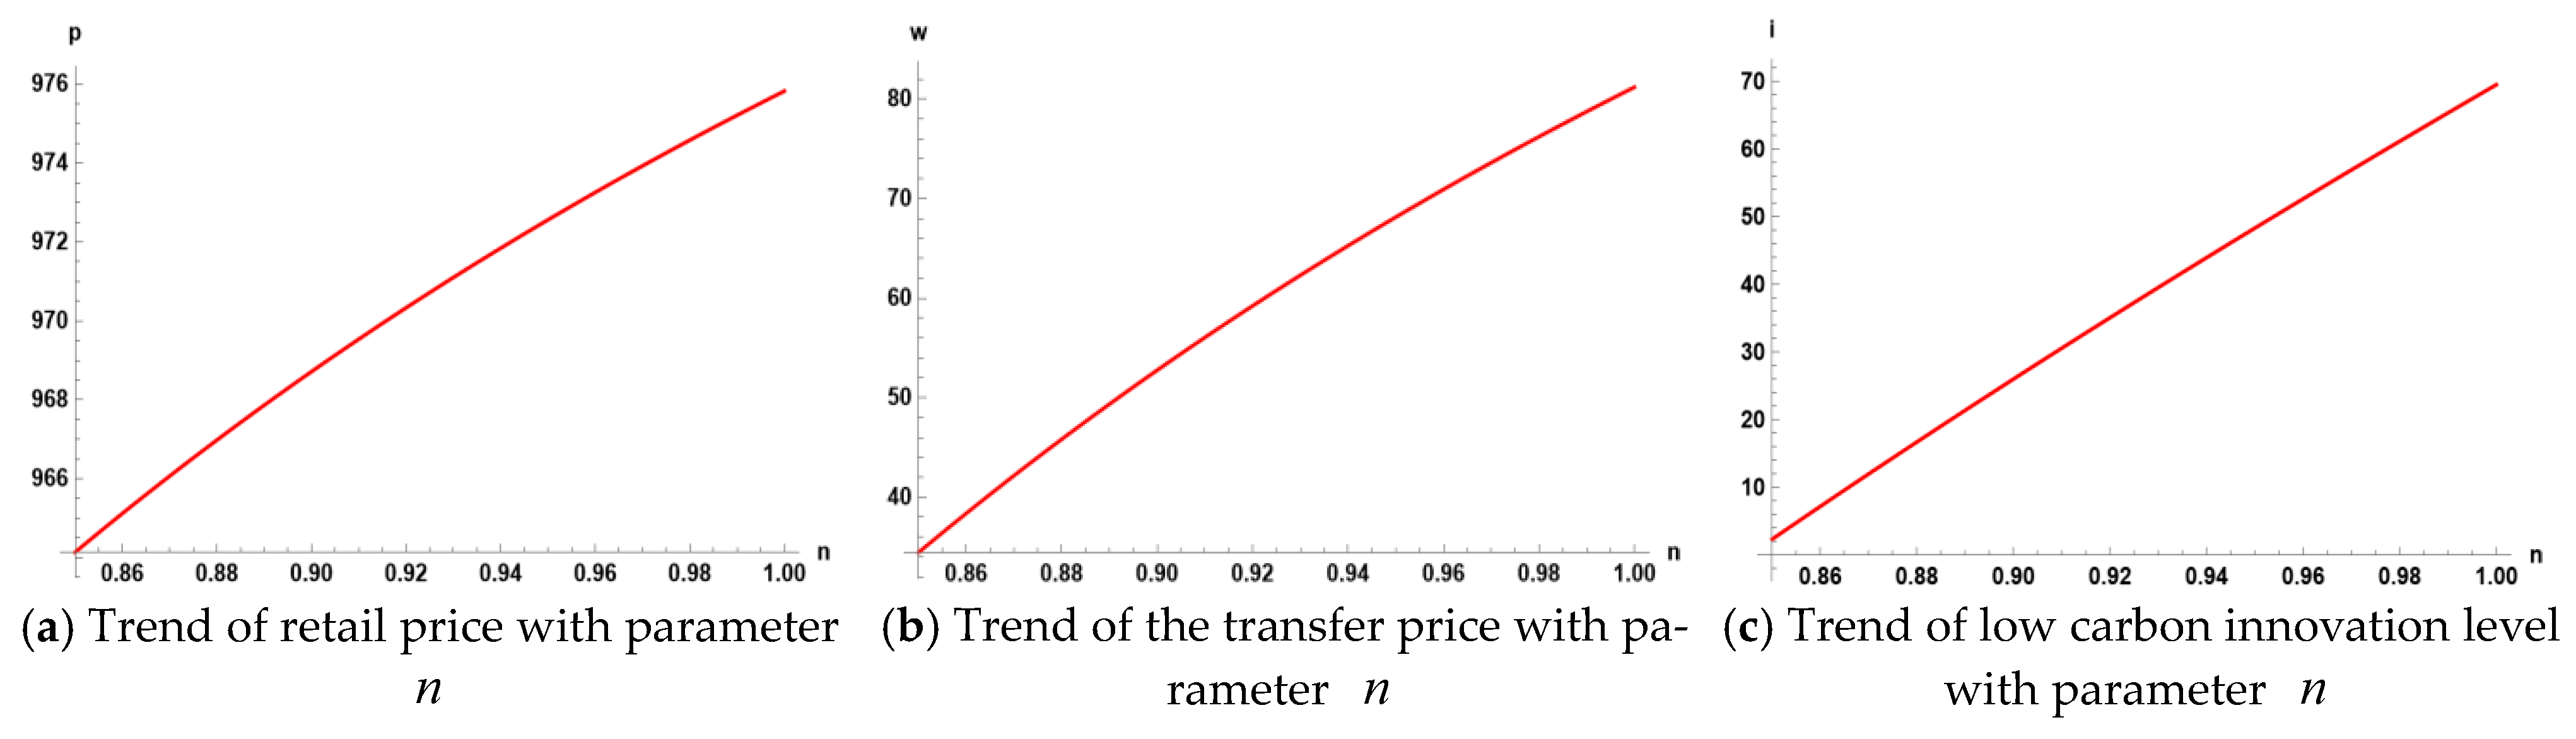
When consumers are different in their sensitivity to the low-carbon level of tiered utilization enterprises, the optimal wholesale prices of manufacturers, transfer prices of waste batteries, innovative low-carbon levels of tiered utilization enterprises, and the overall profit situation of power battery closed-loop supply chain manufacturers, tiered utilization enterprises, and supply chains are shown in
Table 3 (calculated according to Equations (7)–(12)).
Table 3 shows that with the increase of the sensitivity coefficient of the low-carbon level of the cascade utilization enterprises, the wholesale prices of manufacturers, the transfer prices of waste power batteries, the low-carbon level of the cascade utilization enterprises, and the overall interests of each member enterprise and the supply chain have all correspondingly increased. This indicates that the sensitivity coefficient of utilizing the low-carbon level of enterprises in a hierarchical manner is an important link in guiding enterprises to achieve green remanufacturing and sales investment. The use of mathematics software for drawing can more intuitively reflect the above conclusions, as shown in
Figure 9.
Further observation shows that as the sensitivity coefficient of the low-carbon level of the cascade utilization enterprise increases, its range of change is set as: . The largest change in the low-carbon level of enterprises is followed by the transfer price of waste power batteries, and the smallest change is in the wholesale price of manufacturers. This indicates that the sensitivity of low-carbonization level depends on the sensitivity coefficient of low-carbonization level. As the level of low-carbon increases, the utilization of enterprises increases their investment costs, which in turn leads to an increase in transfer prices, in order to ensure the feasibility of low-carbon production. The increase in transfer prices has led manufacturers to rely on increasing wholesale prices of power batteries to balance their profits, thus verifying the three conclusions , , and in Proposition 1.
Next, the simulation analysis will be conducted to investigate the impact of the sensitivity coefficient of the enterprise’s low-carbon level on the profits of member enterprises and the supply chain, as shown in
Figure 10.
Figure 10 shows that as the sensitivity coefficient of the low-carbon level of the cascaded utilization enterprise increases, the profits of member enterprises and the overall profits of the supply chain also increase, verifying the two conclusions
and
in Proposition 1. The overall profit of the supply chain is higher than that of member enterprises, and the overall profit of producers and supply chains is much higher than that of cascaded utilization enterprises. This indicates that the amount of profit obtained by cascade utilization enterprises in the reverse supply chain through recycling, processing and reusing power batteries is much lower than that of the forward supply chain. But as consumers become more sensitive to low-carbon levels, it is beneficial to increase their profit level. Manufacturers of new power batteries are aimed at the primary market, and their wholesale prices are much higher than the recycling and cascade utilization prices, so the benefits will be much higher than those of cascade utilization enterprises.
6.3. Analysis of the Impact of Power Battery Recycling Rate on Optimal Decision-Making
When the recycling rate of waste power batteries is different, the optimal wholesale price, transfer price of waste batteries, low-carbon innovation level of cascade utilization enterprises, and the overall profit situation of node enterprises in the closed-loop supply chain of power batteries—manufacturers, cascade utilization enterprises, and the supply chain are shown in
Table 4 (calculated according to Equations (7)–(12)).
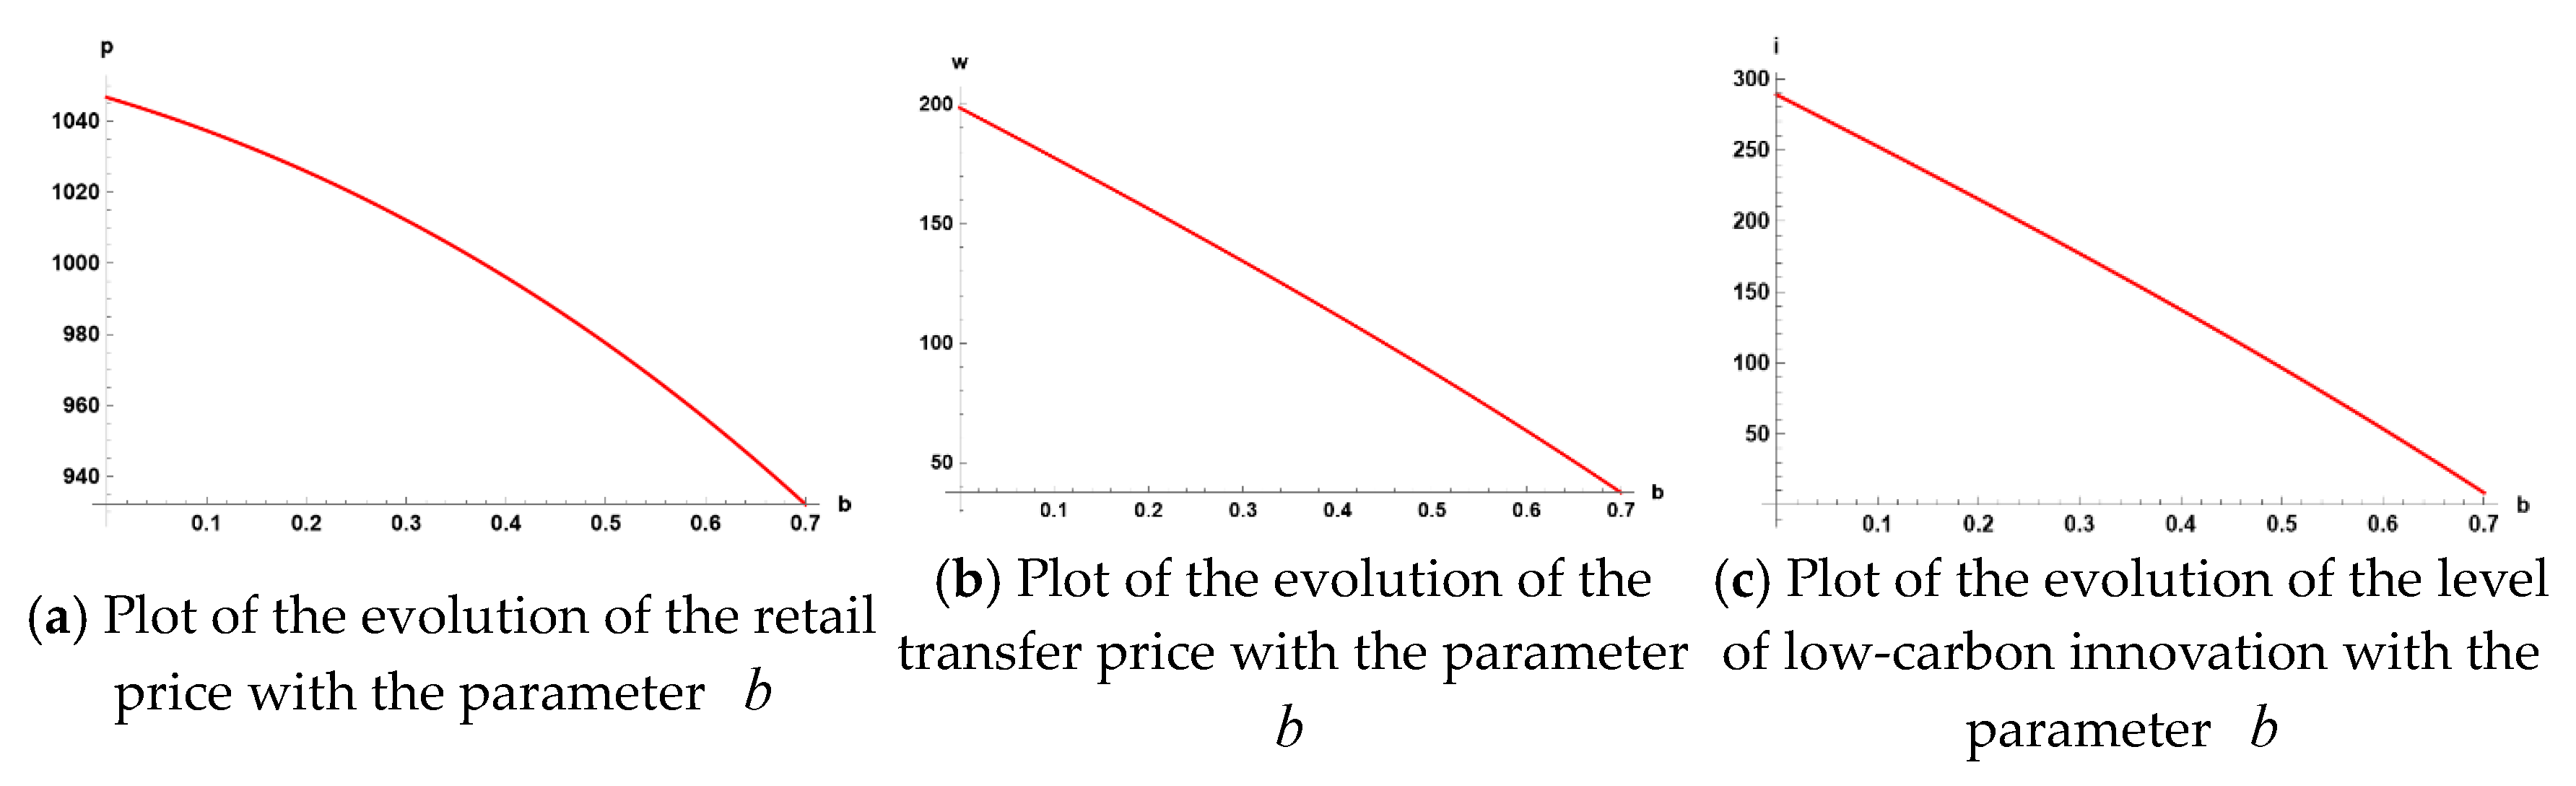
Table 4 shows that as the recycling rate of waste power batteries increases, the wholesale prices of manufacturers, the transfer prices of waste power batteries, the low-carbon level of cascade utilization enterprises, and the overall profits of manufacturers and supply chains decrease.
This indicates that the higher the recycling rate of waste power batteries, the greater the benefits they will bring. On the contrary, as the recycling volume increases, the corresponding cost for low-carbon investment and reuse by enterprises will increase, and the benefits will actually decrease. And the profits of cascade utilization enterprises will first increase and then decrease, indicating that the recovery rate of power batteries is a crucial factor in the process of affecting the profits of cascade utilization enterprises. Use mathematics software to draw for numerical simulation, as shown in
Figure 11.
The simulation experiment sets its variation range to . Further observation shows that the changes in the low-carbon level of enterprises are the largest, and the transfer prices of waste power batteries and wholesale prices of manufacturers are similar. This indicates that the low-carbon level is more sensitive to the recovery rate of power batteries compared to the other two decision variables. With the increase of recycling rate, the investment cost of cascade utilization enterprises increases, which has a negative effect on the improvement of low-carbon level. The decrease in low-carbon level leads to a decrease in the transfer price of power batteries in the opposite direction. Manufacturers can gain more market share with lower wholesale prices of power batteries, ensuring stable growth of their profits, which validates the three conclusions , , and in Proposition 2.
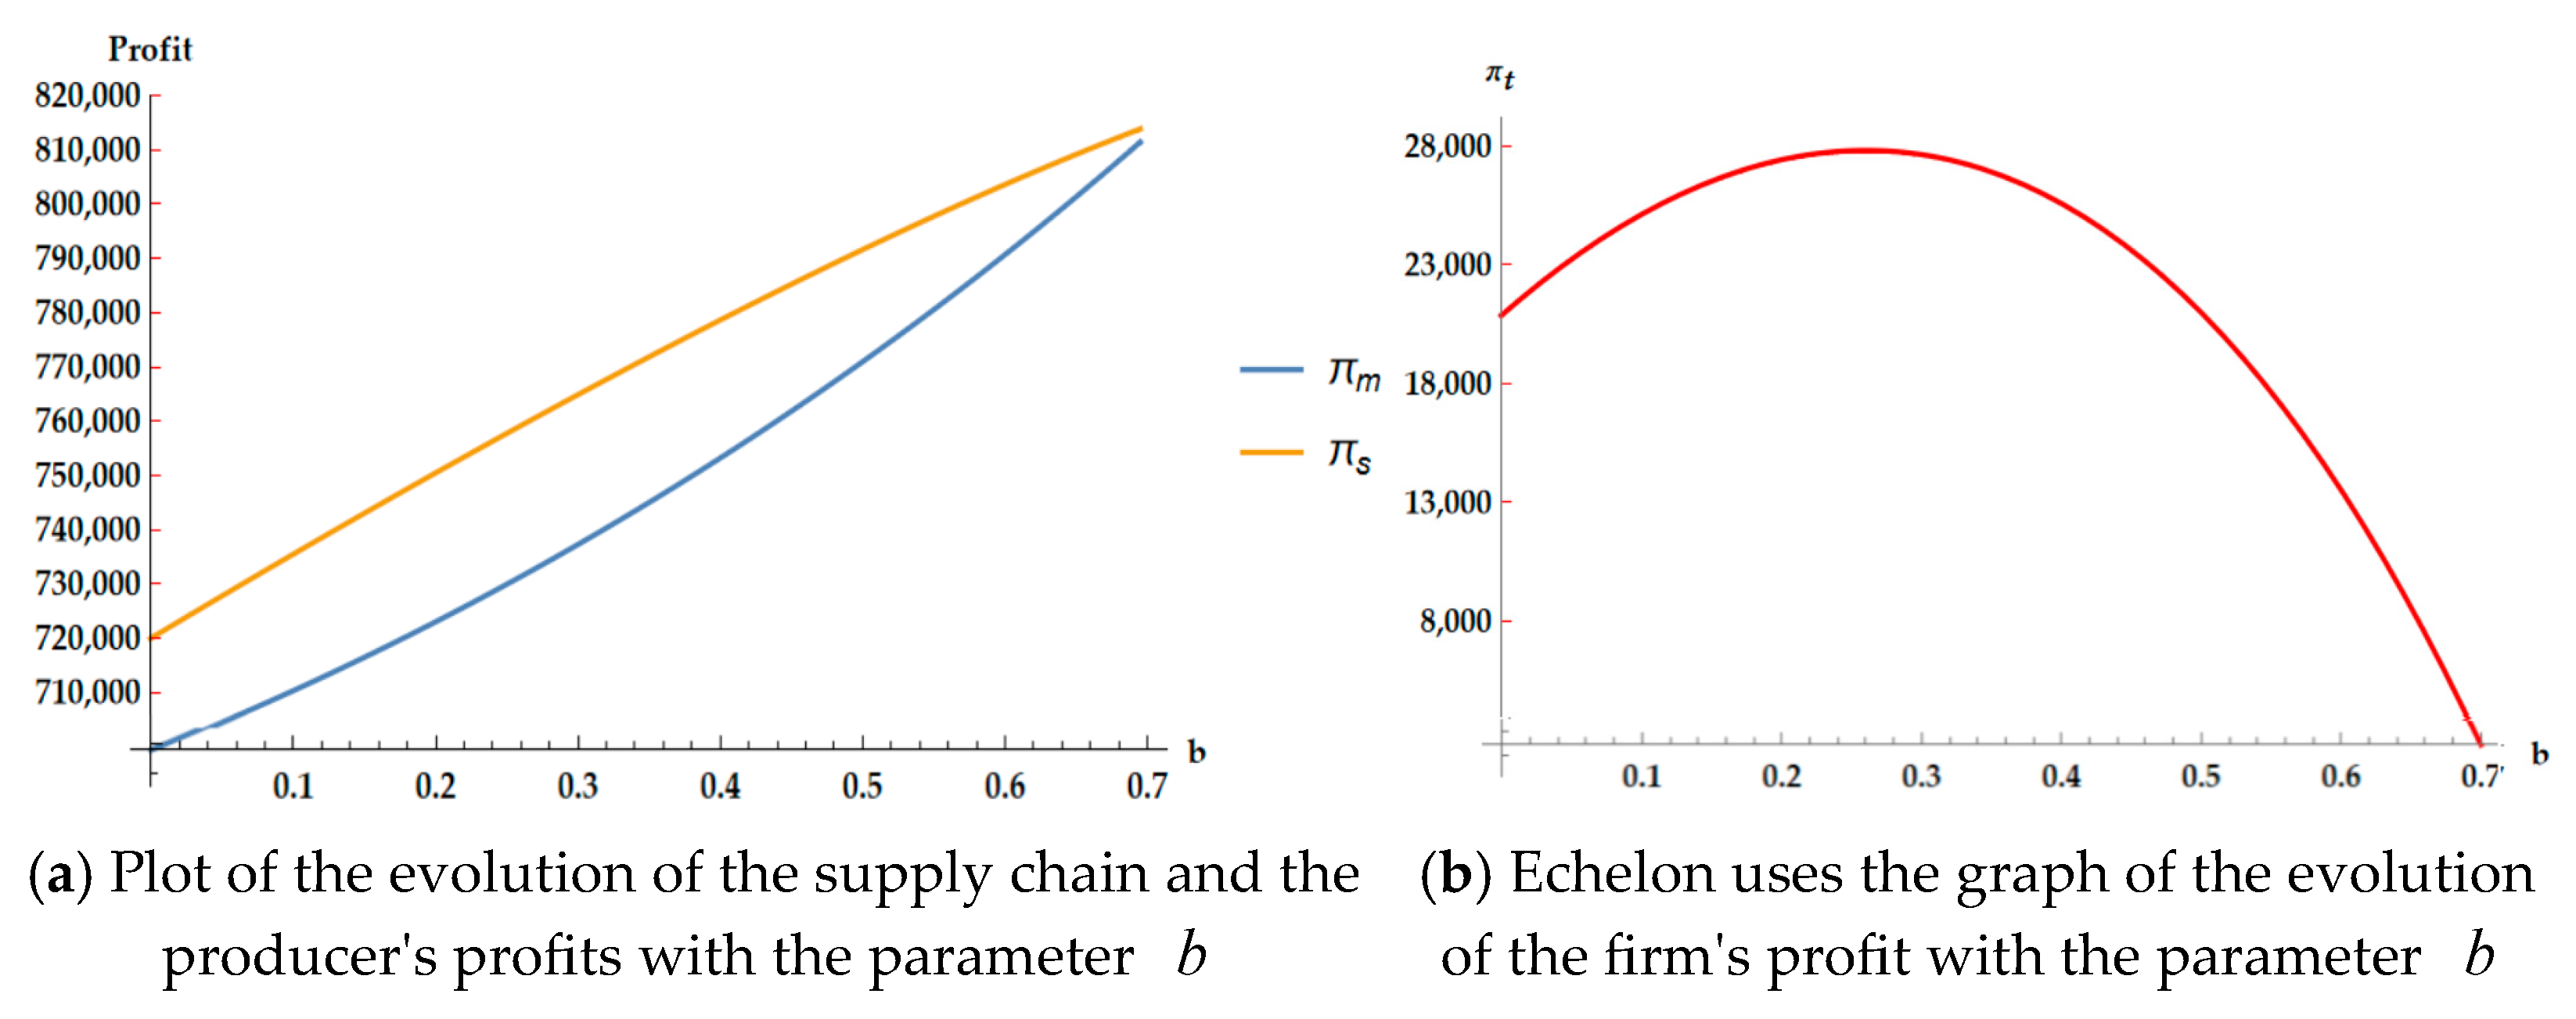
Next, simulate and analyze the impact of power battery recycling rate on the profits of member companies and supply chains, as shown in
Figure 12.
Figure 12 shows that with the increase of the sensitivity coefficient of the low-carbon level of the cascade utilization enterprises, the overall profits of both producers and the supply chain also increase. Verified the conclusion
in Proposition 2. Let
be true and we can figure out the inflection point. The other description in Proposition 2 is verified:
is true when
is true and
is true when
is true. By setting the initial parameter values,
can be obtained through calculation.
On the premise that the parameter settings meet the optimal equilibrium solution of the model, the overall profit of the supply chain is higher than that of the member enterprises, and the overall profit of the producers and supply chain is still much higher than that of the cascaded utilization enterprises. This indicates that the level of power battery recycling rate has no significant impact on the distribution proportion of supply chain node member enterprises and the overall revenue of the supply chain. But as the recovery rate of power batteries increases, it is beneficial to increase the profit level of manufacturers and the overall supply chain. For cascade utilization enterprises, the recovery rate of power batteries should be controlled below the inflection point, which plays a positive role in the profit growth of manufacturers. When it is above the inflection point, it is not conducive to the increase of profits for manufacturers.
6.4. Analysis of the Impact of Cost Coefficient on Optimal Decision-Making in Low-Carbon Production
The cost coefficients of low-carbon production vary, and the optimal wholesale prices of manufacturers, transfer prices of waste batteries, low-carbon innovation levels of cascade utilization enterprises, as well as the overall profit situation of node enterprises in the closed-loop supply chain of power batteries and the supply chain are shown in
Table 5 (calculated according to Equations (7)–(12)).
Table 5 shows that as the cost coefficient of low-carbon production increases, the wholesale prices of producers, the transfer prices of waste power batteries, the low-carbon level of cascade utilization enterprises, and the overall profits of producers and supply chains decrease. This indicates that the higher the cost investment of low-carbon production, the greater the negative effect it has on the acquisition of benefits for cascade utilization enterprises. To balance profits, tiered utilization enterprises will increase the transfer price of waste power batteries, leading to increased costs for manufacturers and still having a negative impact on their profits. The impact of low-carbon production costs on the level of low-carbon innovation is not positive, as the higher the level of innovation, the lower the required costs. If it is necessary to invest a large amount of cost to achieve the improvement of the low-carbon level, it is not a true improvement of innovation level, so it can be observed that the two have a negative impact.
Use mathematics software for drawing and numerical simulation, as shown in
Figure 13.
Further observation shows that the range of change in the low-carbon production cost coefficient is set to . As it increases, the enterprise’s low-carbon level changes the most, followed by the transfer price of waste power batteries, and the wholesale price of manufacturers changes the least.
This indicates that the level of low-carbon production is more sensitive to the cost coefficient of low-carbon production, which validates the three conclusions , , and in Proposition 3.
The following simulation analysis shows the impact of the cost coefficient of low-carbon production on the profits of member enterprises and supply chains, as shown in
Figure 14.
Figure 14 shows that as the sensitivity coefficient of the low-carbon level of the cascade utilization enterprise increases, the profits of member enterprises and the overall profits of the supply chain also decrease. Verified the two conclusions
and
in Proposition 3. On the premise that the parameter settings meet the optimal equilibrium solution of the model, the overall profit of the supply chain is higher than that of the member enterprises.
Figure 7 shows that when the cost coefficient of low-carbon production is small, the curve changes quickly, and the profits of the three parties decrease significantly. When the cost coefficient of low-carbon production is large, the curve changes slowly, and the profit reduction of the three is relatively small. Cascade utilization enterprises, as implementers of low-carbon production, should minimize the cost of low-carbon investment through integration of industry, academia, and research, or the introduction of advanced technology, while enhancing the level of low-carbon innovation, in order to maintain a relatively good level of revenue for supply chain node enterprises and the overall supply chain.
7. Conclusions
Firstly, this paper analyzes the pricing decisions of manufacturers and echelon utilization enterprises under the decentralized decision-making of closed-loop supply chain when the echelon utilization enterprises invest in low-carbon innovation. On this basis, the pricing decision and revenue of the whole supply chain under centralized decision-making are analyzed. It then compared the profit level of the two decision-making schemes, and verified the propositions and theorems intuitively and clearly through numerical simulation. The practical significance of this study and its impact on society are mainly reflected in the following three aspects.
With the increase of the sensitivity coefficient of low carbonization level of echelon utilization enterprises , the wholesale price of manufacturers , the transfer price of waste power batteries , and the low carbonization level of echelon utilization enterprises increase accordingly , and the profit of member enterprises , and the overall profit of the supply chain increase accordingly. With the increase of the cost coefficient of low-carbon production , the wholesale price of manufacturers , the transfer price of waste power batteries , the low carbonization level of echelon utilization enterprises will decrease, and the profits of member enterprises , and the overall profits of the supply chain will decrease. With the increase of the recycling rate of waste power batteries , the wholesale price of manufacturers , the transfer price of waste power batteries , the low carbonization level of echelon utilization enterprises will decrease, and the overall profit of manufacturers and supply chains will increase. There is an inflection point in the influence of this coefficient on the profits of echelon utilization enterprises , and the profits show a trend of rising first and then falling around the inflection point. When the recycling rate is lower than the inflection point, it will not have a negative impact on profits due to the low investment of enterprises in processing and recycling waste batteries. However, if the recycling rate is too large, it will increase the cost burden of processing recycled power batteries, which will have a negative impact on profits.
In general, each decision variable does not have a single impact on the supply chain as a whole and the node enterprises. Node enterprises should make input and pricing decisions after comprehensive consideration. Since the profit of centralized decision-making supply chain is always higher than the profit of enterprises and producers in the lower echelons of decentralized decision-making, it is suggested to adopt centralized decision-making for pricing.
Consumers are most concerned about commodity prices. When people’s low-carbon awareness is enhanced, the likelihood of consumers turning in used batteries has little to do with the recycling price they receive. If enterprises implementing low-carbon innovation increase low-carbon production costs , the wholesale price of power batteries will be indirectly reduced, which is conducive to promoting consumer purchase and increasing sales . In recent years, people have become more and more aware of the serious harm that environmental pollution brings to real life. The expiration of the service life of the power battery of electric vehicles has brought new pollution problems. This will make consumers prefer to hand over waste power batteries to enterprises with a sense of low-carbon innovation for recycling. This will increase the recycling rate , and we can know from the above conclusion that the wholesale price of power batteries will decrease accordingly. After implementing low-carbon behaviors, consumers can get returns that are beneficial to themselves, which can promote a virtuous cycle of closed-loop supply chain. It is not only beneficial to consumers, but also conducive to protecting the social environment and reducing carbon emissions.
Through the above conclusions and analysis, the increase of the cost coefficient of low-carbon innovative production will reduce the overall profits of the enterprise , and the supply chain , which indicates that if the enterprise invests too much in low-carbon innovation, it will not be able to ensure the balance of its own profits. In addition, the emergence of the inflection point also shows that the investment of the enterprise for the recycling and treatment of waste power batteries cannot be endlessly implemented from the perspective of environmental protection, otherwise the investment will be higher than the income, and the enterprise itself is difficult to bear. In order to promote the benign operation of this new closed-loop supply chain, the government departments should take positive measures to make it orderly, stable and sustainable. The government can strengthen consumers’ low-carbon awareness through publicity or rewards. In addition, we can reduce the cost of implementing low-carbon innovation by subsidizing enterprises that implement low-carbon innovation, increase their profits, and make enterprises more active in implementing low-carbon innovation. This is also the theoretical support and suggestion for the government to achieve the goal of low-carbon emission reduction.
The existing research often considers low-carbon innovation in the forward supply chain, and a node enterprise is rarely responsible for both low-carbon innovation and recycling. At present, the recycling and cascade utilization of power batteries are often implemented by two different enterprises, which increases the recycling and processing links, so some enterprises are trying to implement the two together. At present, the entity enterprises in the reverse supply chain of power batteries rarely implement the scheme designed in this paper, primarily because they are not sure whether the enterprise benefits are ideal. This paper theoretically gives the feasibility of this scheme, as well as the factors that affect the earnings of enterprises, and lays a theoretical foundation for the development direction of supply chain enterprises in the later stage.
The following is summarized from the following three sections.
At present, the new energy vehicle power battery recycling market is growing and it is increasingly important to dispose of these retired batteries properly and effectively, as far as possible, to avoid secondary pollution. This paper considers that the node enterprises of the reverse supply chain are responsible for the implementation of battery recycling, cascade utilization and low-carbon innovation. On the basis of effectively integrating all links, a new closed-loop supply chain should be constructed. To solve for the Nash equilibrium solution of the new model, we use backward induction. The experimental results indicate that the implementation of low-carbon innovative production by cascaded utilization enterprises is conducive to the growth of their profits with lower cost inputs. The sensitivity coefficient of the low-carbonization level has a positive regulatory effect on decision variables and point’s location of all parties. The impact of the initial waste power battery recycling rate on the decision variables is negative, while for the supply chain as a whole, as well as the profit growth of the node companies, can be positive, and the location of the inflection point appears to be particularly important. The inflection point is affected by many factors, so enterprises can adjust it within a certain range, but this is not absolute. In addition to enterprises, it also needs the joint regulation of the government and all members of the supply chain. Therefore, the government, power battery manufacturers, echelon utilization enterprises and consumers all need to cooperate with each other to make the closed-loop supply chain of power batteries develop steadily.
This is a new power battery closed loop supply chain model. It is suggested that the echelon utilization enterprises in the reverse supply chain should pay attention to the inflection point of adjusting the recovery rate. It is suggested that enterprises should try their best to avoid an excessive recycling rate, because it will easily lead to the inability of enterprises to bear the resulting economic costs, affecting the overall virtuous cycle of the supply chain. The government’s low-carbon publicity and orientation is crucial, but through researching this paper, we found that the increase in the recycling rate of power batteries will have a negative impact on the profits of enterprises that implement recycling and carpet innovation at the same time in the short term. The government should focus on the future and take a long-term view to treat the low-carbon development of enterprises. Therefore, the government should encourage the echelon utilization enterprises to implement low-carbon innovation by means of rewards or subsidies, so as to ensure the economic benefits of enterprises and promote the virtuous cycle of the closed-loop supply chain of power batteries.
This study opens up a new research approach for the combination of power battery closed-loop supply chain and reverse low-carbon innovation. This paper mainly considers the pricing decision of node enterprises implementing low-carbon innovation in the reverse chain of closed-loop supply chain, and does not include the government subsidy in the supply chain model. The low-carbon innovative enterprises in this model are also responsible for the recycling of waste power batteries, and we did not consider the innovation input and pricing decisions in the case of multi-channel recycling, which will be discussed and implemented in subsequent research. In addition, the new closed-loop supply chain model constructed in this paper does not involve the study of competitive channels. Our research is still in the initial stages, and we will continue to conduct in-depth research from the above aspects in the future and provide theoretical basis for the development of power battery closed-loop supply chains.


