
Prospective Evaluation of the Public Transport System in the Petrosani Basin


Department of Mechanical, Industrial and Transport Engineering, University of Petrosani, 20 University Street, 332006 Petrosani, Romania
Sustainability 2023, 15(23), 16481; https://doi.org/10.3390/su152316481
Submission received: 31 October 2023
/
Revised: 20 November 2023
/
Accepted: 29 November 2023
/
Published: 1 December 2023
(This article belongs to the Special Issue Today's Urban Mobility: Experiences from COVID-19 Current Trends and New Perspectives)
Abstract
:Public transport is one of the most important functions of a city, which can have a major impact on the elements that support sustainable development: society, the environment and the economy. In order for residents and tourists of the Petrosani Basin to benefit from a predictable, systematized public transport system with well-established travel times, it is necessary to analyze some current factors and trends regarding public transport in the Petrosani Basin. This prospective study confirms that the use of the public transport system in the Petrosani Basin is decreasing, a decrease mainly associated with the lack of spatial accessibility, comfort and safety for passengers (inappropriate stations, the lack of air conditioning in means of transport, the lack of a modern fare system, the lack of means of information in the stations, etc.) but also with the change in people’s attitudes imposed by the protective measures taken as a result of the coronavirus pandemic. However, it should be noted that the public transport system in the Petrosani Basin is strongly influenced by the geographical characteristics of the Petrosani Basin, by the sharp decrease in the population (a negative natural increase and a reduction in the school population) and by the increase in the number of private cars.
1. Introduction
The European Union is strengthening its economic, social and territorial cohesion with the aim of promoting harmonious development throughout its territory. The EU specifically aims to reduce disparities between the development levels of various regions. Among the regions considered, special attention is paid to rural areas, areas affected by the industrial transition, regions affected by a severe and permanent natural or demographic handicap, such as the northernmost regions with a very low population density, as well as island, cross-border and mountainous regions [1]. In the current global context, Romania has joined the majority of European states by signing the Declaration on the use of the European Ecological Pact as a key element in the European Union’s recovery plan after the COVID-19 pandemic [2].
The Petrosani Basin represents a special area for Romania from a social and economic point of view. It was Romania’s largest coal basin, being a mono-industrial area and became known especially through the miners’ revolts of 1990, 1991 and 1999 [3]. Today, the Petrosani Basin is facing a drastic reduction in its economic activities and population, accessibility, mobility and connectivity (which have always suffered from few buses, overcrowding and unstable and unpredictable timetables [4]), which are essential preconditions for facilitating all activities related to future economic measures, attracting investments, developing tourism and improving the daily transport and mobility routine for residents [2,5].
In this economic and social context, the coronavirus pandemic had a negative effect on the public transport system in the Petroșani Basin, because social distancing measures were directly associated with the reduction in people’s mobility [6,7]. With the declaration of the “Pandemic” by the World Health Organization, on 11 March 2020, starting from 15 March 2020, a state of emergency was established (when the right to free movement was restricted, mainly) in the territory of Romania, which was maintained for 2 months, when it went into alert status starting on 15 May 2020, and the alert status was maintained until 8 March 2022 [8,9,10]. Starting on 22 March 2022, the municipality of Petrosani entered quarantine (travel restrictions, closing of restaurants and bars as well as the restriction of public events) for 14 days due to the fact that the number of COVID-19 cases exceeded six cases per thousand inhabitants [11]. Starting on 5 April 2022, everything returns to a relatively normal state in the Petroșani Basin from the point of view of the pandemic.
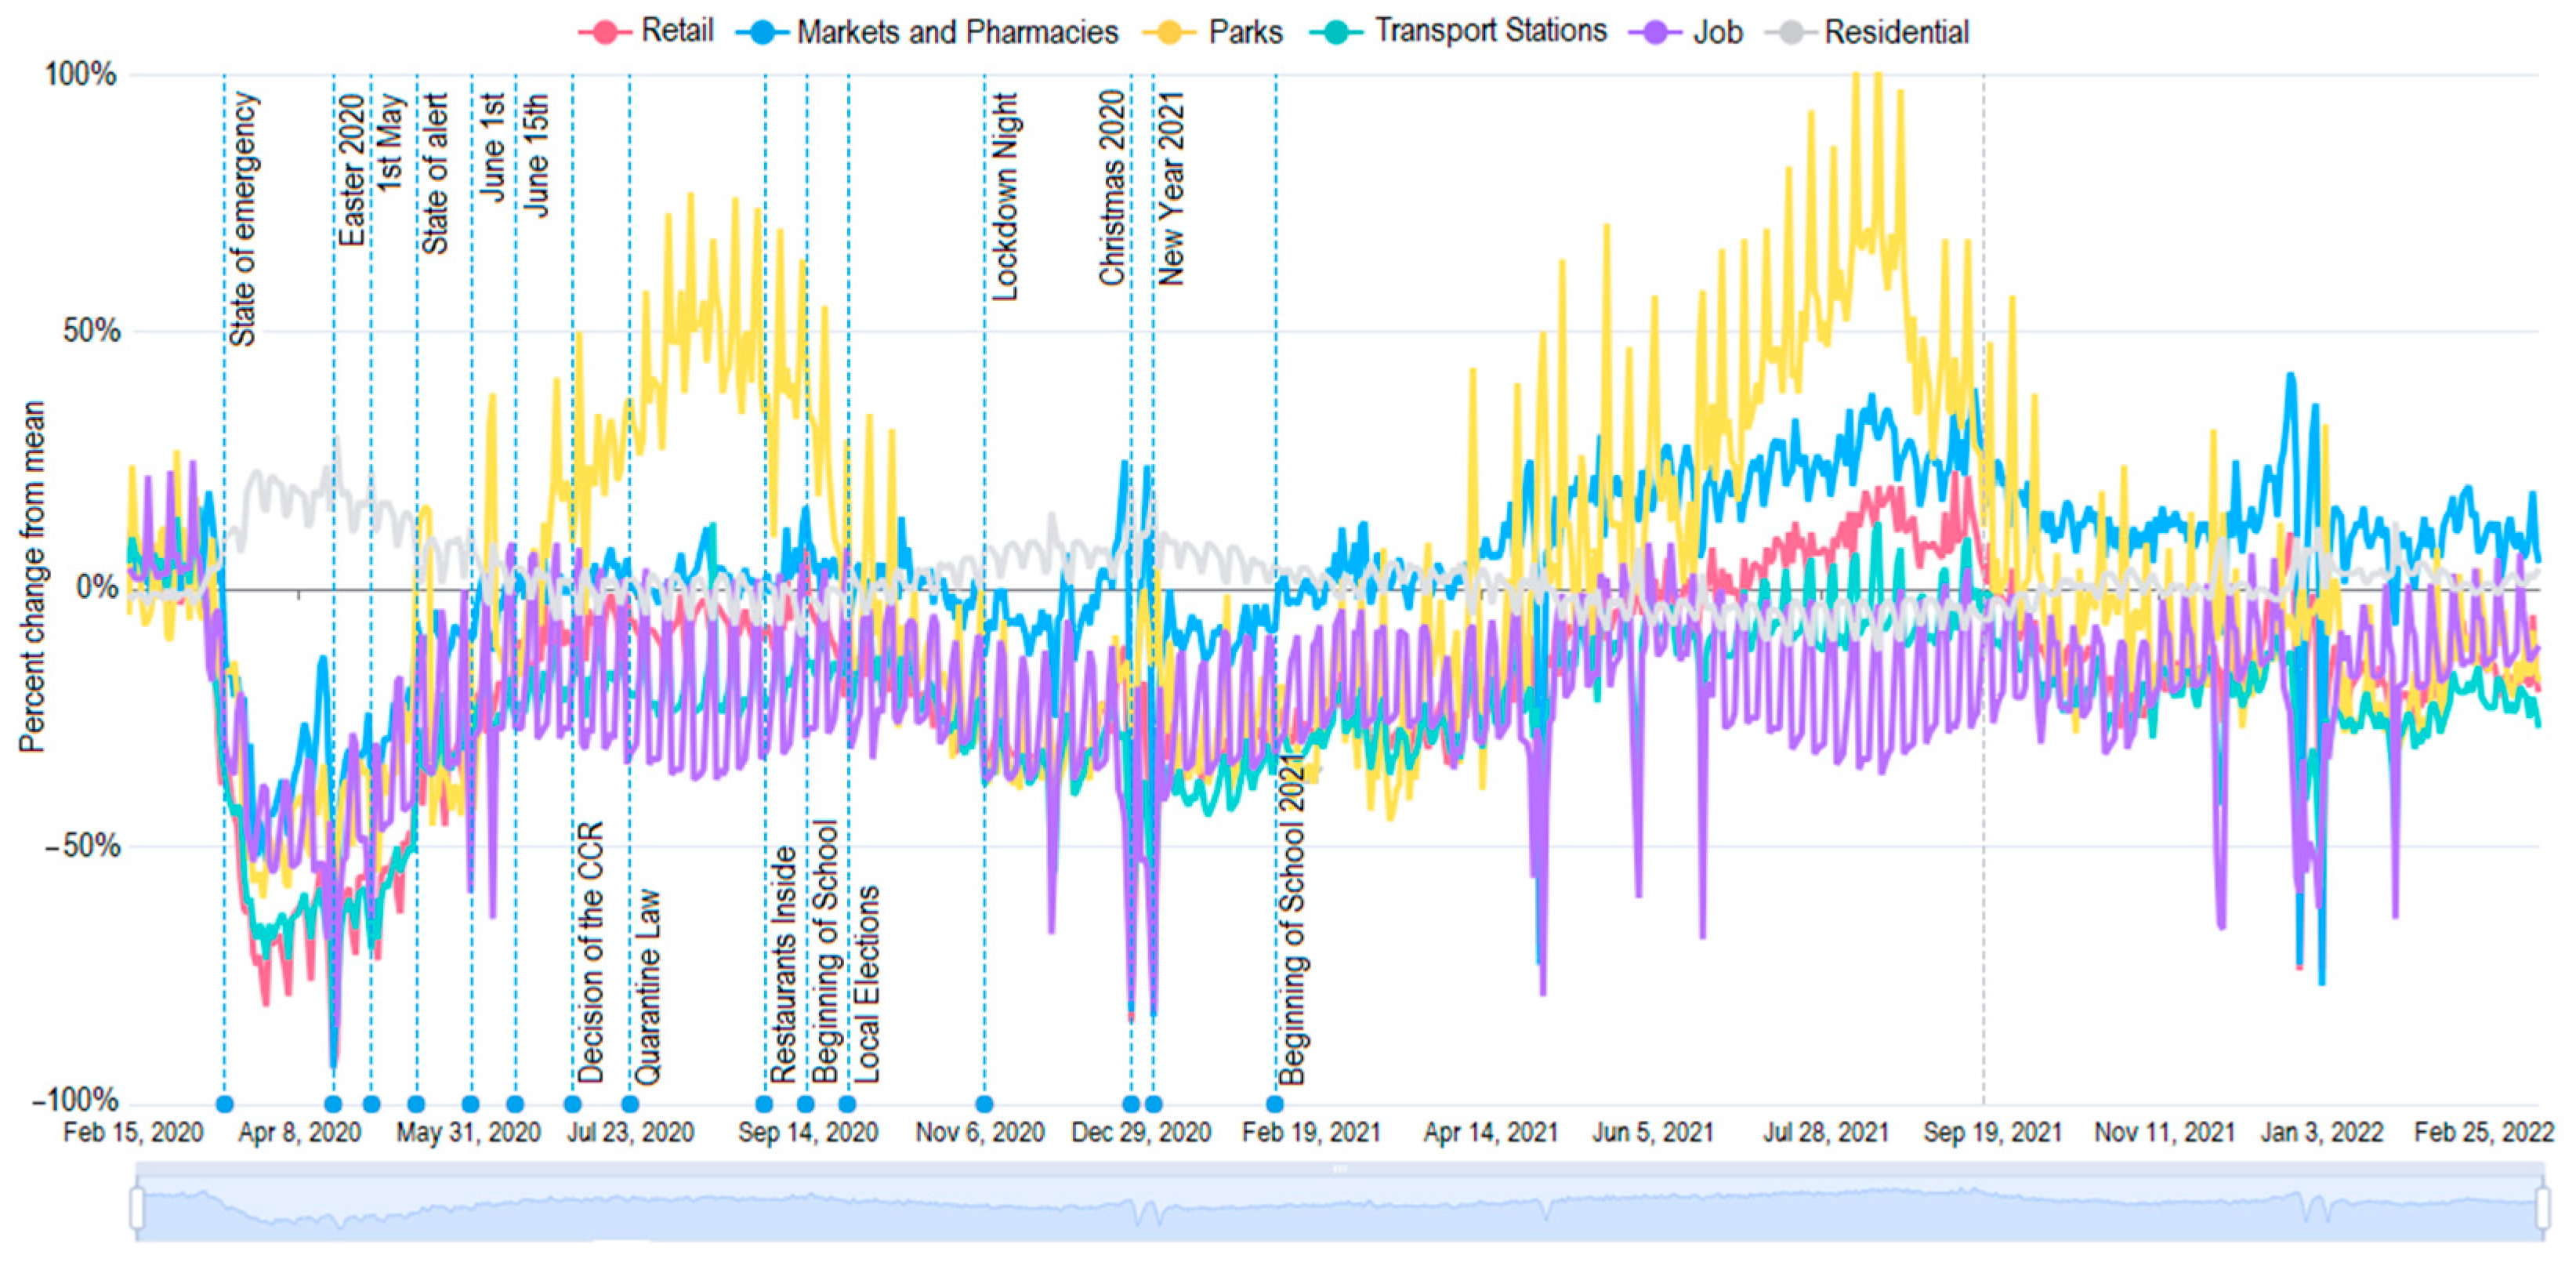
An example of the reduction in people’s mobility during the pandemic is given by the Google mobility data for Romania (Figure 1), providing an overview of mobility trends for different activities [12]. A mobility index is defined, which represents the change in the mobility pattern relative to a reference value, and the mobility pattern is defined as visits and lengths of stay with respect to different activities (places). The figures are compared to the median value for the corresponding day from 3 January 2020 to 6 February 2020. Visit frequency and duration were shown to have dropped sharply for most activities (e.g., retail and recreation, grocery and pharmacy, transit stations, jobs, etc.) and raised for residential activities (staying or working from home) [13].
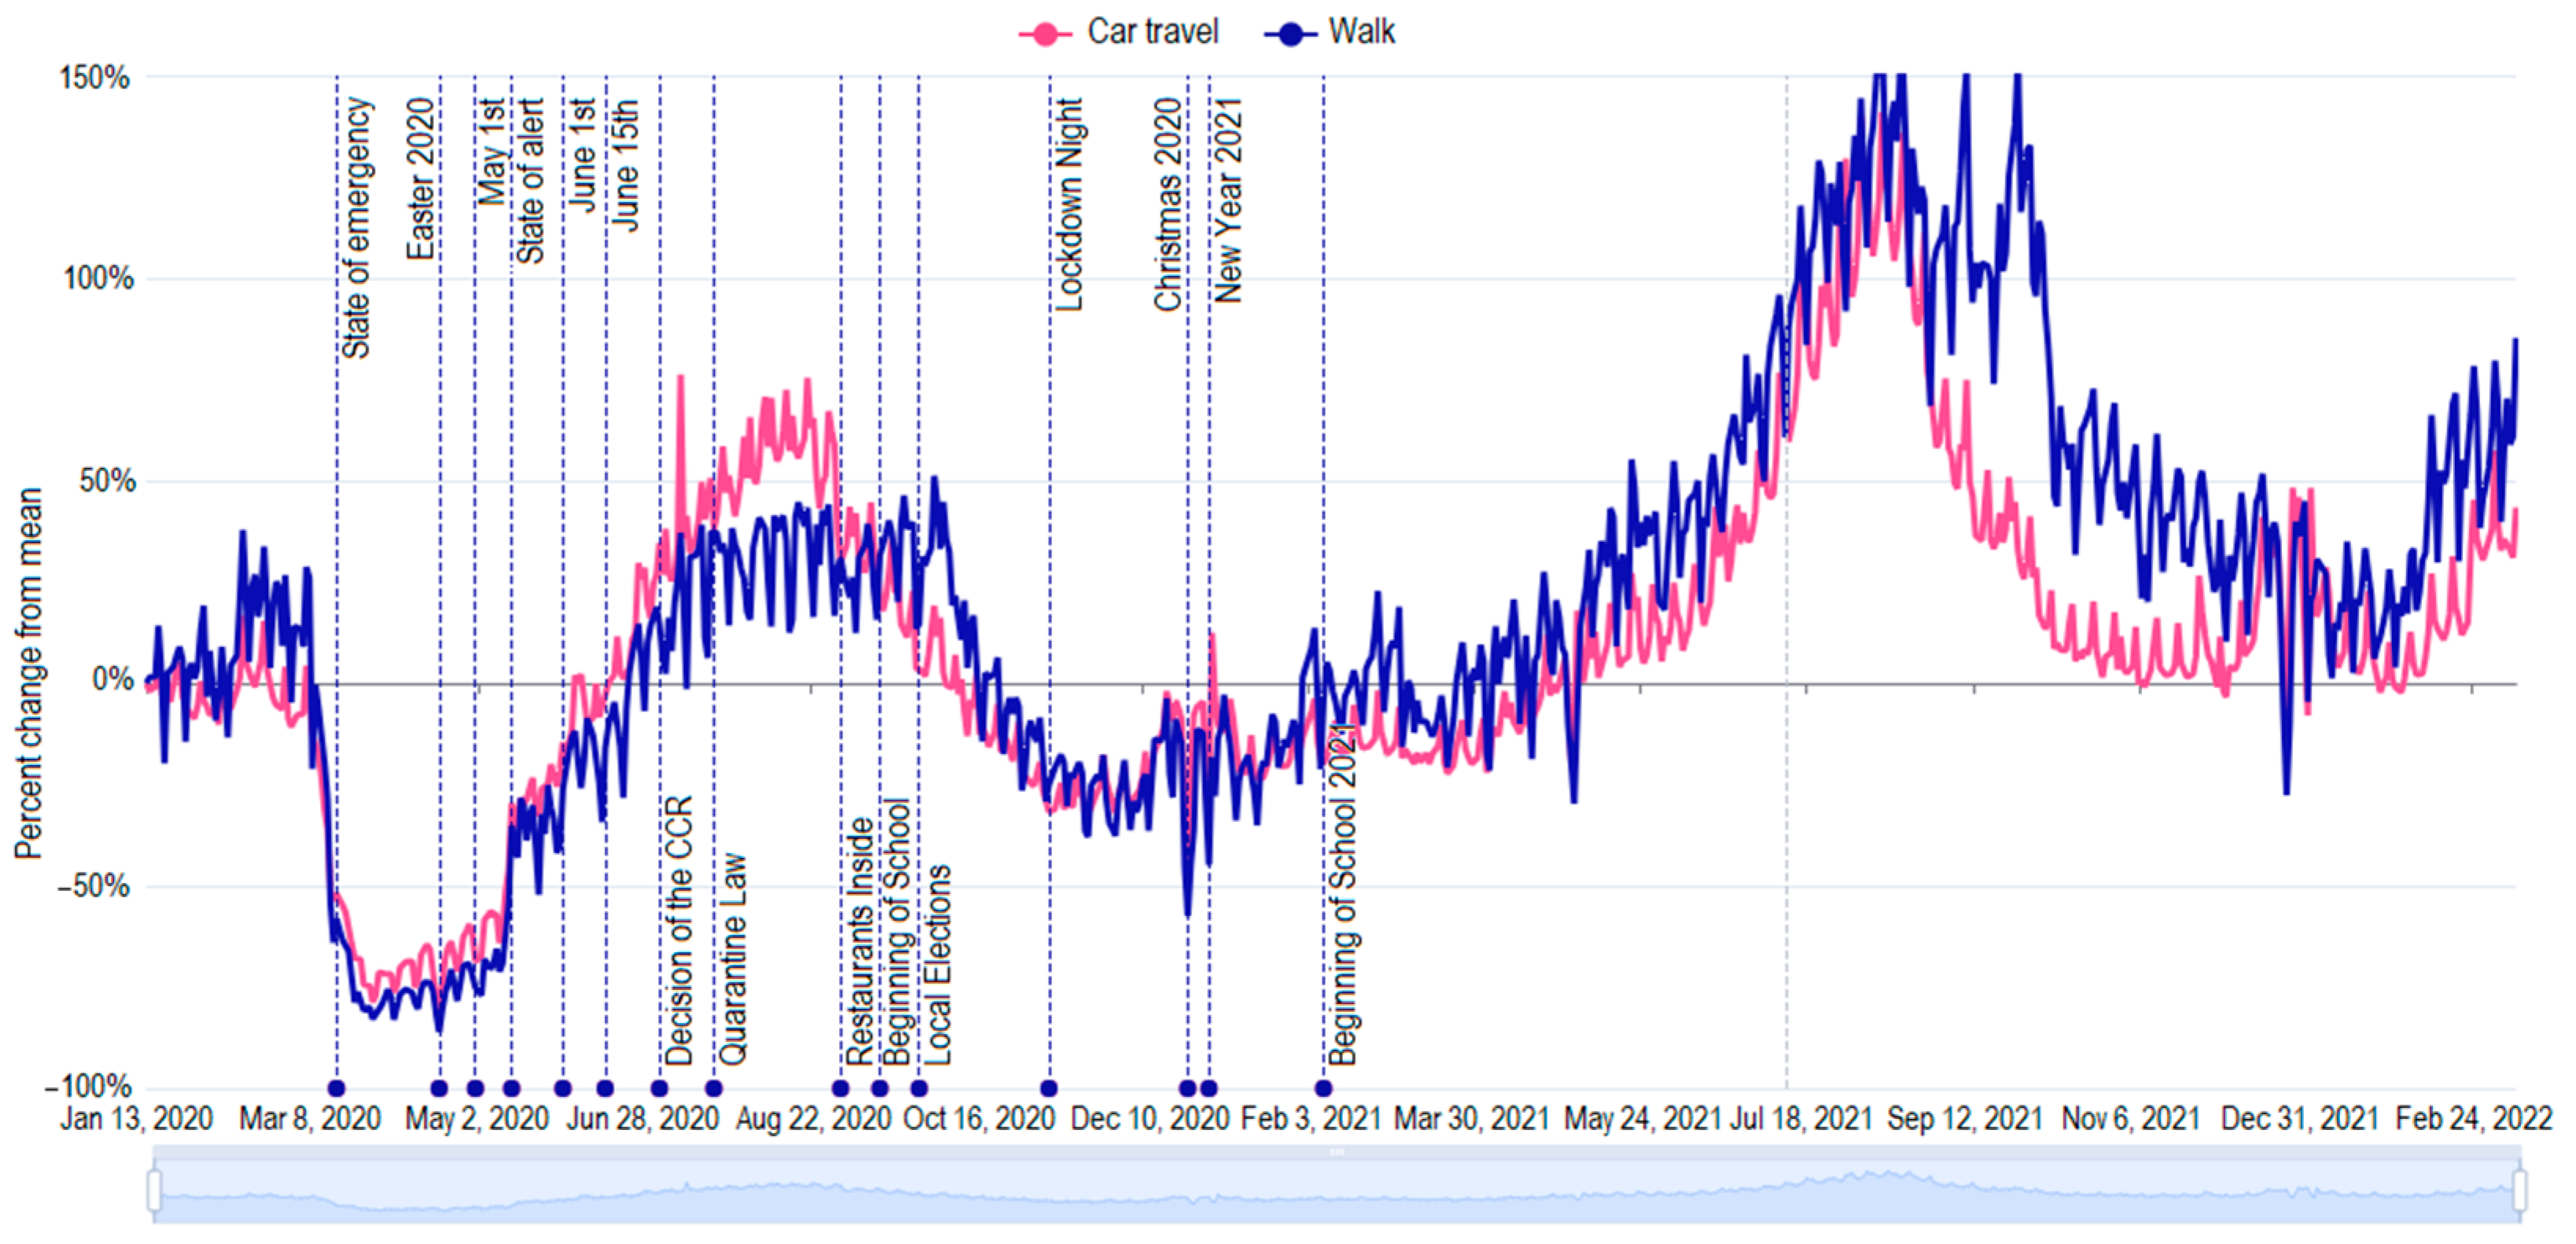
At the same time, Apple also shows a percentage change in mobility trends and an increase in car and walking modes of travel (Figure 2) [14].
The increase in the number of new cases of COVID-19 was associated with a sharp decrease in the mobility of people using public transport, especially until mid-April 2020. However, from the beginning of May, there was a significant increase in human mobility, observed despite the consistently high number of new laboratory-confirmed cases of COVID-19. With the introduction of further government restrictions, a sharp decline in people’s mobility on public transport was observed until mid-April 2020 [15]. Countries that did not impose strict lockdowns also faced revenue losses as people avoided public transport [16]. The urban transport system promotes social and economic activities through transport connectivity but also generates negative externalities, such as increased carbon dioxide emissions and global environmental warming [17]. Public transport usage has fallen the most, with over 80% fewer users, significantly affected by safety issues. Morning and afternoon mobility declined less than in the afternoon, when the decline is much more drastic with the disappearance of the afternoon peak traffic periods. The effect of isolation has logically changed the purposes behind people’s travels, with work being by far the most important purpose. However, a good thing also happened: the decrease in mobility also produced a reduction in pollutant emissions [15,18,19,20,21].
In the post-pandemic era, it is necessary to review and re-evaluate urban transport planning, policy governance and operating services. Strategies that are important and recommended by management and government strategies include improving the intelligent transportation system in response to emergency situations; building an ecological and green transport system dominated by walking, cycling and high-quality door-to-door public transport services; building more pedestrian and bicycle path systems, supporting walking, bicycle priority and public transport priority; and focusing on smart logistics [22]. Increasing the attractiveness of public transport is a key objective for stakeholders (municipalities, public transport providers, residents) aiming to achieve sustainable urban mobility. Specific public transport planning should pay attention to the mixed degree of land use, designing a pedestrian-friendly environment around public transport stations and hubs [23].
For a more detailed and integrated analysis of the mobility changes that have occurred in the Petrosani Basin, this study attempts to provide data that show how the factors (the characteristics of the geographic environment, urban spatial structure, level of economic development, demographic characteristics, public policy, characteristics of public transport services and characteristics of travel demand) specific to the Petrosani Basin and the COVID-19 pandemic affect the attractiveness of public transport. Thus, it can be said that the reduction in travel demand can be counteracted by inhibiting private car travel and encouraging public transport travel by the authorities, by increasing the comfort and safety of the traveler and by affordable travel ticket costs.
2. Methodology
In order to understand the transformations that the Petroșani Basin is going through and implicitly the public transport in the area, we statistically processed data from the period 1992–2022 regarding the evolution of the following: the population; the natural increase in the population; the school population; the number of employees; the number of emigrants; the number of tourists arriving; and the number of personal cars. The data were obtained from the National Institute of Statistics of Romania [5].
To assess the demand for public transport, the research was conducted between February–May 2016 and March–July 2023 and covers the pre-COVID-19 and post-COVID-19 periods. During the pandemic, Google and Apple mobility data for Romania were analyzed [12,14]. The municipality of Petrosani has been established as the main destination for trips from the 8 localities of the basin. That is why, in order to be able to evaluate the demand for the public transport of people, we worked in two ways:
- As a fixed observer, in the Piața Victoriei Station in Petroșani (this being the main road passenger terminal and passenger transfer point from the Petrosani Basin, being positioned near the Petroșani train station), the degree of loading of each means of transport (arriving/leaving) was noted at the station;
- As a mobile observer, traveling by means of public transport from one end of the routes to the other and noting the number of passengers boarding and alighting at each station noting the duration of the journey, the number of passengers at each station, the volumes of passengers along the route at different times of the day and the load level of each means of transport were noted, resulting in the number of passengers per hour for each of the existing transport lines in the basin and the total number of passengers carried by the public transport system.
Peak periods were observed to correspond with population movements to/from work and students starting/ending classes. The peak observed between 12:00 and 13:30 is due to the traffic generated by the pick-up of students from educational institutions. It was also found that the general road traffic does not present major traffic congestion during the day; during most time slots, all vehicles are served by intersections on a single green cycle of the intersection; during peak hours, queues of vehicles form at intersections with a high volume of traffic, exceeding the capacity of the respective intersections, but the waiting time is less than 2 min; the average travel speed in cities is 30 km/h. The number of public transport means used and changes to timetables during and after the pandemic and factors such as distance, population and public transport standards specific to different journeys were taken into account.
3. Case Study Analysis
3.1. Case Study Background
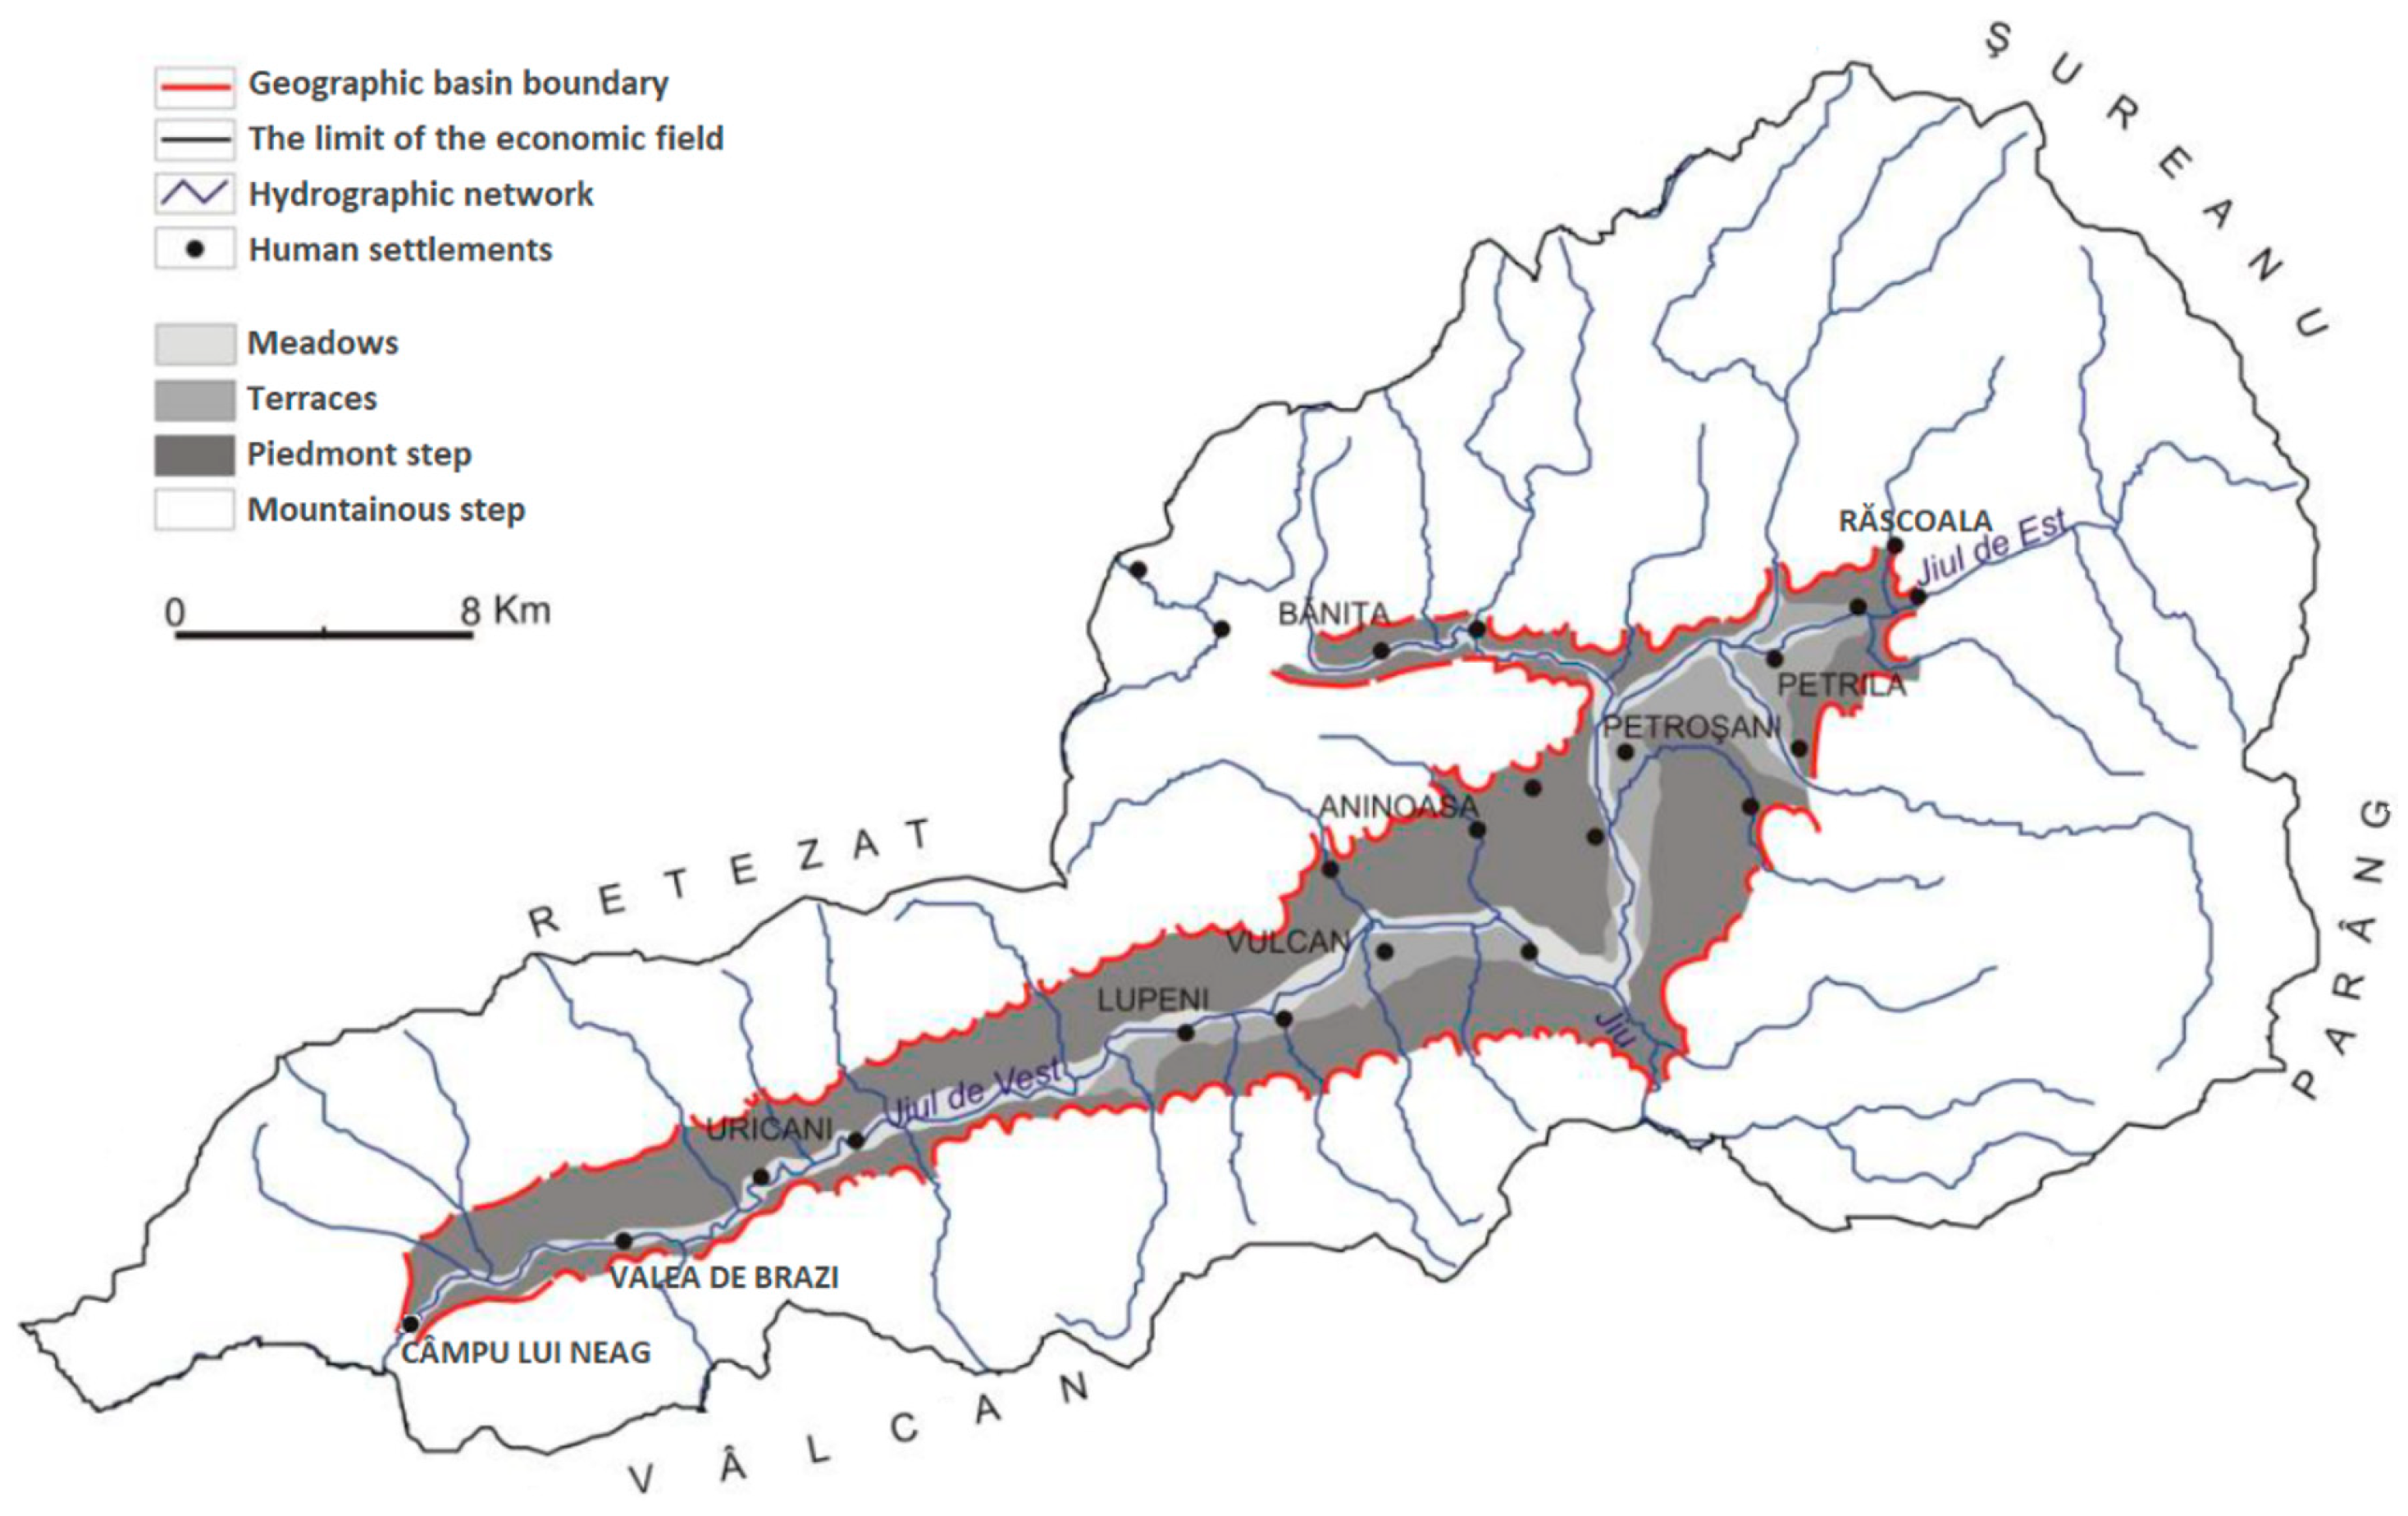
The Petrosani Basin is an intramountain valley located on the upper reaches of the Jiu River and is known for previously being the most important coal basin in Romania (Figure 3). It is located in the south-west of Romania in the south of Hunedoara County, in the Southern Carpathians, between the slopes of the Retezat mountains (W-NW), Șureanu (N-NE), Parâng (E-SE) and Vâlcan (S-SW) with heights of over 1800 m. It has a triangular elongated shape and is oriented V-S-V-E-N-E with a length of 60 km and a maximum width of 9 km [24].
In the process of transition from activities strictly related to mining to diversified economic activities, three parties are involved: mining companies, communities and authorities. Accessibility, mobility and connectivity are essential preconditions for facilitating all activities related to future economic measures, attracting investments, developing tourism and improving the daily routine of transport and mobility for the inhabitants of the Petrosani Basin. Without improving the infrastructure and creating the conditions for easy access and mobility, the area cannot achieve most of its development objectives nor can it acquire cohesion and a foundation to rise to the mobility standards specific to other regions, with the aim of redefining the economic character of the region [2].
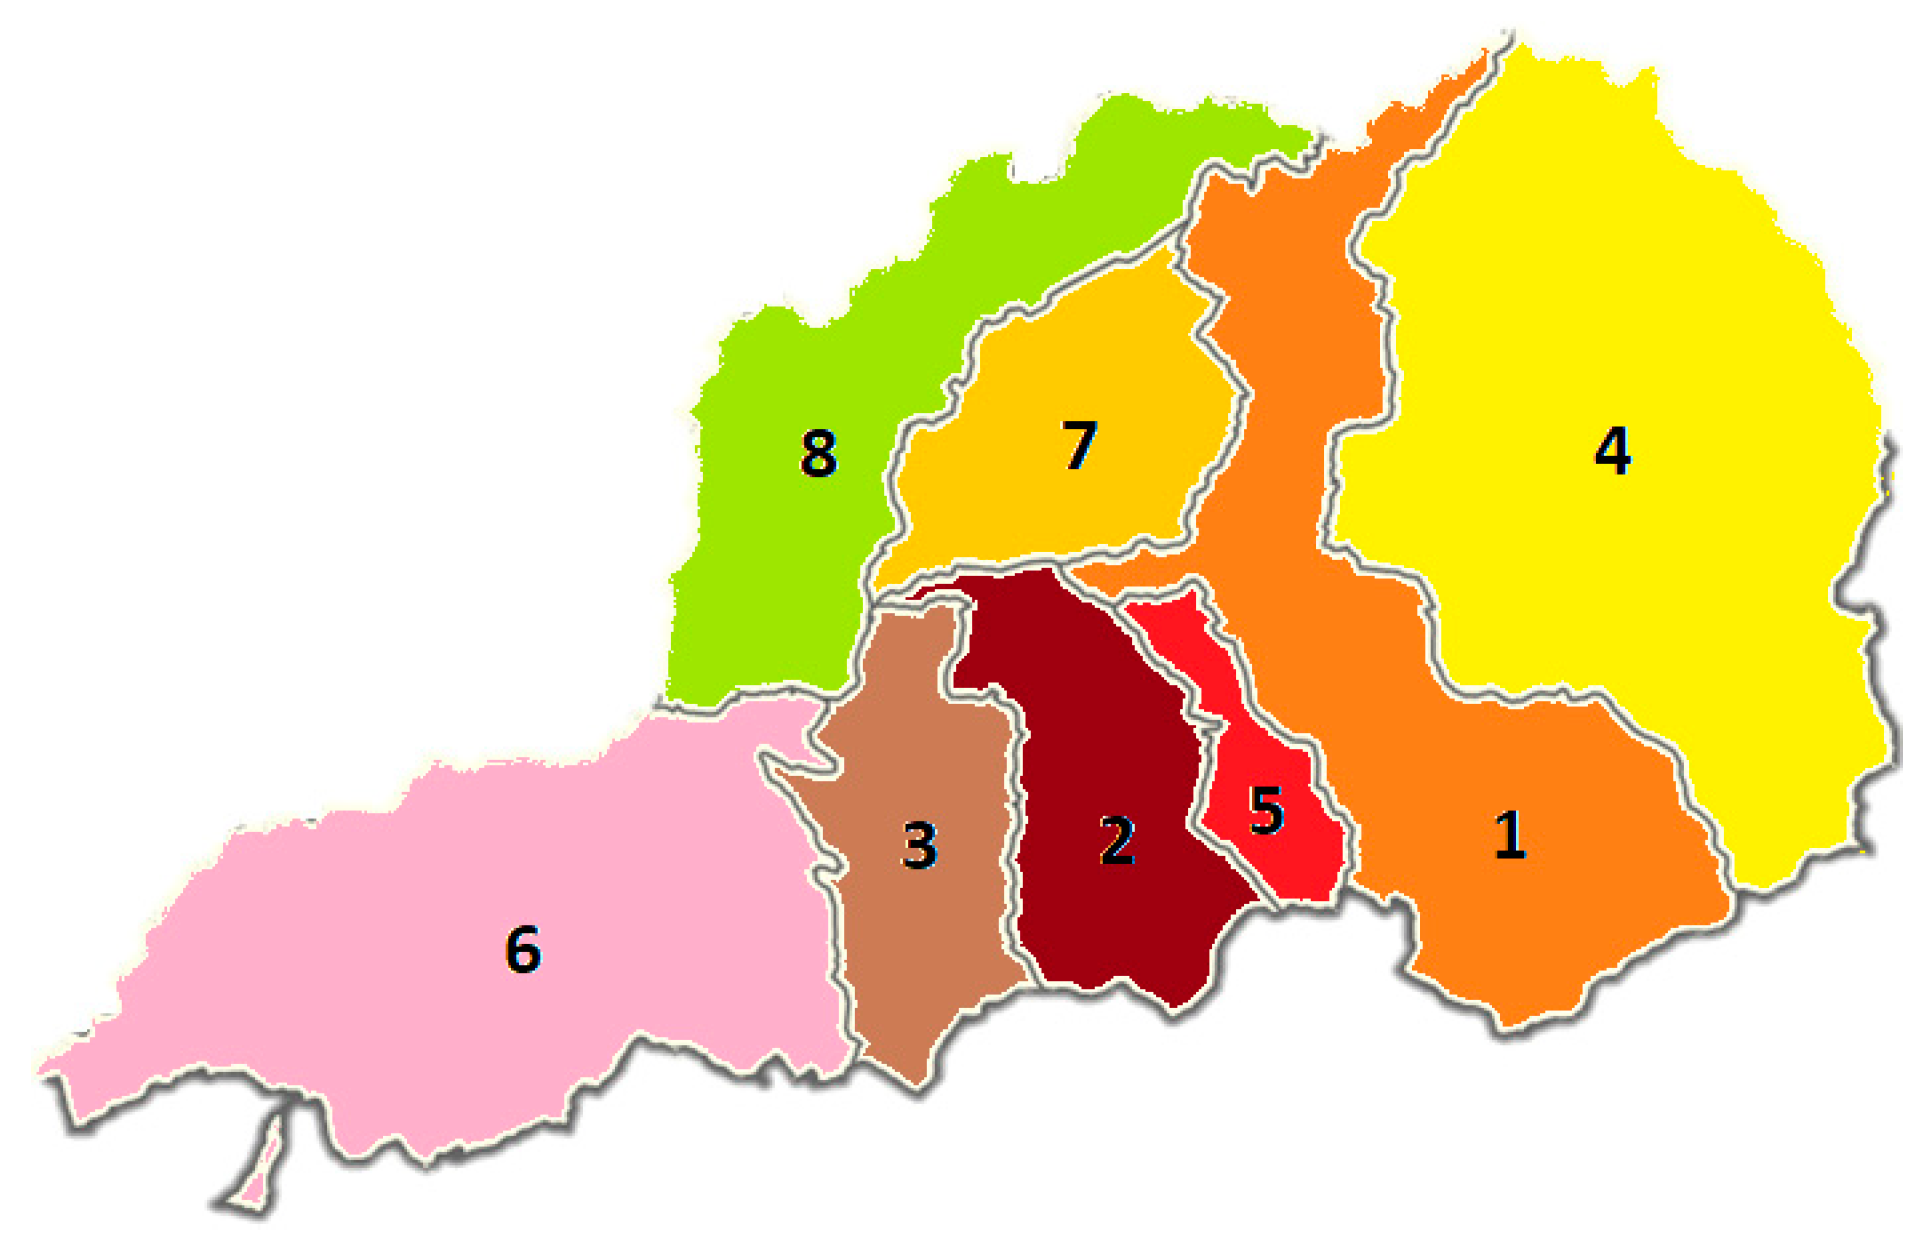
The process of metropolization plays an important role in the development of the European space, a process in which metropolises have become engines of growth and main nodal points of innovation. The European integration of the areas also implies the creation of strategic alliances at the European level, in order to promote growth, competitiveness and global integration. For this purpose, metropolitan areas need real (transport of goods and people by road, railways and air; trade fairs, research and education capacities) and virtual (networks of companies and public bodies) infrastructures [25]. According to Law no. 246/2022 regarding metropolitan areas, a metropolitan territory is the territory around the municipalities, delimited according to this law, within which mutual relations of influence were generated in the field of communication, economic, social, cultural and building infrastructure. Thus, in the Petroșani Basin, 3 (three) metropolitan areas (Table 1, Figure 4) are defined around the municipalities of Petroșani, Vulcan and Lupeni [26]. I mention that, although the territorial-administrative unit Orăștioara de Sus is included in the metropolitan territory of the municipality of Petroșani, it is not the subject of the research in question, because, due to the relief conditions (mountains), the access to the communication routes (only road) is from the municipality of Orăștie.
The metropolitan area includes the territory of the component administrative-territorial units. Metropolitan areas are not administrative-territorial units and do not have legal personality. They are represented from a legal point of view through inter-community development associations, established for this purpose by the member administrative-territorial units [25]. In the Petroșani Basin, the “Green line-Valea Jiului” inter-community development association for regional public transport operates in the field of public transport [27].
3.2. Natural Factors
Urban transport systems are complex networks shaped by various factors (spatial structure and land use pattern, level of economic development, public policies, geographic environment, demographic characteristics and characteristics of public transport services) that affect the demand for public transport. These factors have a significant impact on the attractiveness of public transport [23,28,29,30]. The geographical position of the area, the situation of the natural environment, natural wealth, demographic factors, etc., represent the natural factors that influence the public passenger transport systems.
Access to the Petrosani Basin is achieved as follows:
- By road on the national road DN66 (European road E79) from the south through the Jiu Gorge from Târgu Jiu and from the north through the Bănița Pass (altitude 759 m) from Simeria and on the national road DN7A from the east through the Groapa Seacă Pass (altitude 1575 m) from on the national road DN7 (European road E81);
- By railway on the electrified line 202 Filiași-Simeria through the Jiu Gorge and Bănița Pass, from south to north.
Road and rail access routes to the Petrosani Basin pass through Petrosani Municipality, which is the main access point to the basin and the Bănița and Baru communes. Road access to the other component localities is made either on the national road DN66A (Vulcan, Lupeni, Uricani) or on county roads (Petrila). Until 2017, the towns in the west of the Petroșani Basin (Vulcan, Lupeni) could be accessed by passengers and by train on line 214, and starting from 2023, freight traffic was also closed.
According to [31], the roads in the studied area are framed in mountain relief. The relief area where this study is carried out is located in the Upper Jiu valley (West Jiu and East Jiu) and the valley of the Bănița stream, the localities being organized linearly. The road sectors are presented in the form of a succession of alignments and curves with variable radii (serpentines in the Bănița area) with longitudinal slopes up to 9% in the area of Merișor and Crivadia [32,33].
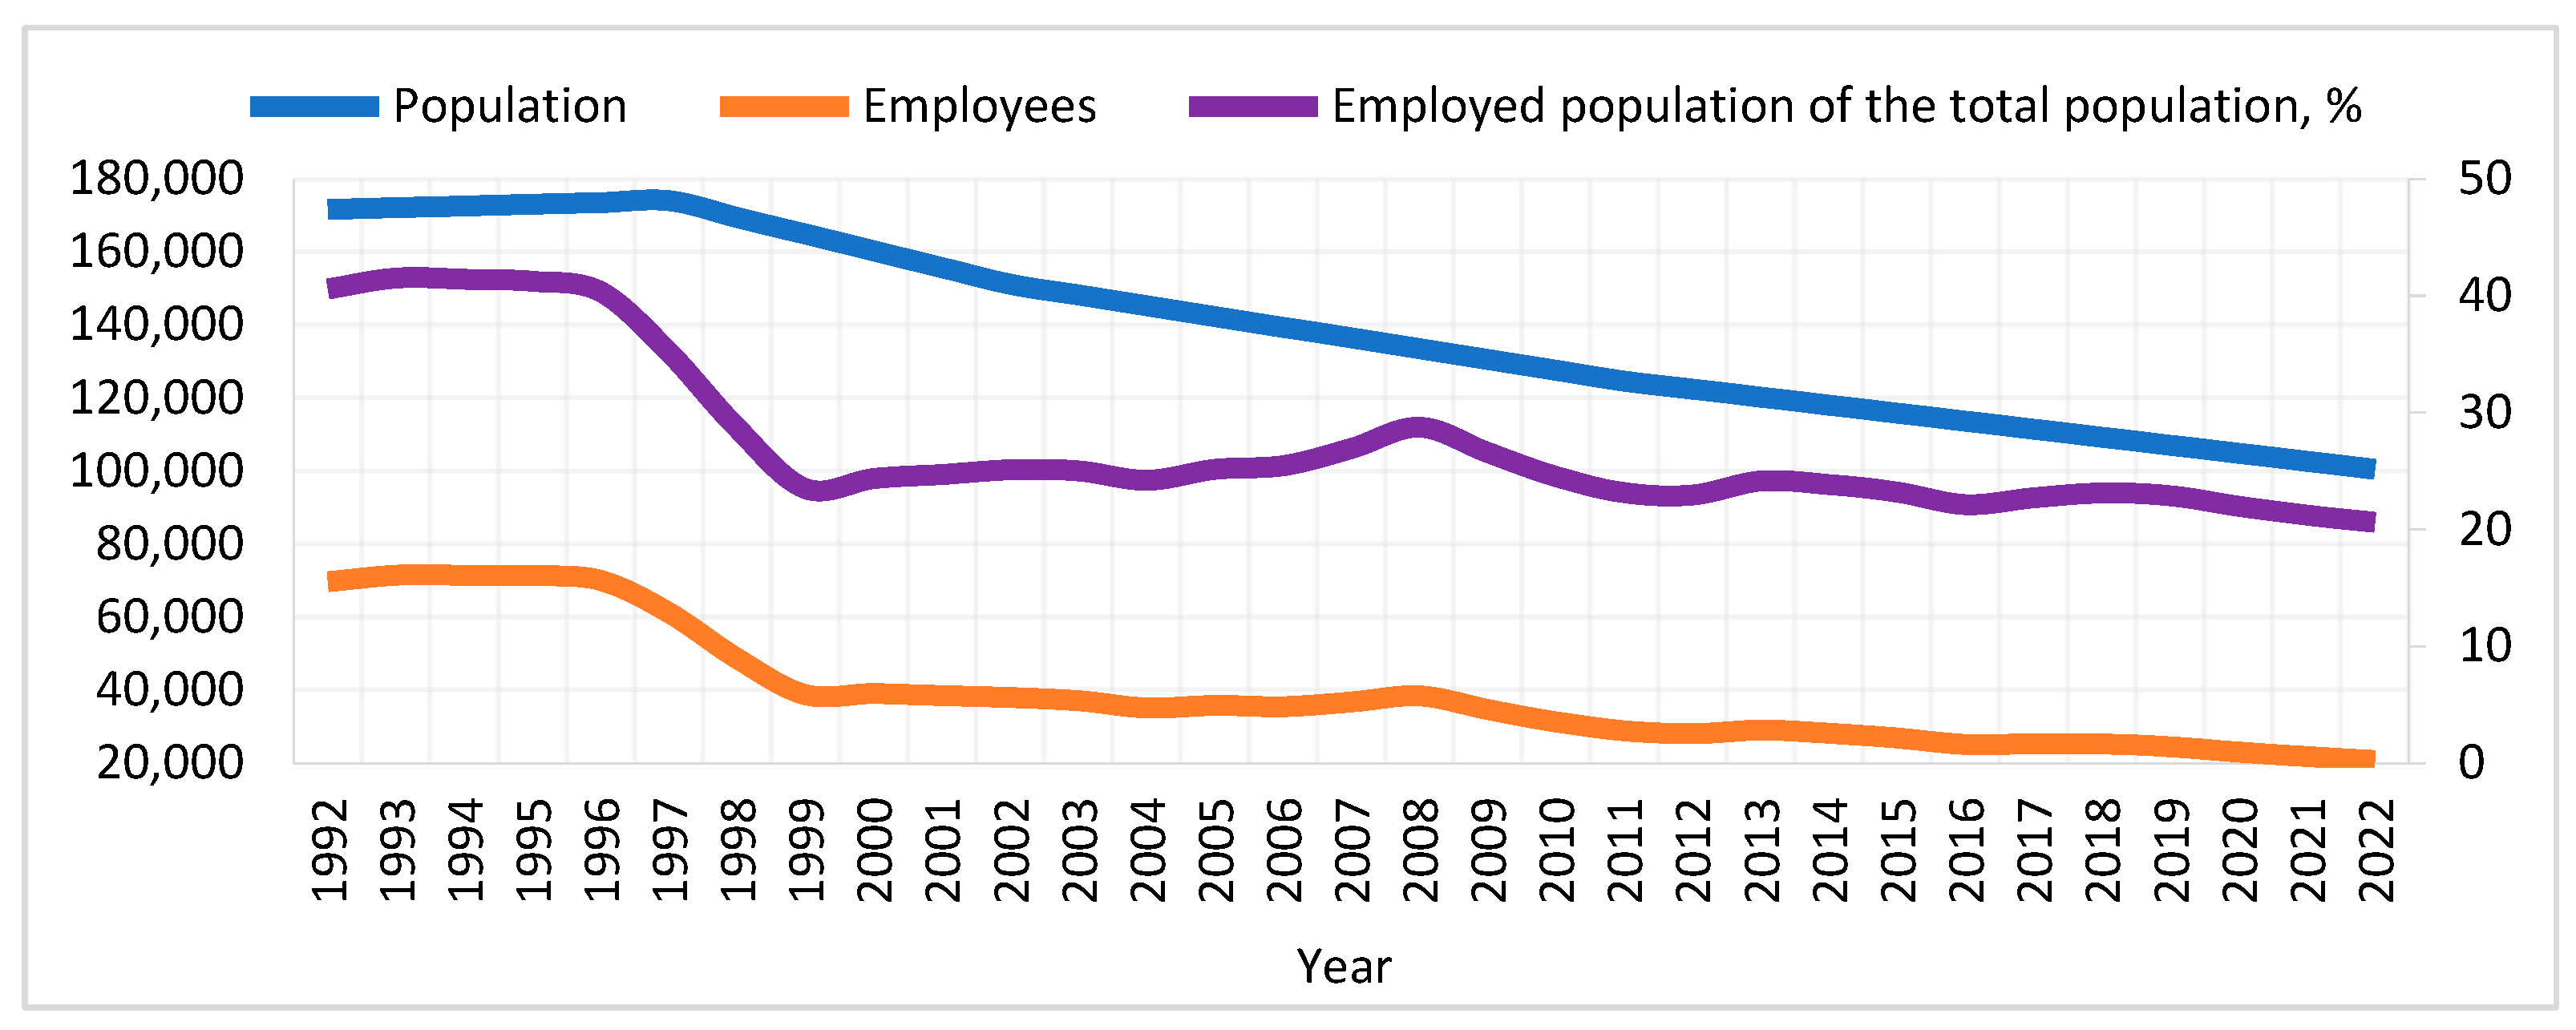
The Petrosani Basin has a high degree of urbanization, forming an urban microregion made up of 7 (seven) territorial administrative units (municipalities: Petrosani—31,044 inhabitants, Vulcan—19,772 inhabitants, Lupeni—18,699 inhabitants, the towns of Petrila—19,600 inhabitants, Aninoasa—3369 inhabitants, Uricani—6669 inhabitants and Bănița commune—1092 inhabitants) to which is added the Baru commune, with 2425 inhabitants, according to Law no. 246/2022. According to the results of the 2021 census, the 8 (eight) administrative-territorial units have a population of 102,670 inhabitants [34]. Compared to 1997, when the historical maximum of 174,000 inhabitants was reached, the population decreased by more than 71,000 inhabitants. Along with the population decrease, the number of employees also decreased from a percentage of approximately 41% in the period 1992–1996 to a percentage of 21% in 2022 of the total population (Figure 5) [5,34,35].
The Government of Romania recognized, through Decision no. 992/1998 regarding the declaration of the Jiu Valley mining area, Hunedoara County as a disadvantaged area for a period of 10 years because of the problems faced by the Petrosani Basin. Through this Decision, various facilities were granted for Romanian commercial companies, legal entities, private entrepreneurs or authorized family associations and for natural persons who have their domicile in a disadvantaged area and who have an income below the average level in the economy [36]. The declaration of these “disadvantaged areas” was a political measure aimed at creating facilities to stimulate investors or to start economic and social development programs, to stop social decline and stimulate economic growth, through the implementation of integrated programs that would impress the areas with a rate of sustainable development. In July 2023, there were approximately 3400 active commercial companies registered in the studied area (Petrosani—1407; Vulcan—541; Lupeni—526; Petrila—481; Uricani—264; Aninoasa—98; Baru—38; Bănita—27), of which almost 900 were active in trade [37]. Other representative economic sectors in terms of the number of economic operators are the manufacturing, transport, construction and tourism industries. The sector with the largest number of employees is represented by the energy sector, with 4000 employees [38], followed by commerce with over 3000 employees, manufacturing (2400 employees) and construction (1100 employees) [39]. Public institutions (administration, health, education, social assistance) also represent an important employer (5000 employees) [5,40,41,42,43,44,45,46,47].
The structure of the population by age groups (Figure 6) highlights the dynamics of the age pyramid and announces future demographic and economic crises [5].
The analysis of the age pyramid highlights the dynamics of certain population groups during the period of economic transition until now. Thus, apart from the generational groups with a large number generated by the pronatalist measures from 1968 to 1972, respectively, the 50–54 age group and the 30–34 age group born after the events of 1989 (when, in the Petrosani Basin, the economic well-being favored a sustained birthrate), the other age groups decrease numerically, not ensuring the biological viability of the area’s future development. It is interesting that, taking into account the industrial history of the area (mining area with underground exploitation, with employee retirement 45 at the earliest), 30% of the population are pensioners [5].
The natural increase in the studied area (Figure 7), i.e., the difference between live births and the number of registered deaths, is negative. If the birth rate started to drop drastically after 1998, from an average of 2500 births in the period 1990–1997, reaching 748 births in 2022, the number of deaths remained roughly constant at 1550 deaths per year in the period 1990–2019. During the 2019–2022 pandemic years, the average number of deaths was 1921 per year [5].
All this was a result of the restructuring of the extractive industry and the massive dismissal of miners, as well as the accentuation of the phenomenon of regressive migration (the return to the areas of origin of a significant part of the population that previously migrated to the Petrosani Basin mining area). In addition, the natural movement is marked by the intensification of the national and international emigration of a significant number of the active population (Figure 8) and the insignificant level of immigration below 1% per year of the number of emigrants [5].
The aforementioned negative demographic dynamics had the effect of the general decrease in the share of young people (0–34 years) in the localities of the studied area from 59.70% of the total population in 1992 to 36.85% in 2022, respectively, the demographic aging and the increase in the share of the elderly (>65 years) from 5.87% in 1992 to 15.41% in 2022 (Figure 6), phenomena that herald a demographic imbalance and a considerable decrease in the share of active people [5].
The analysis of the school population (Figure 9), based on existing statistics [5], reveals a reduction in the number of students in all categories, except for those in post-secondary, professional (which was resumed in 2012) and university education. Knowing the variation in the trend of the number of students, based on the data recorded in the period 1995–2021 and taking into account the trend of the population evolution (Figure 5) and demographic phenomena, birth rate, mortality (Figure 7) and emigration (Figure 8), in the short term the continuation of the reduction in the school population is forecast. The main reason for the reduction in the school population is given by the low birth rate, which is reflected in the young population, aged between 0 and 4, whose share in the total number of inhabitants has decreased considerably (Figure 6).
3.3. Tourism Influence
Tourism represents a field with growth potential, on which the studied area can be based due to the potential of the natural environment [48]. Several localities in the studied area have been declared tourist resorts of national interest (Parâng-Petrosani Area-Government Decision no. 1205/2009) or tourist resorts of local interest (Straja-Lupeni Area-G.D. no. 1110/2002; Uricani City-G.D. no. 843/2021; Vulcan Municipality-G.D. no. 1580/2022) [49], due to the neighboring mountainous areas, but the big tourism development projects in the region have failed in recent years [50].
Consolidation of tourist activity can be achieved based on the concept of sustainable tourism, which is differentiated by quality, accessibility for tourists and in harmony with the natural environment. Tourism can develop satisfactorily only on the assumption that there are sufficient possibilities for accommodation, food, recreation and transport for visitors. That is why the accommodation capacities condition, perhaps to the greatest extent, the volume of tourist activity. From Figure 10, it can be seen that, in total, the number of accommodation units has increased, with tourist cabins predominating [5].
Transport is an integral part of tourism and, without its development, there could not have been such a development of tourism as it actually took place. Sustainable transport and sustainable tourism have a close relationship. Transport to a tourist destination offers opportunities and ways of moving around an area, with importance given to the type of transport, the existing network, traffic management and access to tourist attractions. Transport has an impact on sustainable development, both in terms of access to a tourist destination and movement around the destination area. Individual road transport proved to be very important in tourist travel, mainly in the summer of 2020. It primarily ensured greater safety and certainty that tourists would be able to return home. A private car offers the tourist better protection against the virus (in terms of social distancing and self-isolation). Rail transport is treated as sustainable transport, given its positive significance both for long-distance travel and for circulation around the destination area. Trains are also tourist attractions and evoke emotions. The railway has limitations for tourist use because of traffic restrictions and safety restrictions. During the pandemic, rail transport was considered (and proved to be) more dangerous than individual car travel due to the potential for virus transmission. An emphasis on short-haul tourism has been identified among tourists and was triggered by the COVID-19 pandemic [51,52].
From the analysis of the number of tourists arriving and staying in tourist accommodation units in the area (Figure 11), it can be seen that it increased from 2016 to 2019, followed by a steep decrease in 2020 (the first year of the pandemic). In 2021, there was a revival, even if it was still a pandemic year. It can be observed that of the 8 localities that make up the studied area, Petrosani and Lupeni are the most requested, due to the ski areas Parâng and Straja [5].
Fear of contamination influences people’s willingness to travel and their conditions and preferences for holiday destinations. It can be concluded that COVID-19 has influenced travel patterns and habits and, at least in the medium term, people will avoid traveling in large groups and being in crowded places [53].
3.4. Public Transport Demand
The interurban public transport service addresses the localities in a fragmented manner, with 4 main routes, starting from the Piața Victoriei station in Petrosani (Figure 12 and Figure 13) [42,54,55,56,57]: (1) Petrosani-Vulcan-Lupeni-Uricani (Route 95–29 km); (2) Petrosani-Aninoasa—on the sector Piața Victoriei Petrosani-DN 66A overlaps with the Petrosani-Uricani route (Route 97–17 km); (3) Petrosani-Bănița-Baru (Route 93–22 km); (4) Petrosani-Petrila (Routes 98, 99, 100, 101 and 102 with a maximum length by 14 km).
It should be noted that only the Municipality of Petrosani benefits from local public transport, the routes being different or partially overlapping with the intercity routes. The local public transport network in Petrosani consists of 3 (three) lines (1 main line and 2 secondary lines) (Figure 14) [54], with a total route length of 18.8 km:
- Main line: Piața Victoriei-Aeroport;
- Secondary line 1: Micropiață Aviatorilor-Colonie);
- Secondary line 2: ENEL-Telescaun).
The main line and the secondary line 1 overlap for a significant length of the routes. This situation presents an advantage for the users of the network segments characterized by the concentration of the public transport offer, at the expense of potential travelers located in areas not served by the public transport network.
In general, the demand for maxi-taxi public transport in the studied area was negatively influenced by the decrease in the population (Figure 5) and the increase in the number of personal cars but also by the competition of taxi companies. The competition from the taxi companies arises because they carry out transport at the same price/trip (for 3–4 passengers) as the maxi-taxi companies. Thus, the transport is advantageous both for the taxi company (large number of trips) and for travelers (short waiting time, speed and comfort). A negative influence on public transport, but with a positive connotation, is also caused by the introduction of student transport minibuses [58]. Of course, the increase in transport tariffs in the economic context of the COVID-19 pandemic and the war in Ukraine had a negative influence on the demand for public transport. The year 2020 has a special significance, being the year in which the COVID-19 pandemic broke out, which led to the imposition of movement restrictions for the population [56,57]. In a matter of weeks, the COVID-19 pandemic has become the biggest economic crisis for public transport services in decades. In the context of public transport, system performance can be measured in terms of the initial capacity share provided, the total number of passengers carried, the total passenger-km and the total passenger time lost attributable to the disruption. Demand for public transport is usually derived demand, meaning people travel because of the activities they need to do at their destination. The differences in the perception of the risk of the coronavirus varied according to age, and this was manifested by changes in their mobility. Therefore, reducing occupancy levels in stations and in vehicles is not only achievable through supply-oriented measures but also requires the implementation of demand management measures [59,60]. Furthermore, due to restricted mobility, trips to schools and offices have been reduced to almost zero. Travel restrictions and stay-at-home policies have made stationary work and learning shift to e-learning and online work [61,62].
It is clear that the COVID-19 pandemic has had a significant influence on travel patterns and leads people to use private vehicles (cars, bicycles, micromobility) more. Although mobility has been significantly reduced by isolation and an increase in remote working, some residents have changed their transport behavior by switching to cars and, to a lesser extent, bicycles [62,63]. To make up for the lack of passengers, the two public transport operators have also made changes to the hourly frequency of minibuses on all transport routes (Figure 15) [56,57].
According to Sustainable Development Goal 11 [64,65], access to public transport is considered convenient when an officially recognized station is accessible within walking distance along the street network of 500 m from a reference point such as a house, school, workplace, market, etc. to a low-capacity public transport system (for example, bus) and/or 1 km to a high-capacity system (in the case of the Petrosani Basin, rail). In the Petrosani Basin, due to the configuration of the street networks of the component localities, the accessibility of low-capacity public transport stations is very good, respecting this criterion according to the “Road transport program against the cost of people through regular services”, at the level of Hunedoara County [56]. The towns of Petrosani, Baru and Bănița also meet the criterion of high-capacity public transport systems, having railway stations. Additional criteria for defining public transport that is convenient include the following [64]:
- Public transport accessible to all special-needs customers, including those who are physically, visually and/or hearing-impaired, as well as those with temporary disabilities, the elderly, children and other people in vulnerable situations;
- Public transport with frequent service during peak travel times;
- Stops present a safe and comfortable station environment.
People’s decision to travel in a certain way is determined by factors such as season, weather, social environment, time perspective, health status, income, market competition, preferences, service quality, etc. The reasons why people travel are varied: going to work, to school, to the store, to the doctor, visiting relatives, business trips, pleasure trips, etc. The factors influencing transport demand are highlighted in the following relationship:
where Qt [t·km or passenger·km] is the performance or volume of transport; Ps is the cost of transport; Pc is the cost of related services; V is the related income; Pa is the anticipated price of the goods moved; Pr is consumer preferences; Ds is the spatial distribution of customers [30].
Qt = f (Ps, Pc, V, Pa, Pr, Ds),
Carrying out economic activities involves the generation of trips with an important weight in the case of passenger transport. The demand for transport that aims to travel to and from the workplace is also influenced by the fact that the number of employees in the studied area decreased from 42% in 1993 to 21% in 2022 of the total population (Figure 5).
Also, educational units represent poles of attraction/generation of trips at the level of a locality, which must be given special attention from the point of view of accessibility and traffic safety. Although a reduction in the school population is expected in the coming period (Figure 9), the same cannot be estimated in relation to the number of trips made for student transport. Increasingly, there are cases where children do not study at the school in the area of residence, the parents directing them to educational institutions in other areas (generally depending on their prestige), but there are also cases of closed schools (Figure 16) [5]. For these reasons, trips aimed at taking/bringing children to/from school are becoming more and more numerous and are generally carried out by personal car. Here it can be remembered that in the studied area, the number of registered cars increased (Figure 17) [35], following the growth trend at the national level (Figure 18) [5].
Public transport demand represented in the number of passengers per hour is shown in Figure 19 [55].
The Petrosani-Baru route is part of the Petrosani-Deva interurban route (Deva being the county seat municipality), and the number of passengers for the Bănița and Baru destinations is relatively small and consists mainly of employees and students. Also, on the Petrosani-Uricani (33 stations) and Petrosani-Aninoasa (22 stations) routes, 11 (eleven) stations are shared, of which 3 (three) are also shared with the local route from Petrosani, and on 4 (four) of the 5 (five) Petrosani-Petrila routes out of a total of 17 (seventeen) stations, 11 (eleven) stations are common [56]. The estimated demand for public transport in the Petrosani Basin is approximately 1,100,000 trips per year (Figure 20) with a downward trend.
That public transport was less used during the pandemic can also be seen from the economic data of the two transport operators, ZMK (Figure 21) and Stalone Com (Figure 22) [37]. Thus, it can be seen that the pandemic year 2020 led to a sharp decrease in turnover, profit and the number of employees. The following years, 2021 and 2022, marked a return of these indicators but without reaching the pre-pandemic levels.
3.5. Quality of Public Transport Services
Quality is the attribute that highlights the performance of a public transport system. To make public transport services more attractive and thereby reduce car use, cities as well as public transport companies should be keen to ensure a high quality of service on the public transport system, amongst others, by implementing the following measures [66]:
- Widening and simplifying the public transport network;
- Modernizing the infrastructure (especially at intermodal interchanges) and making the entire voyage by public transport more comfortable;
- Enhancing the accessibility for all persons, especially for people with special needs;
- Improving the safety and security at stations, at stops and on the vehicles for passengers and drivers, as well as for infrastructural equipment.
The characteristics of the public transport used to establish service levels are as follows: travel time; headway; transfers; fare collection; speed adjustment and values; delay; density; passenger comfort; acceleration; jerk; temperature; ventilation; noise; and vibration [67].
In order to travel by public transport, it is necessary that the transport service is accessible at the point of origin. Accessibility at the station level is measured by the frequency of the service, which represents how many times in an hour a traveler can access public transport, assuming that the service is offered at a reasonable walking distance and during the period in which the journey is desired. The frequency of the service is a component of the total duration of the trip, based on which the waiting time in the station and the average interval between vehicles are determined. Table 2 shows the service quality levels for both intervals and frequency [68].
In selecting a transit mode, most passengers regard travel time as the most important factor. Thus, people may be discouraged from using public transport if the time between departures is excessive. Speed and delay are service characteristics that relate to travel time. From the statistical data of the traffic tracking program, the tracking intervals between vehicles at moments considered to be peak traffic moments were highlighted. In addition, it reveals which routes and time periods need to improve the service level. [69]. The theoretical levels of service quality were established for the public transport routes under analysis (Table 3). Depending on the time interval and the nature of the transport demand registered on the route, the levels of service of the 4 (four) routes vary between level A for the Petrosani-Uricani and Petrosani-Petrila interurban routes and the local route from Petrosani Piața Victoriei-Aeroport in the time interval 06:00–16:00 and F for the Petroșani-Baru interurban route in the time interval 15:00–17:00.
The days when students are in class were chosen for analysis because the transport demand for the public transport system is higher and also coincides with an increased intensity of road traffic. Due to the complexity of the evaluation factors and the difficulties in quantifying the qualitative indicators, it is difficult to accurately describe the objective reality yet find closed-form solutions for the optimal state-dependent traffic intensity and the optimal service rate-switching state [70]. In order to increase the quality of service, in the reference [71] the importance of the empirical analysis of the vehicle arrival process is highlighted. It uses the matrix geometric method to model traffic flow at the toll station, resulting in the inter-arrival times of the vehicles within the duration of one hour following an exponential distribution and the rates are time-dependent during different times of the day. Levels of comfort on public transport systems also are affected by temperature, odor, ventilation, noise, vibration, acceleration, deceleration and position change (or jerk). An important role in the comfort of the public transport user is also played by the terminals and stations, which in the Petroșani Basin are not at an acceptable level or are missing (Figure 23—October 2022; Figure 24—July 2023) [54].
4. What Is Next
Through “The New EU Urban Mobility Framework”, the European Commission proposes measures to encourage EU member states to develop urban transport systems that are safe, accessible, inclusive, affordable, smart, resilient and emission-free. Thus, the construction and modernization of multimodal hubs, as well as new digital solutions and services, are prioritized. This promotes a coherent and integrated approach to urban mobility planning, while developing funding options for local and regional authorities to implement priority actions. The New EU Urban Mobility Framework also draws lessons from the effect of COVID-19 on public transport to help the transition to a climate-neutral economy and zero-emission transportation at the local level. The development of urban transport is a priority, and the reduction in the negative effects on the environment, such as polluting emissions or the replacement of the fleet with a more ecological one, is subject to the requirements of the European Union [72].
The European Union, through its regulations, provides funds for investments to achieve clean and sustainable multimodal mobility, with an emphasis on public transport, shared mobility, walking and cycling, as part of the transition to a zero-emissions economy of carbon, [73]. In the funding period 2021–2027, several European and national funding and funding instruments, such as the Connecting Europe Facility, InvestEU, the European Regional Development Fund, the Cohesion Fund, the Horizon Europe R&I Framework Program, the Digital Europe Program and Recovery and the Facility of Resilience, are available to support the transition to sustainable urban mobility [72].
For this, Sustainable Urban Mobility Plans (SUMPs), planning tools for cities that encourage joint decision-making across sectors and between stakeholders, are used to deliver sustainable and high-quality mobility. The SUMP concept was developed by the European Commission, and many support measures are provided at the European level to help cities transition to more sustainable transport solutions [74]. SUMP is both a requirement for attracting non-reimbursable funds for urban development but also a necessity and first solution for addressing traffic-related issues in an integrated and strategic way, whether we are talking about people or goods, such as urban, inter-county and adjacent mobility issues.
Thus, Hunedoara County Council approved, in 2018 (updated in 2022), the Sustainable Urban Mobility Plan for the implementation of the regional development project for a “Green line of electric buses between Petrila-Petrosani-Aninoasa-Vulcan-Lupeni-Uricani Green Line Jiu Valley” [56]. The project, through its two components, has a value of 19,221,643 euros, of which non-reimbursable EU funds of 16,768,656 euros. The implementation of the project provides for the following: the purchase of 26 electric buses with a length of 8–10 m; setting up a bus base in Vulcan municipality; construction/modernization of 112 public transport stations; building 34 charging stations for electric buses and 2 charging stations for electric cars; equipping machines for issuing travel tickets in 20 stations; implementation of an e-ticketing system; dispatching, GPS monitoring and video surveillance in buses; creation of a website, a mobile application and provision of information systems for passengers in 42 stations [75]. Achievements in this project include the signing of contracts for the purchase of electric buses and charging stations on 25 April 2023 [76] and the start of construction of the bus depot on 20 September 2023 [77].
Separately from this project, the Municipality of Petrosani in partnership with the Commune of Bănița is starting the project with the title “Realization of local electric public transport in the Municipality of Petrosani and towards the Commune of Bănița”, financed by European funds through the National Recovery and Resilience Plan of Romania, Component C10—Fund Local, Intervention axis 1.1-Sustainable urban mobility, Investment 1.1.1—Renewal of the fleet of vehicles intended for public transport (purchase of non-polluting vehicles), in the amount of 3,402,622 euros. The specific objective of the project is the purchase of seven non-polluting electric buses of 10 m, two fast charging stations located at the ends of the route and seven slow charging stations—one for each vehicle purchased. On 9 August 2023, the auction for the purchase of non-polluting electric buses was launched [78].
5. Discussion
Mobility and especially public transport could contribute to the spread of the disease due to closed spaces and overcrowding. On the other hand, the social distancing that epidemiologists encourage, i.e., at least 1.5 m distance between individuals, is incompatible with public transport. Public transport ridership has suffered greatly due to concerns about sharing confined space with many others during a pandemic [81,82]. As the statistics show, the changes in public transport caused by the presence of several policies to lock down and lift COVID-19 were first decreasing and then only partially recovering [83,84].
Public transport, on the other hand, suffered greatly in the perception of transport users. The population perceived public transport as less convenient, with the results indicating that public transport lost ground during the particularly tight lockdown period, while individual modes of transport, particularly the private car, became more important. In terms of public transport passengers’ perceived health safety, the results revealed a significant mode shift from public transport to private cars for long distances (over 5 km) [85]. In Germany, single-user car use rose from 53% before the lockdown to 66% during the lockdown [86]. Surprisingly, captive users of public transport and non-motorized transport modes (walking) are also willing to make a switch to private motor vehicles [13]. Thus, the use of private vehicles still has a considerable role in urban transport, and this, which is noteworthy, is due to the sharp decrease in public transport in January–April 2020 and the small percentage of shared vehicles (1%) [82]. Private mode users perceived existing modes of travel as safer than others. People perceived a high risk of viral transmission in public transport (bus). On the other hand, they perceived a moderate risk in shared modes and a very low risk in private modes [87].
Substitution of public transport travel for less sustainable ones leads to an increase in travel resources and private vehicle use, as seen in the results, and this change may persist in the post-pandemic period. Analyses show that increased service frequency and comfort in urban public transport and a decrease in costs and travel time would mitigate these negative impacts. Policy evaluations for a sustainable and resilient recovery show that incentives such as public transport fare reductions have a positive impact on its share due to the mobility shift to the private motor vehicle [7,13]. This finding resonates with a study, which highlighted punctuality, affordable cost and comfortable experience as factors attributed to commuters’ subjective experience of traffic congestion and ultimately influenced their travel behavior [88]. To attract the population to sustainable public transport, free travel can be introduced for a limited period of time, during which the users’ perception of the quality of sustainable public transport (comfort, punctuality, frequency, direct travel and accessibility) should be positive and lead to an increase in demand. The implementation of free travel should be adapted, selectively, to the specifics of a certain area. More than 50 cities and municipalities in Europe have now introduced free public transport, citing climate ambitions and social equality as the main motivations [89]. Among these are mining towns like Polkowice and Lubin in Poland. Two European countries stand out for their innovative free transport schemes. The capital of Estonia introduced free public transport in 2013 for all registered Tallinn residents. In 2020, Luxembourg became the first country in the world to abolish fares for all public transport [90]. However, the fare-free public transport policy may be a temporary incentive, as it imposes a large burden on the local public administration and the transport operator, and especially as the COVID-19 pandemic has shown that the fare-free transport is not a generally valid tool for balancing mobility [91]. Findings also show that there is demand and willingness to pay extra for safer, faster, cleaner, comfortable and, most importantly, resilient public transport [13].
In this emerging transition and given that support is now massive, the opportunity must be seized by adapting cities to the needs arising from the COVID-19 pandemic and also by driving the changes necessary to mitigate the effects (climate change, inequity and the economic crisis imminent) of our unsustainable mobility habits [92]. Awareness of the need to sustain the share of public transport in cities is crucial not only for those without access to private vehicles, wage earners essential for their daily journeys but also for maintaining sustainability in growing cities [13]. Stakeholders need to take policy action to restore trust in public transport, focusing on providing affordable public transport and establishing better access and connectivity between homes and workplaces [93].
The resolution of the European Parliament on 13 November 2020 on the Investment Plan for a sustainable Europe—financing modalities of the Green Deal (2020/2058(INI))—shows that public transport is essential for achieving sustainable urban mobility [94]. The COVID-19 pandemic represents an opportunity to rethink travel behavior and thus incorporate more sustainability. Sustainable mobility projects are usually considered as part of soft and small-scale interventions that mainly focus on aesthetics, and car traffic is usually reorganized and emphasis is placed on public transport and non-motorized mobility (cyclists and micromobility users), while pedestrian traffic is reinforced [83].
The pandemic and the various mobility restrictions have highlighted the need for more agile and less collective forms of transport services, representing an opportunity for the development of new public-private transport services that contribute to sustainability, resilience, the mitigation of climate change and population health. The COVID-19 pandemic has also revealed political and public support for soft and personal forms of mobility [95].
A longer period of recovery of public transport systems is likely to shift urban cities towards car-dependent modes or private motorized transport modes in the absence of alternative safe and disaster-resilient mobility options. The pandemic has made it clear that digital infrastructure is of paramount importance in building a modern and resilient economy that can continue to function without being so reliant on the transport of people, and this is essential to consider in public transport plans. Data is proliferating with the use of mobile phones and the mobile internet, which can be harnessed by both the public and private sectors to improve transport services and provide more evidence for financial institutions investing in transport projects [13,96,97].
6. Conclusions
The research was conducted to address a threefold objective for the study area: (1) to examine the current state of the public transport system and its development prospects; (2) to understand how economic and social changes (inherent in the study area) influence public transport service; (3) to observe the impact of the COVID-19 pandemic. In summary, several conclusions emerge. First of all, it can be said that the current public transport system in the studied area meets the transport demand in terms of spatial accessibility, carrying capacity, comfort (only seats) and time-frequency. Secondly, the public transport system is not adequate in terms of the technical condition of the minibus fleet (Euro 5 and below). Thirdly, the comfort and safety of passengers do not meet the current requirements: lack of air conditioning in the means of transport; inadequate stations; lack of a modern charging system (ticket machines; e-ticketing); lack of means of information in the stations; lack of a web page; lack of a mobile phone app, etc. Fourth, there are no intermodal terminals. Taking into account the fact that most localities in the studied area have been declared tourist resorts of national or local interest, more emphasis should be placed on how to reach a tourist destination. At the same time, there is a need for better use of resources, allocated more fairly and used more sparingly.
The downward trend of the total population and the employed and school population, but also the increase in the number of personal cars, led to a reduction in the number of public transport users. To keep the public transport system in a sustainable and safe position, taking into account the priorities of passengers, local decision-makers must demonstrate that they have the capacity to manage the problems of the communities they represent. Also (the studied area is a closed mountainous area), maybe the decision-makers will understand that only a unitary association, established for a determined or indefinite period, can facilitate the development of the economic activities of its members as well as improve the results of those activities. Depending on the degree of commitment and the will of Public Administrations, citizens can also be co-designers of the new public space. However, in each case, it is suggested to include citizens in the monitoring process to preserve self-involvement in each measure [92].
The decline in the use of urban public transport in the study area is a change in mobility that was already taking place before the pandemic and was intensified during the pandemic. The pandemic has greatly affected public transport, and the effects it will bring in the long term are difficult to predict. However, the consequences of COVID-19 may, with the involvement of the authorities, provide an impetus for individuals to change their travel habits and explore alternative travel options. Thus, the COVID-19 pandemic has confirmed that the state of the public transport system depends to a large extent on the possibilities of the municipality to organize external financing of the unprofitable activity of the transporter, given the fact that there is a decrease in the demand for transport services and the solvency of the population [7,51,98,99]. However, maintaining the public transport system in a sustainable position, taking into account environmental and epidemiological issues, passenger priorities and economic impact, requires not only infrastructure that supports equity and inclusion by allocating places and spaces in public transport systems and raising public awareness about the specific needs and rights of older people and persons with disabilities but also a coordinated and integrated public transport system. [80,100,101]. Public transport, despite its temporary ridership issues caused by COVID-19, should be the cornerstone of an urban transport system, and even active travel prioritization plans should include interventions to improve public transport. Stakeholder participation in complex, multi-criteria decision-making often produces very different results in prioritizing the decision attributes of public transport service quality. In order to effectively recover ridership levels and make the system work profitably, it is necessary to clarify the type of passengers, rather than all passengers, who should be targeted to promote the use of public transport [81,83,102].
Funding
This research received no external funding.
Institutional Review Board Statement
Not applicable.
Informed Consent Statement
Not applicable.
Data Availability Statement
Data are contained within the article.
Conflicts of Interest
The author declares no conflict of interest.
References
- European Parliament. Fact Sheets on the European Union. Available online: https://www.europarl.europa.eu/factsheets/en/sheet/93/economic-social-and-territorial-cohesion (accessed on 18 August 2023).
- General Secretariat of the Government of Romania. The Economic, Social and Environmental Development Strategy of the Jiu Valley (2022–2030). Available online: https://sgg.gov.ro/1/wp-content/uploads/2022/07/ANEXA-26.pdf (accessed on 31 July 2023).
- Wikipedia. Mineriad. Available online: https://en.wikipedia.org/wiki/Mineriad (accessed on 11 August 2023).
- Digi 24. Photo Gallery. Public Transport in the Communist Period. Available online: https://www.digi24.ro/magazin/timp-liber/divertisment/galerie-foto-transportul-public-in-perioada-comunista-508578 (accessed on 26 August 2023).
- National Institute of Statistics, Romania. Available online: https://insse.ro/cms/ (accessed on 28 August 2023).
- Candido, D.S.; Claro, I.M.; de Jesus, J.G.; Souza, W.M.; Moreira, F.R.R.; Dellicour, S.; Mellan, T.A.; Plessis, L.D.; Pereira, R.H.M.; Sales, F.C.S.; et al. Evolution and Epidemic Spread of SARS-CoV-2 in Brazil. Science 2020, 369, 1255–1260. [Google Scholar] [CrossRef] [PubMed]
- Costa, C.S.; Pitombo, C.S.; Souza, F.L.U.d. Travel Behavior before and during the COVID-19 Pandemic in Brazil: Mobility Changes and Transport Policies for a Sustainable Transportation System in the Post-Pandemic Period. Sustainability 2022, 14, 4573. [Google Scholar] [CrossRef]
- Legislative Portal. DECREE no. 195 of 16 March 2020 Regarding the Establishment of the State of Emergency on the Territory of Romania. Available online: https://legislatie.just.ro/Public/DetaliiDocumentAfis/223831 (accessed on 25 July 2023).
- Legislative Portal. DECISION no. 394 of 18 May 2020 Regarding the Declaration of the State of Alert and the Measures that Apply During it to Prevent and Combat the Effects of the COVID-19 Pandemic. Available online: https://legislatie.just.ro/Public/DetaliiDocumentAfis/226373 (accessed on 25 July 2023).
- Legislative Portal. DECISION no. 16 of 8 March 2022 for the Repeal of the Decision of the National Committee for Emergency Situations no. 6/2022 Regarding the Procedure for Approving the Rules for Applying the Quarantine Measure on Individuals. Available online: https://legislatie.just.ro/Public/DetaliiDocument/252468 (accessed on 25 July 2023).
- Radio Romania, RADOR Press Agency. The municipalities of Petrosani and Brad, as Well as the City of Simeria, Enter Quarantine. Available online: https://www.rador.ro/2021/03/22/municipiile-petrosani-si-brad-dar-si-orasul-simeria-intra-in-carantina/ (accessed on 25 July 2023).
- Graphs.ro. Google Mobility Data for Romania. Available online: https://www.graphs.ro/covid_google2.php?range=full (accessed on 17 September 2023).
- Thombre, A.; Agarwal, A. A Paradigm Shift in Urban Mobility: Policy Insights from Travel Before and After COVID-19 to Seize the Opportunity. Transp. Policy 2021, 110, 335–353. [Google Scholar] [CrossRef] [PubMed]
- Graphs.ro. Apple Mobility Data for Romania. Available online: https://www.graphs.ro/covid_apple_ro2.php?range=full (accessed on 19 July 2023).
- Wielechowski, M.; Czech, K.; Grzęda, Ł. Decline in Mobility: Public Transport in Poland in the Time of the COVID-19 Pandemic. Economies 2020, 8, 78. [Google Scholar] [CrossRef]
- Kanda, W.; Kivimaa, P. What Opportunities Could the COVID-19 Outbreak Offer for Sustainability Transitions Research on Electricity and Mobility? Energy Res. Soc. Sci. 2020, 68, 101666. [Google Scholar] [CrossRef] [PubMed]
- Raicu, S.; Costescu, D.; Popa, M.; Rosca, M.A. Including Negative Externalities During Transport Infrastructure Construction in Assessment of Investment Projects. Eur. Transp. Res. Rev. 2019, 11, 24. [Google Scholar] [CrossRef]
- de Haas, M.; Faber, R.; Hamersma, M. How COVID-19 and the Dutch ‘intelligent lockdown’ change activities, work and travel behaviour: Evidence from longitudinal data in the Netherlands. Transp. Res. Interdiscip. Perspect. 2020, 6, 100150. [Google Scholar] [CrossRef] [PubMed]
- Bucsky, P. Modal share changes due to COVID-19: The case of Budapest. Transp. Res. Interdiscip. Perspect. 2020, 8, 100141. [Google Scholar] [CrossRef]
- Ranga, B.; Singh, K.; Ranga, I.; Gantait, A. Analyzing the Effect of COVID-19 Pandemic on Tourists’ Psyche and Effective Implications for the Public Transport System for Safe-Travel: A Case Study on India. Afro Eurasian Stud. 2022, 10, 27–46. [Google Scholar] [CrossRef]
- Rodríguez González, A.B.; Wilby, M.R.; Vinagre Díaz, J.J.; Fernández Pozo, R. Characterization of COVID-19′s Impact on Mobility and Short-Term Prediction of Public Transport Demand in a Mid-Size City in Spain. Sensors 2021, 21, 6574. [Google Scholar] [CrossRef]
- Zhou, H.; Wang, Y.; Huscroft, J.R.; Bai, K. Impacts of COVID-19 and Anti-Pandemic Policies on Urban Transport—An Empirical Study in China. Transp. Policy 2021, 110, 135–149. [Google Scholar] [CrossRef] [PubMed]
- Zhang, C.; Wang, M.; Dong, J.; Lu, W.; Liu, Y.; Ni, A.; Yu, X. Factors and Mechanism Affecting the Attractiveness of Public Transport: Macroscopic and Microscopic Perspectives. J. Adv. Transp. 2022, 2022, 5048678. [Google Scholar] [CrossRef]
- Costache, A. Vulnerability of Human Settlements and Social Risks in the Petrosani Basin; Transversal: Târgoviște, Romania, 2020; pp. 13–37. [Google Scholar]
- Federation of Metropolitan Areas and Urban Aggregations in Romania. Guide to Local Development at Urban and Metropolitan Level. Available online: https://fzmaur.ro/wordpress/wp-content/uploads/2023/07/Ghid-dezvoltare-metropolitana-compressed_compressed-1-1.pdf (accessed on 17 August 2023).
- Legislative Portal. LAW no. 246 of 20 July 2022 Regarding Metropolitan Areas, as Well as for the Modification and Completion of Some Normative Acts. Available online: https://legislatie.just.ro/Public/DetaliiDocumentAfis/257798 (accessed on 23 July 2023).
- Intercommunity Development Association for Zonal Public Transport, Green Line—Jiu Valley. Available online: https://www.adigreenlinevj.ro/ (accessed on 11 September 2023).
- Wang, J.; Lu, H.; Peng, H. System Dynamics Model of Urban Transportation System and Its Application. J. Transp. Syst. Eng. Inf. Technol. 2008, 8, 83–89. [Google Scholar] [CrossRef]
- Aljoufie, M.; Zuidgeest, M.; Brussel, M.; van Maarseveen, M. Spatial–Temporal Analysis of Urban Growth and Transportation in Jeddah City, Saudi Arabia. Cities 2013, 31, 57–68. [Google Scholar] [CrossRef]
- Boroiu, A.A.; Neagu, E.; Boroiu, A.; Vieru, I. Proposals for the reorganization of road traffic in the central area of Pitesti municipality based on microsimulation-performed traffic analyses. IOP Conference, Series: Materials Science and Engineering; IOP Publishing Ltd.: Bristol, UK, 2018; Volume 444, Issue 7; p. 072021. [Google Scholar]
- Academia. The First Group of RO Projects Revised June 2009. Available online: https://www.academia.edu/7350592/Primul_grup_de_proiecte_RO_Revizuit_Iunie_2009 (accessed on 22 August 2023).
- Romanian Government. Foundation Note to Government Decision no. 30 /2011 for the Approval of the Technical-Economic Indicators of the Investment Objective ”Rehabilitation of DN 66, section Petrosani-Simeria, km 136+000–km 210+516”. Available online: http://arhiva.gov.ro/nota-de-fundamentare-hg-nr-30-12-01-2011__l1a112016.html (accessed on 6 September 2023).
- BikeRoll. Available online: https://bikeroll.net/en/ (accessed on 5 August 2023).
- Population and Housing Census. Final Results: Demographic Characteristics. 2021. Available online: https://www.recensamantromania.ro/rezultate-rpl-2021/rezultate-definitive-caracteristici-demografice/ (accessed on 27 July 2023).
- National Institute of Statistics—Hunedoara County Directorate of Statistics. Statistical Publications: Statistical Yearbook. Available online: https://hunedoara.insse.ro/produse-si-servicii/publicatii-statistice/ (accessed on 22 July 2023).
- Legislative Portal. Decision no. 992 of 29 December 1998 Regarding the Declaration of the Valea Jiului mining area, Hunedoara County, as a Disadvantaged Area. Available online: https://legislatie.just.ro/Public/DetaliiDocumentAfis/16646 (accessed on 31 August 2023).
- Romanian Companies. Available online: https://www.romanian-companies.eu/ (accessed on 2 September 2023).
- Cylex—List of Companies from Romania. The Hunedoara Energetic Complex SA Company, Petrosani. Available online: https://petrosani.cylex.ro/firma/societatea+complexul+energetic+hunedoara+sa-1100195.html (accessed on 1 September 2023).
- Termene. List of companies Hunedoara County. Available online: https://termene.ro/firme/Hunedoara/2 (accessed on 1 September 2023).
- Vulcan City Hall Homepage. Available online: https://www.e-vulcan.ro/ (accessed on 3 September 2023).
- Petrosani City Hall Homepage. Available online: https://www.primariapetrosani.ro/ (accessed on 3 September 2023).
- Petrila City Hall Homepage. Available online: http://www.orasulpetrila.ro/ (accessed on 3 September 2023).
- Lupeni City Hall Homepage. Available online: https://www.municipiullupeni.ro/ (accessed on 3 September 2023).
- Uricani City Hall Homepage. Available online: http://orasuluricani.ro/ (accessed on 3 September 2023).
- Aninoasa City Hall Homepage. Available online: https://orasulaninoasa.ro/ (accessed on 3 September 2023).
- Bănița City Hall Homepage. Available online: https://banita.ro/ (accessed on 3 September 2023).
- Baru City Hall Homepage. Available online: https://www.primariabaru.ro/ (accessed on 3 September 2023).
- BluePink Hosting. Jiu Valley Tourist Map. Available online: http://cheilebalomir.xhost.ro/harta.html (accessed on 5 August 2023).
- Legislative Portal. Decision no. 843 of 11 August 2021 for the Approval of the Attestation of Some Localities as Tourist Resorts of National or Local Interest and Regarding the Amendment of Annex no. 5 to Government Decision no. 852/2008 for the Approval of the Rules and Criteria for the Attestation of Tourist Resorts. Available online: https://legislatie.just.ro/Public/DetaliiDocumentAfis/245410 (accessed on 30 July 2023).
- Adevărul.ro. The Big Unnecessary Investments in the Jiu Valley Mountain Resorts. Gondolas and Chairlifts to Nowhere. Available online: https://adevarul.ro/stiri-locale/hunedoara/marile-investitii-inutile-din-statiunile-montane-2217209.html (accessed on 28 July 2023).
- Więckowski, M. Will the Consequences of COVID-19 Trigger a Redefining of the Role of Transport in the Development of Sustainable Tourism? Sustainability 2021, 13, 1887. [Google Scholar] [CrossRef]
- Wang, X.; Lai, I.K.W.; Zhou, Q.; Pang, Y.H. Regional Travel as an Alternative Form of Tourism during the COVID-19 Pandemic: Impacts of a Low-Risk Perception and Perceived Benefits. Int. J. Environ. Res. Public Health 2021, 18, 9422. [Google Scholar] [CrossRef] [PubMed]
- Orîndaru, A.; Popescu, M.-F.; Alexoaei, A.P.; Căescu, Ș.-C.; Florescu, M.S.; Orzan, A.-O. Tourism in a Post-COVID-19 Era: Sustainable Strategies for Industry’s Recovery. Sustainability 2021, 13, 6781. [Google Scholar] [CrossRef]
- Google Maps. Available online: https://www.google.com/maps/ (accessed on 20 August 2023).
- Mihailescu, S.; Praporgescu, G. Sustainable Public Transport in Petrosani Basin—Current Status and Development Perspectives. In CSUM 2022: Smart Energy for Smart Transport; Nathanail, E.G., Gavanas, N., Adamos, G., Eds.; Lecture Notes in Intelligent Transportation and Infrastructure; Springer: Cham, Switzerland, 2023. [Google Scholar]
- Hunedoara County Council Homepage. Available online: https://www.cjhunedoara.ro/ (accessed on 1 September 2023).
- ZMK Homepage. Available online: https://www.zmk.ro/ (accessed on 2 September 2023).
- AvântulLiber.ro. 10 More Electric Microbuses Will Arrive in Hunedoara County to Transport Students. Available online: https://www.avantulliber.ro/2023/09/08/inca-10-microbuze-electrice-vor-ajunge-in-judetul-hunedoara-pentru-transportul-elevilor/ (accessed on 15 September 2023).
- Tirachini, A.; Cats, O. COVID-19 and Public Transportation: Current Assessment, Prospects, and Research Needs. J. Public Transp. 2020, 22, 1–21. [Google Scholar] [CrossRef]
- Park, B.; Cho, J. Older Adults’ Avoidance of Public Transportation after the Outbreak of COVID-19: Korean Subway Evidence. Healthcare 2021, 9, 448. [Google Scholar] [CrossRef]
- Shaw, R.; Kim, Y.-K.; Hua, J. Governance, Technology and Citizen Behavior in Pandemic: Lessons from COVID-19 in East Asia. Prog. Disaster Sci. 2020, 6, 100090. [Google Scholar] [CrossRef]
- Przybylowski, A.; Stelmak, S.; Suchanek, M. Mobility Behaviour in View of the Impact of the COVID-19 Pandemic—Public Transport Users in Gdansk Case Study. Sustainability 2021, 13, 364. [Google Scholar] [CrossRef]
- Pawar, D.S.; Yadav, A.K.; Akolekar, N.; Velaga, N.R. Impact of Physical Distancing due to Novel Coronavirus (SARS-CoV-2) on Daily Travel for Work during Transition to Lockdown. Transp. Res. Interdiscip. Perspect. 2020, 7, 100203. [Google Scholar] [CrossRef] [PubMed]
- United Nations. Sustainable Development Goal Indicators. Available online: https://unstats.un.org/sdgs/metadata/?Text=&Goal=&Target=11.2 (accessed on 27 August 2023).
- Tiwari, G.; Phillip, C. Development of public transport systems in small cities: A roadmap for achieving sustainable development goal indicator 11.2. IATSS Res. 2021, 45, 31–38. [Google Scholar] [CrossRef]
- Civitas Initiative. Policy Advice Notes: Enhancing the Quality of Public Transport Services. Available online: https://civitas.eu/sites/default/files/civitas_ii_policy_advice_notes_11_public_transport_quality.pdf (accessed on 18 October 2023).
- Botzow, H. Level-Of-Service Concept for Evaluating Public Transport. Available online: https://onlinepubs.trb.org/Onlinepubs/trr/1974/519/519-008.pdf (accessed on 19 October 2023).
- Transportation Research Board. Transit Capacity and Quality of Service Manual, 3rd ed.; Transportation Research Board: Washington, DC, USA, 2013. [Google Scholar]
- Wang, M.; Mao, B.; Yang, Y.; Shi, R.; Huang, J. Determining the Level of Service Scale of Public Transport System considering the Distribution of Service Quality. J. Adv. Transp. 2022, 2022, 5120401. [Google Scholar] [CrossRef]
- Zhang, H. Empirical analysis and modeling of manual turnpike tollbooths in China. Mech. Syst. Signal Process. 2017, 87, 184–194. [Google Scholar] [CrossRef]
- Zhang, H.; Hey, Q.-M.; Zhao, X. Balancing herding and congestion in service systems: A queueing perspective. INFOR Inf. Syst. Oper. Res. 2020, 58, 511–536. [Google Scholar] [CrossRef]
- European Commission. The New EU Urban Mobility Framework. Available online: https://transport.ec.europa.eu/system/files/2021-12/com_2021_811_the-new-eu-urban-mobility.pdf (accessed on 8 August 2023).
- EUR-Lex. Regulation (EU) 2021/1058 of the European Parliament and of the Council of 24 June 2021 on the European Regional Development Fund and on the Cohesion Fund. Available online: https://eur-lex.europa.eu/legal-content/RO/TXT/?uri=CELEX:32021R1058 (accessed on 15 August 2023).
- Interreg Europe. Available online: https://www.interregeurope.eu/ (accessed on 23 August 2023).
- West Regional Development Agency. Projects Submitted until 12 September 2023. Available online: https://adrvest.ro/wp-content/uploads/Stadiu/Situatia-proiectelor-depuse-POR-2014_2020.pdf (accessed on 17 September 2023).
- EXCLUSIVE Newspaper. Available online: https://ziarulexclusiv.ro/2023/04/25/s-au-semnat-contractele-pentru-achizitia-autobuzelor-electrice-din-proiectul-green-line-valea-jiului/ (accessed on 22 September 2023).
- Chronicle of the Jiu Valley. Available online: https://cronicavj.ro/wp/au-inceput-lucrarile-la-garajul-pentru-green-line/ (accessed on 22 September 2023).
- Auction Admin. Available online: https://www.licitatii-publice.ro/PAAPD1407108-achizitia-autobuze-nepoluante-electrice-376308-aqp.html (accessed on 21 September 2023).
- Ministry of Development, Public Works and Administration. Urban Mobility Projects. Available online: https://www.mdlpa.ro/pages/proiectemobilitateurbana (accessed on 19 August 2023).
- Mobilitate.eu. Transports. Infrastructure. Mobility. Available online: https://mobilitate.eu/ (accessed on 29 July 2023).
- Kyriakidis, C.; Chatziioannou, I.; Iliadis, F.; Nikitas, A.; Bakogiannis, E. Evaluating the Public Acceptance of Sustainable Mobility Interventions Responding to COVID-19: The Case of the Great Walk of Athens and the Importance of Citizen Engagement. Cities 2023, 132, 103966. [Google Scholar] [CrossRef] [PubMed]
- Tarasi, D.; Daras, T.; Tournaki, S.; Tsoutsos, T. Transportation in the Mediterranean during the COVID-19 Pandemic Era. Glob. Transit. 2021, 3, 55–71. [Google Scholar] [CrossRef]
- Hsieh, H.-S.; Hsia, H.-C. Can continued anti-epidemic measures help post-COVID-19 public transport recovery? Evidence from Taiwan. J. Transp. Health 2022, 26, 101392. [Google Scholar] [CrossRef]
- Drummond, J.; Hasnine, M.S. Did the COVID-19 vaccine rollout impact transportation demand? A case study in New York City. J. Transp. Health 2023, 28, 101539. [Google Scholar] [CrossRef]
- Abdullah, M.; Ali, N.; Hussain, S.A.; Aslam, A.B.; Javid, M.A. Measuring changes in travel behavior pattern due to COVID-19 in a developing country: A case study of Pakistan. Transp. Policy 2021, 108, 21–33. [Google Scholar] [CrossRef] [PubMed]
- Eisenmann, C.; Nobis, C.; Kolarova, V.; Lenz, B.; Winkler, C. Transport Mode Use During the COVID-19 Lockdown Period in Germany: The Car Became More Important, Public Transport Lost Ground. Transp. Policy 2021, 103, 60–67. [Google Scholar] [CrossRef] [PubMed]
- Zafri, N.M.; Khan, A.; Jamal, S.; Alam, B.M. Risk perceptions of COVID-19 transmission in different travel modes. Transp. Res. Interdiscip. Perspect. 2022, 13, 100548. [Google Scholar] [CrossRef] [PubMed]
- Wu, W.; Wang, M.; Zhang, F. Commuting behavior and congestion satisfaction evidence from Beijing, China. Transp. Res. Part D: Transp. Environ. 2019, 67, 553–564. [Google Scholar] [CrossRef]
- Euronews Romania. Available online: https://www.euronews.ro/articole/peste-50-de-orase-si-municipii-din-europa-au-introdus-transportul-public-gratuit (accessed on 9 September 2023).
- Euronews.Travel. Available online: https://www.euronews.com/travel/2023/04/16/this-european-city-is-making-public-transport-free-for-citizens-from-december (accessed on 9 September 2023).
- Dai, J.; Liu, Z.; Li, R. Improving the subway attraction for the post-COVID-19 era: The role of fare-free public transport policy. Transp. Policy 2021, 103, 21–30. [Google Scholar] [CrossRef] [PubMed]
- Awad-Núñez, S.; Julio, R.; Moya-Gómez, B.; Gomez, J.; González, J.S. Acceptability of sustainable mobility policies under a post-COVID-19 scenario. Evidence from Spain. Transp. Policy 2021, 106, 205–214. [Google Scholar] [CrossRef] [PubMed]
- Tsavdari, D.; Klimi, V.; Georgiadis, G.; Fountas, G.; Basbas, S. The Anticipated Use of Public Transport in the Post-Pandemic Era: Insights from an Academic Community in Thessaloniki, Greece. Soc. Sci. 2022, 11, 400. [Google Scholar] [CrossRef]
- EUR-Lex. Official Journal. Available online: https://eur-lex.europa.eu/legal-content/EN/TXT/PDF/?uri=OJ:C:2021:415:FULL (accessed on 19 September 2023).
- Andara, R.; Ortego-Osa, J.; Gómez-Caicedo, M.I.; Ramírez-Pisco, R.; Navas-Gracia, L.M.; Vásquez, C.L.; Gaitán-Angulo, M. Behavior of Traffic Congestion and Public Transport in Eight Large Cities in Latin America during the COVID-19 Pandemic. Appl. Sci. 2021, 11, 4703. [Google Scholar] [CrossRef]
- Earley, R.; Newman, P. Transport in the Aftermath of COVID-19: Lessons Learned and Future Directions. J. Transp. Technol. 2021, 11, 109–127. [Google Scholar] [CrossRef]
- Dong, H.; Ma, S.; Jia, N.; Tian, J. Understanding public transport satisfaction in post COVID-19 pandemic. Transp. Policy 2021, 101, 81–88. [Google Scholar] [CrossRef]
- Petrov, A.I.; Petrova, D.A. Open Business Model of COVID-19 Transformation of an Urban Public Transport System: The Experience of a Large Russian City. J. Open Innov. Technol. Mark. Complex. 2021, 7, 171. [Google Scholar] [CrossRef]
- Abdullah, M.; Ali, N.; Dias, C.; Campisi, T.; Javid, M.A. Exploring the Traveler’s Intentions to Use Public Transport during the COVID-19 Pandemic While Complying with Precautionary Measures. Aplic. Sci. 2021, 11, 3630. [Google Scholar] [CrossRef]
- Patlins, A. Development of System Solution for Public Transport System Sustainability and Adapting it to the Challenge of COVID-19. Transp. Res. Procedia 2021, 55, 1407–1414. [Google Scholar] [CrossRef]
- Dadashzadeh, N.; Larimian, T.; Levifve, U.; Marsetič, R. Travel Behaviour of Vulnerable Social Groups: Pre, during, and Post COVID-19 Pandemic. Int. J. Environ. Res. Public Health 2022, 19, 10065. [Google Scholar] [CrossRef]
- Alkharabsheh, A.; Duleba, S. Public Transportation Service Quality Evaluation during the COVID-19 Pandemic in Amman City Using Integrated Approach Fuzzy AHP-Kendall Model. Vehicles 2021, 3, 330–340. [Google Scholar] [CrossRef]
Figure 1.
Google mobility report for Romania.

Figure 2.
Apple mobility report for Romania.

Figure 3.
Urban micro-region of the Petrosani Basin.

Figure 4.
Metropolitan areas in the studied area defined according to Law no. 246/2022: 1—Petrosani Municipality; 2—Vulcan Municipality; 3—Lupeni Municipality; 4—Petrila City; 5—Aninoasa City; 6—Uricani City; 7—Bănița Commune; 8—Baru Commune.
Figure 4.
Metropolitan areas in the studied area defined according to Law no. 246/2022: 1—Petrosani Municipality; 2—Vulcan Municipality; 3—Lupeni Municipality; 4—Petrila City; 5—Aninoasa City; 6—Uricani City; 7—Bănița Commune; 8—Baru Commune.

Figure 5.
The evolution of the population and the number of employees in the studied area.

Figure 6.
Age pyramid dynamics.

Figure 7.
Population natural growth.

Figure 8.
The evolution of the number of emigrants.

Figure 9.
School population evolution.

Figure 10.
Tourist reception structures with tourist accommodation functions by types of structures.
Figure 10.
Tourist reception structures with tourist accommodation functions by types of structures.

Figure 11.
Arrivals of tourists in tourist reception structures.

Figure 12.
Interurban public transport routes.

Figure 13.
Petrosani-Petrila public transport routes.

Figure 14.
Local public transport routes in Petrosani Municipality.

Figure 15.
Number of minibuses in 24 h on the routes in the studied area.

Figure 16.
The evolution of the number of schools.

Figure 17.
The number of personal cars.

Figure 18.
The average number of cars per percent of households.

Figure 19.
The number of passengers per hour.

Figure 20.
The public transport demand.

Figure 21.
ZMK economic data.

Figure 22.
Stalone Com economic data.

Figure 23.
Piața Victoriei Station, Petrosani.

Figure 24.
Route stations in Petrosani: (a) constructions of light metal structure; (b) stations without any facility.
Figure 24.
Route stations in Petrosani: (a) constructions of light metal structure; (b) stations without any facility.


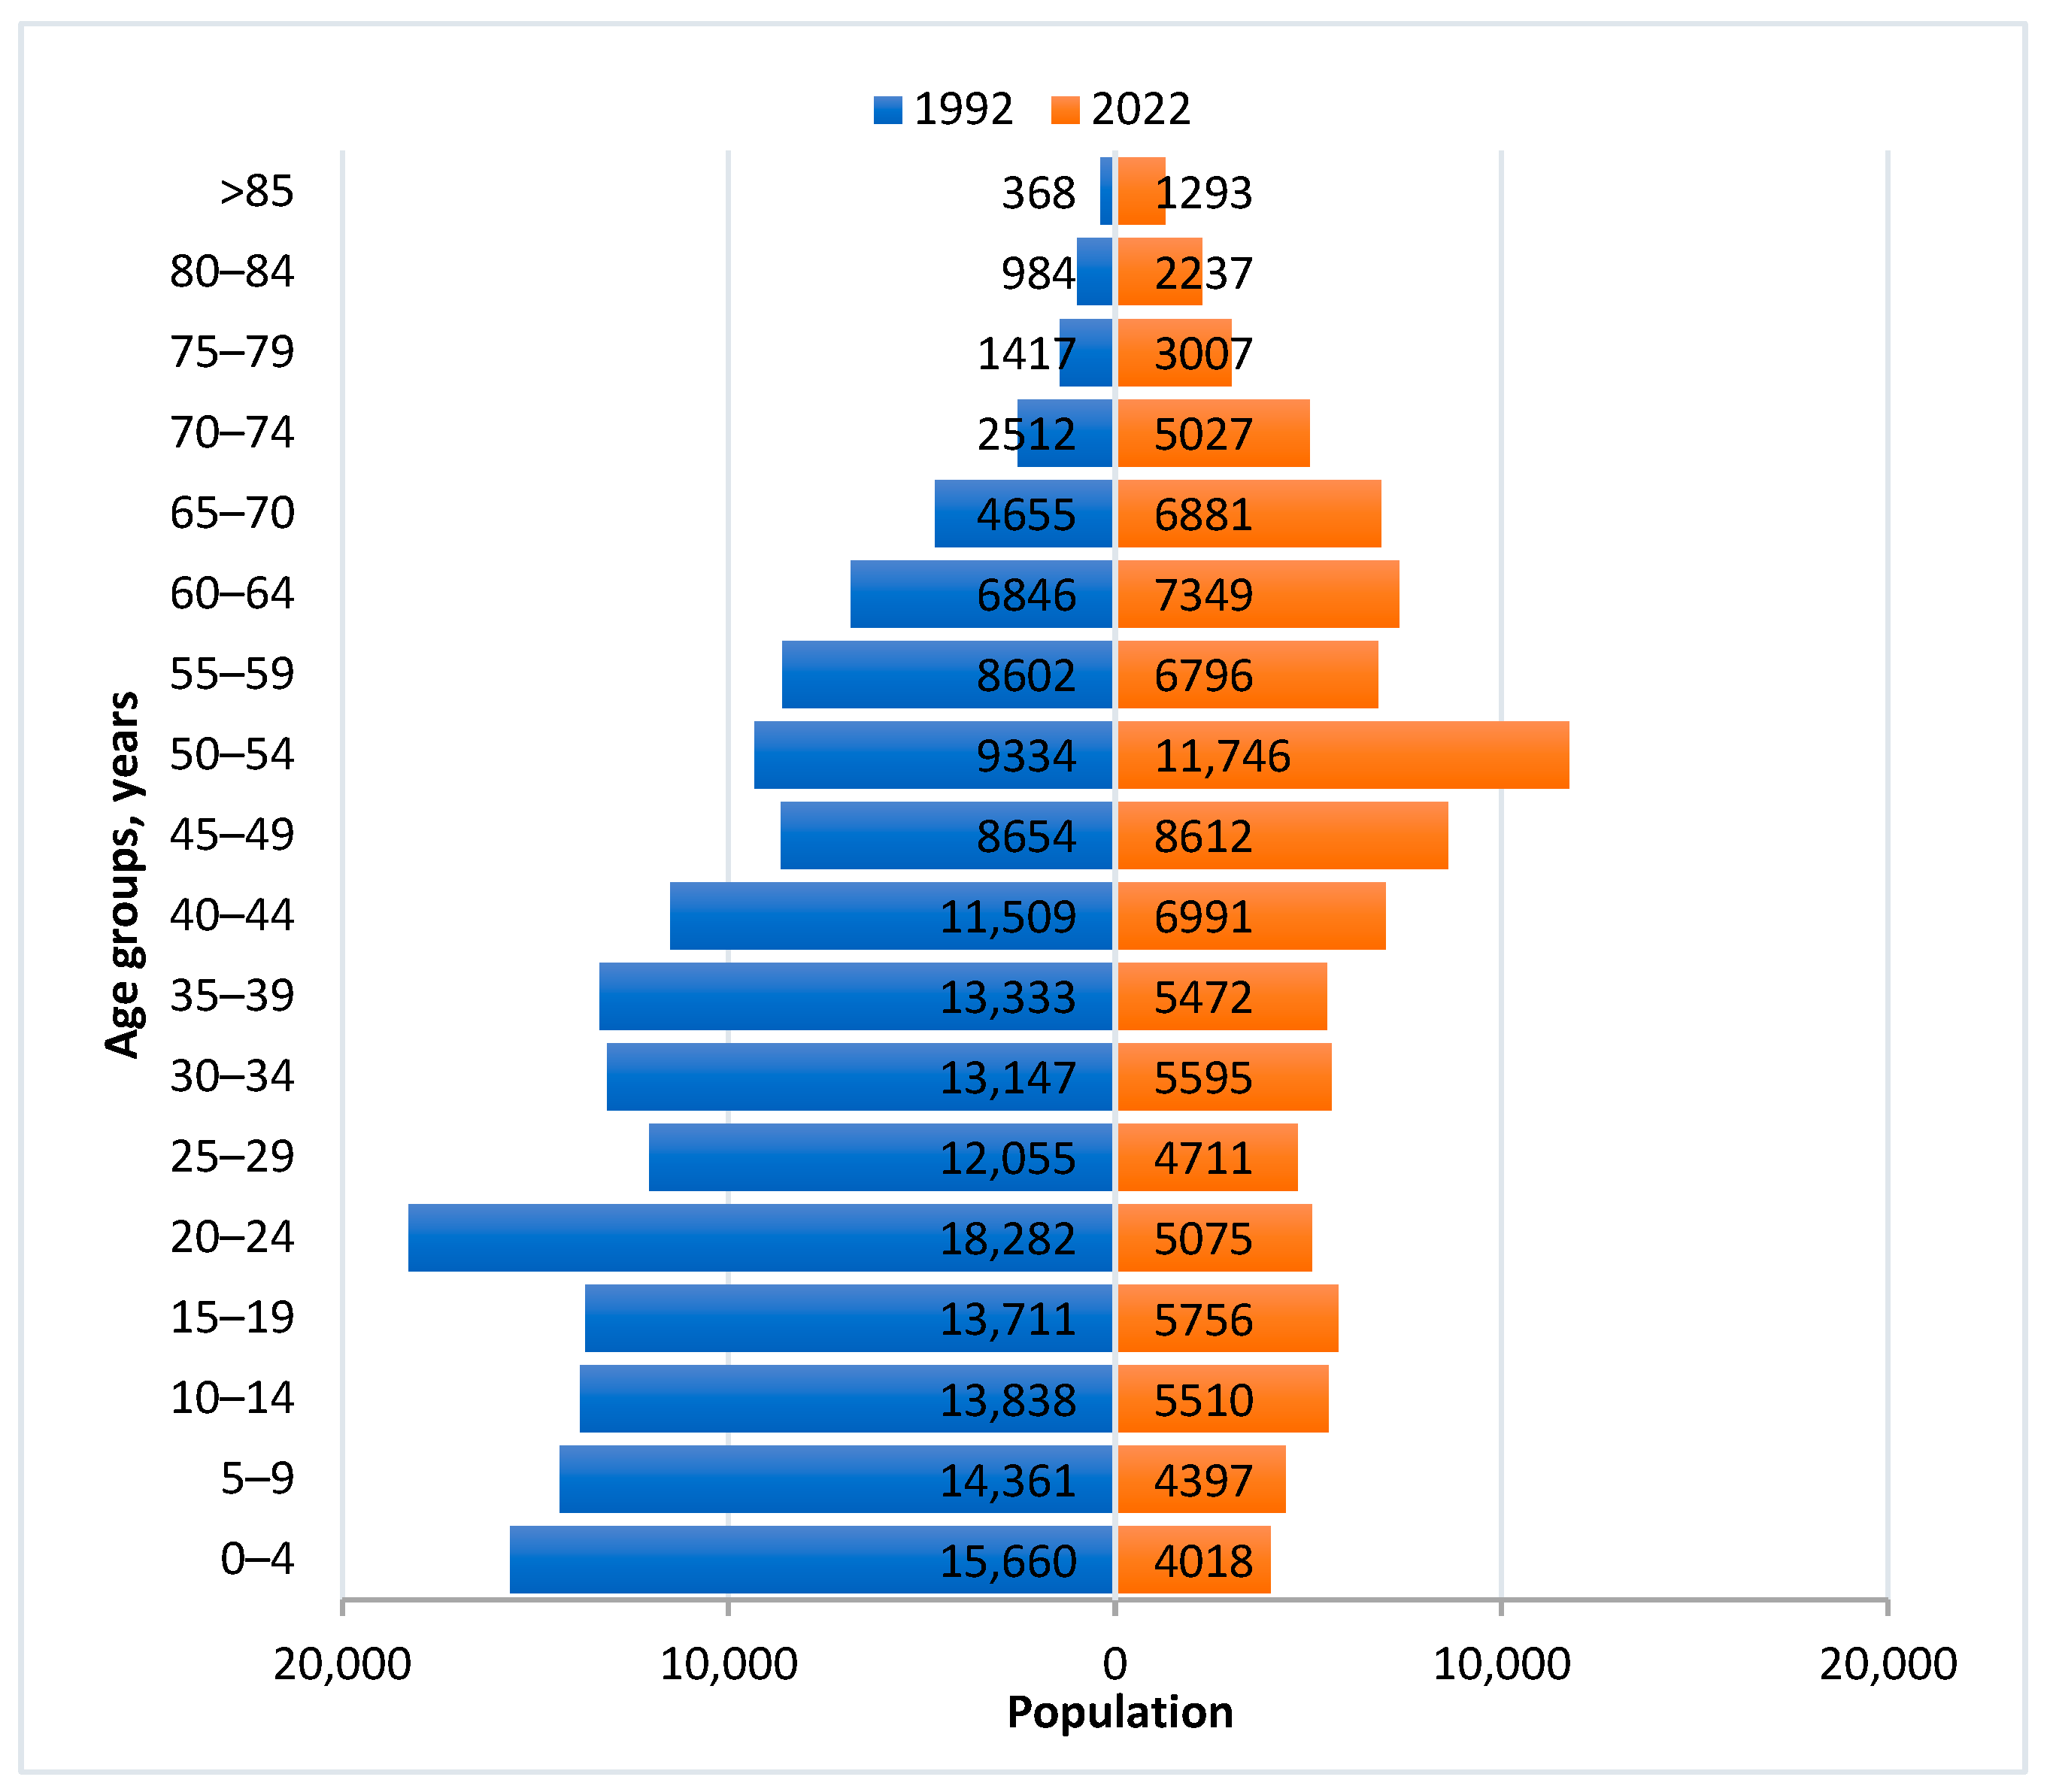
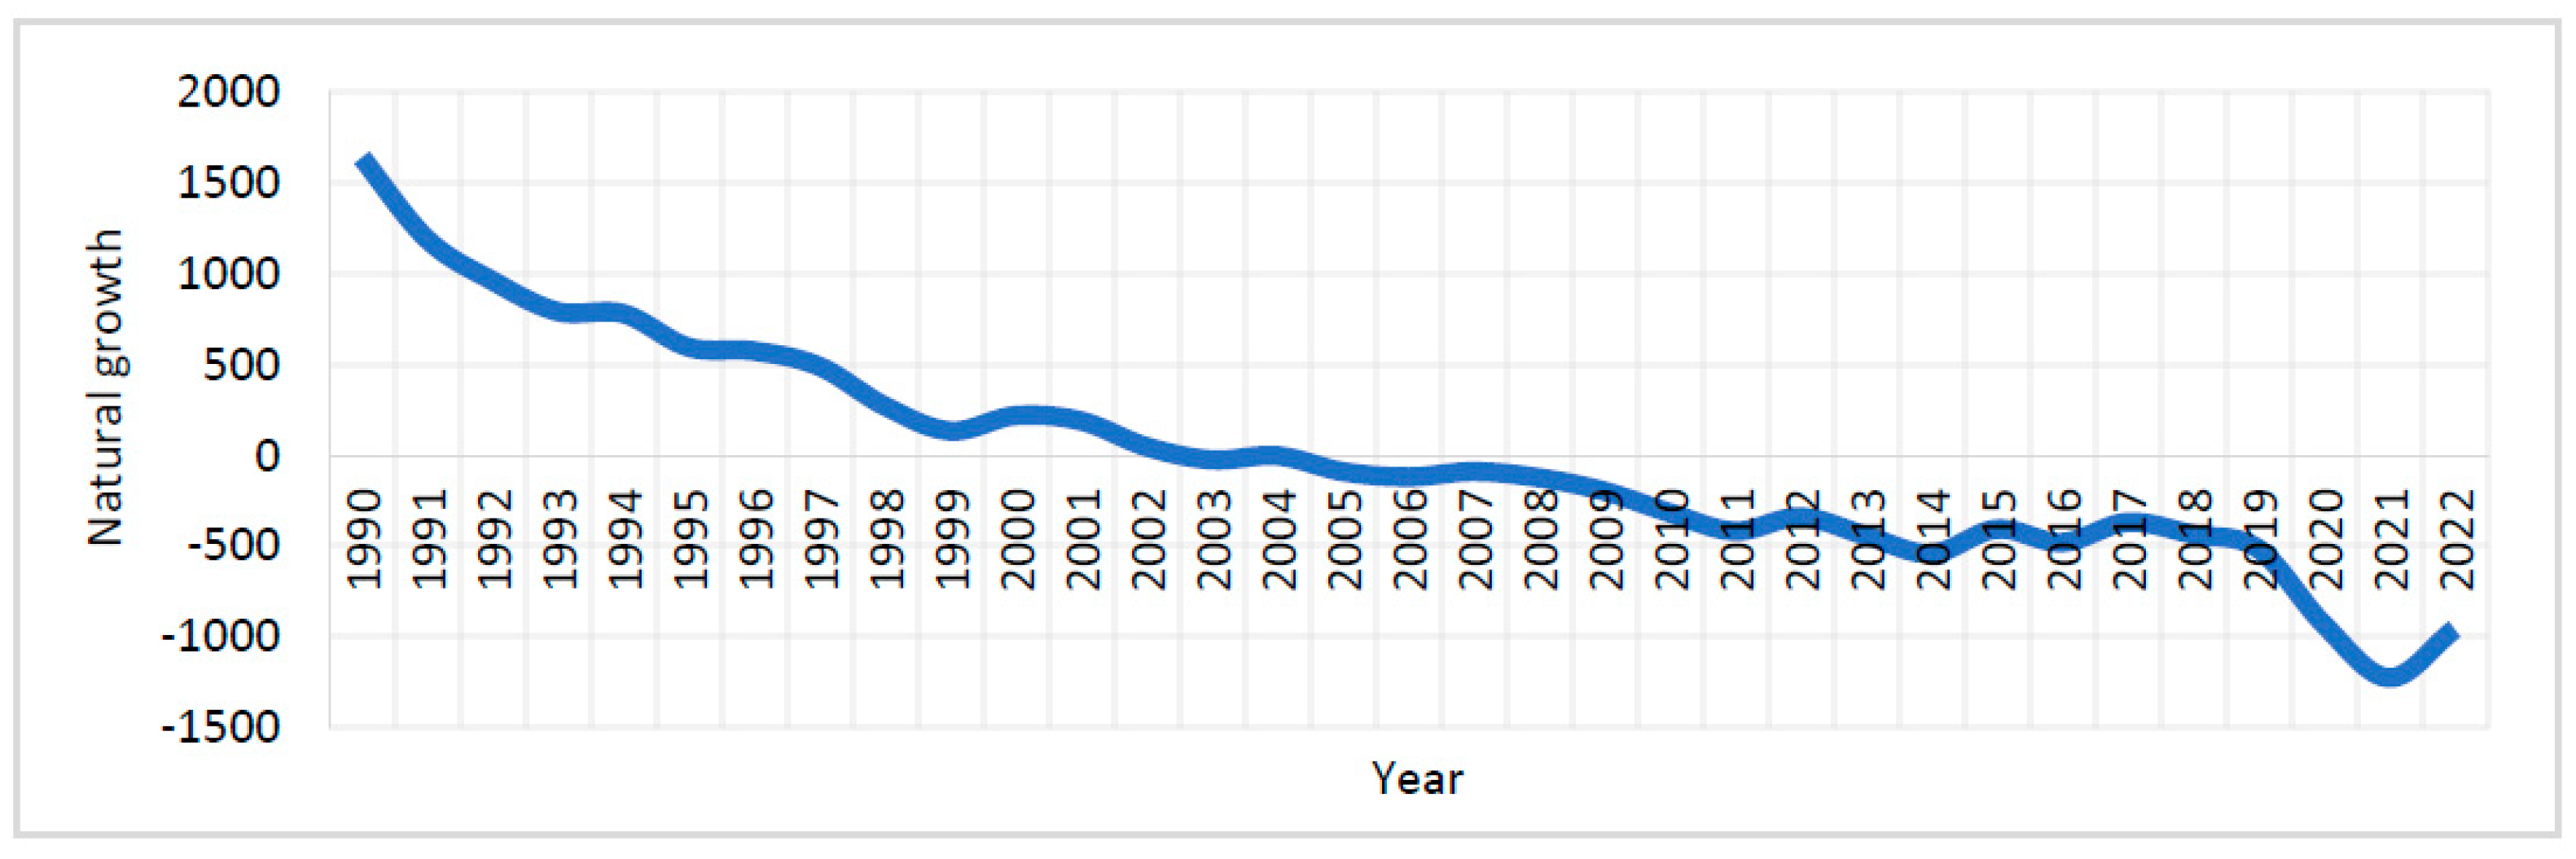
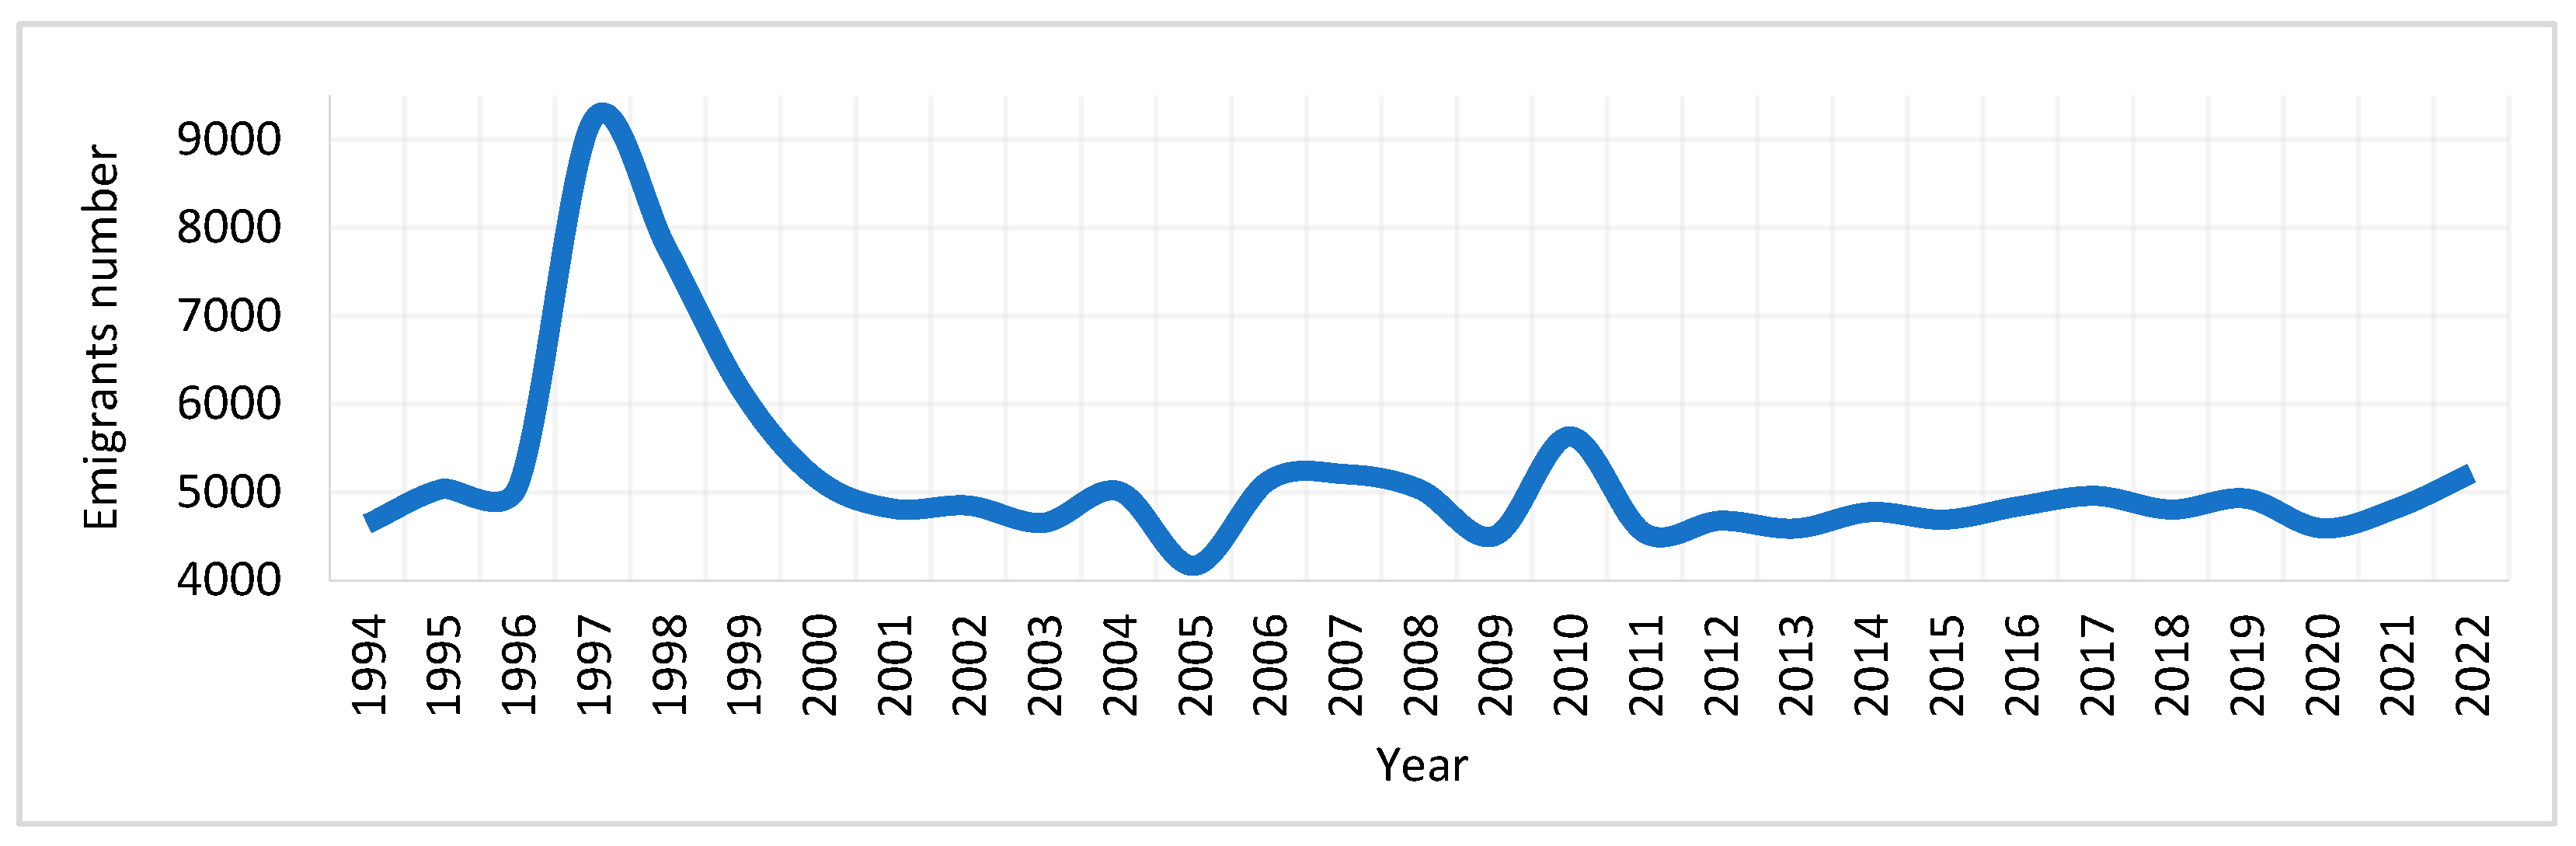
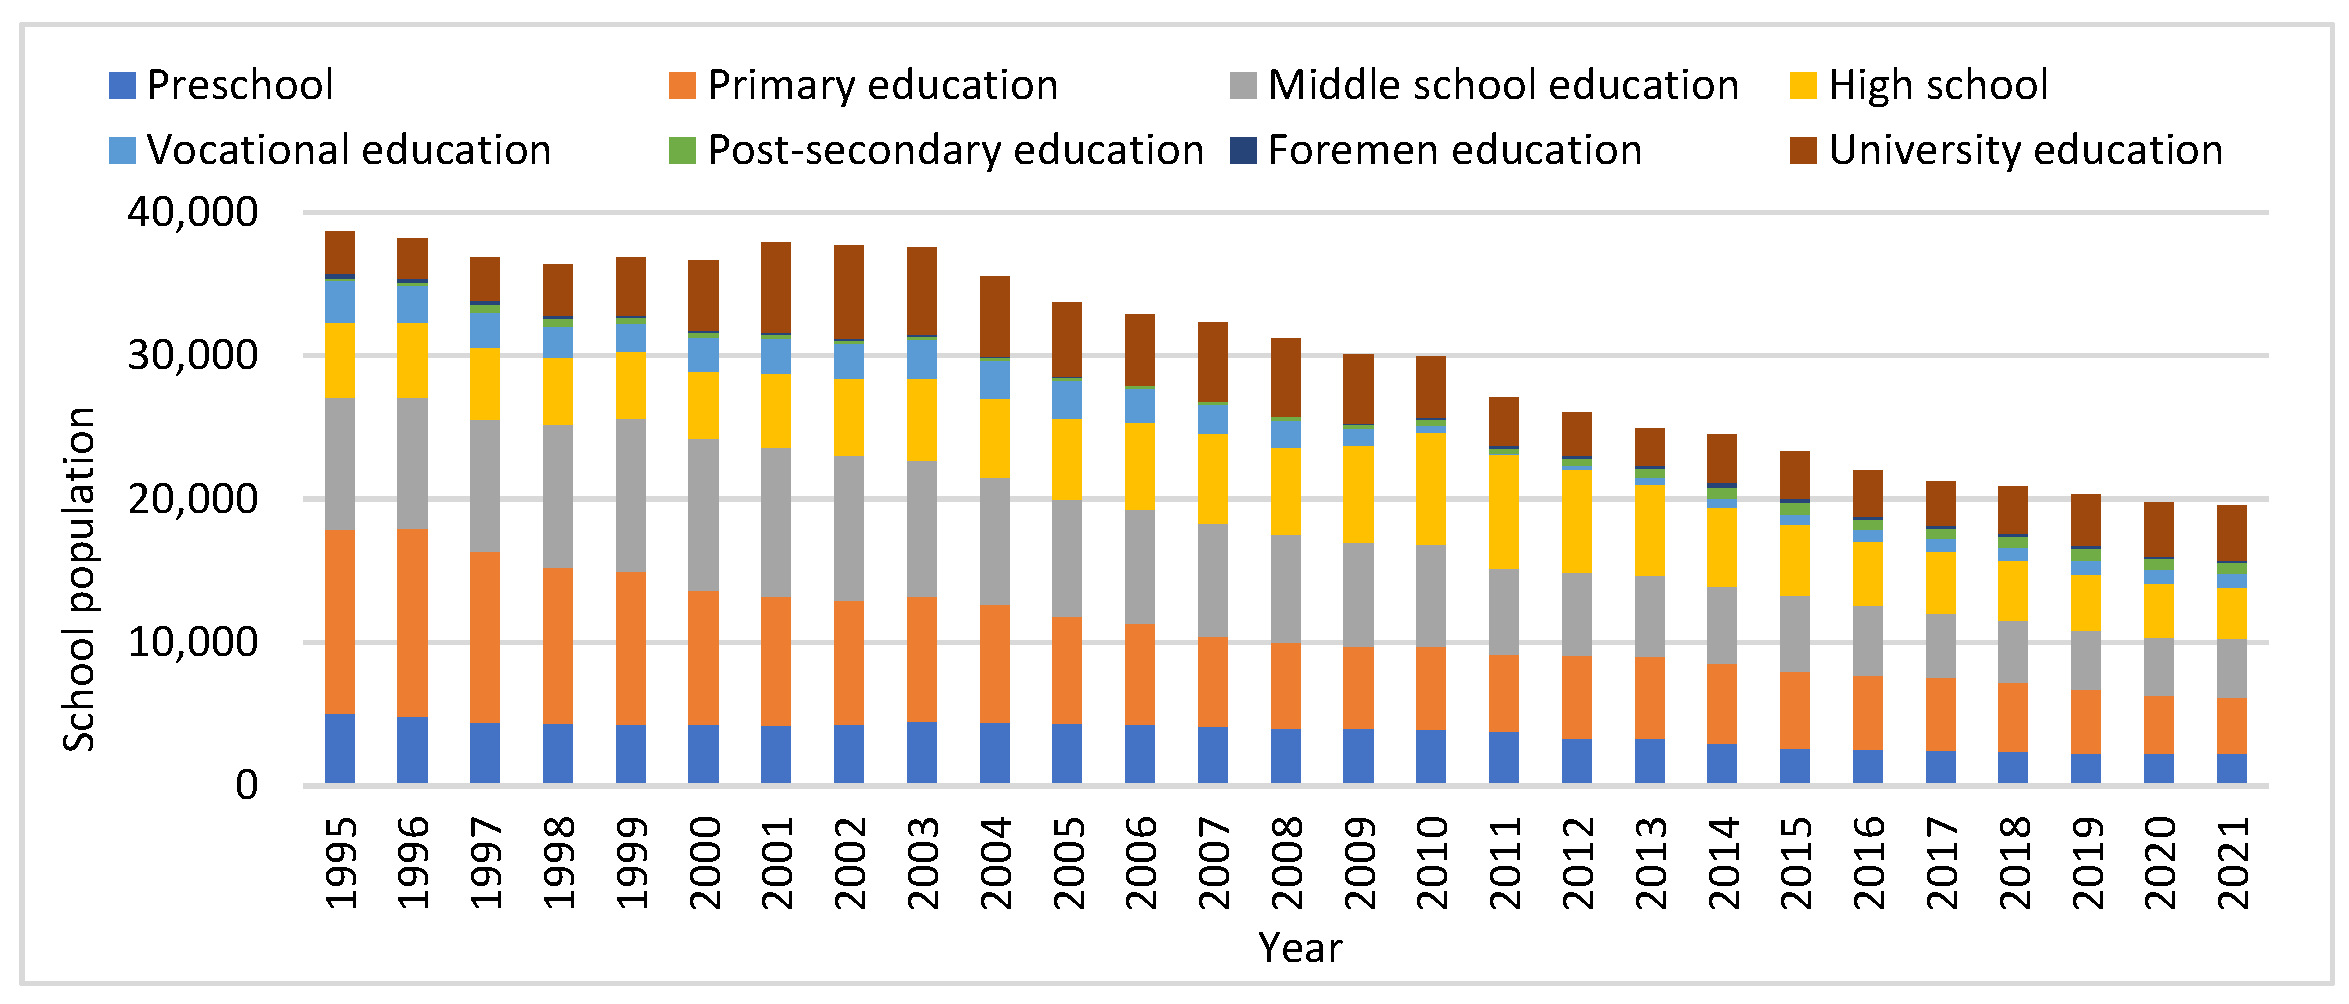
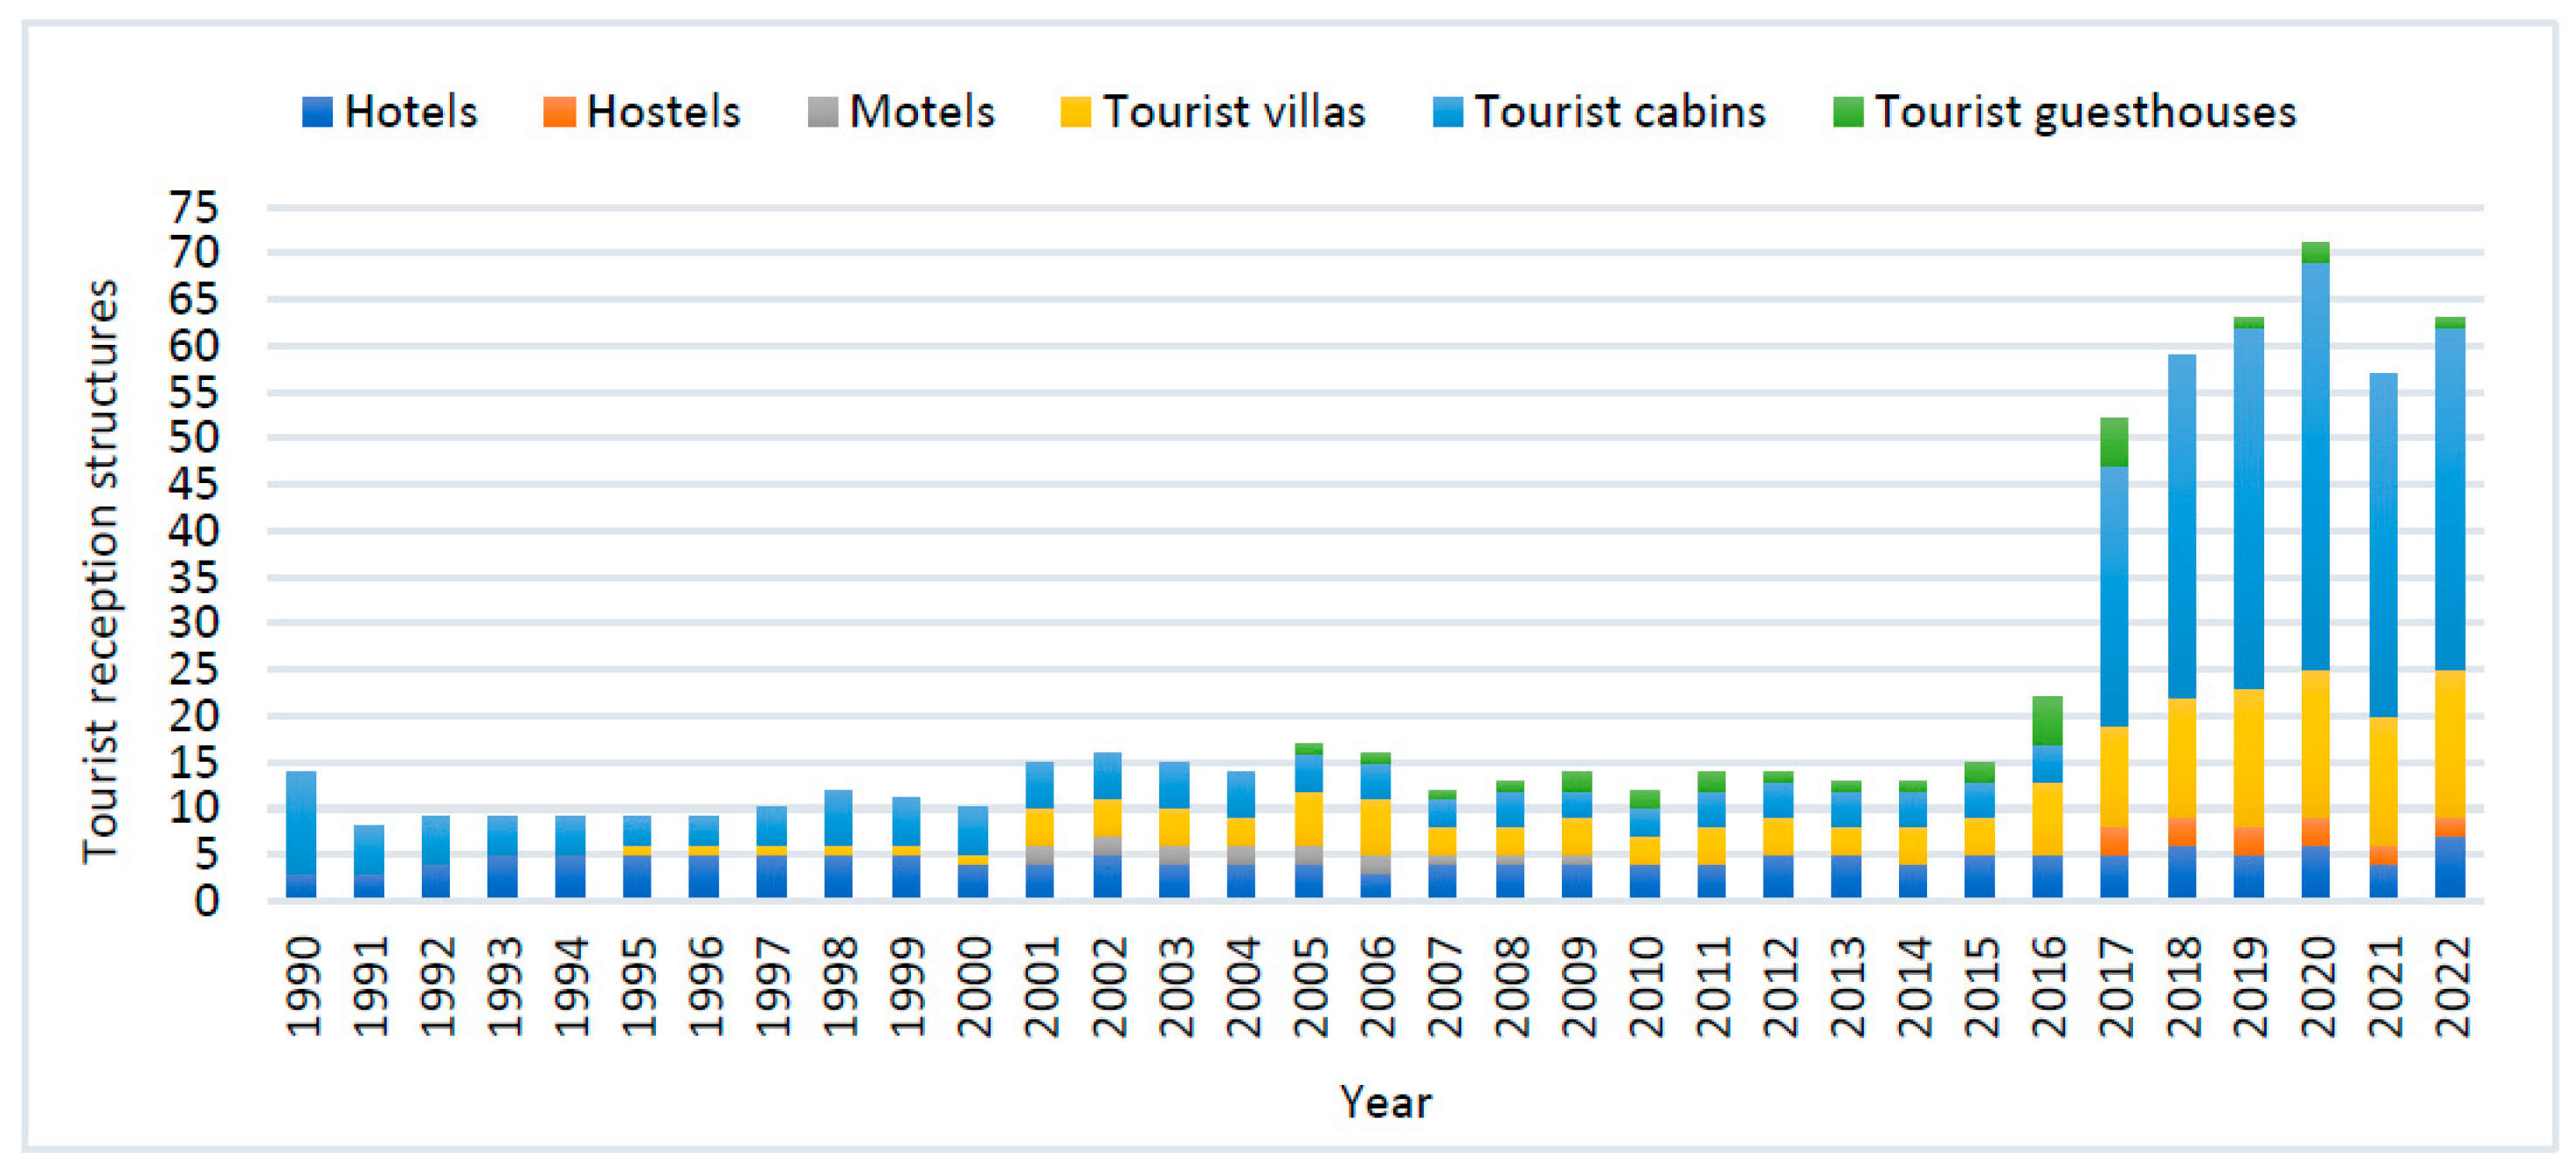
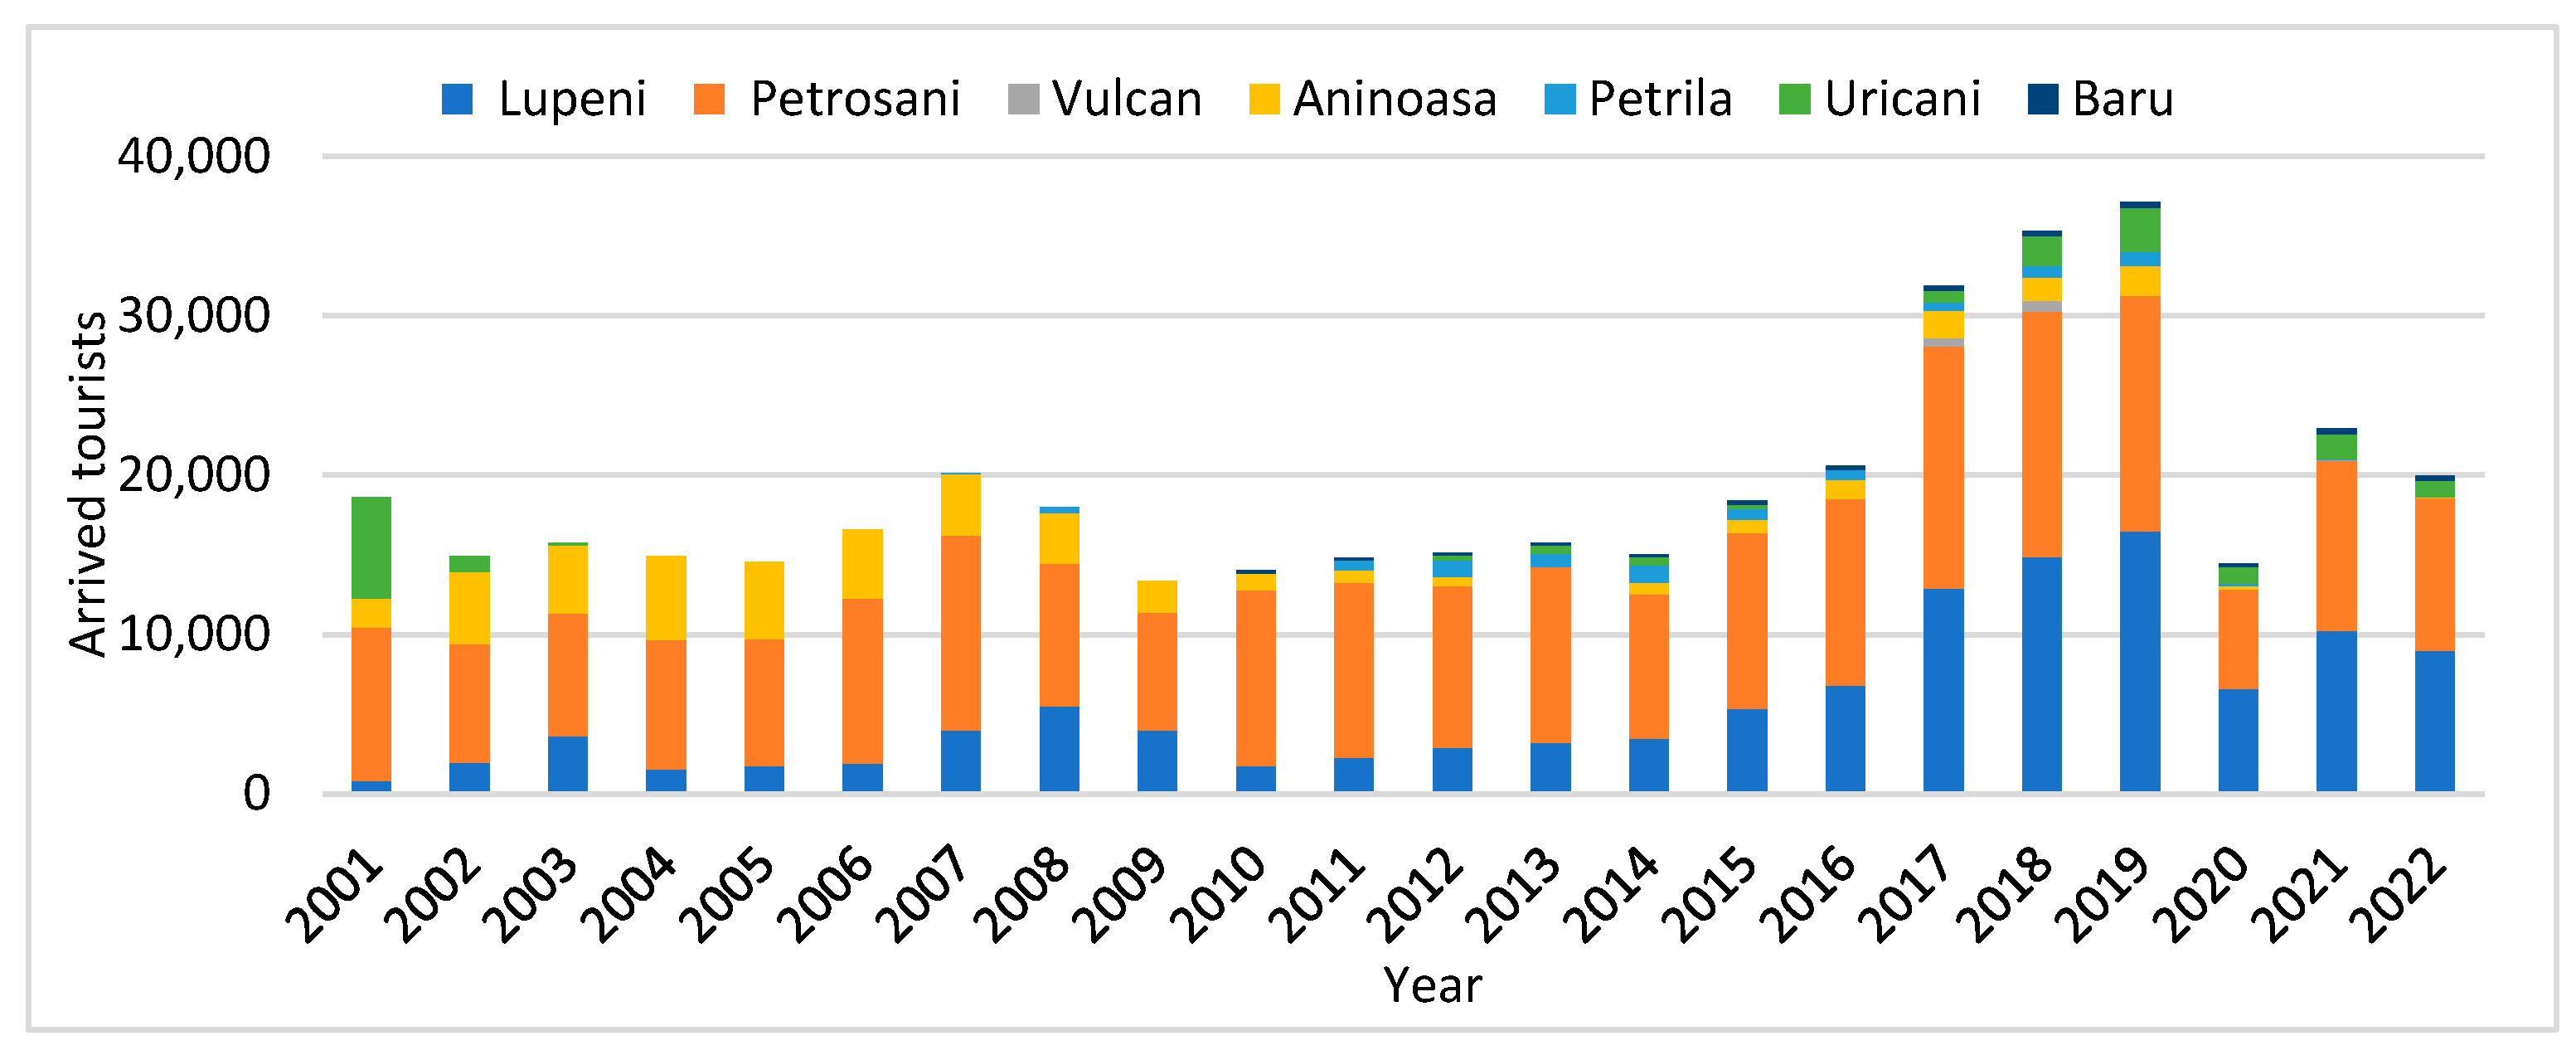
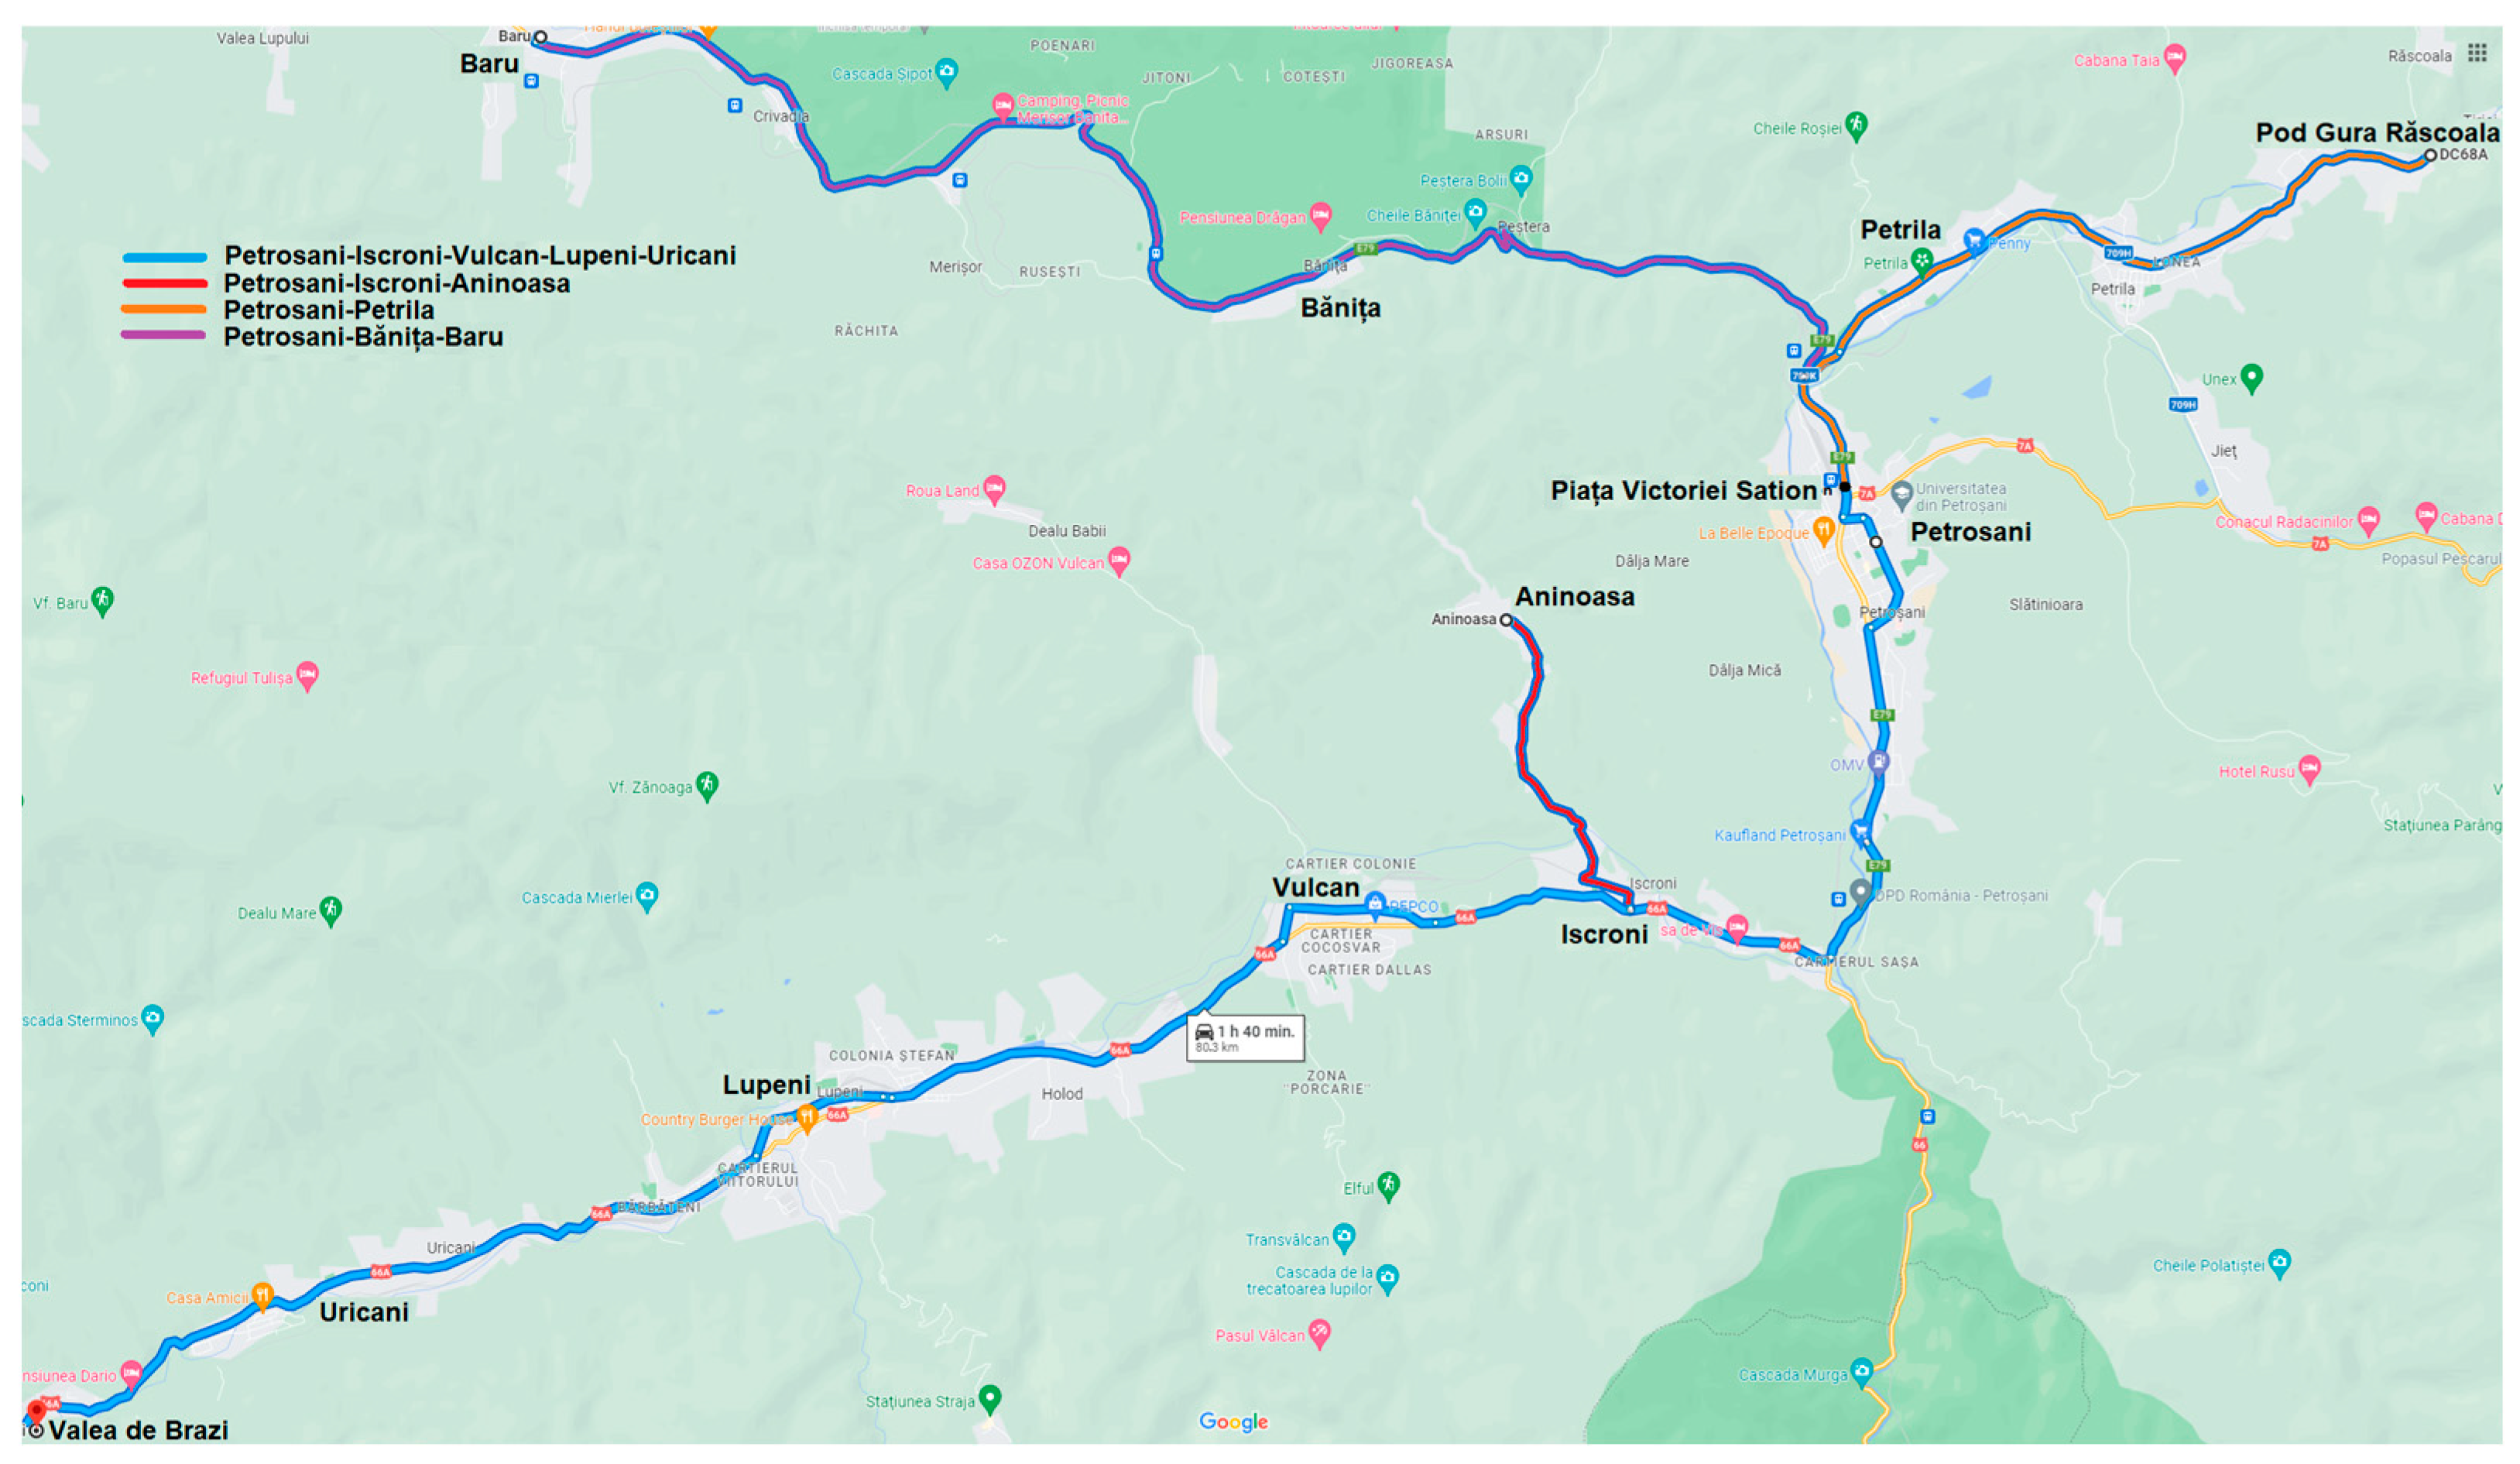
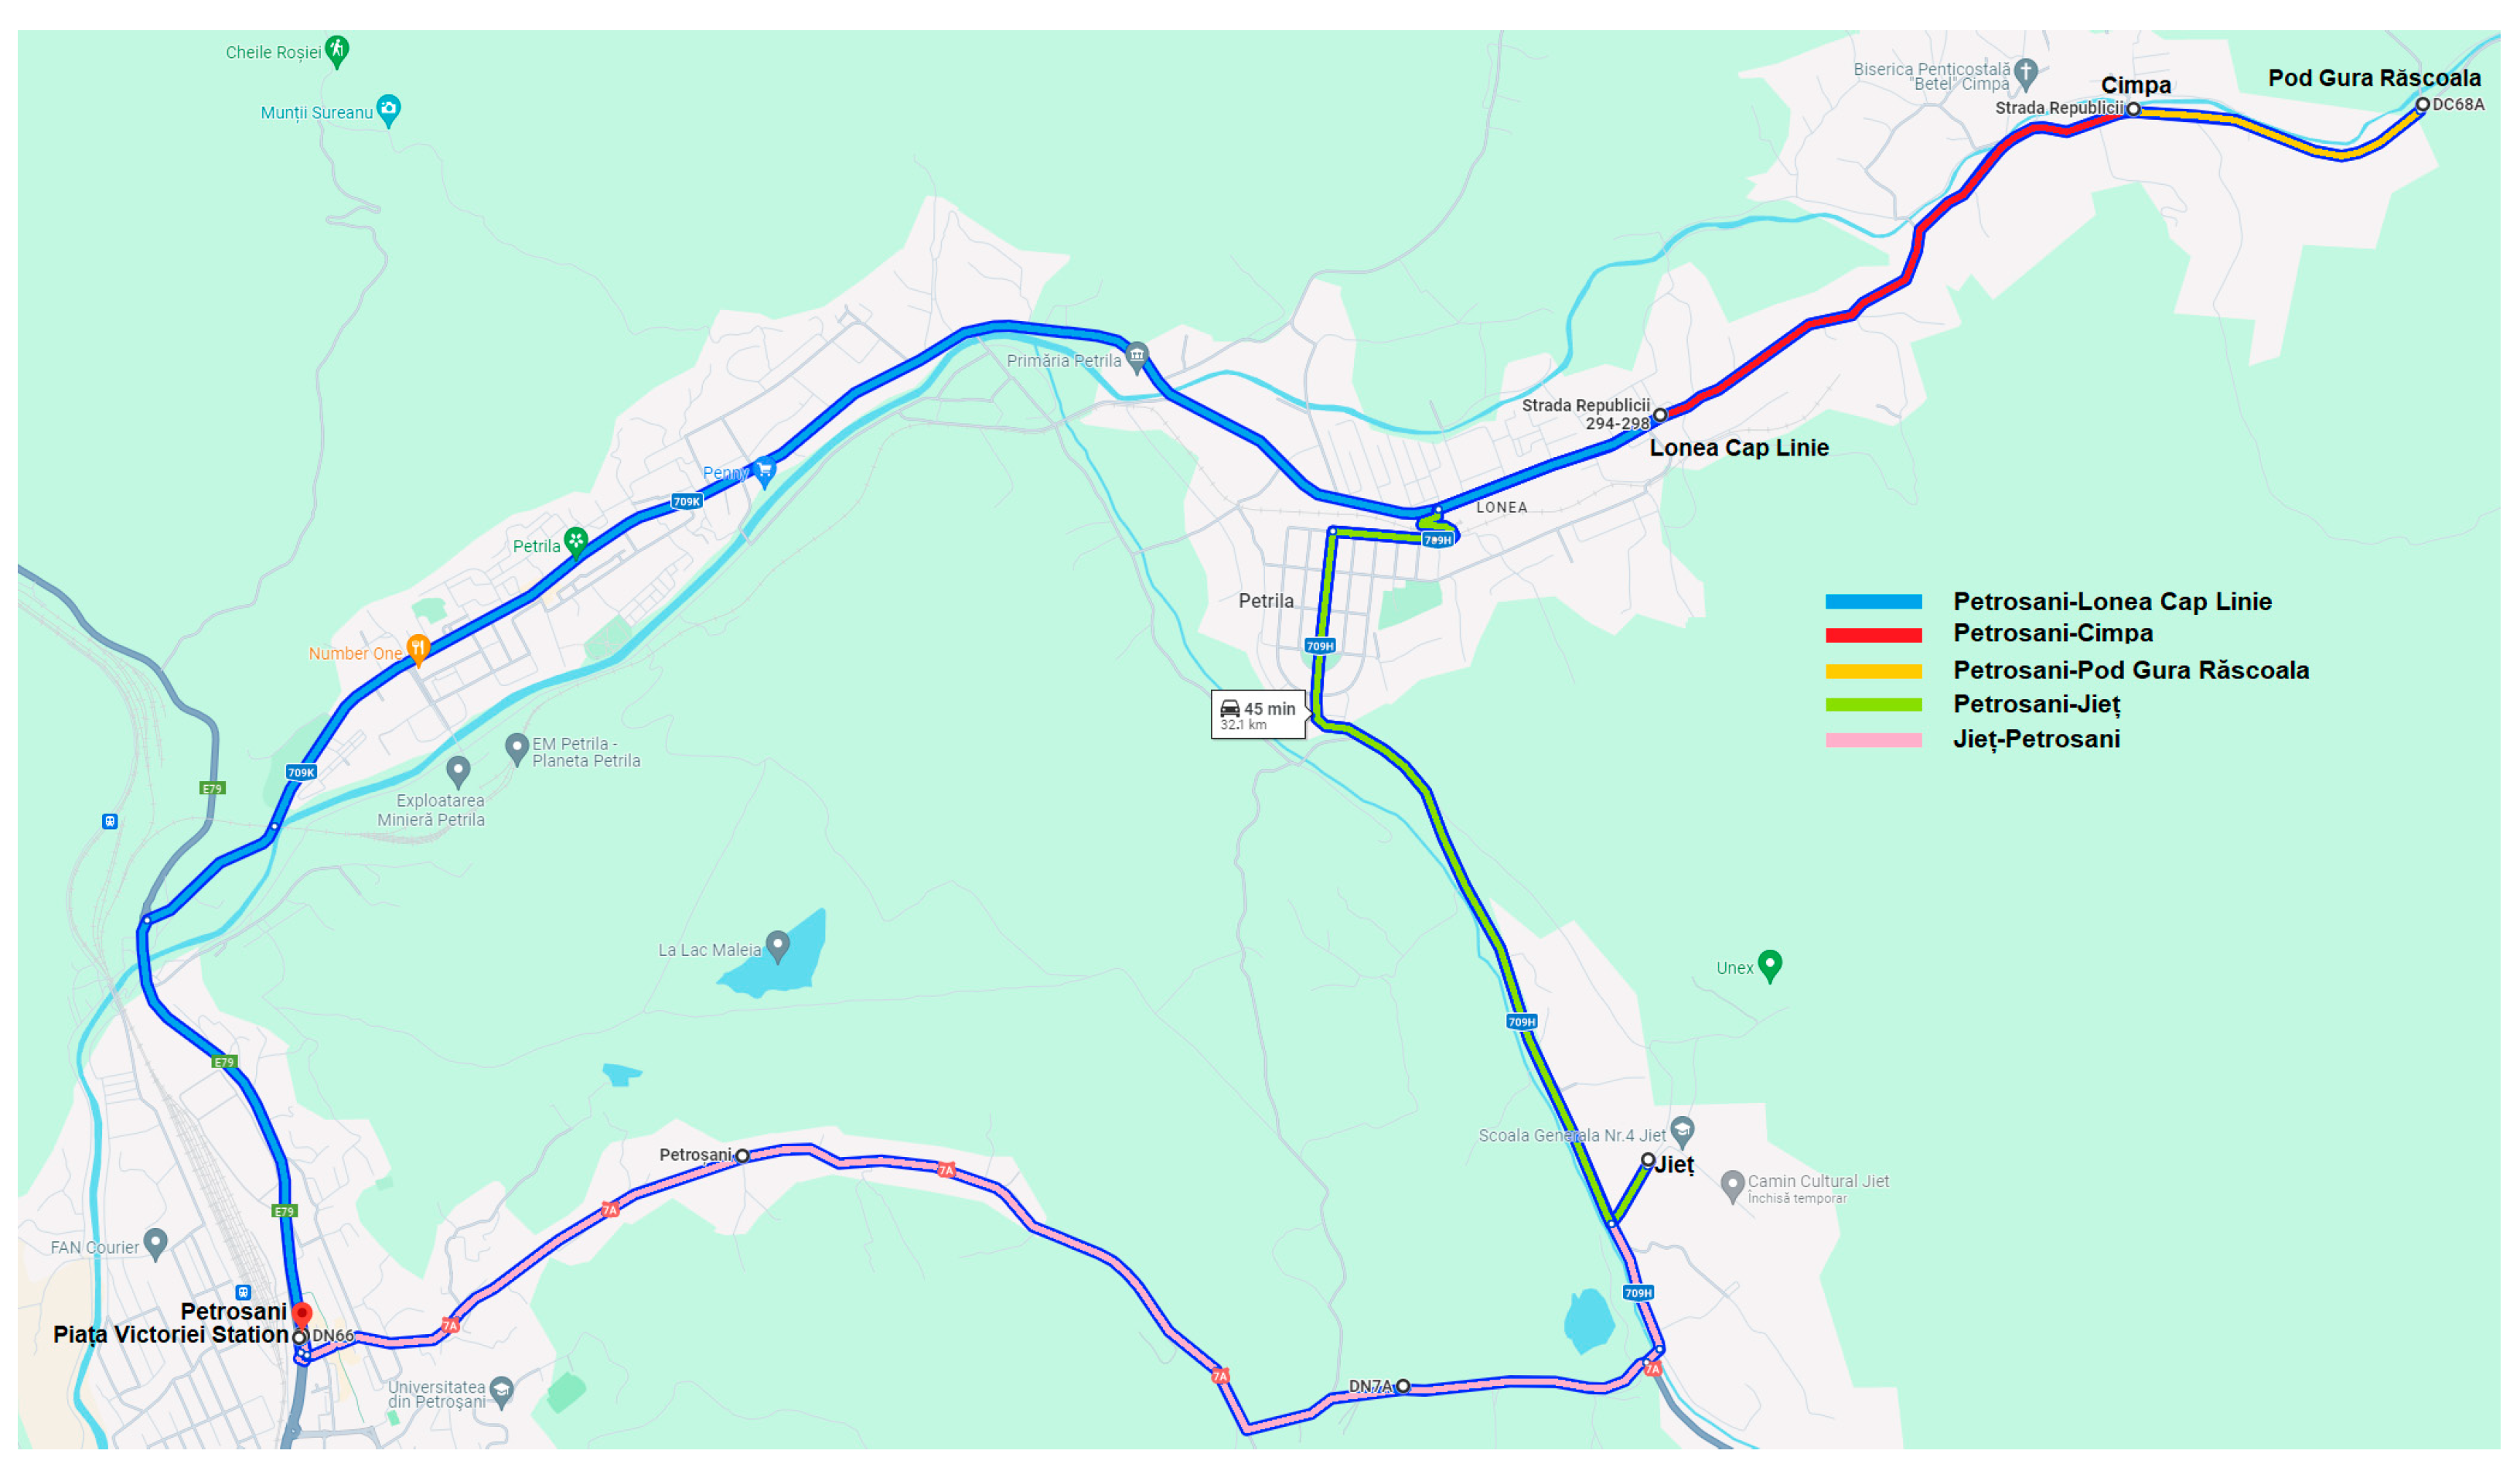
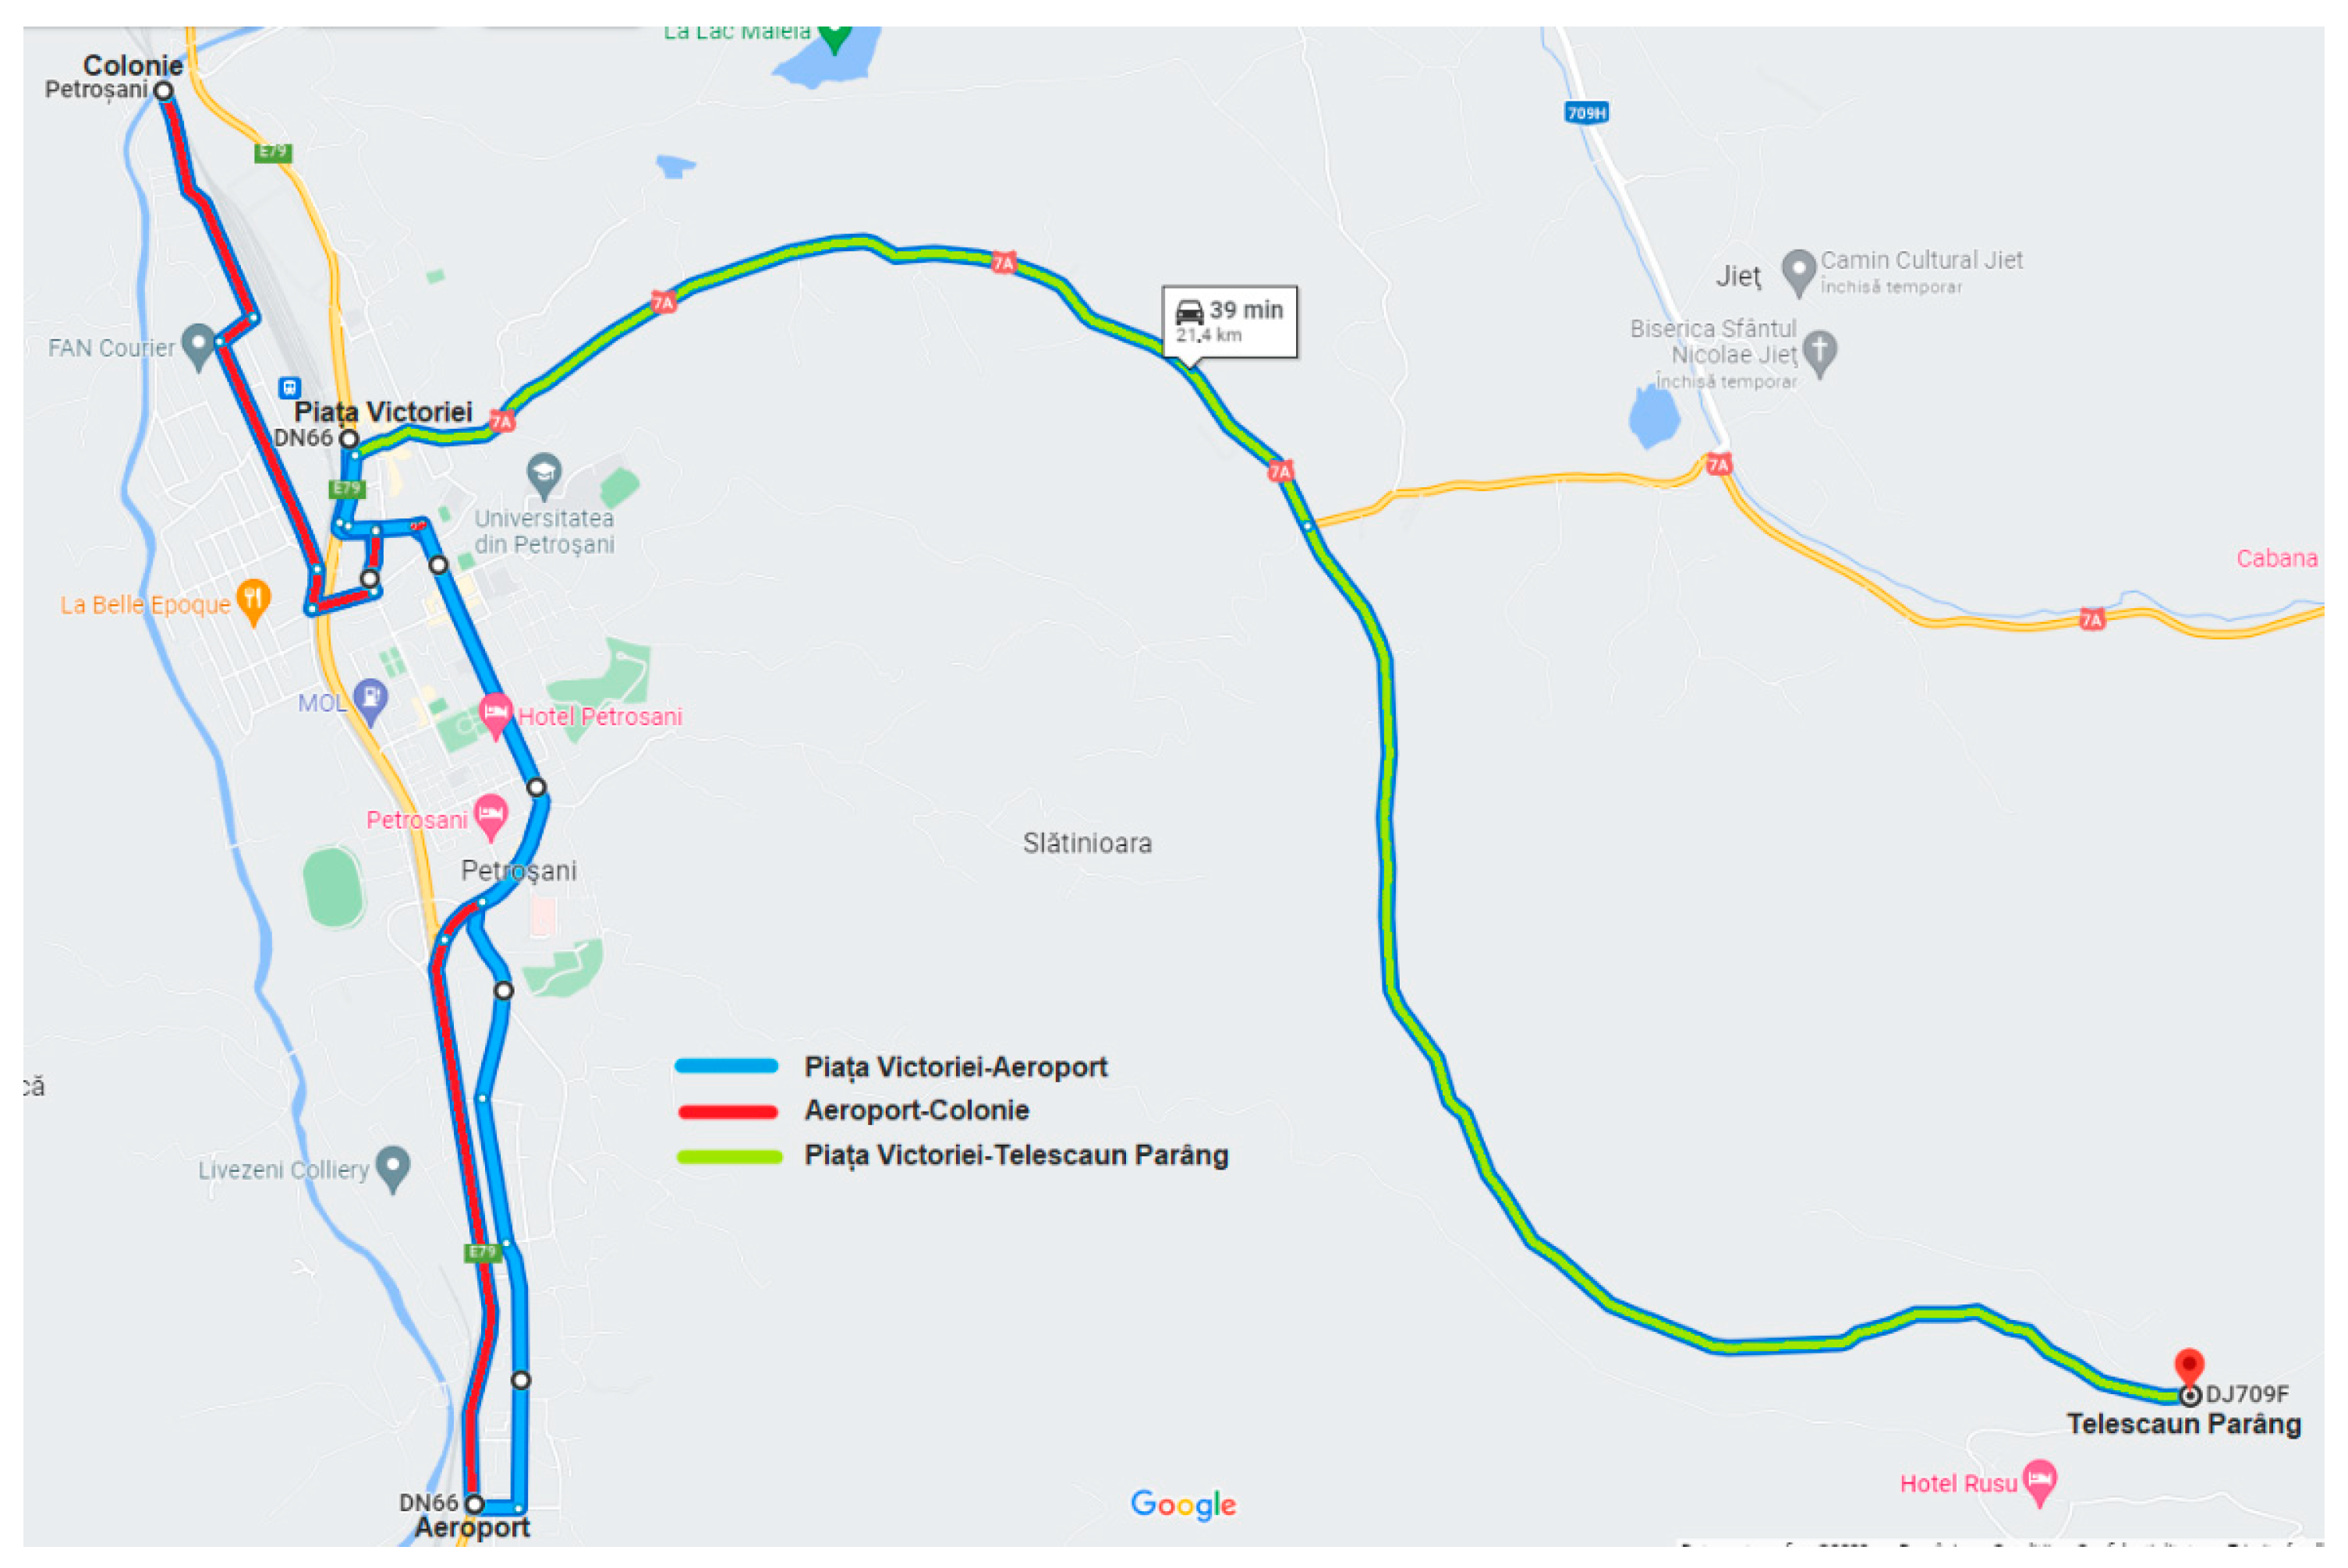
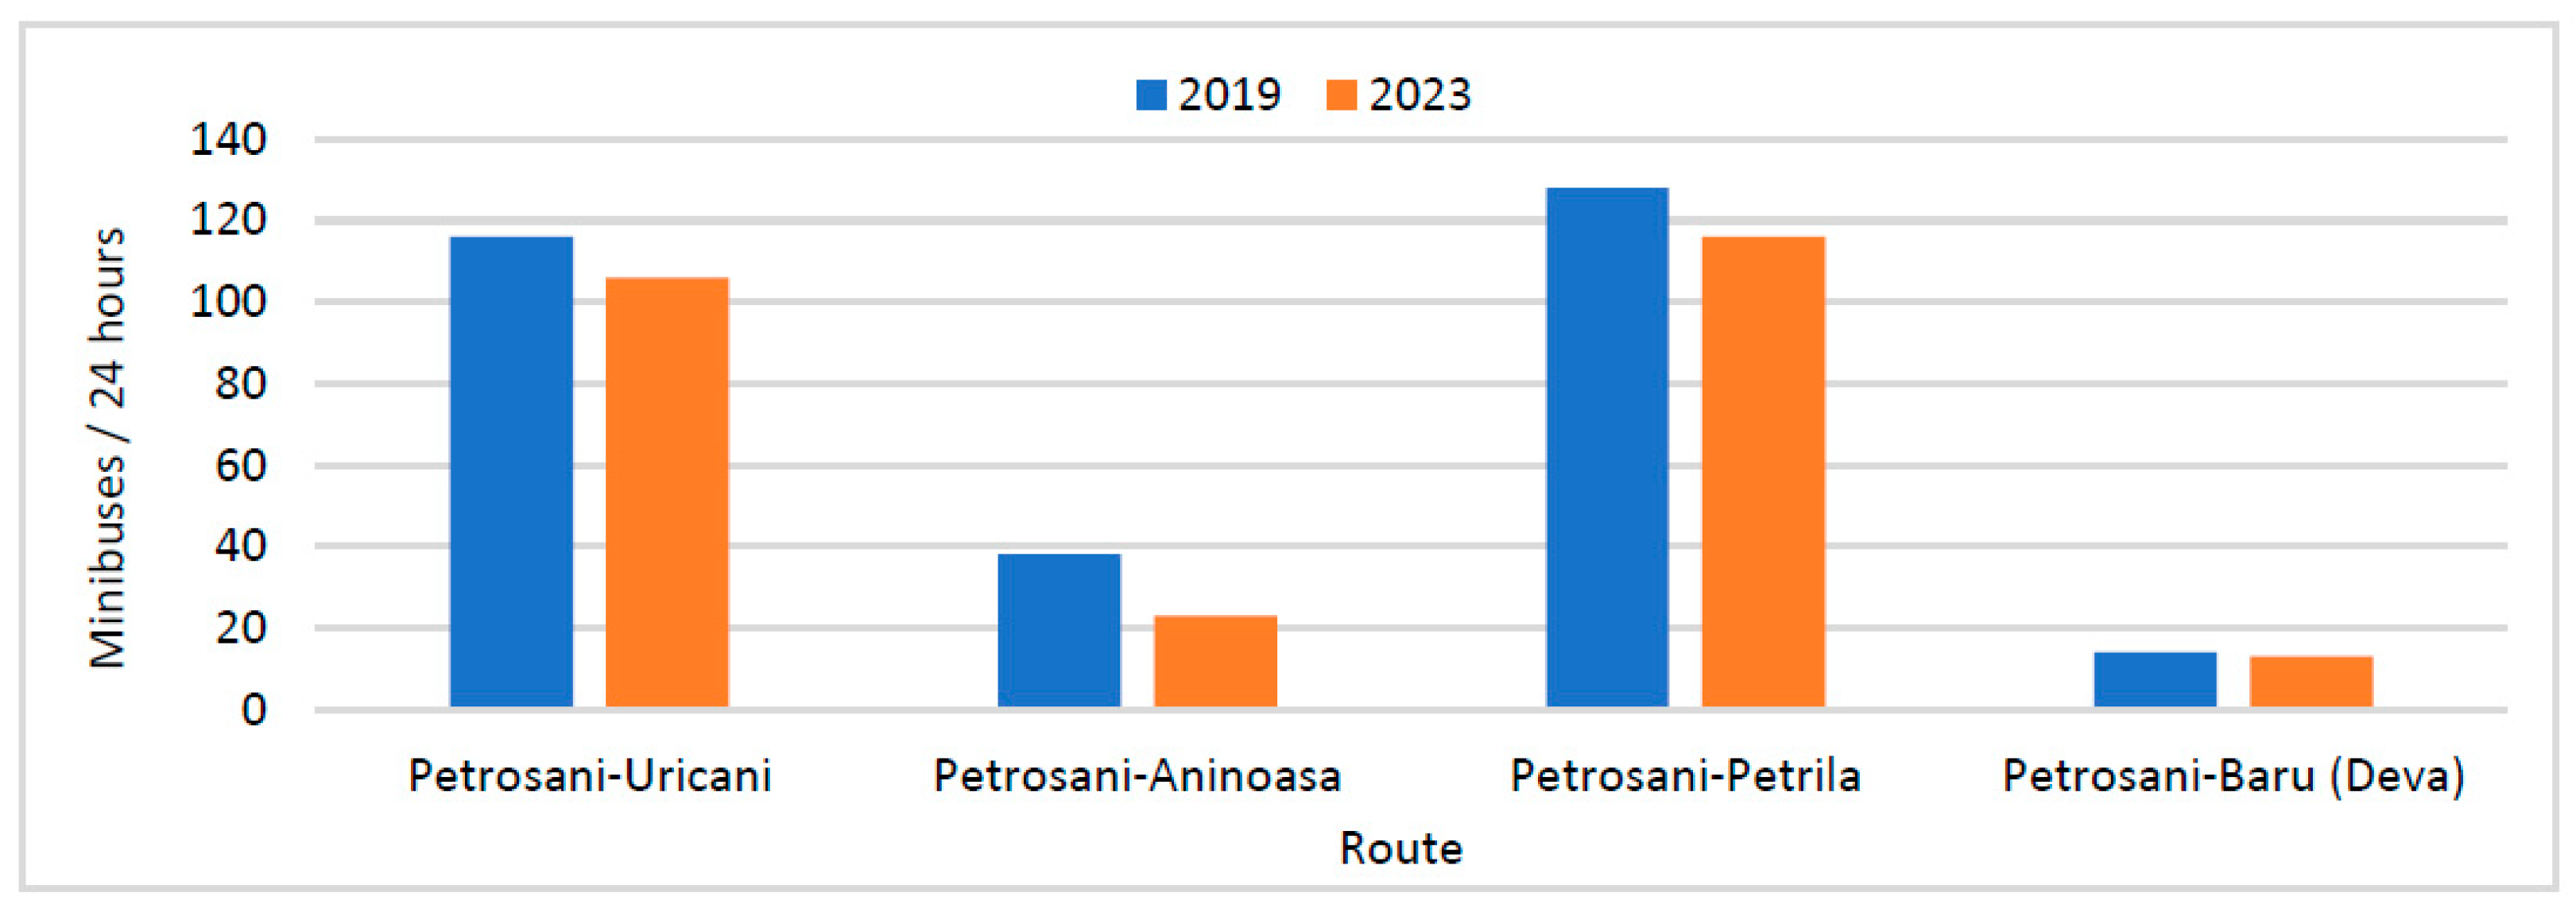
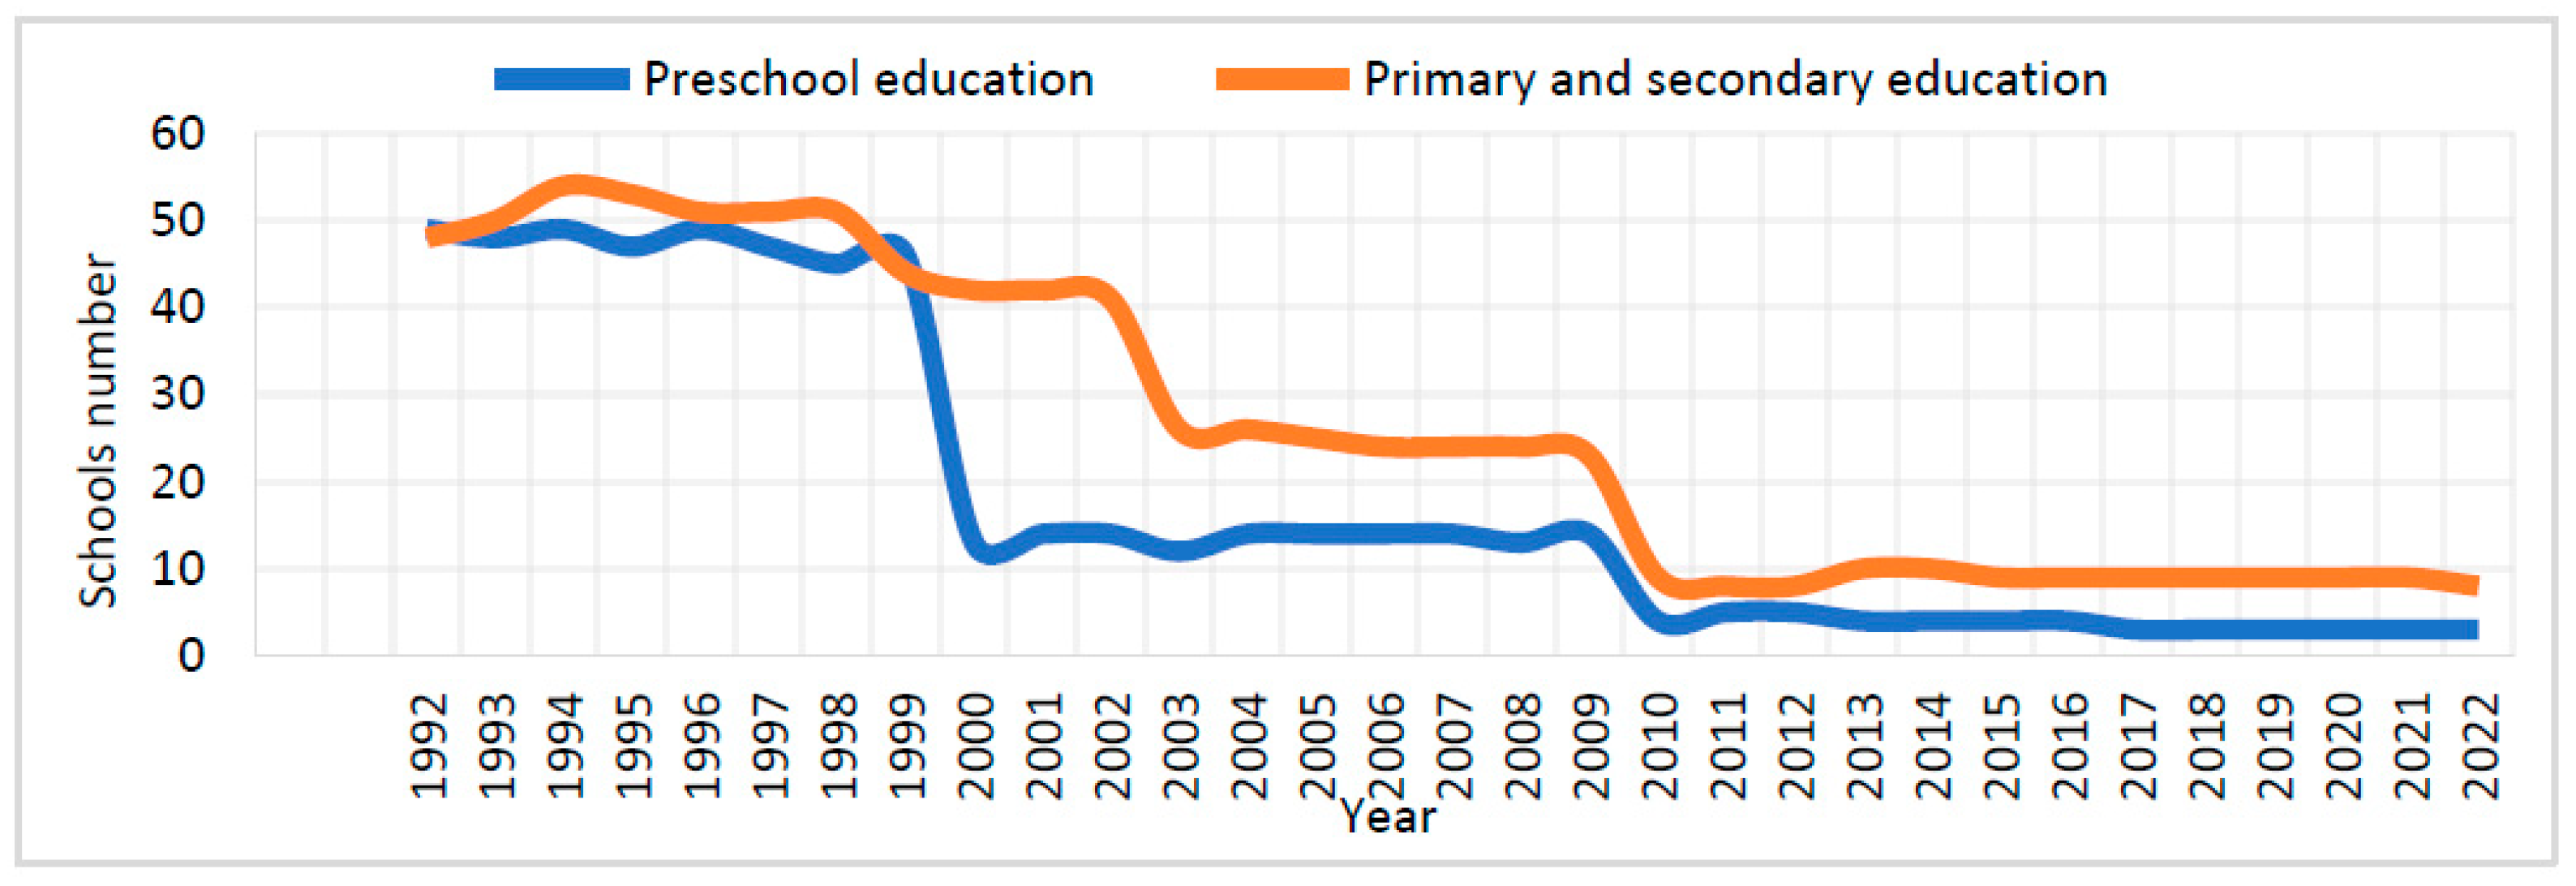
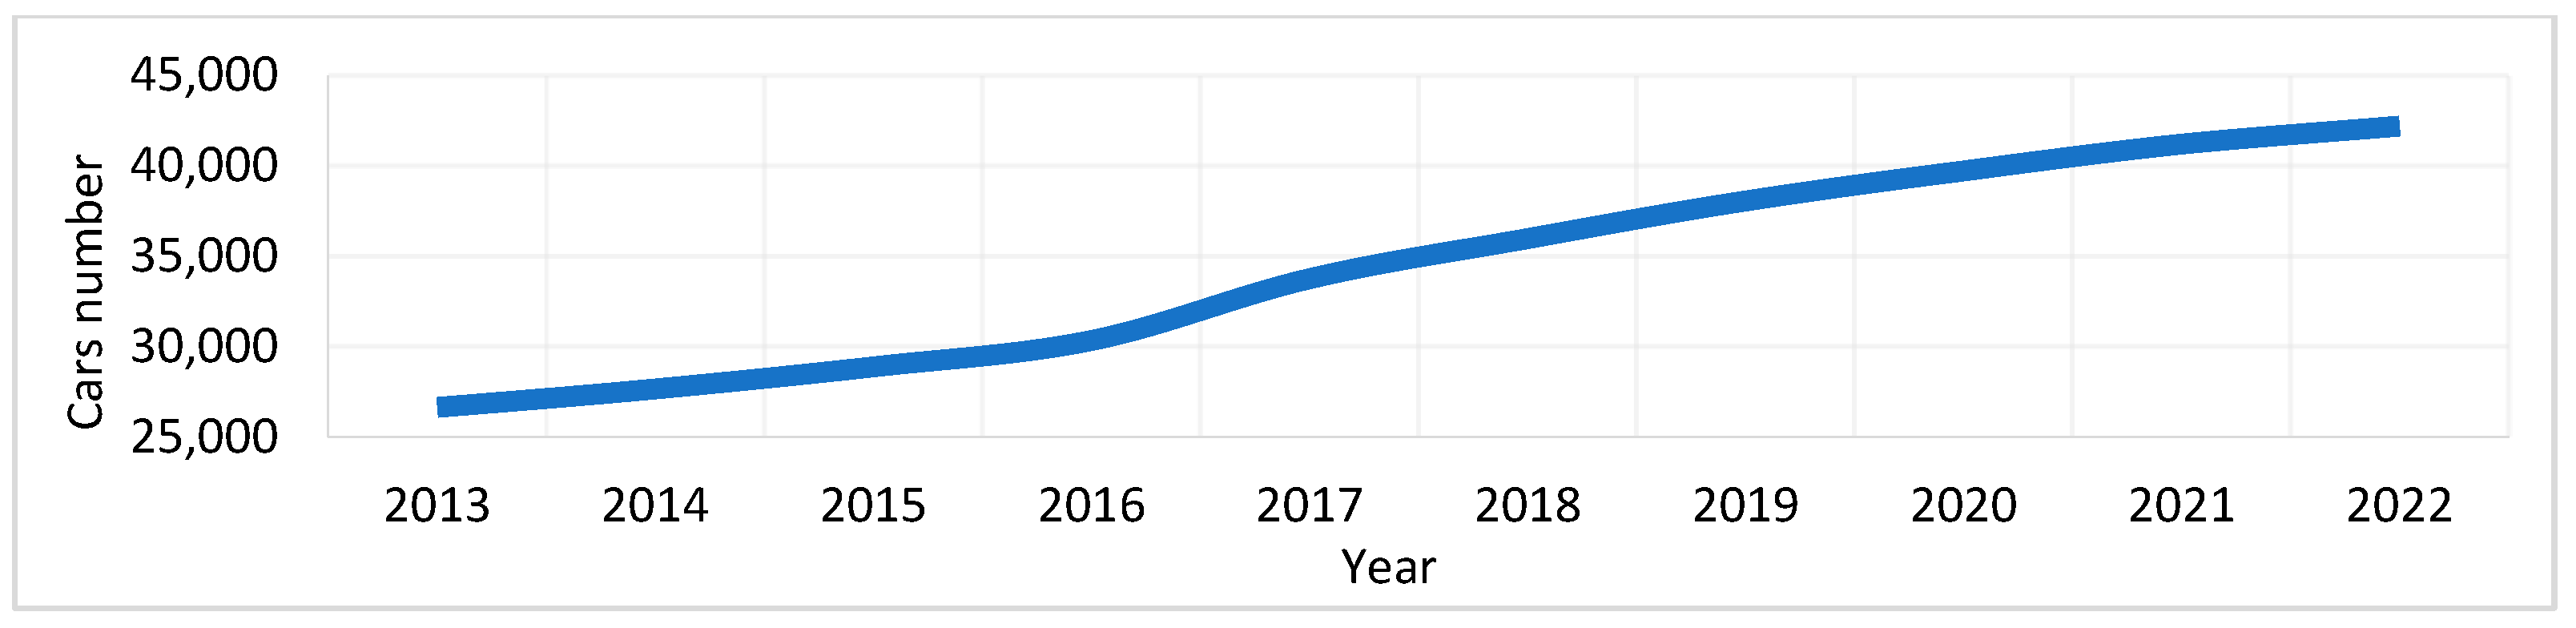
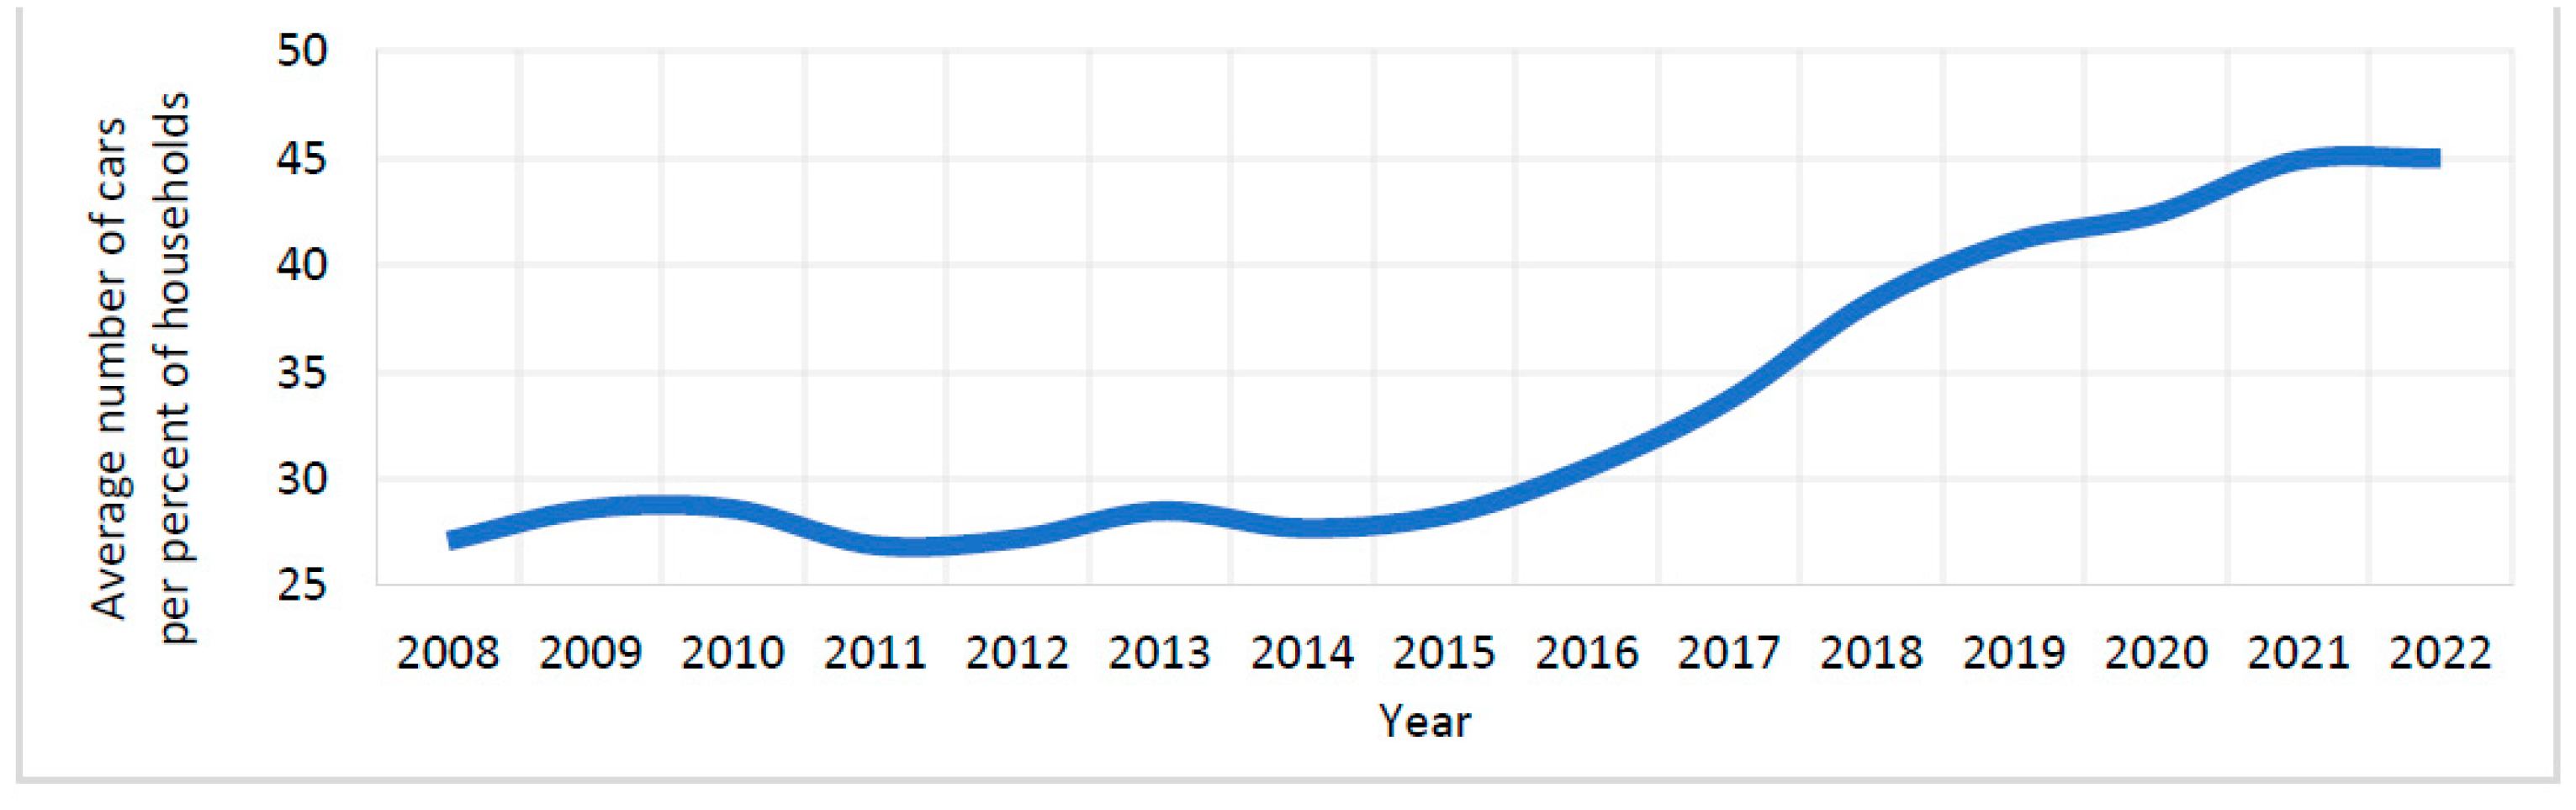
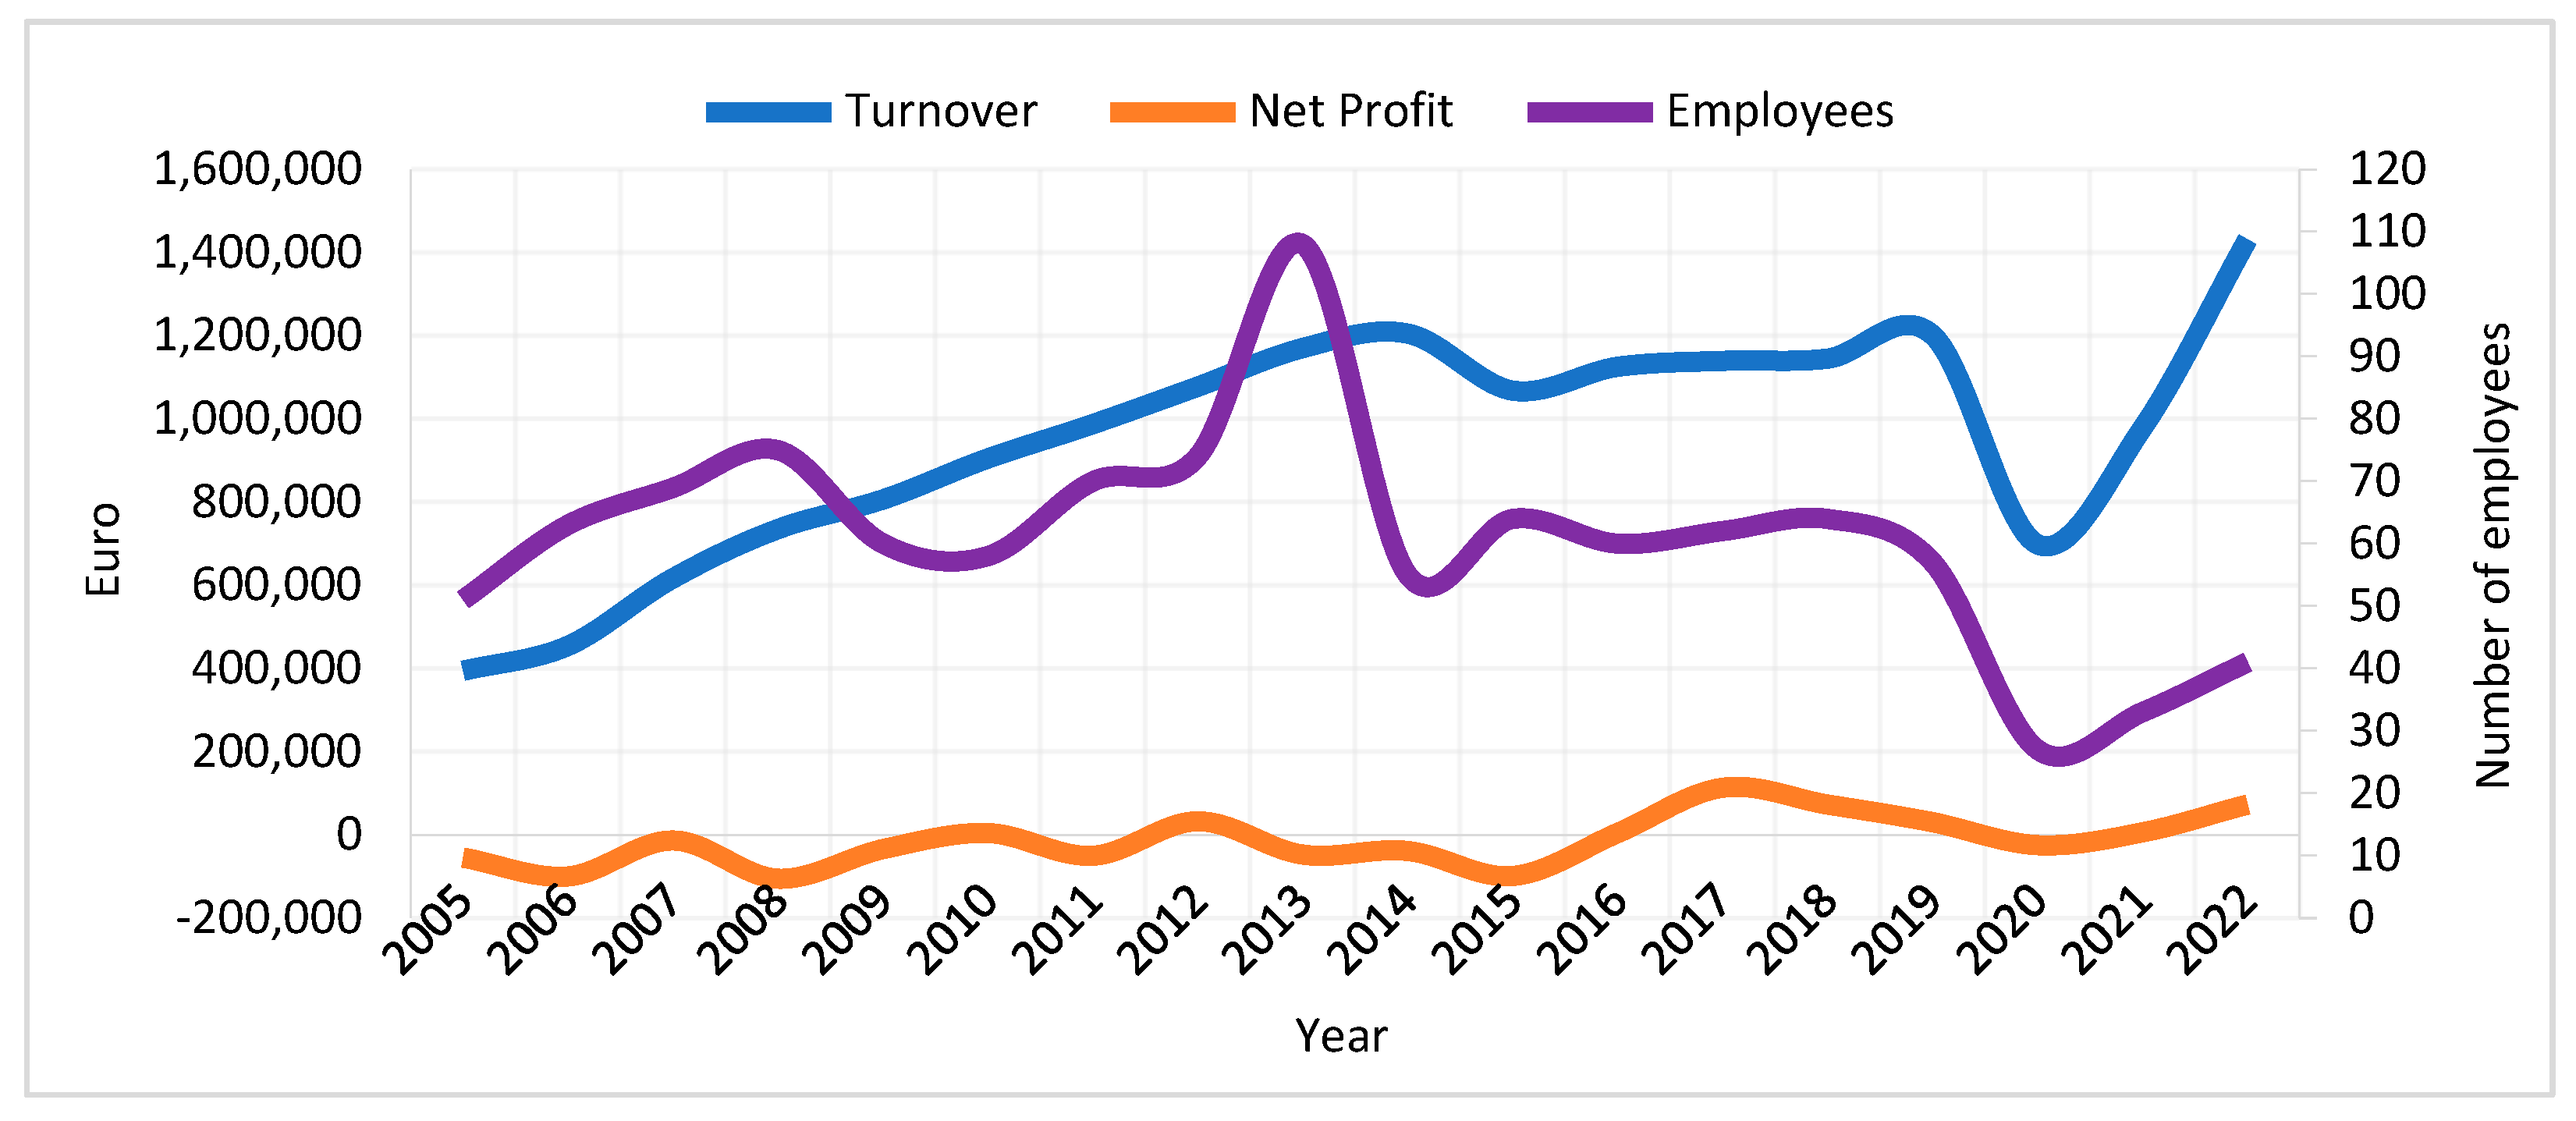
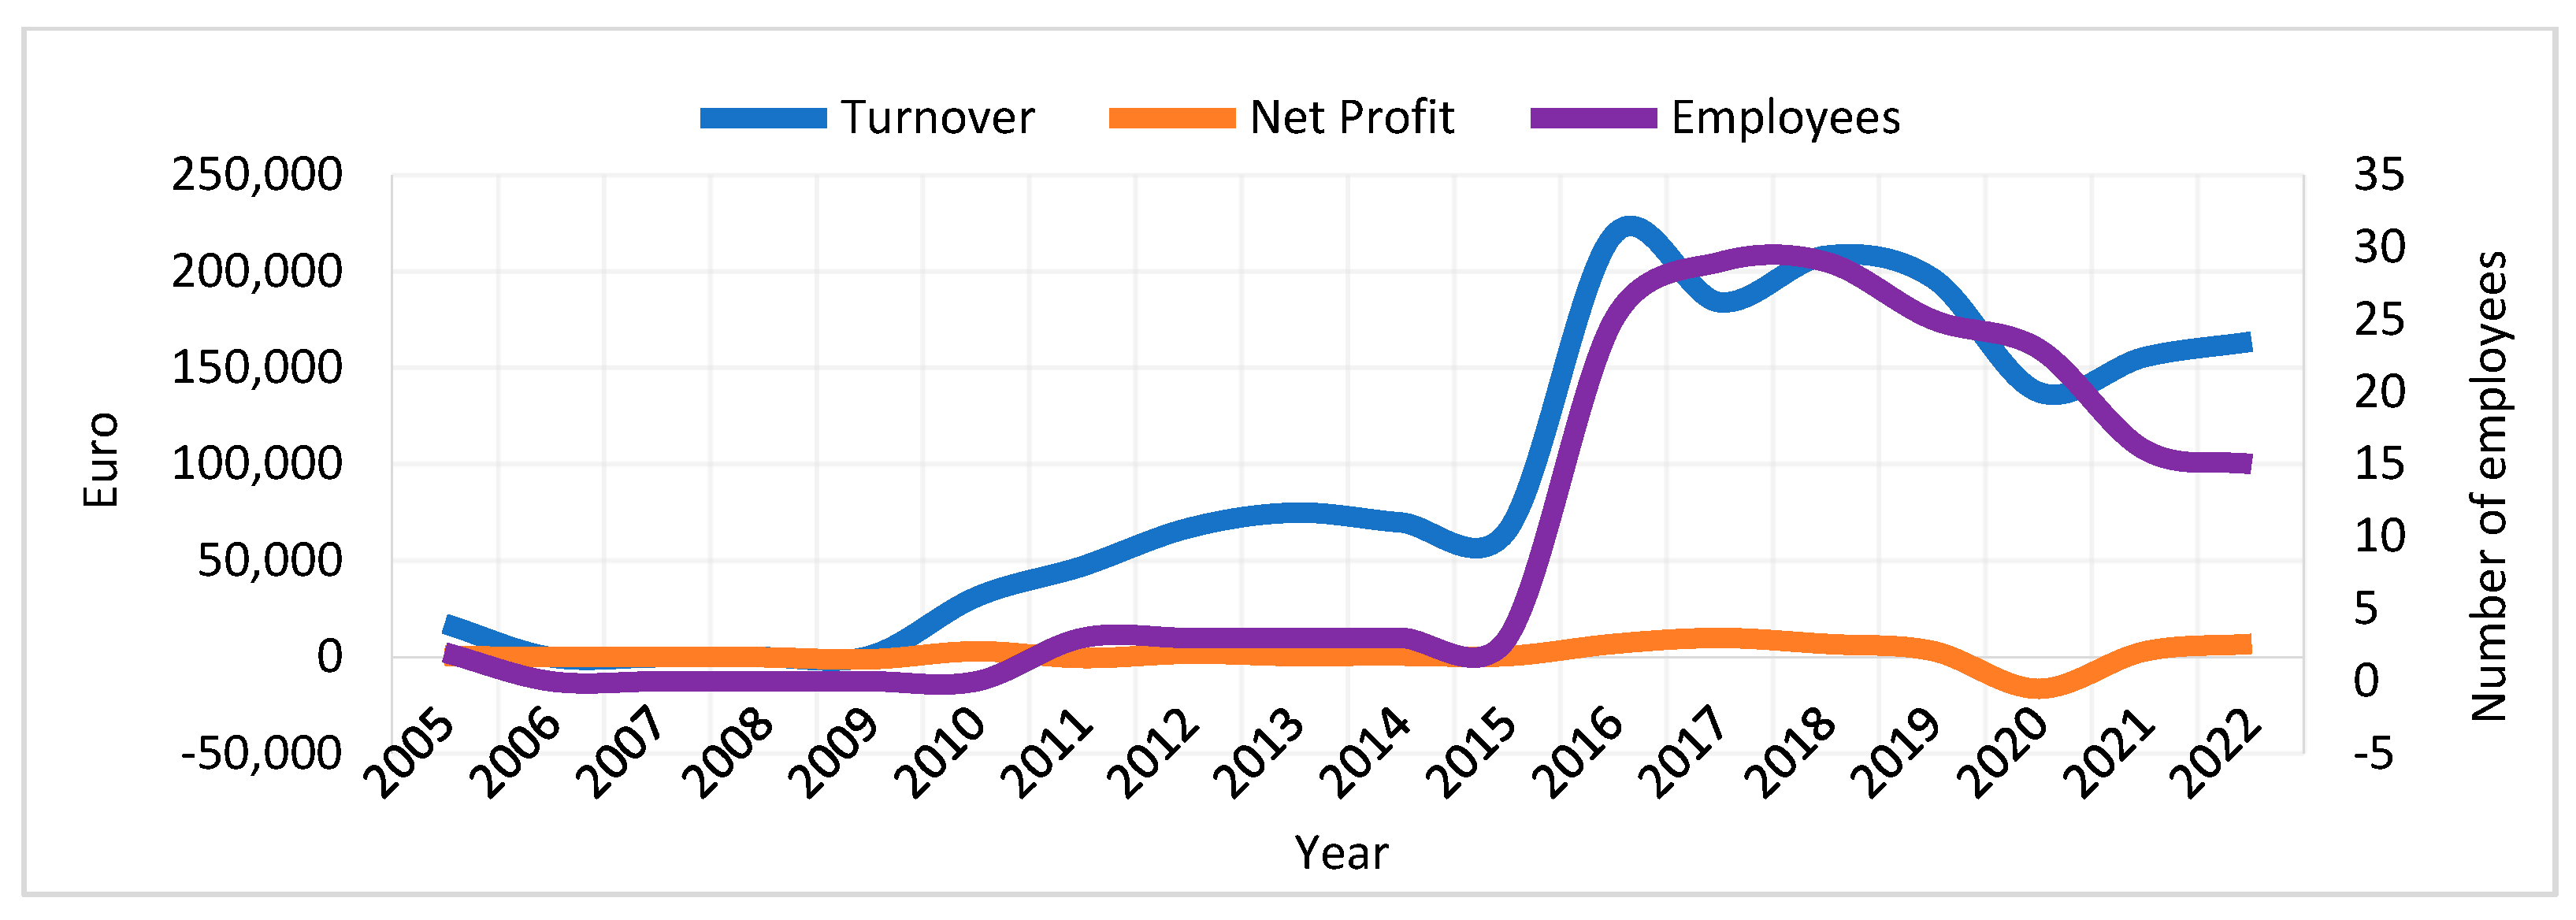
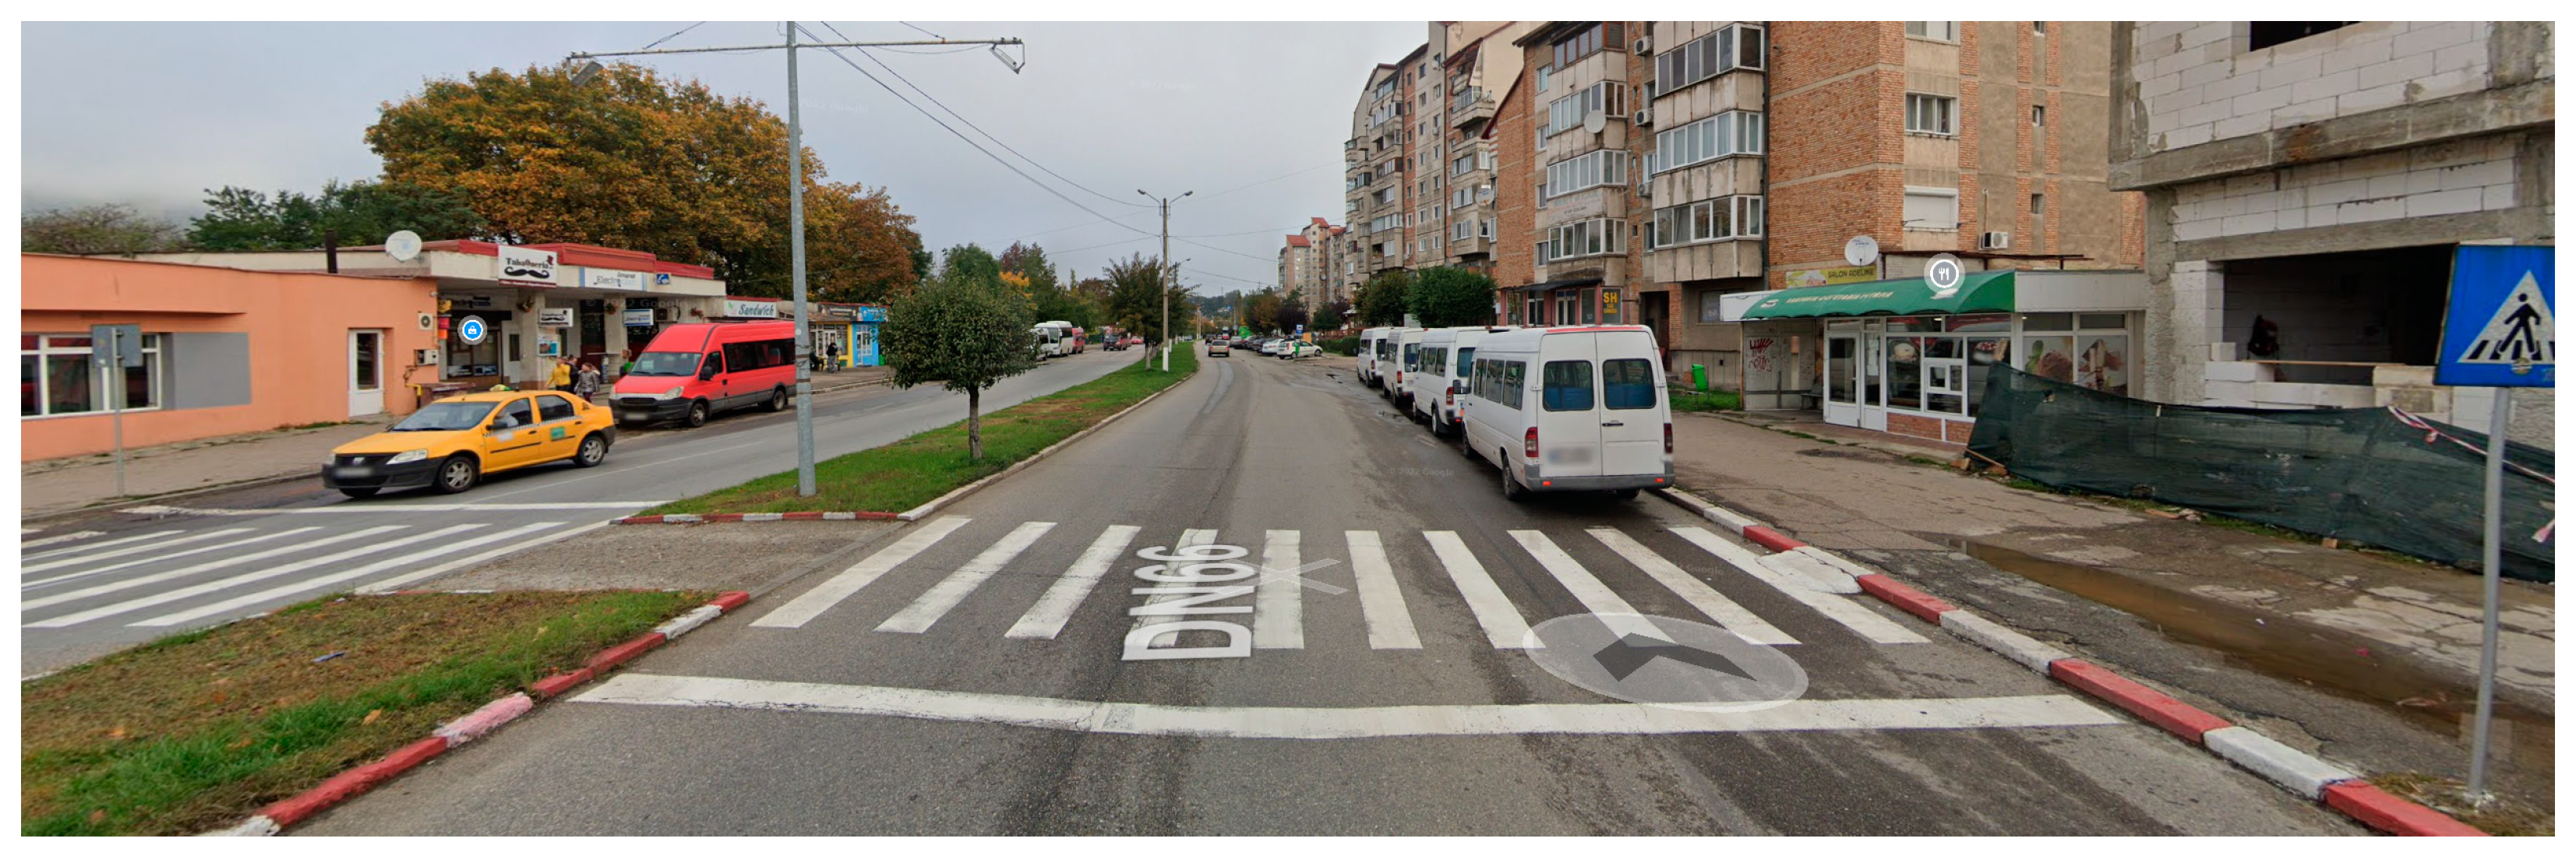
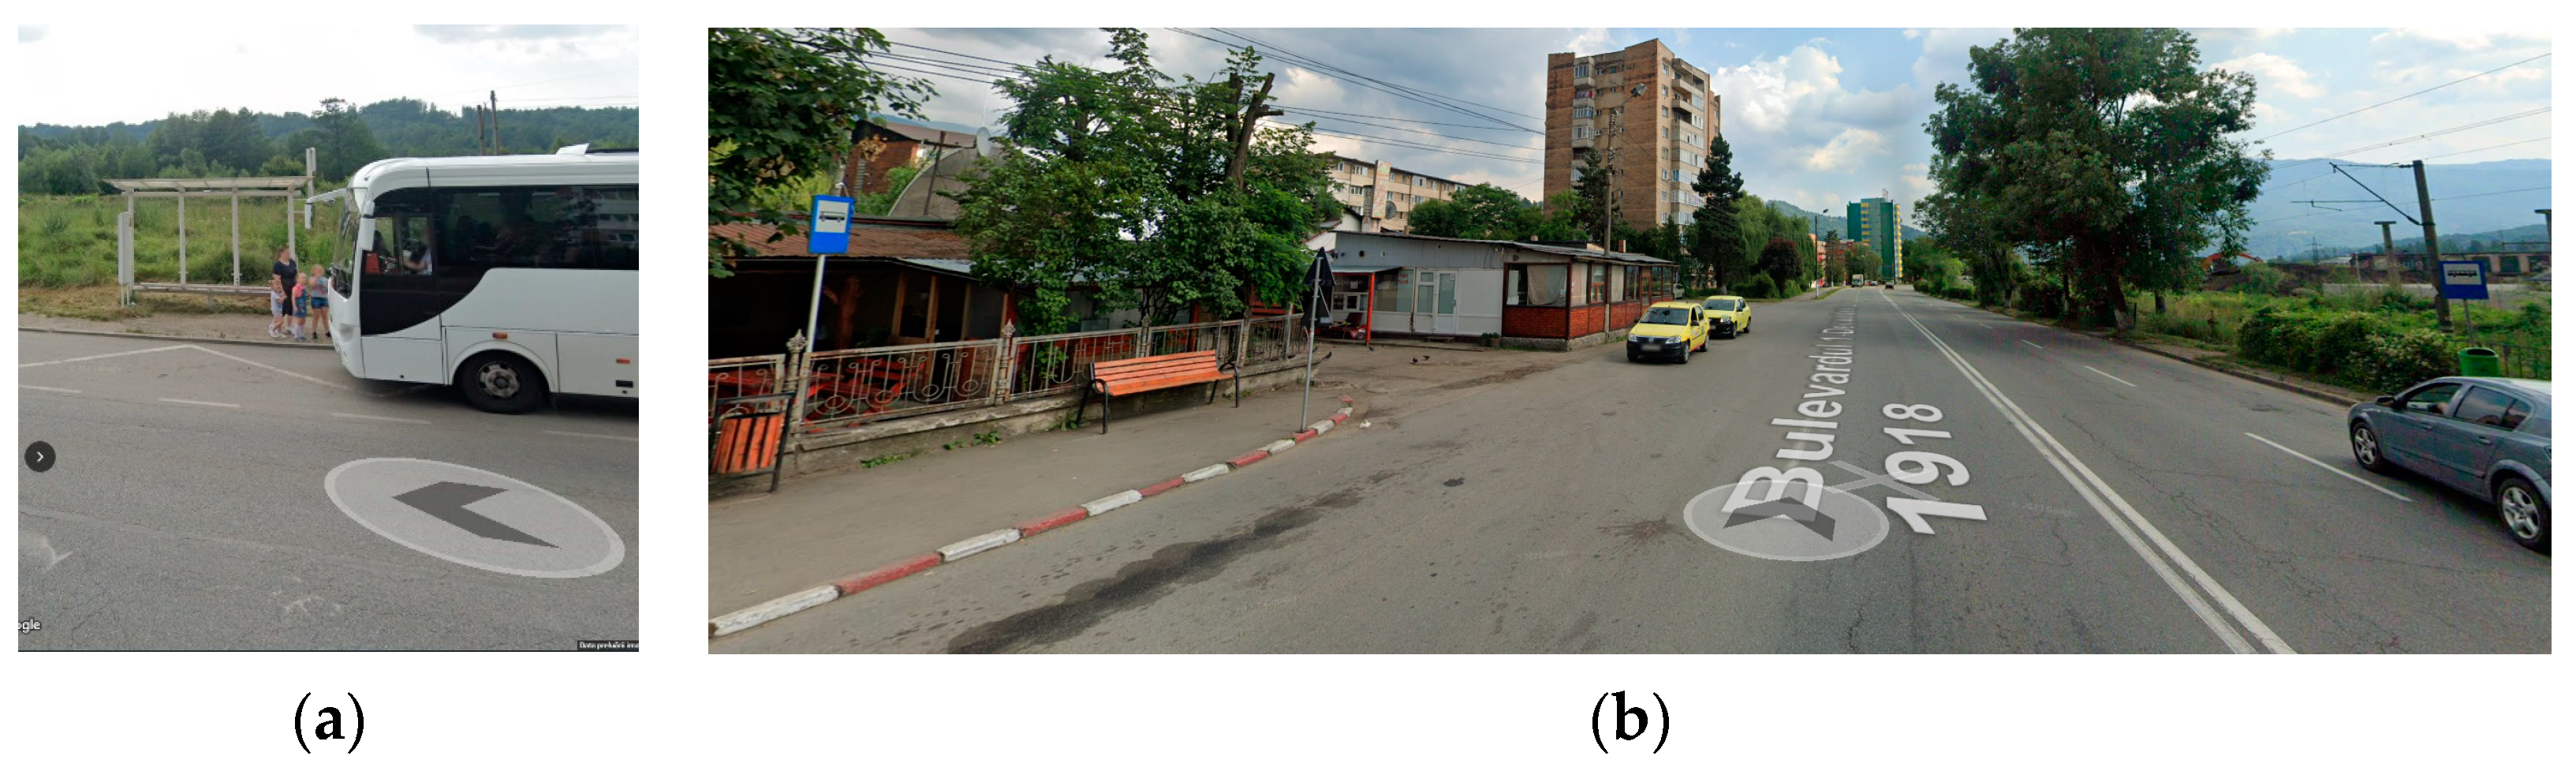
Table 1.
Metropolitan areas in the Petrosani Basin defined according to Law no. 246/2022.
| Lupeni Municipality | Petrosani Municipality | Vulcan Municipality |
|---|---|---|
| Uricani | Aninoasa 1 | Aninoasa 1 |
| Baru 1 | Petrila | Bănița 1 |
| - | Baru 1 | - |
| - | Bănița 1 | - |
| - | Orăștioara de Sus | - |
1 The administrative-territorial unit can choose the metropolitan area of which it is a part.
Table 2.
Quality of service levels (QoS) defined for the frequency of means of transport.
| QoS | Average Interval between Vehicles, min | Frequency, Vehicles/h | Follow-Up Interval |
|---|---|---|---|
| A | <10 | >6 | A traffic plan is not necessary |
| B | 10–14 | 5–6 | The service is frequent, but passengers need to consult a traffic plan |
| C | 14–20 | 3–4 | Maximum accepted waiting time |
| D | 21–30 | 2 | Unattractive service for people who have other alternatives available |
| E | 31–60 | 1 | Services available at hourly intervals |
| F | >60 | <1 | Unattractive services for all passengers |
Table 3.
Scheduled levels of quality of service for the public transport routes under analysis.
| Route | Route Length, km | Time Interval | Follow-Up Interval, min | Frequency, Vehicles/h | Level of Service |
|---|---|---|---|---|---|
| Petrosani- Baru | 22 | 06:00–08:00 | 30 | 2 | D |
| 08:00–15:00 | 60 | 1 | E | ||
| 15:00–17:00 | 90 | 0.67 | F | ||
| Petrosani- Uricani | 29 | 05:00–06:00 | 30 | 2 | D |
| 06:00–09:00 | 6 | 10 | A | ||
| 09:00–12:00 | 9 | 6.7 | A | ||
| 12:00–16:00 | 7 | 8.6 | A | ||
| 16:00–19:00 | 12 | 5 | B | ||
| 19:00–21:00 | 30 | 2 | D | ||
| 21:00–23:00 | 60 | 1 | E | ||
| Petrosani- Aninoasa | 17 | 05:00–09:00 | 30 | 2 | D |
| 09:00–12:00 | 60 | 1 | E | ||
| 12:00–15:00 | 30 | 2 | D | ||
| 15:00–21:00 | 60 | 1 | E | ||
| Petroșani- Petrila | 14 | 05:00–06:00 | 60 | 1 | E |
| 06:00–10:00 | 7 | 8.6 | A | ||
| 10:00–12:00 | 10 | 6 | A | ||
| 12:00–17:00 | 7 | 8.6 | A | ||
| 17:00–19:00 | 12 | 5 | B | ||
| 19:00–21:00 | 30 | 2 | D | ||
| 21:00–23:00 | 60 | 1 | E | ||
| Piața Victoriei- Aeroport | 4.2 | 06:00–07:00 | 30 | 2 | D |
| 07:00–08:00 | 8 | 7.5 | A | ||
| 08:00–13:00 | 9 | 6.67 | A | ||
| 13:00–15:00 | 8 | 7.5 | A | ||
| 15:00–16:00 | 9 | 6.67 | A | ||
| 16:00–19:00 | 12 | 5 | B | ||
| 19:00–20:00 | 20 | 3 | C |
Disclaimer/Publisher’s Note: The statements, opinions and data contained in all publications are solely those of the individual author(s) and contributor(s) and not of MDPI and/or the editor(s). MDPI and/or the editor(s) disclaim responsibility for any injury to people or property resulting from any ideas, methods, instructions or products referred to in the content. |
© 2023 by the author. Licensee MDPI, Basel, Switzerland. This article is an open access article distributed under the terms and conditions of the Creative Commons Attribution (CC BY) license (https://creativecommons.org/licenses/by/4.0/).
Share and Cite
MDPI and ACS Style
Mihailescu, S. Prospective Evaluation of the Public Transport System in the Petrosani Basin. Sustainability 2023, 15, 16481. https://doi.org/10.3390/su152316481
AMA Style
Mihailescu S. Prospective Evaluation of the Public Transport System in the Petrosani Basin. Sustainability. 2023; 15(23):16481. https://doi.org/10.3390/su152316481
Chicago/Turabian StyleMihailescu, Sorin. 2023. "Prospective Evaluation of the Public Transport System in the Petrosani Basin" Sustainability 15, no. 23: 16481. https://doi.org/10.3390/su152316481
Note that from the first issue of 2016, this journal uses article numbers instead of page numbers. See further details here.