1. Introduction
It is expected, by many parties, that either pure electric or electrified (i.e., hybridised) road vehicles will be rapidly able to satisfy most of the local and collective transport needs. In our paper we provide a scientific–technical answer to how far partial or full electrification of buses used for public transport can be actually pursuable.
The electrification of powertrains, including, notoriously, both different hybrid solutions and battery electric vehicles (BEVs), evidently offers the possibility of eliminating local pollutants derived from the combustion and partially from the braking phases, and of reducing the impact on the use of finite and declining reserves of crude oil, as well as those of natural gas, leaving them free for other more crucial uses which lack alternatives. Urban public transport, in particular, seems to need to take this step and to comply with such a request—given its semi-continuous, local and scheduled operation—besides generating, when using conventional fossil fuels, local and concentrated emissions of pollutants exactly where the majority of people in the world live.
This paper provides, at first, a wide survey of the main solutions that are already present on the market, or foreseen for the near future, on the electrification of local public transport fleets. Thereafter, it also compares them through numerical examples and a practical case study pertaining to the city of Turin (IT), where static inductive charging has been experienced for many years [
1].
Particular attention has been paid to engineering problems and to the range, i.e., the autonomy on battery or batteries of the vehicles as a function of their mass, electric energy storage system, charging opportunities and infrastructure, while comparing the time and efficiency of alternative recharging systems.
On the base of this analysis, the decision makers should be able to rely on more scientific–technical bases for deciding in a proper way whether and how far a more-or-less complete electrification is technically a viable solution, having the energy consumption and the consequent emissions as drivelines, though not excluding some pure economic aspects within this paper.
Sometimes the choice of forcing the migration from a conventional fleet, equipped with internal combustion engines (ICEs), to another composed of battery electric buses (BEBs) is purely economic: i.e., obtaining new vehicles whose maintenance is included in the assistance guaranteed by the producer and derived from a commitment funded by a local public government, reducing thereafter the expenses of maintenance typically associated with ICEs. However, this solution based on BEBs neglects other technical aspects that applications made from 2010 until 2023 allowed to emerge: the over-sizing of the fleets, actual available SOCs, impact on the electric grid, removal of a vehicle from the occupied lane in the case of insufficient SOC, etc.
The current interest in pure electric or BEBs as well as in electrified powertrains for buses as a solution to urban public transport needs [
2,
3,
4,
5,
6,
7]—extensively renewed and strengthened with respect to the 1960s–1970s, when trolleybuses were already much employed in many parts of the world—is closely linked to the growing awareness of the environmental issues throughout the planet.
Environmental issues are notoriously related both to local pollution and to greenhouse gas (GHG) emissions, which have instead an effect on a global level, and are the subject of recent policies, like, for example, the Green Deal in the European Union in 2020 or the Green New Deal-like initiative unveiled in the USA in 2021.
As a matter of fact, large differences arise when addressing local pollution on one side and global CO
2 emissions on the other, calling for the well-known Well-To-Wheel (WTW) analysis as well as the Life Cycle Analysis (LCA), for electric and non-electric transport, widely treated in the literature [
8,
9], as further referred to below.
Within this general context, the aim of this work (
Figure 1) is, firstly, to assess the advantages of adopting BEVs for busways, having a distributed power feed as an alternative for trams and trolley buses; thereafter, a comparison with conventional fuel is proposed, in order to allow rational choice by policy makers and PT operators. Such an approach requires an integrated perspective of vehicles, recharging infrastructures, scheduling and route management, as well as an information exchange with AVM (Automatic Vehicle Monitoring) and, in general, ITS (Intelligent Transport Systems) [
10,
11,
12,
13].
2. Factors That Are Driving the Migration towards Electrification of Public Transport
Electric vehicles and electrified powertrains (i.e., hybrid, including plug-in hybrid or PHEVs) evidently offer the possibility of eliminating, totally or partially, local polluting emissions derived from combustion, not those from mechanical braking or from the rolling of the wheels, and of contributing to conserving the finite and declining petroleum reserves for better uses or presently unavoidable ones. In addition, with the undergoing electrification—even if partial—of some private light vehicles, the green image and social desirability of the urban bus may rapidly become a real possibility, though with some drawbacks.
Besides this undergoing process, with respect to powertrains for public transport fleets, ITS relying on AVM components also represent a requisite for better electrification and a potential way to amplify the impact of the electrification policies, as they can improve the efficiency of public transport services in terms of regularity, hourly or daily capacity, and user acceptance, besides monitoring the SOC (state of charge) of batteries at fleet level. At the same time, the current ITS solutions for PT sometimes need to be re-designed and re-developed, bearing in mind the new system requirements and new functionalities, e.g., those related to enhanced energy consumption monitoring and control, which may arise from the change in the powertrain.
Starting from this viewpoint, several European- and global-level policies have been encouraging cleaner transportation [
14]: for example, the European transportation road map “Away from oil” and European Directive 2009/33 [
15] (updated by Directive 2019/1161 of the European Parliament [
16]), which imposes a conversion of PT, in ecological terms, by introducing an overall energy analysis for the life-cycle cost (LCC) of public transport vehicles and an increasing quota for clean vehicles on the total number of purchased vehicles by public tender procedures in the different European countries (45% starting from 2 August 2021, and 65% from 1 January 2026 for Italy); half of the clean vehicle numbers must be zero-emission vehicles, evidently only at the local level.
The electrification of urban public transport would favour improvements in the quality of ordinary city life, provided that such energy can be achieved at a higher level from different primary sources than crude-oil, preferably renewables. Moreover, conventional ICE buses are sometimes among the main sources of noise pollution, whereas BEBs are almost silent, apart from the noise that comes from wheel rolling. In addition, BEBs or the electric traction of plug-in hybrid vehicles do not emit any polluting emissions, which are known to be a possible risk to human health and the cause of dirtiness, from the traction.
Finally, as a reminder that large differences can arise when addressing local pollution on one side and global CO
2 emissions on the other, we need to recall that the emission factor is the ratio of the amount of pollution generated to the amount of a given raw material processed; such differences may become evident at local level with just one example (
Table 1), referring to 18 m long diesel buses and trolleybuses operating in Rome (IT), where an advantage of between 50% and 66% for electric traction is shown.
These local effects of full electrification are mainly due to the increase in the very high average efficiency of the Italian electric system, given the diffusion of combined cycle systems and cogeneration plants for the combined production of electricity and heat, and to the contribution of renewable energies, which more than doubled from 2005 to 2022 (19% of the overall national energy production, and up to 39% of the whole production of electricity). The thermoelectric CO
2 emission factor has consequently declined from 708 g CO
2/kWh in 1990 to 415.9 g CO
2/kWh already in 2018, less than 300 g CO
2/kWh (
Figure 2), taking into account also the renewable energy sources [
17,
18].
We need to recall that the presence of the fixed electrical facilities for supplying power to BEBs is sometimes perceived as invasive and anti-aesthetic, besides requiring relevant investments, not to mention the maintenance and operational costs. Just as an example, for trolleybus lines in an Italian city like Milan, the investment cost can be quoted as around 200 ÷ 400 k EUR/km (authors’ direct information source). As a consequence of this and of the frequent pantograph spillage, at the time, in the 1960s, trolleybus technology started to be discontinued, with the subsequent scrapping of old vehicles and decommissioning of many power lines.
On the contrary, cities such as Bologna and Modena (IT), which have kept trolleybuses since the 1960s with their overhead power lines, now benefit greatly by maintaining the operation of these buses without major investment costs.
Meanwhile, the role of catenary-free electric traction, that is the adoption of BEVs in local PT has been increasing, thanks to the great improvement in electric storage systems; from 2012–2022, indicatively, lithium batteries have been gradually extensively adopted in the major new bus acquisitions around the world. However, the literature explains well [
19,
20,
21] that batteries cannot resolve the zero-emission mobility problem, mainly due to their limited range and various recharging constraints when compared to oil-derived fuels, apart from the not necessarily positive condition from the whole energy-chain point of view. Conversely, the very low internal resistance in charging, with respect to lead–acid batteries, lithium batteries, and super capacitors has offered innovative features also in terms of ultra-fast (less than an hour) recharge, and has opened additional potential electric traction uses for local public transport (LPT).
In LPT, in fact, the typical vehicle mission, with the regularity of operation and very frequent stop-and-go, allows the extension of the range in travel, as long as the stops can be used for charging. This concept, recognised for time to time also as biberonage, has been known for a long time (nearly twenty years, in a general way), but only a new generation of storage systems would make it actually possible, as outlined hereafter.
Euro VI emission standards were introduced by Regulation 595/2009, on the type-approval of motor vehicles and engines with respect to emissions from heavy-duty vehicles (Euro VI) and on access to vehicle repair and maintenance information, by amending Regulation (EC) No 715/2007 and Directive 2007/46/EC and by repealing Directives 80/1269/EEC, 2005/55/EC and 2005/78/EC. The relatively recent Euro VI standards for diesel buses are very stringent, although they have not yet imposed limits regarding the dangerous PM 0.1 emissions. Furthermore, the efforts and investment necessary to reach such standards are so high that they make one wonder if they are worthwhile or whether it would be better to move towards cleaner transportation, just at a local level, based on either electric-motor (EM) or range-extended solutions or even PHEV options, for aggregating the benefits of ICE and EM, whenever viable.
However, the pros of ICE connected to the related fuels and tanks, which are mainly based on great autonomy on battery (range) and worldwide economies of scale and of competencies accumulated over more than a century, involving as well a wide distribution of both components and skills for their maintenance, should not be neglected.
Finally, from a technical point of view, the advantages of electric traction in an urban environment are already well known:
The possibility of regenerative braking, reducing thereafter the use of mechanical brakes with consequent PM;
Very limited energy losses during idle operation;
Excellent torque characteristics;
No need for a gearbox or clutch when dealing with a BEV;
High efficiency of the electric powertrain;
Simple and reliable electric motor.
Although this reasoning is becoming more diffused, some legitimate and defendable doubts about the feasibility of electric LPT remain widespread; there have been only a low number of actual implementations in Europe and in the world to date, and these have sometimes been followed by a certain scant attention by both industry and the academic world. This has happened despite the wide range of technical solutions employed and an apparent lack of relevant failures.
3. Literature Review
Urban bus fleets typically operate within predefined routes where mileage and maximum-capacity levels are well established, lending themselves well to conversion to electric [
22]. Despite this, perplexity on the part of both public decision-makers and public transport operators as to whether it is really feasible to deploy electric vehicles for this purpose is widespread; this research aims to examine, as objectively as possible, under what technical and partly economic conditions it makes sense to migrate to electric fleets; this is hard to find in the literature: papers are mainly concentrated on the environmental aspect, on the assessment of actual energy consumption, on economic aspects, on energy storage and on fast charging.
The environmental driver is usually the main one for sustaining BEV for LPT in the literature: in [
23], the authors underline how BEVs have proven to be a workable solution for minimizing environmental pollution and how the BEV has generally received substantial attention from both individual customers and corporate users; nevertheless, the green environment, charging infrastructure and technology are the three main challenges leading to the slowing down of the progress of the penetration of BEVs into the Greater Bay Area (GBA) of China.
In [
24], too, the authors outline how a migration towards an extensive electrification of the public transport sector is ongoing in many cities around the world, as a response to local pollution and, possibly, to global warming: as a matter of fact, upstream of local pollutant emissions there is clearly energy consumption, and on this [
24] has some interesting insights. In this paper, the electrification of the PT system of the city of Savona is proposed. The study is addressed specifically towards the urban lines and it aims to compute the average energy consumption of a BEB operating on a section of one existing line; the scope is to investigate the optimal location, size and number of opportunity fast chargers to install. The analysis shows that the correct service operation of the electric buses traveling on the examined line can be achieved by installing, at selected significant points, an overall number of five opportunity chargers, each one characterised by a 400 kW rated power.
As a matter of fact, there has been quite a lot of progress in recent years, with 600,000 electric buses already in operation globally in 2020 [
22]. Most of these vehicles were operating in China, with large fleets beginning to develop or being assessed in Europe and Latin America [
25]: this has allowed the literature, in the last two years, to enrich the outcomes derived from applications in the field, favouring to some extent the possible expansion of the fleets. However, as identified by [
26], the transition to electric fleets is not and will not be without challenges for PT operators, in terms of investment in the appropriate charging infrastructure and the high capital cost of vehicles; battery costs, whilst decreasing, are still significant, representing up to 50% of the vehicle price [
27].
In [
28] results based on a case study of a real-world bus network show that a comprehensive integration of BEB is feasible and economically beneficial. By analysing the impact of battery capacities and charging power on the optimal fleet transformation, the authors outline how medium-power charging facilities combined with medium-capacity batteries are superior to networks with low-power or high-power charging facilities [
29]; they state that Battery Electrified Public Transit (BEPT) is a promising solution to transport-related climate emissions and urban air pollution, but introduces a potentially challenging large, accompanying demand on the low-voltage distribution network. Their paper presents a tool for estimating the energy and charging demand of electrified public transit using public data that are available in over 150 cities/states globally and they apply the tool in two case studies.
Some economic aspects are, to some extent, detailed in a few papers: as discussed by [
30,
31] there is uncertainty associated with battery price estimates, due to differing battery chemistries, expected length of life, and the purchasing/leasing agreement between bus manufacturers and operators.
Previous studies illustrate a wide range of costs for BEB applications, with higher values reported by [
32], estimating 750–850 USD/kWh for NMC batteries (lithium nickel–cobalt–manganese), 900–1540 USD/kWh for LFP (lithium ferrophosphate), 1500–2000 USD/kWh for LTO (lithium-titanate) batteries, and lower values of between 500 and 800 EUR/kWh.
Whilst the particular chemistry is not stated, the IEA tend to have the lowest reported battery-cost values: a comparison of BEB and ICE buses carried out by [
33] was based on estimates of 400, 260 and 120 USD/kWh and the most recent Global EV Outlook, citing 137 USD/kWh as the weighted average cost of battery packs [
25].
The literature has also already investigated to some extent the actual energy consumption of PT: an evaluation was made by [
34] of the energy consumption of BEBs operating on real day-to-day drive cycles, as well as on standardised drive cycles. The simulations conducted for the real drive cycles showed an average battery energy consumption of 1.35 kWh/km, while the standard drive cycles showed an energy consumption between 1.24 and 2.48 kWh/km. The reduction in the battery energy consumption during the real cycles was stated to be due to the regenerative braking energy recovered due to these cycles taking the road gradient into account.
The energy consumption of BEBs depends heavily on the simulated drive cycle [
35]: both real drive cycles and standard drive cycles were considered. The two standard drive cycles investigated were the Braunschweig and the Manhattan bus cycle, which showed energy consumptions of 1.0 kWh/km and 1.3 kWh/km, respectively.
There is still uncertainty as to how many different factors, including ambient weather conditions, passenger occupancy and vehicle age will impact on the energy-consumption performance throughout the life of the battery or the vehicle [
36]. This subject is also examined by [
37], by assessing also the influence of the implementation of electro-mobility assumptions on the reduction in air pollution in cities in terms of sustainable urban transport systems.
On the other hand, as regards the most recent recharging possibilities, in [
38], electrification and the fast recharging of buses for public transportation in urban areas is explored; the authors underline the high reliability of installed storage and recharge systems. The authors highlight how performed mission profiles stress the system with a relatively high mileage and repeated acceleration and braking cycles. The authors have simulated and designed different storage and recharge technologies that have been installed and tested on a fleet of revamped electric minibuses. In this work, attention is focused on the design and simulation of a bus equipped with high-power lithium batteries. The proposed storage is recharged by a fast station fed by a flywheel system. The authors describe the proposed solution and its advantages. The description of the whole activity is performed with particular attention to the implementation and to the experimental results of activities performed at the ENEA laboratories of Roma Casaccia (Italy).
Still on energy storage and fast-charging possibilities, in [
39] the paper presents an overview of ultra-capacitor basic technology and an evaluation of the applicability of this ground-breaking cutting-edge technology to the central short-range transit-bus market, followed by a technical evaluation of some prototype of the ultra-capacitor bus experiences currently being tested in Europe and China.
Ref. [
40] proposes an innovative and simple fast-charging infrastructure for ultra-capacitors (UC) to be used in urban public transportation applications. An ultra-capacitor tank is proposed onboard the vehicle, whereas one or more stops will share a ground UC system. The energy requirements, sizing and a complete system description are covered in this paper.
In [
41] the authors propose a transit-route-network electrification problem dealing with the optimal selection of existing bus lines to be operated by battery-assisted trolleybuses (BATs). Their model was applied to a real-world case study in Athens, Greece, with results showing that design objective prioritization largely affects the degree of electrification attained.
In [
22], the authors examine the impact of geographical location on the energy consumption of double-deck battery electric buses operating in four UK cities. By considering seasonal variation in ambient temperature and an assumed battery degradation process, the implications for operational cost and carbon emissions were investigated.
In summary, the literature is mainly focused on partial aspects of the electrification of public transport: the environmental role is often emphasised, in some cases going upstream of the problem by analysing actual consumption and sometimes invoking the concept of the overall energy cycle, from the source to the wheels or WTW (well-to-wheel), for any comparison with fleets equipped with various thermal engines. Part of the literature, which is more focussed on economics, addresses battery costs and the actual cost of operating public transport with electric vehicles. Finally, a large number of papers focus on the possibility of energy storage and recharging solutions during operation. What the literature actually lacks is a system-wide view of the technical and economic viability of migrating to a fully or partially electric fleet; this paper has this original purpose as a main and system-wide view.
4. Batteries
As is known, electrical energy can be stored directly or indirectly using different methods: mechanically (electromagnetic flywheels), chemically (electrochemical batteries) and by modifying electrical or magnetic fields in super-capacitors [
42] or in superconducting magnets. As regards applications for road vehicles in general, modern advanced electrochemical batteries, such as lithium- (or nickel)-based, have replaced conventional lead–acid batteries in most sectors, and this is a subject dealt with in a subsequent application deeply analysed in this paper.
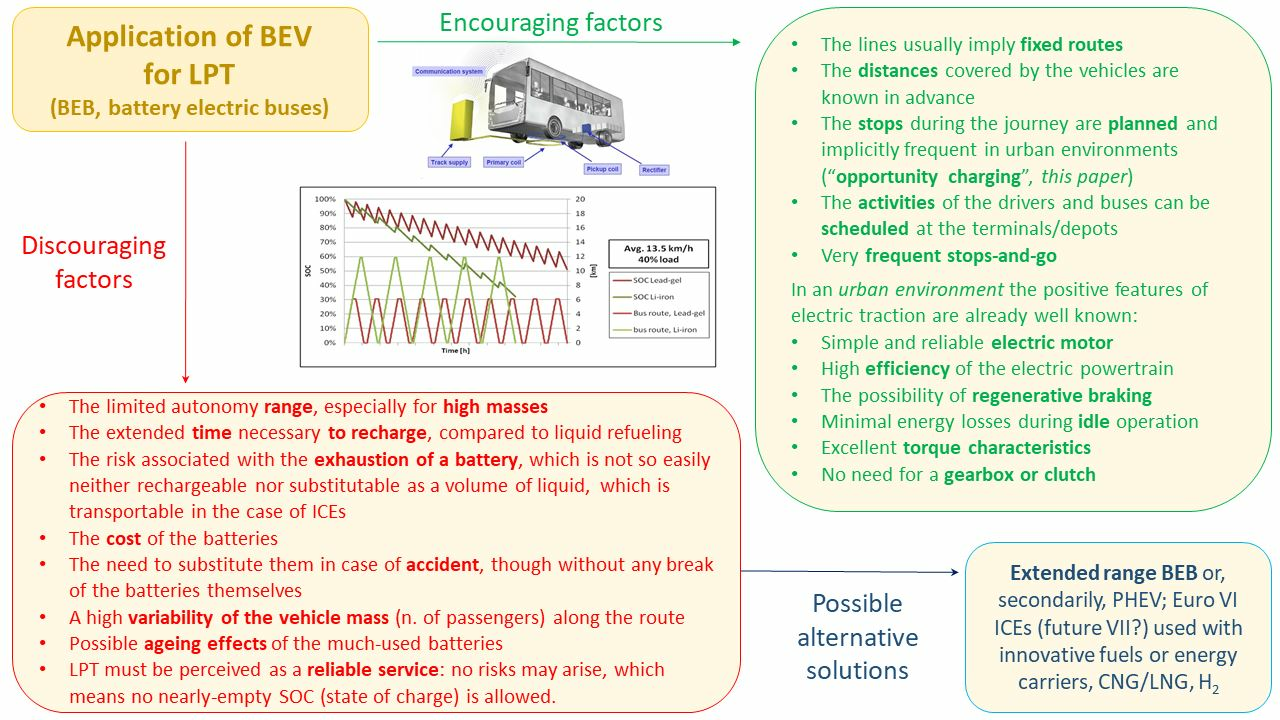
The principle behind the chemical reaction in the lithium-ion battery during charging and discharging phases is recalled in
Figure 3.
Li-ion batteries—of various chemical solutions, and three basic compositions (Li–ion with liquid organic electrolyte, Li–ion with polymer electrolyte and Li–metal with polymer electrolyte)—offer great advantages with respect to other batteries: a higher specific energy, charge current, cycle and operational life, as shown in
Table 2 [
44].
An important characteristic of the electrochemical components is the thermal runaway onset, as a type of intrinsic characteristic that can decrease the effort, cost and risk related to other measures currently required to ensure battery safety; C-rate is a key enabler for the usability of fast charging and ultra-fast charging, which correspond to C-rates higher than 1C and 3C, respectively. Both characteristics are favourable for LFP chemistry with respect to NMC chemistry, whose higher specific energy is less important when biberonage is possible.
Therefore, at the moment, LFP chemistry also seems to be a good choice for electrified public transport modes when ultra-fast charging is considered.
A technological roadmap (liquid-state batteries, generation 3; solid-state batteries, generation 4; Li-air and new ion-based batteries, generation 5) as reported in the «Strategic Research Agenda for batteries» [
45], are shown in
Table 3.
5. Evolving towards Opportunity Charging, Battery Sizing and Connected Public Transport
5.1. Limiting and Enabling Factors in the Use of Electric Traction in Public Transport
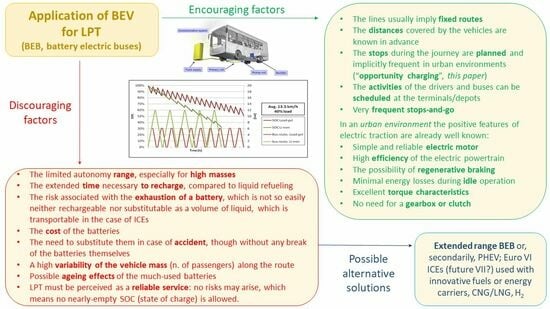
The most limiting factors for the spread of BEB are similar to those of private electric vehicles:
The limited range, especially for high masses;
The extended time necessary to recharge, compared to any liquid refuelling;
The risk associated with the exhaustion of a battery, which is not so easily rechargeable or substitutable as a volume of liquid, and which is transportable in the case of ICEs;
The cost of the batteries;
The self-protection of the batteries at low and, mainly, high temperatures (e.g., 40 °C), which implies either energy consumption or a turn-off of the electric supply to the EM;
The need to substitute them in the case of a crash or accident, although without any breaking of the batteries themselves;
The conditions set by the fire authorities regarding the risk of fire in the event of an anomaly or collision.
However, PT has some specific features which may help to encourage the use of electric traction:
The services imply fixed routes on a regular basis;
The distances covered by the vehicles are known in advance, with few variations;
The stops during the journey are planned or even scheduled (for the change of driver) and are implicitly frequent in urban environments;
The activities of both drivers and buses can be scheduled at the terminals/depots.
Nonetheless, some critical points may arise:
A high variability in the vehicle mass along the route;
Possible ageing effects of the much-used and rapidly recharged batteries;
Public transport has to be perceived as a reliable service: no risks may arise, which means no nearly-empty SOC (state of charge) is allowed.
Buses for urban transit have very predictable routes and the relative consumptions (
Figure 4) can easily be estimated by collecting vehicle data from the abovementioned AVM systems, e.g., identifying energy-critical paths and time windows, in this way enabling infrastructure planning and design activities, since consolidated solutions allow vehicles to be recharged en route at bus stops or at the terminus, by means of conductive charging, or even dynamically with inductive segments along the road for charging while driving.
Figure 4 represents in a synthetic way the energy usage for a bus used for public transport, including all the main sources of consumption.
Buses have to stop usually for layovers to satisfy time scheduling and to allow the driver to rest for some minutes. Transforming this time interval into opportunity charging might be a possible system solution.
The first electric battery bus models were provided with enormous battery packs, which allowed sufficient range for almost one day of operation, that is, as much as 200/250 km per day for a typical urban bus. An example is the K9 buses produced by the Chinese manufacturer BYD [
46]: they are 12 m long, provided with LFP (lithium ferrophosphate or lithium-iron phosphate) batteries (324 kWh), and are able to cover 155 miles (250 km) on a single charge in urban conditions, without considering onboard air-conditioning. However, the batteries adopted on similar buses are very large, heavy and expensive, since mid-sized electric buses need batteries with a stored energy of hundreds of kWh. If the batteries are not discharged completely each time, the charging of the battery from an industrial 43 kW socket outlet would last from 4 to 8 h, which is only acceptable for an overnight charging.
DC charging stations with a power of up to 450 kW are available for a faster charging, since LFP batteries can accept very high charging currents (bearing in mind the ageing effects of this solution on a number of batteries) that allow them to be charged in one hour or even in less time. LFP batteries can in fact support a charging current, expressed in C-rate, which, expressed in amps, is an A value up to 3 C, where C is the capacity; e.g., if the battery capacity C is 100 Ah and the C-rate is 2, the battery can be charged at 200 Ampere. In this case, a complete charge can be obtained in half an hour. Therefore, considering a nominal battery capacity of 200 Ah, a 2C current implies 400 A, and an acceptable charging power for an ultra-fast charge (FC) of a 750 V battery (150 kWh) is indicatively equal to 300 kW. Partial charging during the route would obviously require a few minutes.
Considering that the high cost of battery systems has been a key challenge for the introduction of electrified public buses in the last few years, any kind of infrastructure that would allow full or partial charging, in an integrated manner, during daily bus operations is absolutely necessary, as similar systems allow drastic reductions to be made in the battery dimensions. It would thus be possible to install a 3–4-times smaller battery.
5.2. Methodology and Numerical Examples
As regards the methodology used, it is a numerical analysis based on simple physical relations:
- (i)
Energy consumption of the bus,
- (ii)
The requested range,
- (iii)
Onboard storage or energy content,
- (iv)
Power and time requested of the charging station. This will be used in order to:
Explain how the declared result can be obtained, i.e., how much smaller can a battery be that is periodically recharged during the day;
Obtain the relationship between the power of the charging station and the time spent at the station, as a function of the distance to be covered between one charge and the next one.
As regards instead the
sizing of RESS (Rechargeable Electric Energy Storage Systems) for a 12 m long bus starting from a specific route, the requested, specific main performances have been obtained by simulation [
47]. The simulation model was developed in the Modelica language, through the commercial tool Dymola. Sub-models are related to the different powertrain components, i.e., ICE, gearbox and auxiliary subsystems.
Finally, a comparison of the night-time charging version and fast recharging at the bus terminus will be made.
Let us consider a battery that is able to accept a 2C current (completely charged in 30′), whose calculated range for its energy content E [kWh] is R [km]. If the recharging time T [1′] at the bus terminal is only five minutes (30′/6), it can be recharged with one-sixth of its energy E, i.e., E/6.
Let us consider a closed-loop route, X kilometres long, whose energy consumption is exactly E/6. At the bus terminal, the battery will be completely recharged in 5′; therefore:
from which we obtain:
Accordingly, for an urban stretch of a medium length X, for example 8 km, the battery may be sized for an autonomy on battery (range) R of about fifty kilometres (48 km), and not for the 150–200 km that are today required of a bus to carry out a whole day’s service, just as long as the six-times-smaller battery can still accept the high-power charging required at the terminus/terminal.
However, the safety margin is guaranteed by the night-time recharging, which allows the charged state of the battery to move over a restricted band of its energetic content E. The trend of the state of the charging of a 12 m Breda Menarini Zero-Filo Bus is shown in the following
Figure 5 [
47]. During the trip, the storage can count on seven partial recharges, while the initial recharging is replenished by a longer recharging at the terminus.
According to the above-reported considerations, a battery charger of power P will be able to recharge the battery with a 2C current, if P[W] is (numerically) two times the energy content of the battery, expressed in Wh. As a matter of fact:
Since E[J]/3600 = E[Wh] then E[J] = 3600 E[Wh], and the value of the recharging power, expressed in W, should be:
The relationship between battery charger power P and recharge time T is discussed below.
The “at energy equilibrium” duty cycle can be obtained for values that are different from the recharging time T [1′] or from the power P [kW] available at the terminus by resolving the following equation with respect to T or P:
where:
T = the cumulative recharging time, in 1′,
60′ − T = the operating time in 1′,
CEhourly= the hourly energy consumption in kWh/h.
In order to investigate the improvement to the system as a result of increasing the available charging power,
Figure 6 shows the charging time, as a percentage of the operation time, as a function of the charging power and for the length of the mission. The vehicle is the 12 m long bus considered in the numerical example reported below.
Let us now consider the same previously considered 8 km long route and Breda Menarini 12 m long bus Zero-Filobus, capable of recharging at the bus-stop terminal (time available for charging at the terminal: 7 min), thanks to the presence of a fast-charge station. The specific and requested performance of the bus are as reported in
Table 4.
The sizing of RESS (Rechargeable Electric Energy Storage Systems) should start from a consideration of the energy demand of the vehicle (
Table 5); simulations have been conducted to evaluate the energy consumption over a “real cycle” (aux. consumption is higher, according to the BredaMenarini experience), which represents the daily use of the vehicle at part and at full load.
Considering the low specific energy of electric energy storage systems, such consumption values, combined with a 200 km range, would result in a bulky and very heavy battery, three times the size requested, with fast charging at the bus terminal (
Table 6).
Therefore, the main advantages of full or partial charging during the daily bus operation, with respect to the standard pure electric mode (night charging only), are evident.
5.3. Warnings and Sizing of Batteries
However, it is important to consider that high-power charging causes a relevant stress to the battery and reduces its life; therefore, the EOL (end-of-life) needs to investigate the life duration, expressed in years, of the battery as a function of the peak power P and battery mass M, for a given number
n of cycles performed by the battery in a day [
49].
In light of these considerations, the optimal sizing of the battery pack, in consideration of the charging infrastructure system and routes, is now possible. This is of fundamental importance for the design of an electric bus, as it allows the costs, weight and energy consumption to be reduced, more space to be gained for passengers, and safety to be improved.
According to this design philosophy, more and more bus manufacturers are relying on modular battery systems which, on one hand, can be used for different vehicle sizes and, on the other hand, can optimise the battery size for different route characteristics (estimated consumption, travelled distance and average speed). It is of fundamental importance that the characteristics of an electric bus—in terms of energy storage, charging speed, regenerative braking efficiency, and consumption of auxiliary systems, including air conditioning—are closely matched to the charging regimes at the terminals and along the road, in consideration of the route length and the frequency of the roadside top-up stations. A good overall solution will offer a significant degree of flexibility in this respect. Enough energy to maintain sufficient range must be transferred in a time that is compliant with the passengers’ descent/ascent and/or the driver’s layovers. It is of great importance that a bus has enough autonomy on battery to survive a prolonged traffic stop or circumnavigate a roadblock, even in the worst case of the last top-up of the day being due. Some of the existing solutions are unduly vulnerable from this point of view, and a more conservative approach is required in a congested city. However, pure electric battery buses have been technically viable for a few years, as proven by the deployment of several different solutions throughout the world.
5.4. Integrated Urban Supervision for Reducing Risks Resulting from Reduced Range of the Vehicle
An interesting approach that is aimed at reducing the impact of roadblocks and, more generally of urban congestion on the range of electric buses is represented by integrated urban supervision platforms, which are able to monitor multiple data sources and real-time processes, such as distributed information, to build a reliable estimation of relevant events (e.g., road accidents, queues, peaks in mobility demand due to large events, and changing meteorological conditions), and to share data with mobility stakeholders in order to enable them to properly and dynamically adapt transport services to the new conditions. This kind of public transport control can basically be realised by implementing two main AVM sub-systems:
A vehicle segment, in which each public transport vehicle is equipped with an onboard control unit and an onboard CPU for performing local computational activities, a localisation system (e.g., a GPS-GALILEO system), a long-range data communication system (e.g., 4G/5G or LTE), a Graphical User Interface (namely GUI) to send instructions to the driver, and a software bridge with an onboard vehicle network data bus (e.g., CAN-FMS);
A traffic/service control centre, hosting the central CPU that performs complex computational activities, a database for service reference data and historical data and a GUI for the control centre operators, equipped with a suitable communication channel that enables data exchange with the controlled vehicles and with the relevant information providers.
This architecture can ensure that the AVM system has the possibility of providing the functionalities needed to realise a connected public transport system that is able to support electric vehicles:
Real-time traffic monitoring and event detection, with particular focus on the estimated and forecasted impact on the regularity of services and the energy consumption of vehicles;
On-line re-routing in the case of critical traffic conditions, e.g., roadblocks along the bus route that may result in a forecasted range with safety margins;
Optimised priority of public transport regarding traffic lights, which is able to give pre-emption to public transport vehicles crossing intersections, considering not only travel times or headway, but also the expected energy consumption and availability of charge zones (even inductive) at the intersections; this is to be potentially exploited during waiting times at the stop line, in order to have an additional energy supply;
Continuous vehicle status monitoring and energy-related notifications, to be delivered, e.g., to the AVM centre operators when the forecasted range of a vehicle is not sufficient to achieve the given target and to maintain energy safety margins;
Eco-driving features, e.g., GLOSA (Green Light Optimised Speed Advice) when public transport priority is not available, or a haptic throttle pedal, to support drivers with the necessary information to improve their driving style, which has, as described later on in this paper, a significant impact on the overall energy consumption.
If the abovementioned architecture is integrated into a charging infrastructure monitoring system (depot and road) a good optimization of the fleet would be achieved:
The optimization may result in a reduction of the total number of vehicles needed to substitute diesel or gas buses and the total number of charging points (charging standardization becomes very important).
6. Past Experience and State of the Art on the Market
Because of their limited specific energy (in the best condition 250–300 Wh/kg in 2022, possibly 350 Wh/kg in 2025; hypothetically 400 with solid-state batteries in use for a long period), batteries are not able to completely resolve the problem of the search for wire-free electrical driving, mainly due to the limited range of these batteries. An answer to this problem, which has been applied extensively in hybrid systems, is to have two different energy sources, an electrical drive bi-mode system fed by the electrical grid or by an onboard source (gen set or electric energy storage). In the first case, the batteries are charged during operation under catenaries or by inductive charging. A wire-free trolleybus could thus “de facto” be obtained by redesigning trolleybuses and giving them enough storage capacity to feed an autonomous electrical operation for longer distances.
A vehicle of this type, named Gyrobus (manufactured by Oerlikon) was operative in Belgium in the 1950s. Gyrobus was an electrically driven vehicle powered by a flywheel, an electrical machine, with a high inertial mass. The flywheel was connected to the power grid, through a three-phase connector, at the terminal stop. When the flywheel was fed, the vehicle accelerated to the nominal design speed, and the connector was then pulled down. The flywheel, through a controlled revolving speed reduction, was able, by decelerating, to convert kinetic energy into electric energy, and thus to feed the traction engine (
Figure 7).
The system allowed a range of the order of 5–6 kilometres to be reached, through a recharging that lasted 5 min.
However, such a system was not successful—it was decommissioned in the early 1960s—due to the excessive weight of the flywheel.
RESS (Rechargeable Electric Energy Storage Systems) with less weight than traditional batteries would be better for satisfying the needs of a vehicle with the dimensions of a trolleybus. These systems are the latest generation of lithium batteries and super-capacitors. Therefore, thanks to the recent developments in technologies, we are again witnessing a renewed interest in bi-modal systems with recharging stations at the stops along the route.
6.1. Supercapacitors
From the first years of this century, that is, from 2005 onwards, electric buses, powered by supercapacitors (SC), have been running in the streets of Shanghai, and in more than seven years they have travelled more than eight million kilometres. The limitations for the use of SC tanks primarily originate from the characteristics of the SCs that to date are available on the market. In fact, at the present stage of development, SCs suffer from a too-low value of specific energy (<1 Wh/kg), as well as a cell leakage current that could change from one cell to the others, which results in significant voltage imbalances in the stacked unit.
In order to make a wise choice of RESS, there are also other problems that have to be taken into account, related to the reliability, life and total cost of the system. In fact, a high peak power rate in the battery implies an increase in losses and temperature and therefore a decrease in lifetime, which results in the need to replace the batteries frequently throughout the life of the vehicle. The replacement costs include not only those associated with the purchasing and installation of a new battery, but also those of the removal and disposal of the old battery. Moreover, these batteries have difficulty functioning in cold weather, and therefore create significant inconveniences, whereas SCs can operate successfully over a wide temperature range, including temperatures as low as −40 °C.
Electric buses with hybrid super-capacitors, capable of storing 21 kWh within a smaller volume, have recently been tested in Italy (La Spezia and Turin/Torino—I;
Figure 8).
6.2. Batteries and Opportunity Charging
Ecoliner [
51], which utilises the Nanosafe lithium titanate technology, was the first to operate along a route 24 h a day, 7 days a week, on routes fitted with fast-charge stations. The key to the Ecoliner project has been the utilisation of fast-charge batteries. These batteries retain their energy reserves and charging profile for 8000 to 25,000 charge–discharge cycles, and can be quick-charged, from 10 percent to 95 percent, in ten minutes or less while the bus is at a stopover. Foothill Transit utilises a fast-charge system that operates directly from the grid. Ecoliner pulls into a fast-charge station halfway along the route at the Pomona Transit Centre and docks wirelessly,
Figure 9.
The “opportunity charging” system, with conductive recharging, has been introduced in recent years by Ekoenergetyka-Solaris-Endesa, Heliox-VDL, Volvo-ABB, Rampini-Siemens, Scania, and KiepeElectric.
6.3. Examples of Applications
6.3.1. Ekoenergetyka-Solaris-Endesa
This charging system for the buses consists of two different types of supplies, overnight and opportunity, with a fast charger of Endesa design. The semiautomatic supply at 400 kW DC, located in the final stop of the line, can charge the batteries from 20% to 80% in 7 min. Time of supply falls between 5 and 7 min (
Figure 10).
6.3.2. VDL-Heliox
Heliox is a spinoff of Phillips, in charge of development and commercialization chargers for electrical buses (
Figure 11). Heliox has a charger range from 50 to 80 to 120 to 200 to 300 to 450 to 600 kW. The buses have OCPP in order to be monitored and controlled remotely (via EMM, for example). Charge systems of 200 kW and above accept both 400 V AC and 10/20 kV AC. A direct 10 kV connection does not need an additional transformer station for 10 kV to 400 V. This lowers the project budget and the required land space, significantly. All the chargers are V2G (vehicle-to-grid) capable.
6.3.3. Volvo-ABB
ABB has Heavy Vehicle Charger (HVC), a modular fast-charging solution with an automatic connection system (ACS) to fast-charge electric busses with high power (
Figure 12).
The modular system offers 150 kW building blocks that can be used to expand up to 450 kW. The ACS includes a pantograph that makes physical contact between the charger and the e-bus for high-power conductive charging. The charger and its software are built based on a modular design that gives many advantages for servicing, and adds new functionality. The 150 kW of charging power is generated from three power modules of 50 kW, creating redundancy. In case a module should fail, the system can be remotely reconfigured to work with the remaining operative module(s) at any time, resulting in increased system uptime. The modular design also ensures simple jobs in the field where changing a power module is easier than replacing the full power electronics for full power.
6.3.4. Siemens-Keools
A top-down pantograph has been proposed in this case:
It can be used with multiple bus types and differing grid requirements;
For fully automatic charging, the e-bus is driven under the charging station, which then lowers the pantograph onto the contact rails;
Wireless communication via Wi-Fi IEEE 802.11a, based on ISO 15118-1:2019 [
52];
Four-pole pantograph; PE/isolation control;
Fully automatic connection and charging system;
150, 300 and 450 kW charger capacity (
Figure 13).
6.3.5. Siemens-Rampini
The system can be flexibly integrated into existing power networks and can draw the energy it needs, for example, from the local tram DC 750 V overhead-line network using a bottom-up pantograph. Using the onboard solution, the entire charging equipment is installed on the bus, including the two-pole pantograph for contact with the overhead line (
Figure 14). The charger power is 60 and 120 kW, and the battery is an LFP 96 kWh.
Kiepe Cagliari was the first Italian city, and one of the very first in Europe, to adopt fully electric trolleybuses with opportunity charging. This happened in 2016, within the framework of the UITP ZeEUS project (
Figure 15).
There is some justified concern about the compatibility between different pantographs and chargers. Almost every charger manufacturer claims to use standard protocols, but each case should be validated individually, and some pantographs have been found to be physically incompatible (four or five poles, top-down or bottom-up…). However, many cities are already deploying such electric bus systems. In order to meet the needs of these cities, the European bus manufacturers IVECO, Irizar, Solaris, VDL and Volvo, together with the charging-system suppliers ABB, Heliox and Siemens, have agreed to open up common, preferred interfaces for all of the market participants (
Figure 16). The Breda Menarini ZeroFilo bus shown here is the prototype developed in the mainframe of the PBI project, whose technical results are reported in [
48].
All of the aforementioned buses are supplied with a conventional system (pantograph) for recharging. However, for some time now, recharging systems have existed that transfer electric energy from a source to a user without the need for any contact between the two (contactless, wireless or plugless systems); these systems are attractive for many industrial and civil uses, because of their easy and safe use. They do not in fact require plugs to be inserted into sockets or the use of connection cables between the source and user.
The most convenient contactless systems for power applications adopt inductive coupling between two bobbins, which are called the transmitter (or primary) and the receiver (or secondary). In the case of a contactless system used for recharging the accumulators of an electric vehicle, the transmitting bobbin is buried, while the receiver bobbin is placed onboard the vehicle.
The first commercial dynamic wireless charging electric vehicle, the On-Line Electric Vehicle (OLEV), was deployed in 2009 by the Korean Advanced Institute of Science and Technology (KAIST) [
53], in South Korea [
54].
In Europe, PRIMOVE (Bombardier) was developed for various vehicle applications. It includes a package of induction charging solutions for electric buses. It also includes charging infrastructure, a battery, and a propulsion system. Piloted and commercial induction bus lines have been installed in Berlin, Mannheim and Braunschweig in Germany, and in Bruges and Lommel in Belgium.
A further step ahead has been made with resonant-type inductive coupling systems, which are able to transfer a significant amount of electric energy from the source to the receiving bobbin, even if they are not aligned, and to maintain elevated efficiency. The main advantage is that they can transmit to greater distances, that is, of the order of some tens of centimetres, and it is therefore not necessary for the transmitter to be lowered so as to be in contact with the receiver.
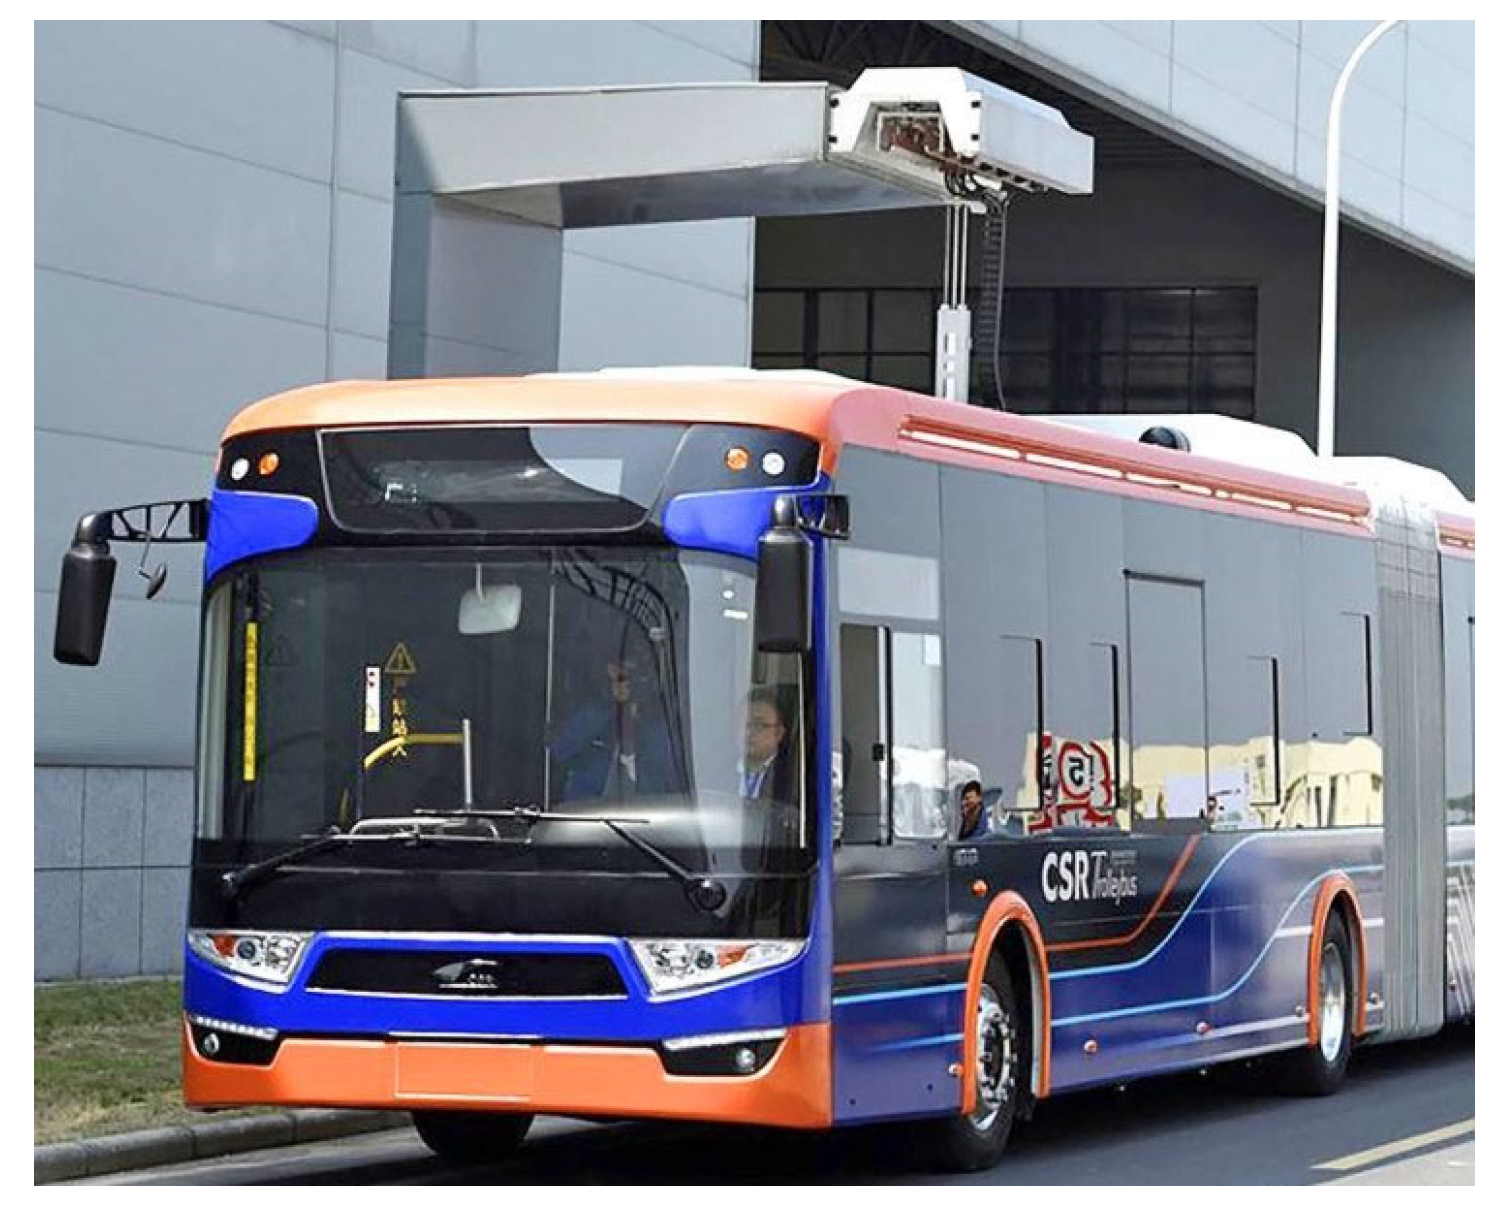
In China, the world’s fastest-charging electric bus, which takes 10” to completely recharge for the needed range to the subsequent stop, is in service in the coastal city of Ningbo, China (
Figure 17). The bus, manufactured by China South Locomotive and Rolling Stock Corporation (CSR), made its debut on a 24-stop, 7-mile route around the city. Each charge allows the bus to run for about three miles; the lightning-fast charging time means the bus can recharge at many of its stops along the route.
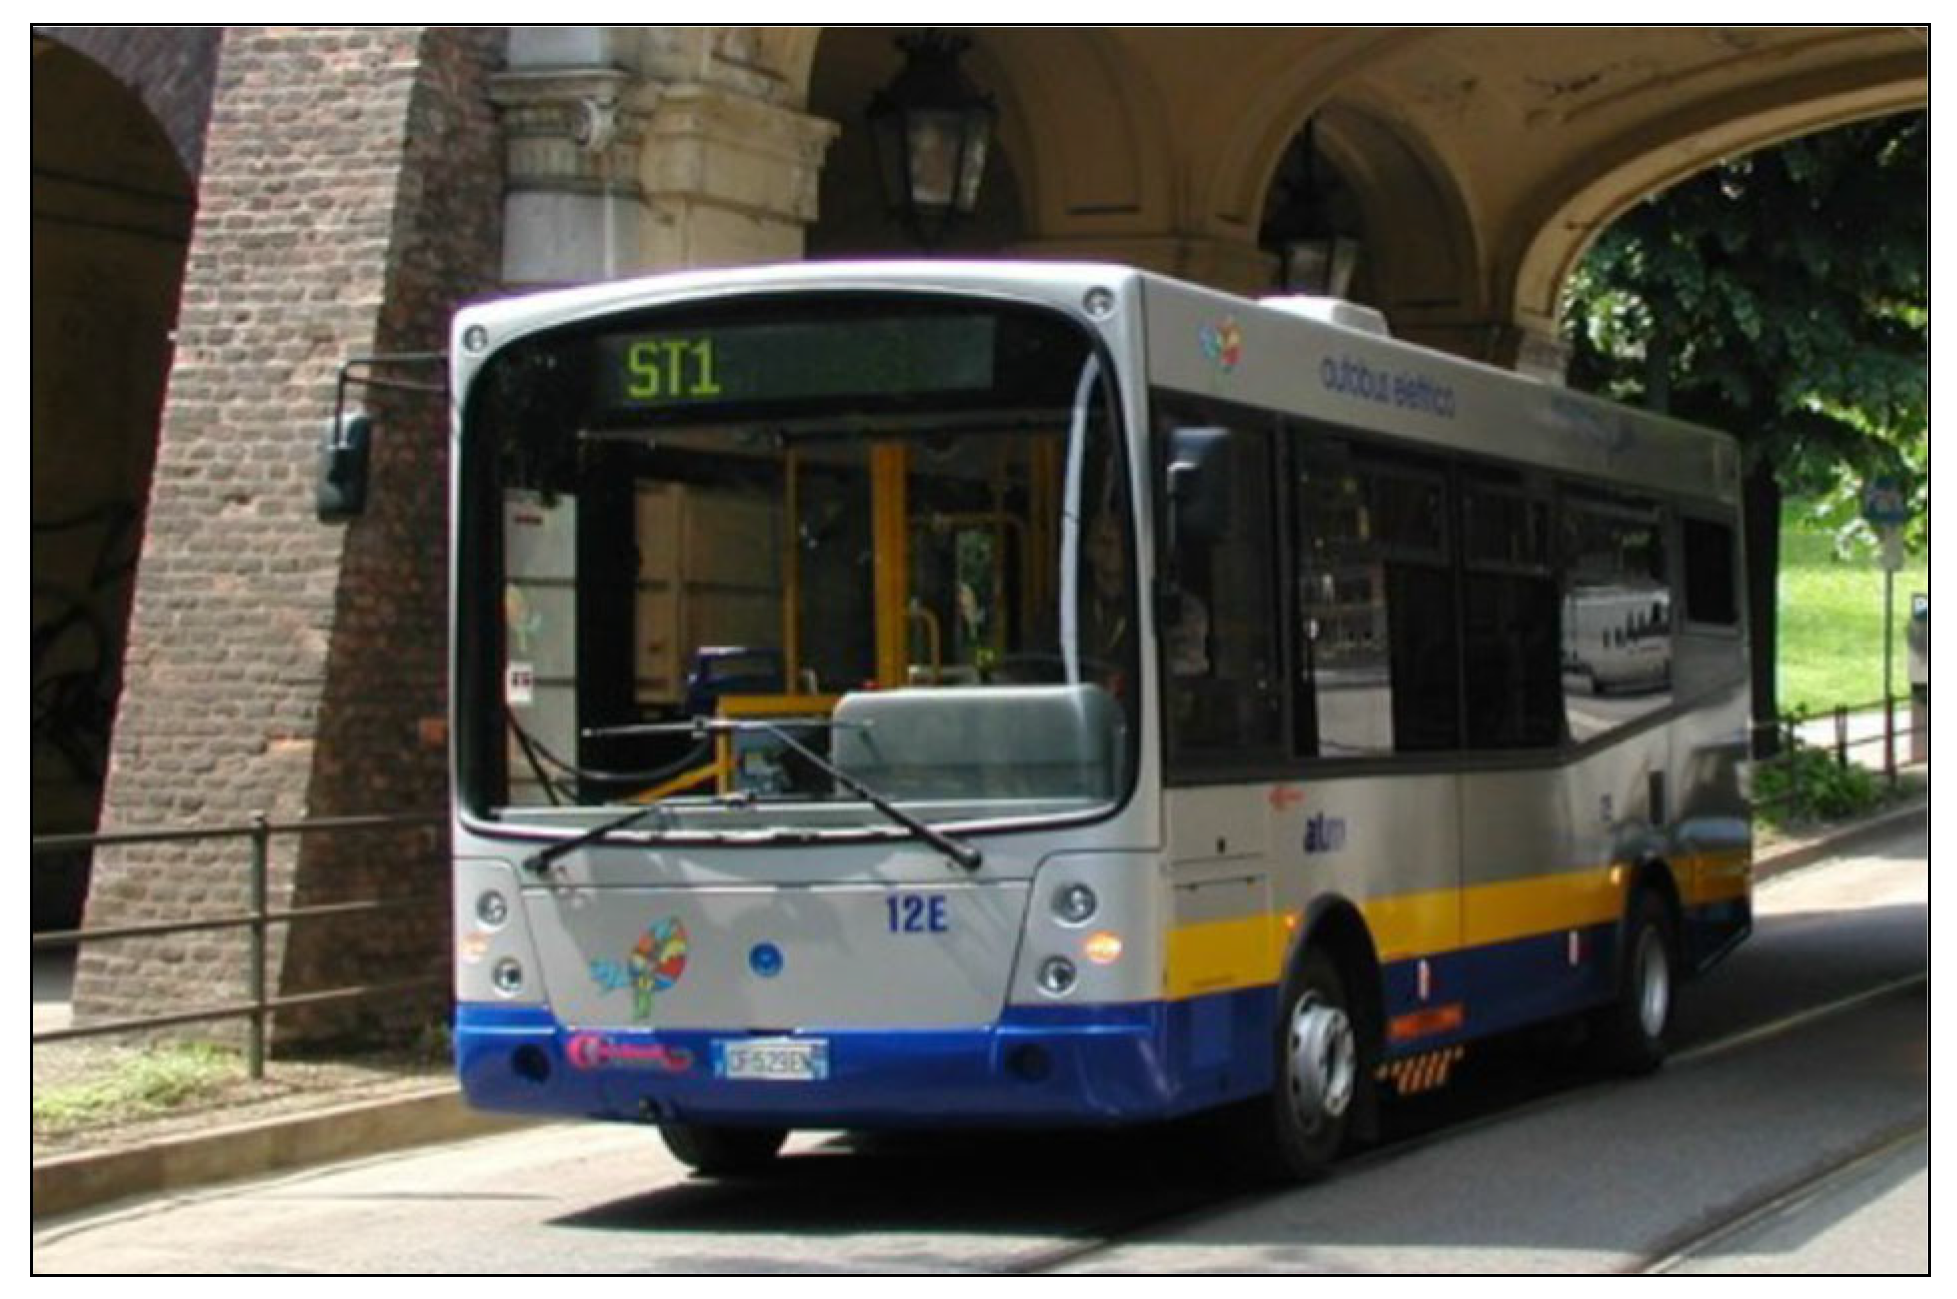
7. The Consolidated Experience with the Electric Bus Lines Operating in Turin (IT) with Static Inductive Charging
The municipal public transport company of Turin (IT), Gruppo Torinese Trasporti (GTT), back in June 2003 already put the first fully electric minibus into service. This minibus adopted an absolutely innovative—at that time—technology of inductive power transfer along the secondary “Linea Star 1” line, and this was followed, four years later, by the implementation of “Linea Star 2” (internal data from GTT). Both lines are still (2022) in operation, and the service and performance of the vehicles have been very successful (
Figure 18).
The two lines run single journeys of approximately six kilometres each for a total of 110–120 km a day. The buses are fully charged during the night via cable connection to the grid in the depot. During daily operation, the buses stop between one journey and another to recover part of the spent energy through static inductive charging, which lasts from 10 to 15 min (with the original lead-gel batteries) and about 6 to 7 min with the upgraded lithium batteries (2015).
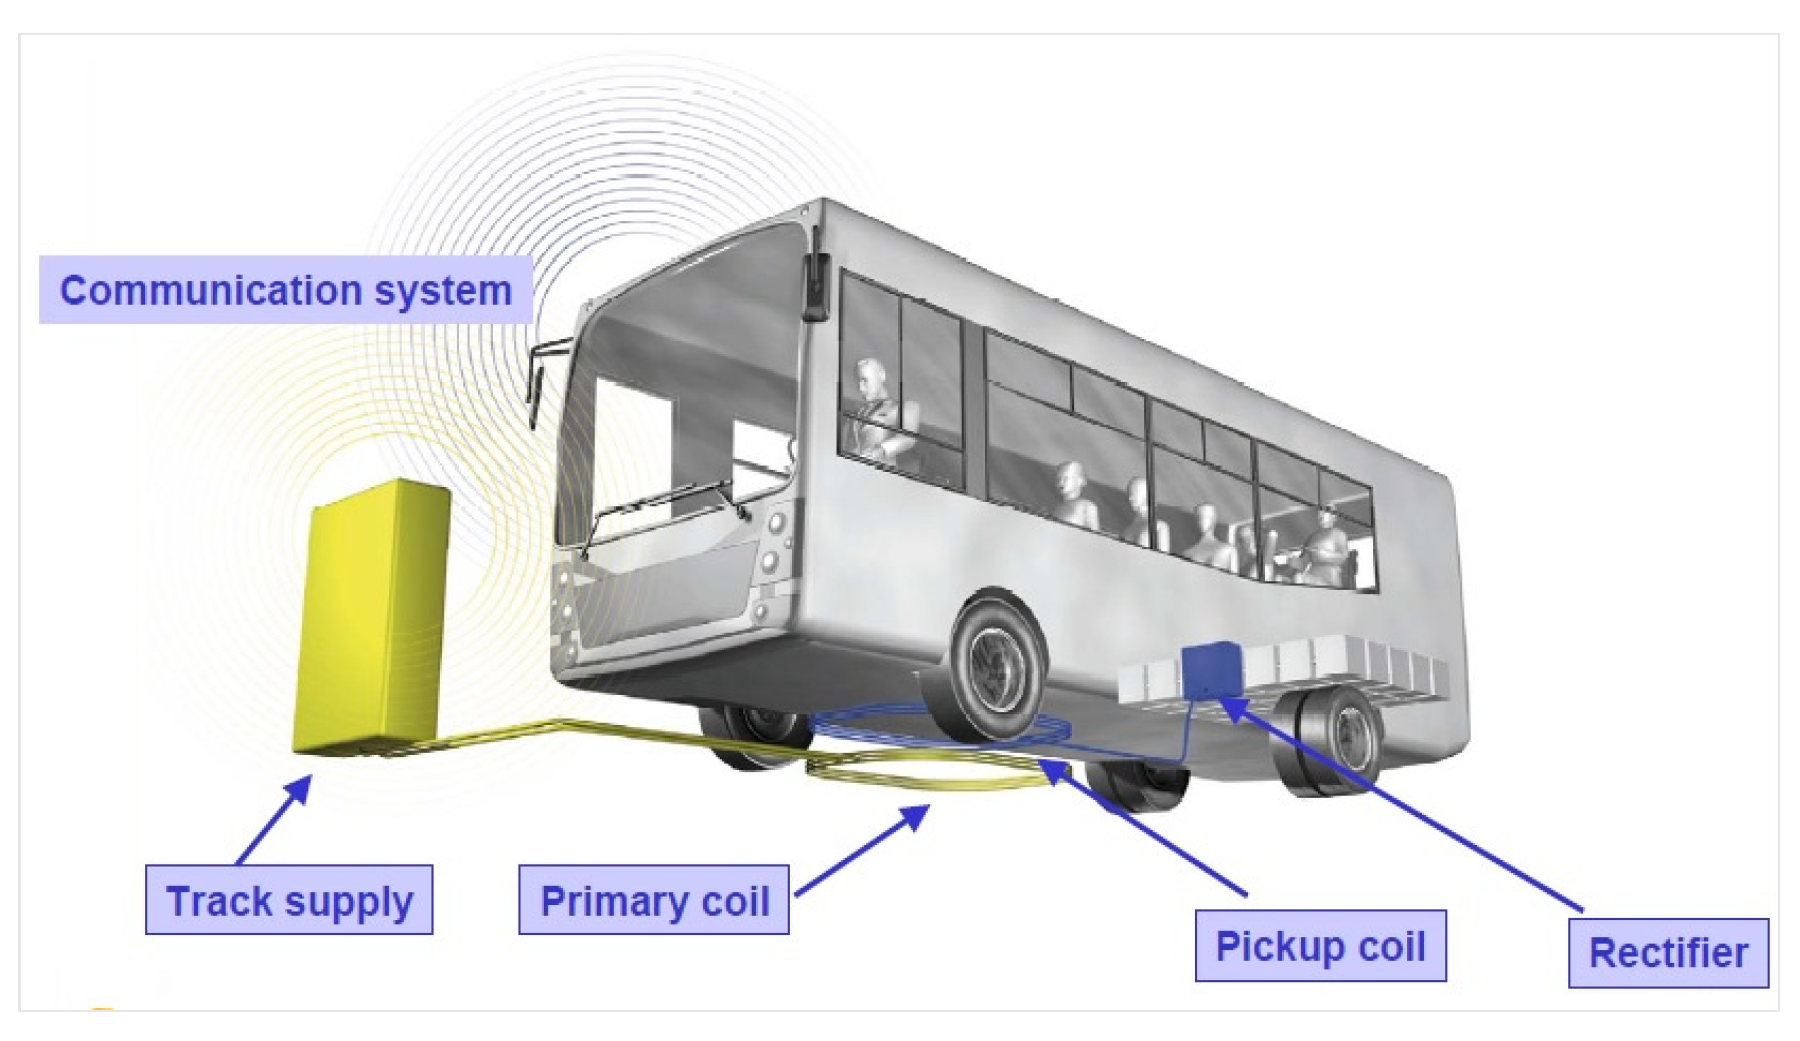
The inductive charging system (
Figure 19), which is also called Wireless Power Transfer (WPT), is almost totally automatic, and no special training is required for the driver (
Figure 20).
Two pick-up modules are mounted beneath the vehicle and two primary coils, connected in series, are buried under the ground (
Figure 19). A large cross is painted in black and yellow on the pavement corresponding to the coils, to help the driver to place the bus and the pick-up modules exactly in correspondence to the primaries. At this point, the driver pushes a button that lowers the pick-up modules to a height of 3–5 cm from the ground, a control system verifies whether the power transfer efficiency is over the target limit of 60%, and the charging process can then start. The efficiency of the system is generally close to 70% (the maximum possible efficiency is 70% and was only reached after the 2015 revamp, in which Pb-gel were replaced by lithium batteries); the system is able to transfer up to 70 kW, but only 40 kW is transmitted in decreasing power over time, in order not to damage the lead-gel batteries. The BMS (Battery Management System) controls this process and sends signals to reduce the power transfer whenever the tension increases too much (
Figure 20).
The features of the electric minibus model adopted along the line are summarised in
Table 7. The traction is purely electric and is powered by an electric three-phase asynchronous motor fed by an energy storage system composed of lead-gel batteries for the first stage. There is no air conditioning, and a small diesel heater, the only environmentally negative aspect of this nominally zero-emission vehicle, powers the heating system. All the remaining auxiliaries, such as the interior lights, rely upon the battery.
7.1. Implementation of Lithium Iron Phosphate Batteries
In 2014, the public transport company (GTT, due to the availability of Environment Minister funds) renewed the electric fleet ELFO by the substitution of lead-gel original batteries with Li-iron phosphate batteries.
This has improved the performances of the electric minibuses, as the previously adopted lead-gel batteries were considered to be an out-of-date technology, in terms of specific energy density and reactivity. As is well-known, the lithium iron phosphate (LiFePO
4) battery, which is also called the LFP battery, belongs to the lithium-ion battery family. It offers a long lifetime and good power density, and it is also inherently safe.
Table 8 summarises a comparison of the most important features of lead-gel batteries and lithium iron phosphate ones, with specific reference to the application involved (Linea Star). The current minibus has remained exactly the same as the previous model. Only the energy-storage module has been changed in the new configuration, with a consequent increase in weight (
Table 7).
The drastic improvements that were achieved with the specific energy allowed 43% of the weight of the battery module to be saved (from 1792 kg to 1014 kg) but, at the same time, an additional 50% of stored energy was achieved. Lead-acid gel batteries are very delicate, requiring frequent maintenance and careful charging procedures. In order to avoid ruining the battery at an early stage, the SOC should never be allowed to fall below 40–50%, and some precautions also have to be taken regarding the WPT at the terminus: the inductive system should be able to transfer as much as 70 kW of power, but only 40 kW is transferred, in decreasing rates, in order not to damage the lead-gel battery, as a BMS is used to control the charging process, and to send a signal to reduce the power transfers whenever the tension increases too much. On the other hand, LFPs have a recommended SOC spam of 20–100%, and allow for a constant inductive power transfer of 40 kW, without any risk of damaging the battery. Thus, more energy can be recovered with respect to the lead-gel configuration, for the same time interval. In addition, as the lithium iron phosphate battery is more dynamic and receptive, it allows for consistent improvements in regenerative braking, thus contributing to compensating for the energy consumption of the minibus in operation. Finally, the effective life of the new LiFePO4 is still under analysis. The manufacturers have stated that, in ideal conditions, LiFePO4 can undergo 2000 lifecycles, while lead-gel batteries can only undergo 800. In practice, the public transport operator has renewed the lead-gel batteries packs every two years of operation, and aims to substitute the lithium ones every five years; but, as the minibus has been in use since 2015 with the new batteries, the company has not yet needed to substitute them: starting from 2015, we can consider an average mileage of 35,000 km per year per vehicle, so the batteries have run for 245 thousand km till now.
7.2. Energy Consumption, Range, and Charging Times of the Two Configurations
The energy consumption of electric buses depends on several aspects, such as the vehicle mass, average speed, climbing figure (a feature that describes the accumulated altitude normalised by the route length), driving style, road conditions, and many others. For given traffic conditions and a given route, the feature that has the most influence is the vehicle mass, which is closely linked to the dimensions of the vehicle and to the number of passengers on board. In addition, when dimensioning modern electric buses, it is fundamental to take into account the power consumption of the auxiliary devices, including air conditioning, which may contribute significantly to the energy consumption in some cases. For this reason, an air conditioning system is not always present on electric buses, especially on those of limited dimensions, as in the case of Linea Star “Elfo” minibus.
Owing to the relevant influence of weight, the traction energy consumption can approximately be scaled to the vehicle mass, through a weight influence coefficient that is defined directly by the manufacturers for each vehicle. According to the technical sheets (data provided by GTT in 2022), the energy consumption of the aforementioned bus, powered by lead-gel batteries, is 1.25 kWh/km under full load, with a weight effect coefficient of 0.94 Wh/km·ton. As far as the traction with the LFP configuration is concerned, the operator observes a reduction of 30% in energy consumption as a consequence of the overall weight reduction and of the improvements in regenerative braking (0.8 kWh/km). These data have been qualitatively verified, and the results have been found to be positive.
7.2.1. Bus Configuration 1
The energy consumption of the minibus was first considered in function of the loading degree (i.e., the number of passengers on board;
Table 9), in the case of traction powered by both lead-gel batteries and by LFP. Then, considering the effective energy storage capacity of the two battery modules, a feasible range was estimated for a single charge for the two configurations. The results of these computations are summarised in
Figure 21.
Lead-gel batteries would ensure an autonomy on battery (range) of 40 to 55 km for a single charge, which is not even enough to cover one-third of the daily operation of electric buses, considering the limits of the usable SOC (state of charge). Therefore, the introduction of static inductive charging at the terminus, or any other kind of opportune charging, is absolutely necessary to extend such a range and to cope with the daily services. On the other hand, the improved energy capacity of lithium iron phosphate batteries, together with the consistent reduction in energy consumption, lead to encouraging data concerning new buses: LFP would allow the range of the same bus powered with old lead-gel batteries to be almost doubled, and a notable range of more than 100 km on average could be reached. Although this is still not enough to cover one day of operation, it would be possible, using the present day charging infrastructure, to enhance the flexibility and frequency of the service.
7.2.2. Bus Configuration 2
An analysis has been carried out, taking into account the sensibility of power consumption over weight, in order to establish the effective inductive charging times at the terminus necessary to cover the daily services, considering the limits of the SOC of the two battery configurations, given the loading degree of the bus. As mentioned, the buses powered by lead-gel batteries currently stop for inductive charging for 10 to 15 min, with no precise scheduling, influencing as well the SOC of batteries at the end of the day, with the related risk. Two different daily operation situations were taken into account in the analysis. The first situation is representative of the present Linea Star service in Turin on a daily basis, while the second one has the aim of investigating the feasibility of an operation closer to the main lines in cities of medium dimensions, but still considering a total of 120 km/day for the sake of a clearer comparison in diagrams. In both situations, the buses were hypothesised to stop for inductive charging at the end of each outward/return journey, and to avoid the first terminus, before starting the daily operation, and the last one, since buses go directly back to the main depot to charge via cable, which is more efficient than WPT (
Table 10). These paths to and from the main depots were not included in the computations.
Three cases were considered:
Pb-gel_sit1, when the bus is powered by lead-gel batteries and covers the daily operations described for Situation 1. In this case, the battery module can store 52 kWh and its lowest SOC limit is 40%, but 50% is considered as the safety margin. A power transfer of 30 kW was assumed on average;
LFP_sit1: when the bus is powered by lithium-iron phosphate batteries and again covers the daily operations described in Situation 1. The LFP battery module can now store 87.4 kWh and allows for a lower SOC limit of only 20%. The inductive power transfer is 40 kW;
LFP_sit2: the bus is powered by lithium-iron phosphate batteries and covers the daily operations described in Situation 2. The battery module can store 87.4 kWh and has a lower SOC limit of 20%. The power transfer is 40 kW.
The lowest SOC value will be encountered at the end of the day, when the buses go back to the depot. This value has been called “End-of-Day SOC” and, due to battery maintenance concerns, it should never be allowed to fall below the two battery SOC limits. Thus, starting from the average kilometric energy consumption values, in function of the loading degree of the bus (or the number of passengers on board), it was possible to evaluate the energy consumption for one single journey and that of the entire day of operation. Multiplying the power transfer level by the time spent on inductive charging, it was possible to make an estimation of the recovered energy amount. Finally, combining these factors with the energy-storage-element capacity, it was possible to estimate the end-of-day SOC of the on-board battery module in function of the time spent on charging during the inductive charging processes interspersed during the daily operation.
Figure 22 summarises the results obtained for case A, which is the most representative of the actual Linea Star minibus in Turin. Considering a safety-margin limit of 50% for the end-of-day state of charge (red dashed line), it is possible to derive the minutes necessary for inductive charging at the terminus without damaging the battery and ensuring a full day of operation from the stored-energy point of view. Thirteen minutes would satisfy even the worst situation for a fully loaded bus, but if an average velocity of 13.5 km/h (a representative value for the city centre of Turin, considering bus stops, traffic lights and traffic jams) is considered, standstill times of more than 30% would be induced, while the acceptable values for electric buses are considered to be close to or less than 10%. The ideal solution would be obtained by overlapping the charging time with the mandatory layover times imposed by the law for the drivers. Considering the case in which there are, on average, from 14 to 20 passengers, which is a more realistic situation regarding a secondary line, even 11 min of inductive charging would be enough, but would still result in an elevated standstill-time percentage. The analysis of case B (
Figure 23), which is of a minibus powered by lithium iron phosphate batteries covering journeys of 6 km, shows that even 2 min of charging at the terminus would be enough for the bus to cover the whole 120 km. If a standstill time of only 6% is considered, this would be an outstanding result, but is not acceptable in reality, as the driver would never stop long enough to rest. Thus, the last case presented in
Figure 24 might represent a good compromise for a real electric bus line covering journeys of 12 km and stopping at the terminus for 5 min to top up the charge.
Finally,
Figure 25 shows a direct comparison of the bus in the two configurations considering daily operations corresponding to situation 1 for lead-gel batteries and to situation 2 for the bus powered by LFP (case A and case C). A loading degree of 40% and an average speed of 13.5 km/h have been considered in both cases, and reference has been made to the considerations made in the previous section; the Pb-gel bus is hypothesised to recharge inductively for 11 min every 6 km, while the LFP recharges for only 5 min for every 12 km of journey.
It should be noted that the adoption of lithium batteries allows for the reducing of the standstill times for charging at the terminus, so much that, in the same time interval in which lead-gel buses cover ten complete cycles for a total of 120 km, buses powered by LFP can almost cover a further 60 km. In such a case, 5 min of inductive charging might not be enough to reach a safe level of acceptable end-of-day SOC, but an increase of only one minute per stop would solve the problem. In other words, the introduction of LFP allows for the paving of the way towards an improved electric public minibus service, in terms of flexibility, range and time scheduling (avoiding an increase in operational costs due to additional stop times). The advantages and benefits that the application of lithium iron phosphate batteries to minibuses can achieve are without doubt. However, the purchasing costs of lithium batteries are almost six times higher than those of lead-gel ones.
Several aspects should be considered:
The battery life span;
The flexibility of the operation and improved time scheduling;
The reduction in electric power consumption;
The avoided maintenance, which for lead-gel batteries is particularly heavy.
LFP batteries run for seven years (instead of two), so we should consider:
The battery-life improvement;
The reduction in consumption;
The improvement in energy braking (reduction in brake consumption, improvement of comfort).
We can conclude the solution is cost-effective. The considerations above (
Figure 20,
Figure 21,
Figure 22 and
Figure 23) show that the correct choice of battery capacity, power and timing for depot charging, and power and timing for line charging are strategic in terms of whether or not we obtain an efficient and cost-effective system.
8. Main Results
BEV technology—notwithstanding its limits—has interesting potential to be applied to LPT, given the prerogatives of PT that make this feasible: fixed routes, planned stops, sophisticated traffic management systems, and scheduling of staff. Some discouraging factors are noticeable (
Figure 25): the limited range and its dependence on high masses, the risks associated with the exhaustion of the battery, and the necessity of the fleet increasing in order to guarantee a reliable service are just a few examples. Other technological solutions such as extended-range BEB, or secondarily PHEV, as well as Euro VI ICEs (VII, in case, for the future) which are usable also with innovative fuels, such as CNG/LNG or hydrogen, even in mixed forms, could be the right choice to avoid limitations (
Figure 26), besides the opportunity charging widely analysed in this paper.
Sometimes the choice to force the migration from a conventional fleet, equipped with ICE, to another composed of BEB is purely economic: i.e., obtaining new vehicles whose maintenance is included in the assistance guaranteed by the producer and in the commitment funded by a local public government, reducing thereafter the expenses of maintenance typical of ICEs. However, this solution neglects other technical aspects that applications made from 2010 until 2023 allow to emerge (e.g., over-sizing of the fleet, actual available SOCs, impact on the grid, etc.).
9. Conclusions
On the basis of this analysis, the decision maker should be able to rely on more scientific–technical bases for deciding in a proper way whether and how far electrification is technically a viable solution for Local Public Transport, with the energy consumption and the consequent emissions such as drivelines, though not including the pure economic aspects.
Despite due caution, it is evident that:
The battery electric buses (BEB) might already be a viable solution from an industrial engineering viewpoint, as well as from the local environmental viewpoint;
It seems destined to improve even more if the deployment of the current solutions (e.g., new-generation pantographs for high-power transmission) rapidly accelerates over the next decade.
As far as this final point is concerned, this paper demonstrates, using numerical methods and a simulation model, that any kind of infrastructure that would allow full or partial charging, in an integrated manner, allows for drastic reductions in the battery sizing.
A valid alternative, besides vehicles equipped with internal combustion engines (gasoil Euro VI and a possible future Euro VII evolution, compressed or liquefied natural gas, and hydrogen) would be either an extended-range hybrid BEB—an excellent solution—or secondarily a PHEV, for a number of reasons, not least the actual availability of the vehicles in case of need.
However, from a wider point of view, that of transport systems as a whole, the most relevant and the major barriers to BEB for PT seems today to be represented by the silo effect generated by the division of competencies and responsibilities—basically, the management of traffic monitoring, of the public transport services, the control of infrastructure, and the knowledge of electric grids—among diverse stakeholders. Such an effect may slow down, or even prevent, the realisation of the AVM-based connected public transport system outlined in this paper.
From this point of view, the city of Turin represents an example of best practice, although it is certainly not unique, since the traffic-control and public-transport-management authorities effectively cooperate in the daily operations by integrating data and control actions.
An additional element that should be considered is that the scheduling of activities in the PT sector is known in advance, as are the extensions of the paths, and this allows the needed energy and related consumption against time, given a certain path, to be calculated in advance. A certain flexibility in managing the energy needed could come from remote-control systems for vehicles and charging infrastructure, so as to optimize scheduling and charging times, and reducing the power peak. Many outstanding technical problems remain, but they will not hinder the introduction of such systems, and in many cases the solution is already clear. Battery performance, the end-of-life cost, optimal solutions and the design of roadside charging stations are key areas where technology is currently immature, mainly due to uncertainties about battery life. The fixed and operational costs of electric bus solutions are therefore not completely consolidated, but evidence suggests that, in the mid-term, the overall cost should not be any higher than that of a fleet of traditional ICE-based buses. The correct evaluation of WTW consumption, in order to avoid a decrease in the overall efficiency over the whole energy chain, remains an issue.
Within this context, the aim of this work has been to highlight the advantages of adopting more innovative batteries, and to propose a simplified methodology to evaluate the range and energy consumption in function of mass, storage elements and charging infrastructure and their effect on the scheduling of an electric bus line.
The improvement in the LFP specific energy, with respect to lead-gel batteries, allows an additional 50% of energy (92 kWh instead of 60.4 kWh) to be stored, while the weight of the battery unit may be reduced by 43%. A reduction in the mass of the vehicle, together with a more efficient regenerative braking, may lead to a consistent reduction in the energy consumption of the bus. GTT (the public transport operator of Turin, I) has estimated that the adoption of the lithium-ion technology allows a saving of approximately 30% of energy consumption. Moreover, the new batteries have less stringent limits regarding the usable span of SOC, and it is possible to let higher power transfers flow by means of inductive charging, thus reducing the charging times. The buses would almost double their autonomy on batteries and thus be able to cover longer routes with even less time spent inductively recharging at the terminals. The implementation of such batteries basically makes the electric-bus line run within the acceptable limits for the operation of an electric bus on a standard line.
This paper has some evident limitations, which are represented by the state of the art: the above considerations are important also for future use of BEB; moving the technical life from 15 years (standard buses) to 20 years (as for trolley buses) is under discussion. In a 20-year period, the improvement of battery technologies and performances is foreseeable, so analogue operations such as those used for GTT Elfo could be taken into account: at the end of the technical life of the energy pack, upgrading the system with other technologies (for REES or for charging equipment) could be considered (standardisation becomes more and more important). The methodology of this work could aid the choice of system parameters and future upgrades in order to achieve the best compromise between performances and costs (purchase and operational): depot charging, road charging (power and time needed), and the energy amount for vehicles and their regular operation.


