1. Introduction
A growing awareness of the negative consequences of the current lifestyle is leading to efforts to manage and consume more sustainably, which is not an easy task [
1].
According to a representative survey in Germany by the Federal Ministry for the Environment, Nature Conservation, Nuclear Safety, and Consumer Protection (BMUV) in 2020, two-thirds of those surveyed rated the topic of environmental and climate protection as very important [
2]. The food production and consumption sectors are of great importance here, as around 30 percent of global greenhouse gas emissions are related to food [
3]. In this sector, the participants see the greatest need for action in reducing packaging waste and ensuring that less food is thrown away [
2]. This contains a contrast, as one way to prevent food waste is the use of optimized packaging [
3]. In addition to maintaining quality and protection as the most elementary functions, packaging also plays an important role in storage and transport, handling of the product, and informing the consumer [
4].
Packaging consumption by private consumers in Germany was 8.59 million tons in 2019, which corresponds to 103 kg per capita. Even though this consumption decreased by four percent compared to the previous year, the long-term trend shows a steady increase in packaging waste [
5].
The research project “STOP waste—SAVE food” showed that only one-third of consumers perceive the shelf-life-extending function of food packaging and that options that are environmentally friendly from the consumer’s point of view are preferred to the functionality of optimized packaging [
3]. Especially younger age groups show a great willingness to change and exhibit a pronounced attitude toward climate protection, but show a comparatively low level of environmental behavior in contrast [
2]. That is why the focus of the present study is on young consumers in Generation Y, also called Millennials, which includes people born from 1981 to 2000, and in Generation Z, including all those born after 1995 [
6].
Consumers see actors in business, industry, and politics as being primarily responsible for securing a sustainable future [
2]. Because of the purchasing power they have, their responsibility for the environment should not be underestimated. By making conscious decisions for more sustainable alternatives, individual consumers can significantly drive the change we seek [
1]. Because the survey by the BMUV showed that the overall stated willingness to consume less is very low, reflective consumer choices are even more important [
2]. In addition, this study reflects that 60 percent of the German participants feel well informed about the topic of climate protection [
2]. Many studies from other countries show a contradiction between consumers’ attitudes and purchase decisions [
7,
8,
9,
10].
Otto et al. [
7] compared consumer perceptions of sustainable packaging with scientific assessments of environmental sustainability and showed that purchasing behavior is, in most cases, less ecological and sustainable than intended. Similar results are shown in studies by Tobler, Visschers, and Siegrist [
8] in Switzerland, Steenis et al. [
9] in the Netherlands, and Lindh et al. [
10] in Sweden. In addition, studies by Klaiman et al. [
11] in the United States of America, Steenis et al. [
9] in the Netherlands, and Tobler et al. [
8] from Switzerland show negative attitudes toward plastic as a packaging material and positive attitudes toward glass across countries. The literature review by Otto et al. [
7] shows a similar picture and indicates that this does not correspond to the scientific results.
Despite their relevance to the consumer, there are only a few studies that investigate the role of different packaging materials in food purchases. Allegra et al. [
12] conducted a survey in Italy in which consumers rated packaging materials without reference to a food product. Fernqvist et al. [
13] included the packaging materials cardboard and plastic when examining the consumers’ views on different packaging aspects for potatoes in Sweden. Tobler et al. [
8] also had Swiss consumers rate the environmental friendliness of different packaged beans, tomatoes, and potatoes and compare the results to the ones of a life cycle assessment.
Results from Lindh et al. [
10], Otto et al. [
7], and the “STOP waste—SAVE food” project [
3] show that packaging material plays a crucial role in consumers’ assessment of sustainability. But there is a lack of research showing not only whether packaging material influences sustainable purchase decisions but also how much this influence is compared to other product attributes. Furthermore, a comparison between the different materials in previous studies was difficult because only a few different packages were available, as well as several unpackaged options [
8,
13].
The aim of the present study is to investigate the relevance of the common food packaging materials (glass, metal, plastic, and cardboard) for the food product choice decisions of German consumers in Generations Y and Z when they are asked to make the most sustainable choice-decision possible. There is no way to avoid packaging. For this purpose, an online choice experiment was conducted with a simulated shopping situation in which consumers had to decide between product alternatives. There are different types of environmental awareness among the German population, which differ in their willingness to act and interest in environmental protection [
2]. Therefore, the importance of packaging material for an ecological decision is investigated for different consumer groups, which are identified in a latent class analysis. With the help of a factor analysis, attendees’ attitudes will be examined, and, unlike in previous studies, knowledge of the environmental impact of packaging will be investigated in a quiz. Thus, choice behavior can be linked not only to the participants’ frame of mind but additionally to the participants’ level of information. Furthermore, the image of the materials among German consumers is investigated to discover if it is similar to the one in other countries. The results may have an effect on product management strategies and give an indication of whether it is necessary to inform consumers more and educate them about the environmental impacts of different packaging options. Passed tomatoes were chosen as the product to be selected, as these are available in all common packaging materials that are familiar to consumers.
This article is structured as follows: The next section describes the used materials and methods. After that, the results of the online survey are presented in the third part and critically discussed in the fourth section, before a short conclusion is drawn.
2. Materials and Methods
2.1. Data Collection
Sample data were collected in December 2021. Participants were recruited via email and social media by sending a link to the online survey. The sample of this study is a convenience sample, so it is likely that mostly consumers participated who have a general interest in sustainable consumption and might be more environmentally conscious than the general German population. Additionally, emails have been sent to consumers who are employees and students at HAW Hamburg. Participation was voluntary, and respondents were free to exit the survey at any time without negative consequences. To ensure that the sample resembled Generation Y and Z in Germany, sampling quotas were set for age and gender. In line with the generations, only people between the ages of 18 and 40 were allowed to participate. A total of 431 consumers participated in the survey, of which 250 answered the questionnaire in full. Five were discarded due to answering the questionnaire too quickly (under 5 min), so 245 complete datasets were included in the analysis.
2.2. Survey Design
The survey consisted of seven sections. In the first section, participants answered questions about their age and gender. These screener questions were used to ensure the representativeness of this study. Next was the choice experiment, in which the attendants were asked to make the most sustainable choice possible. They had to select their preferred product from three different options of strained tomatoes with different product characteristics and one non-option.
In the third section, attendees had to indicate their level of agreement with different statements on a five-point scale ranging from completely agree (1) to completely disagree (5). Respondents were then asked to rate the usefulness of six specific examples of packaging, on a scale from not at all useful (1) to very useful (5).
In the fifth section, a ranking of the materials should be made based on different attributes and environmental aspects. Before the participants had to answer some questions about employment, income, household size, and waste quantity, they were asked to answer five questions in a quiz about the impact of packaging and its disposal.
2.3. Design of the Choice-Experiment
A choice experiment was used in this study to investigate consumers’ choice behavior and their preferences for different food product characteristics. For this purpose, different choice sets were created by randomization using Sawtooth Software (version 9.13.0). By selectively varying the product features, their influence on choice-decisions can be determined. The aim of the experiment was to evaluate the importance of individual product attributes on the respondent’s choice behavior and whether these parameters vary between respondent groups to derive information on demand and acceptance. Even though it is not a real purchase situation, the results are assumed to show a high degree of correspondence between the hypothetical and the real decision, even for strongly socially desirable behaviors such as choosing sustainable products [
14].
Choice experiments provide detailed information about decision-making and are therefore used in many areas of research [
15]. For example, in the study by Muller, Lacroix, and Ruffieux [
16], who used a choice experiment to investigate how environmental food labels influence consumer shopping behavior. In the study by de-Magistris and Gracia [
17], a real-choice-experiment was used to investigate consumer preferences and willingness to pay for almonds with different sustainable labels.
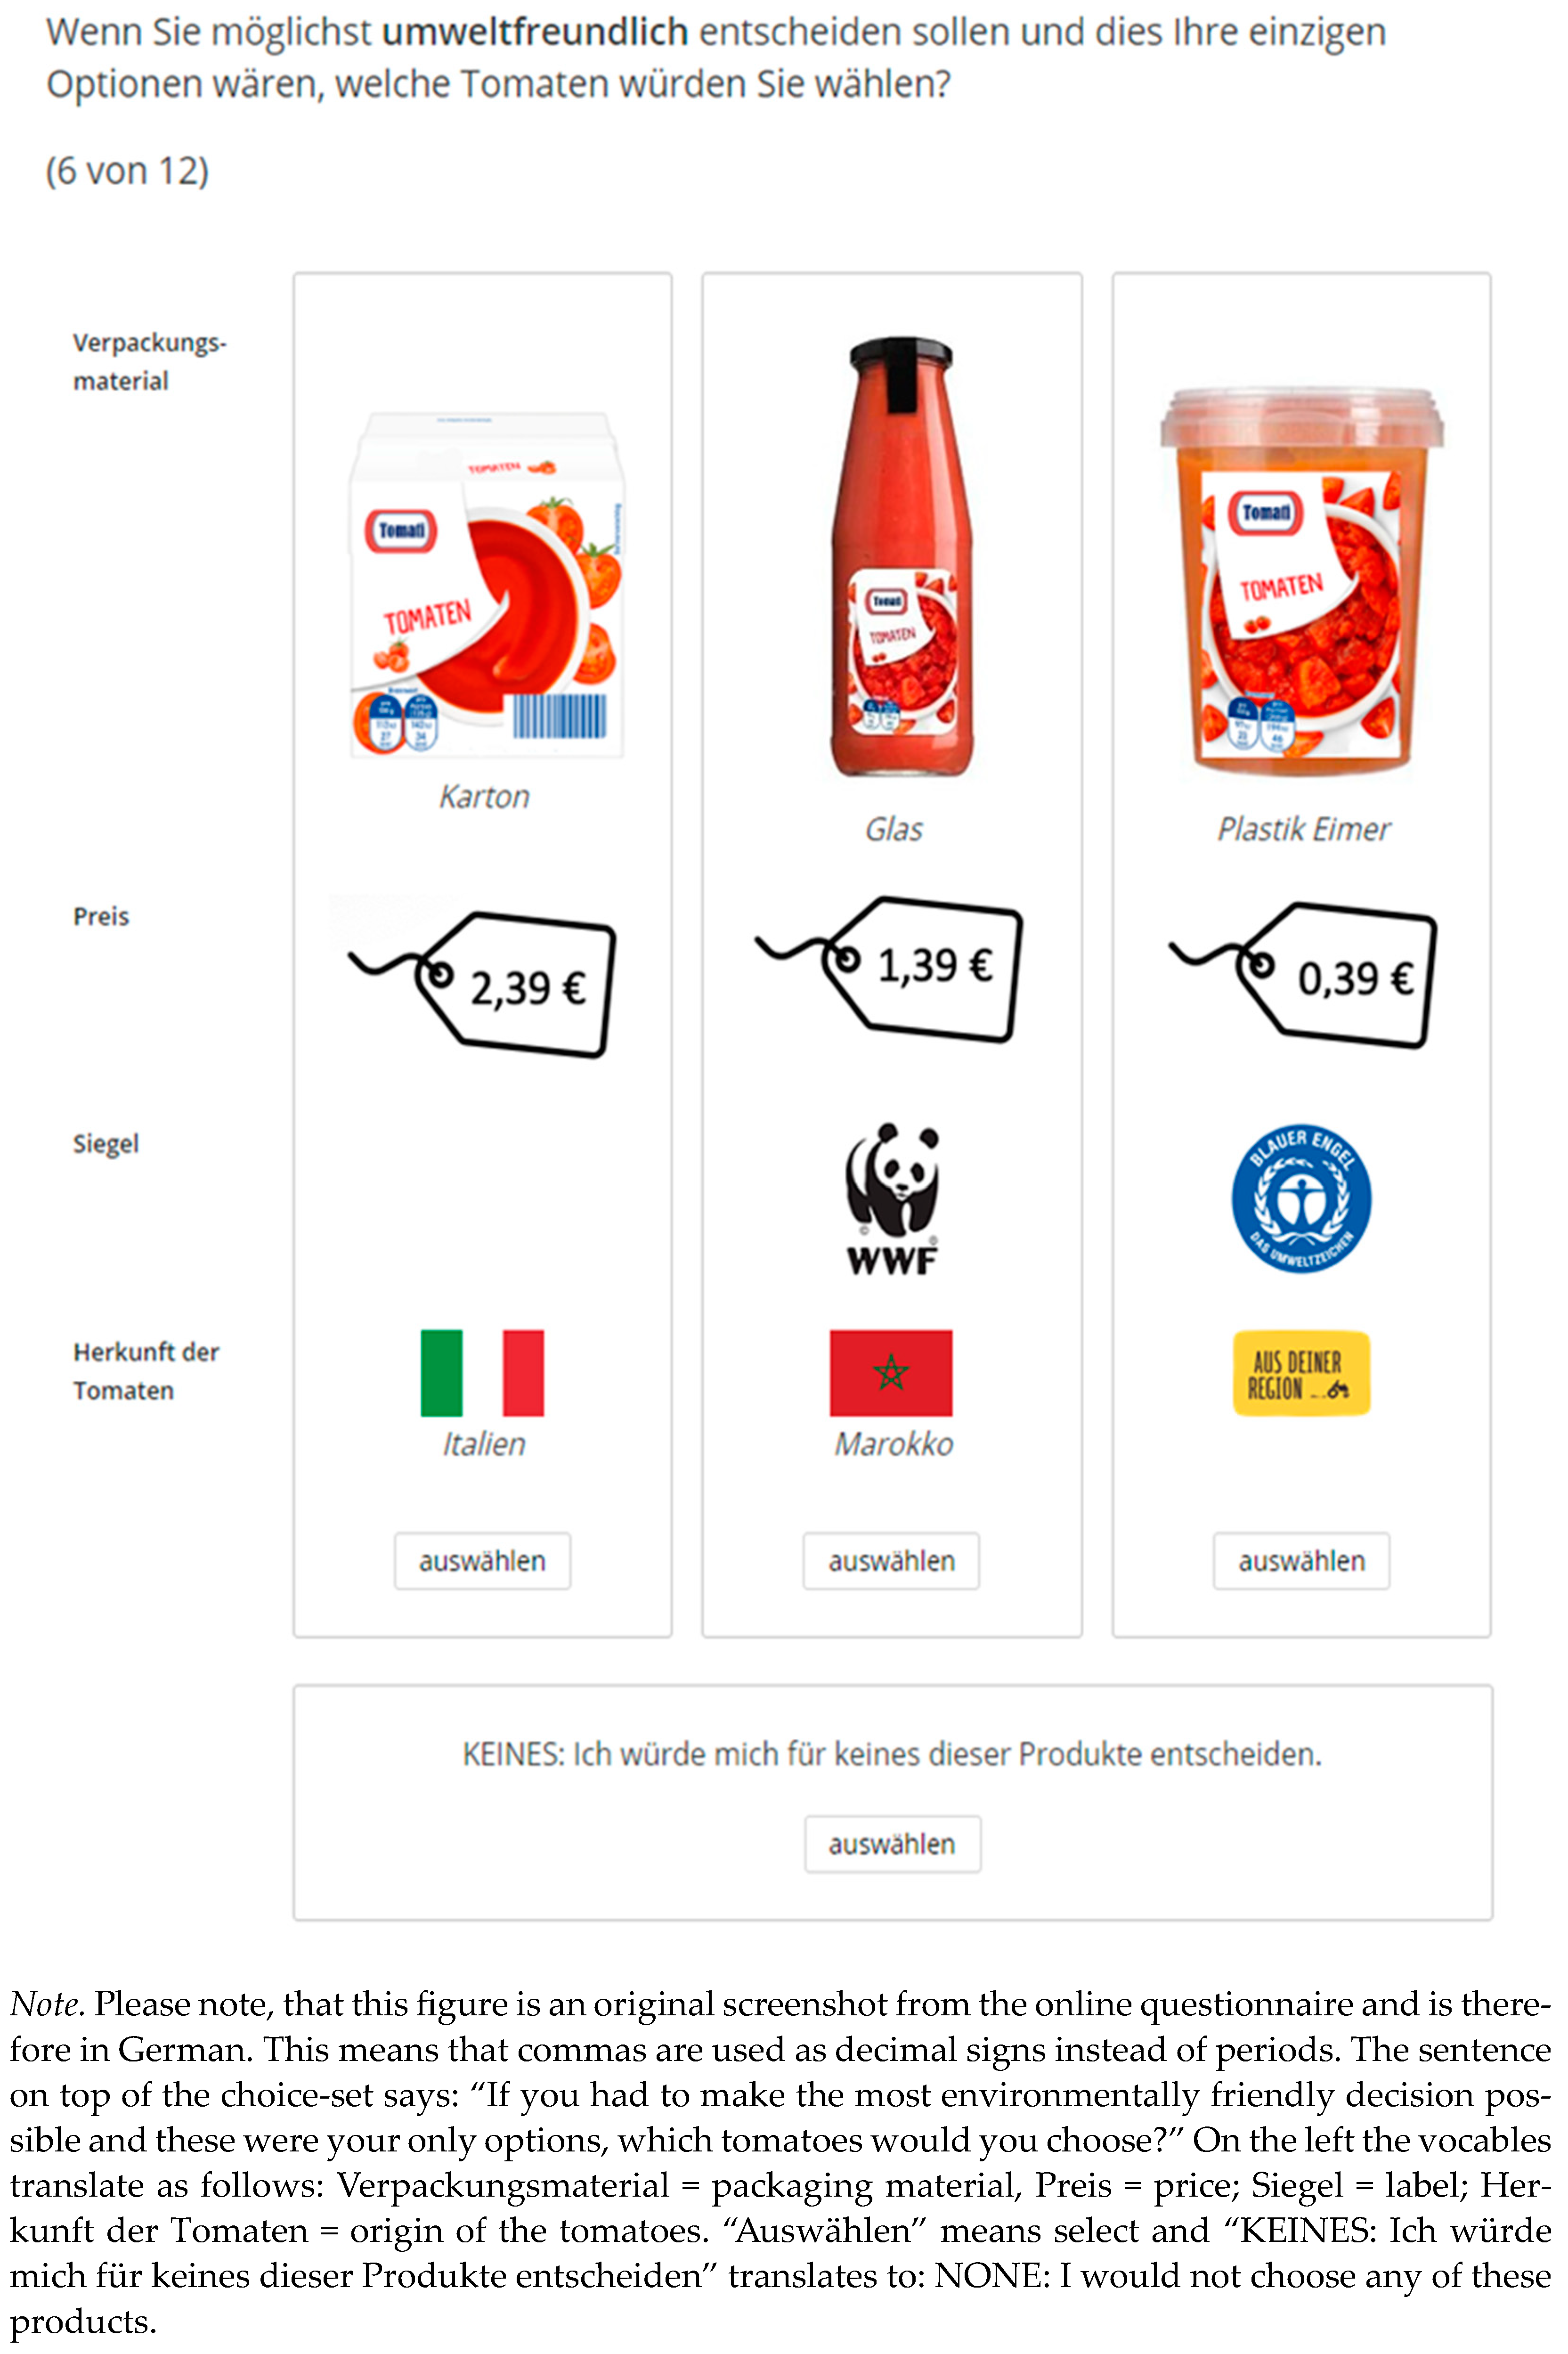
When conducting the choice-experiment, the participant selects a product from various alternatives, each with different combinations of product attribute levels. A total of four product attributes were selected, which are assumed to influence consumers choice-behavior. These are price, origin, label, and packaging material, since this is decisive for the investigation. If we had asked the participants to indicate which product they would buy instead of choosing the one they perceive as being more sustainable, then it would be necessary to add more attributes that indicate food product quality, as it is expected for consumers to buy a product based on its quality rather than its environmental friendliness. To have a scientific basis for the later comparison between the consumer perception of product attribute sustainability and their real environmental impact, the packaging materials used in this study were inspired by the ones from a Europe-wide life cycle assessment (LCA) for packaging of durable foods, published by the Institute for Energy and Environmental Research (IFEU) on behalf of SIG Combibloc Services AG [
18]. In the experiment, each attribute has five levels, and in the expression of the price, equal spacing was considered. All attributes and attribute levels used are listed in
Table 1.
The product pictures were self-created and provided with a fictitious logo. The design was adapted so that all products look as similar as possible, except for the packaging material. This was to avoid visual influences, as Steenis et al. [
9] showed that the packaging design also affects sustainability perceptions.
In the choice-experiment, participants were asked to select the product they considered to be the most sustainable choice from three alternatives. If none of the generated choices in the choice set were suitable for the respondent, he or she could select the non-option “No purchase”. Since not all attribute levels can occur simultaneously in a choice set, several choice sets were generated by the software. A separate randomized choice-set design was created for each participant, containing a total of twelve choice-sets with images for illustration.
Figure 1 shows an example of a selection set.
2.4. The Design of the Lifestyle Constructs
The second part of this study included statements on various constructs used to capture the attitudes of the participants. The constructs are represented by statements that the attendees were asked to agree with on a Likert scale from 1 “Strongly disagree” to 5 “Strongly agree”. Based on literature research, 18 statements were determined for six different constructs, from which a connection between the participants’ attitude and their choice-decision can be assumed.
The first construct used deals with knowledge about the environment and comes from a study by Yadav and Pathak [
19]. With the help of this construct, it was possible to investigate how the respondents themselves rated their knowledge about environmental aspects related to packaging waste. The second construct, taken from Biswas and Roy [
20], describes the environmental behavior of the participants and reflects how environmentally aware they consider themselves to be. To capture the measure of concern for the environment, statements from Minton and Rose [
21] were used that relate to both consumer and industry behaviors. The fourth construct, adopted from Suki [
22], serves as an indicator of efforts to act environmentally conscious in relation to the choice of environmentally friendly products. Corresponding statements from a study by Chéron, Sudbury-Riley, and Kohlbacher [
23] were used to analyze respondents’ price consciousness. The last construct examines opinions about seals on food packaging and comes from a study by Van der Merwe, Bosman, and Ellis [
24]. Table 6 in the results section provides an overview of all items.
2.5. Design of the Package Usefulness Evaluation
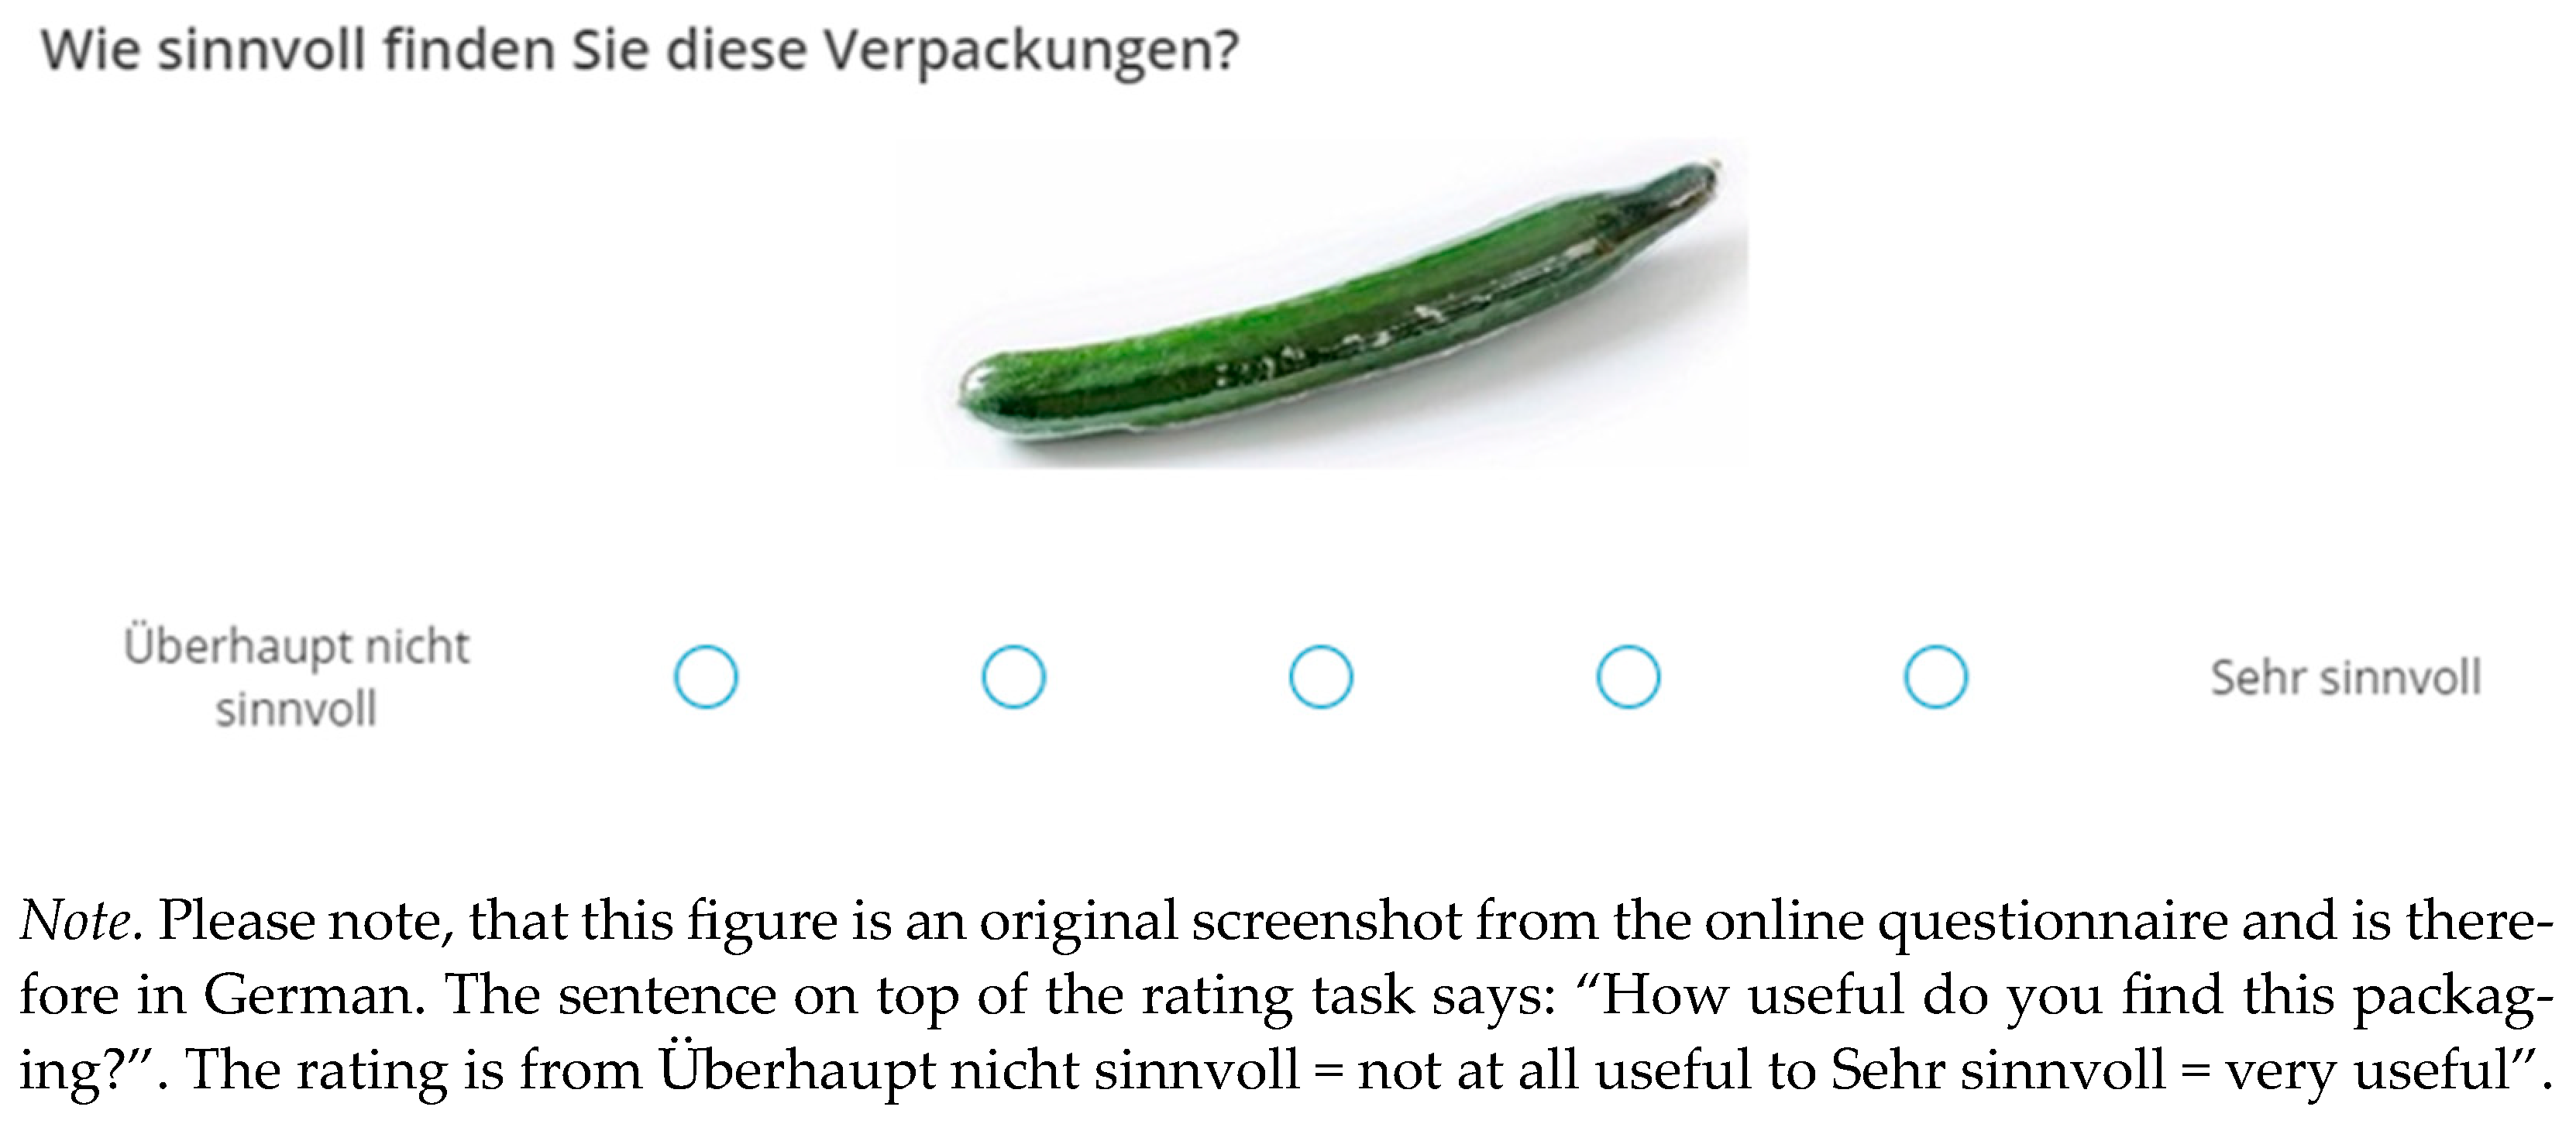
The agreement on statements was followed by an evaluation of six specific packaging examples. These contained the products cucumber, cress, and brioche braid, each in two different packaging options. The cucumber was available unpackaged or packaged in a plastic sleeve, the cress only on substrate in a tray or with additional foil packaging, and the brioche braid in a paper bag with a viewing strip or foil packaging.
The examples used were taken from a study by Denkstatt GmbH [
25], in which the change in food waste after packaging changeover was investigated. The respondents were asked to rate the six examples on a scale from 1 (not at all useful) to 5 (very useful). The aim of this evaluation is to analyze whether the participants perceive the benefits of optimized packaging. In addition, the acceptance of packaging can be investigated when unpackaged options are available, and, in contrast to the products in the choice-experiment, fresh food is involved.
Figure 2 shows an example from the package usefulness rating.
2.6. Ranking Design
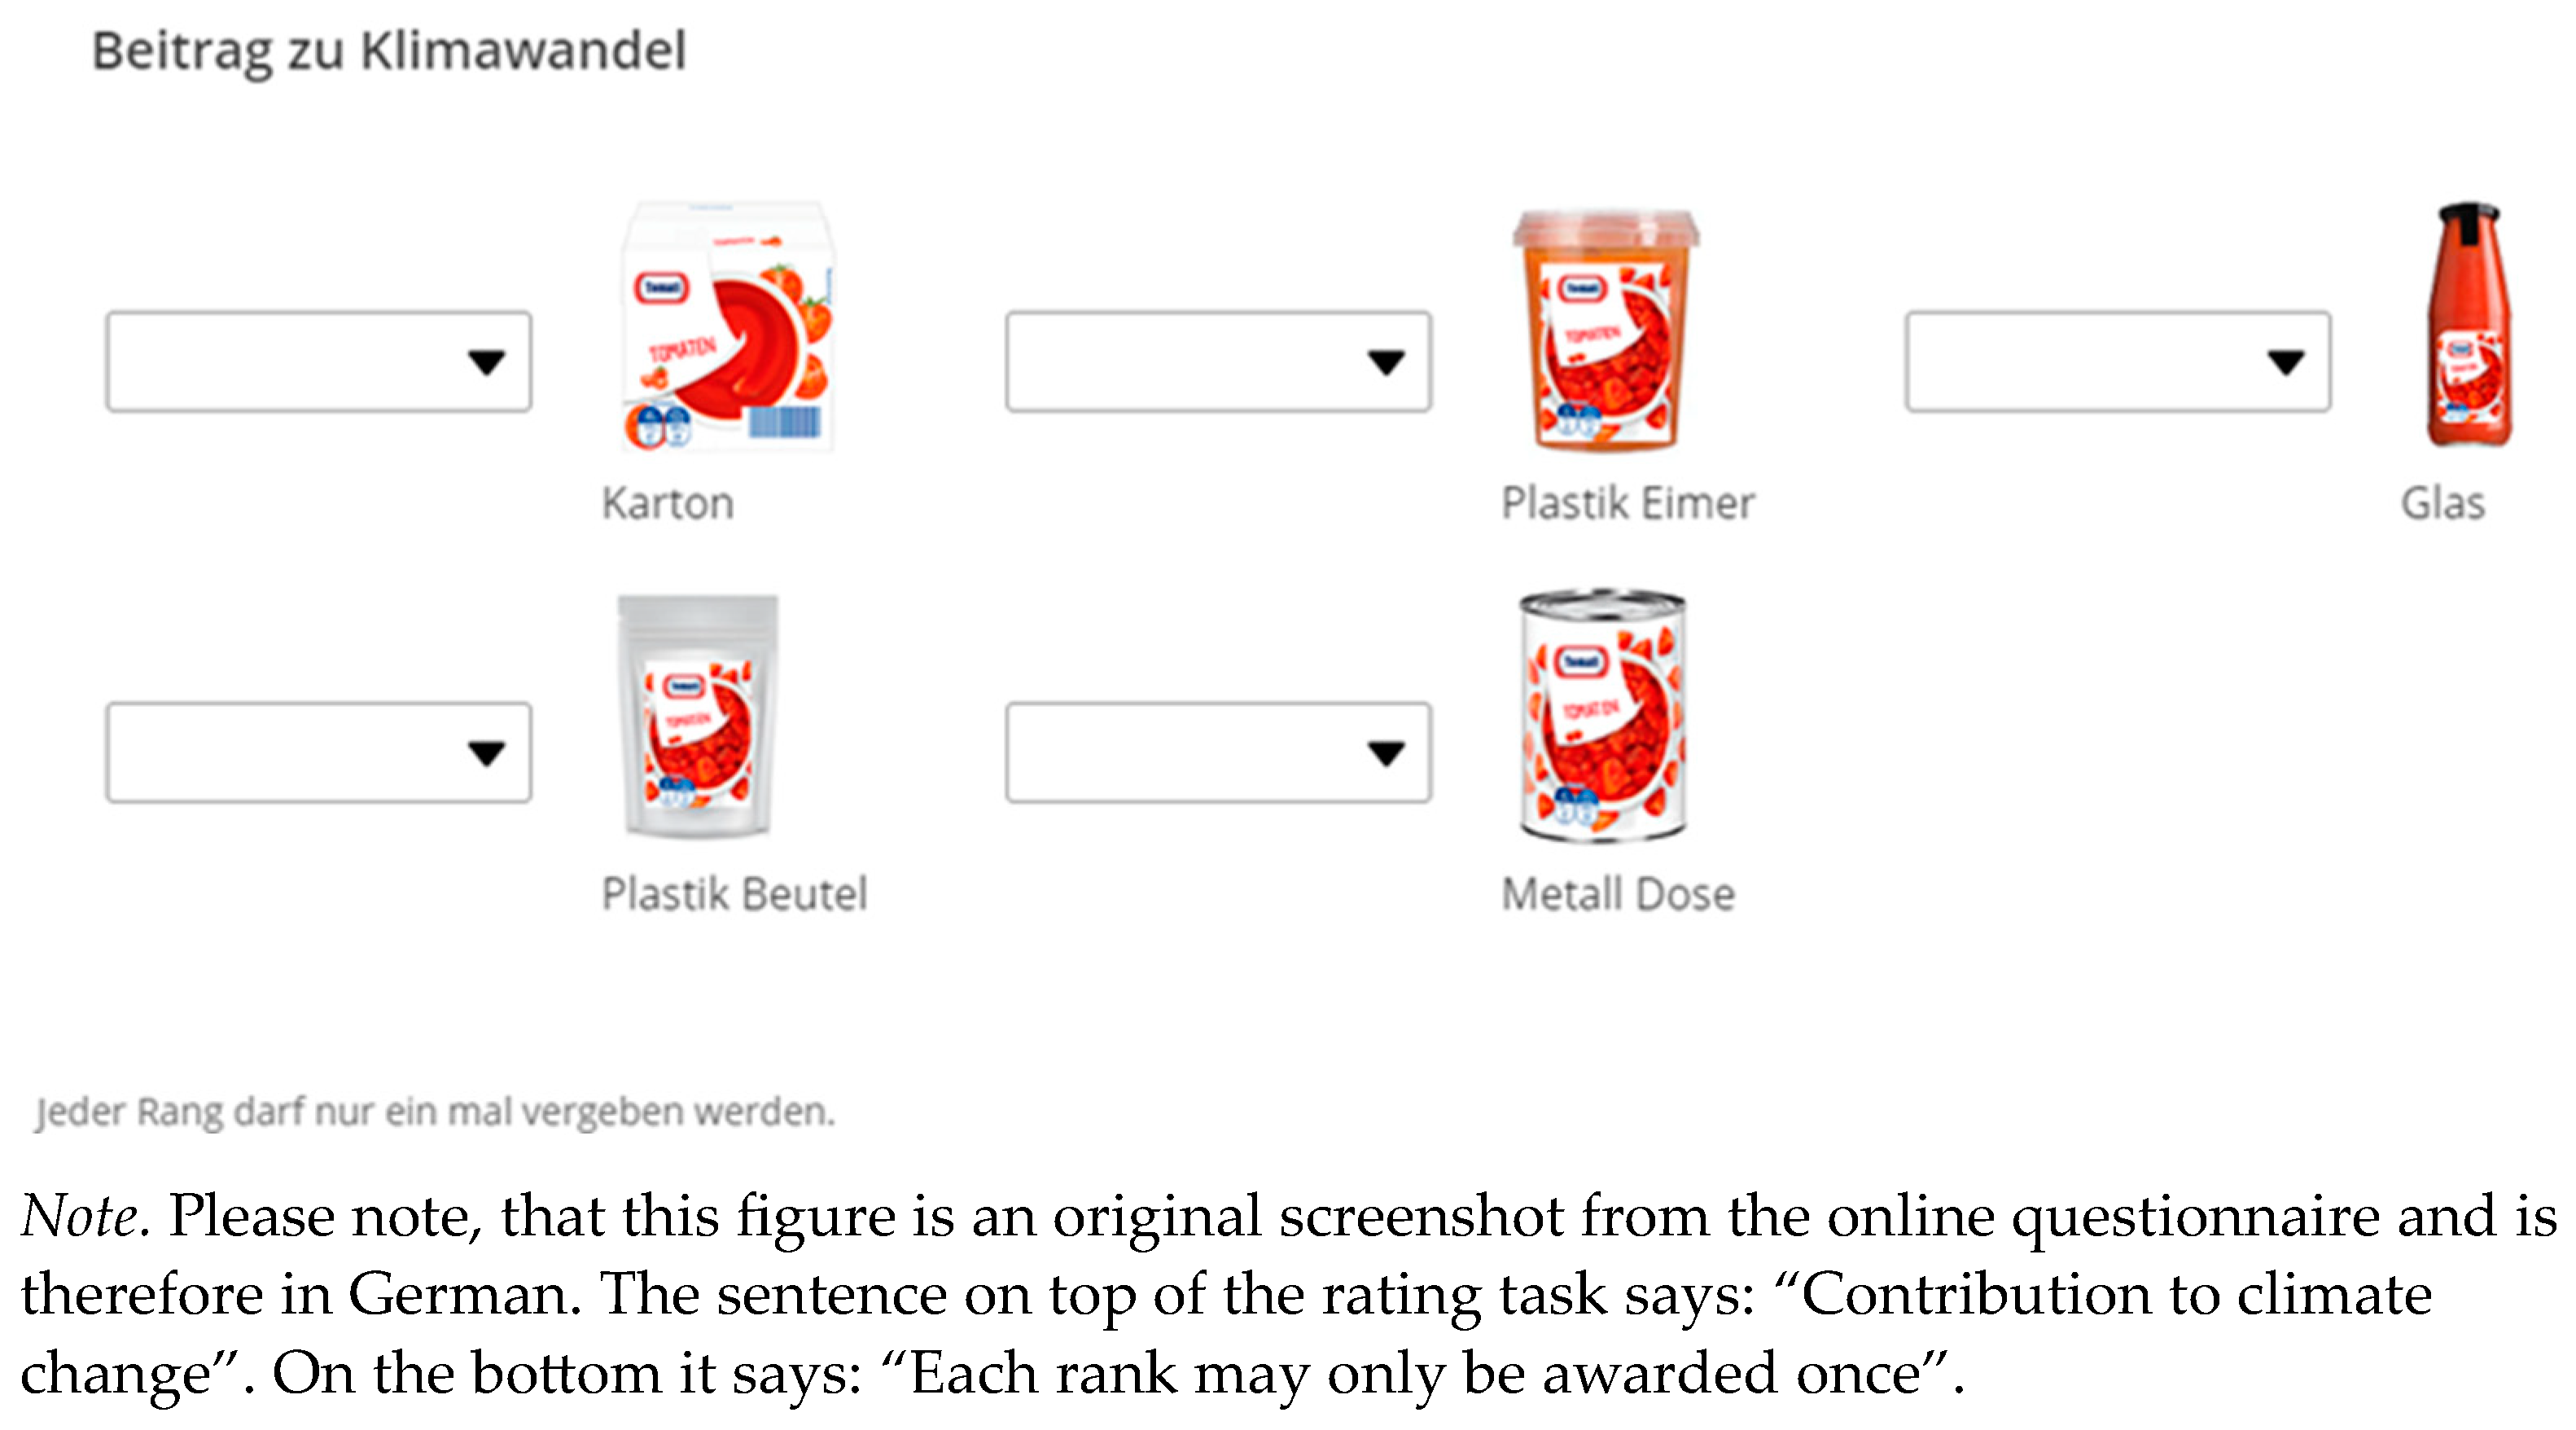
In the fourth part of the questionnaire, participants were asked to rank the packages of metal cans, glass bottles, cardboard containers, plastic pouches, and plastic pots in terms of various characteristics and environmental categories from 1 (best) to 5 (worst). Each rank could only be used once. The attributes in the first part of the ranking were sustainable, high quality, tasty, and convenient. These were taken from a study by Steenis et al. [
9] that examined the role of packaging material in sustainability ratings in the Netherlands. The aim was to gain an impression of the image that the materials have among the participants and draw possible conclusions from this about the choice-behavior in the experiment.
The environmental categories, contribution to climate change, ozone layer depletion, and transport intensity in the second part of the ranking originate from the life cycle assessment (LCA) for the packaging of long-life foods [
18]. Various resource-relevant categories (consumption of abiotic resources, fossil resources, and primary energy, renewable and non-renewable) were combined as ‘consumption of energy and resources’ and were integrated into the ranking [
18].
The purpose of this task is to analyze whether the respondents can correctly assess the environmental impact of the materials in comparison with each other. The existing IFEU assessment, which also presents a ranking, makes it possible to compare the participants’ assessment with LCA data.
Figure 3 shows an example of a ranking task.
2.7. Quiz Design
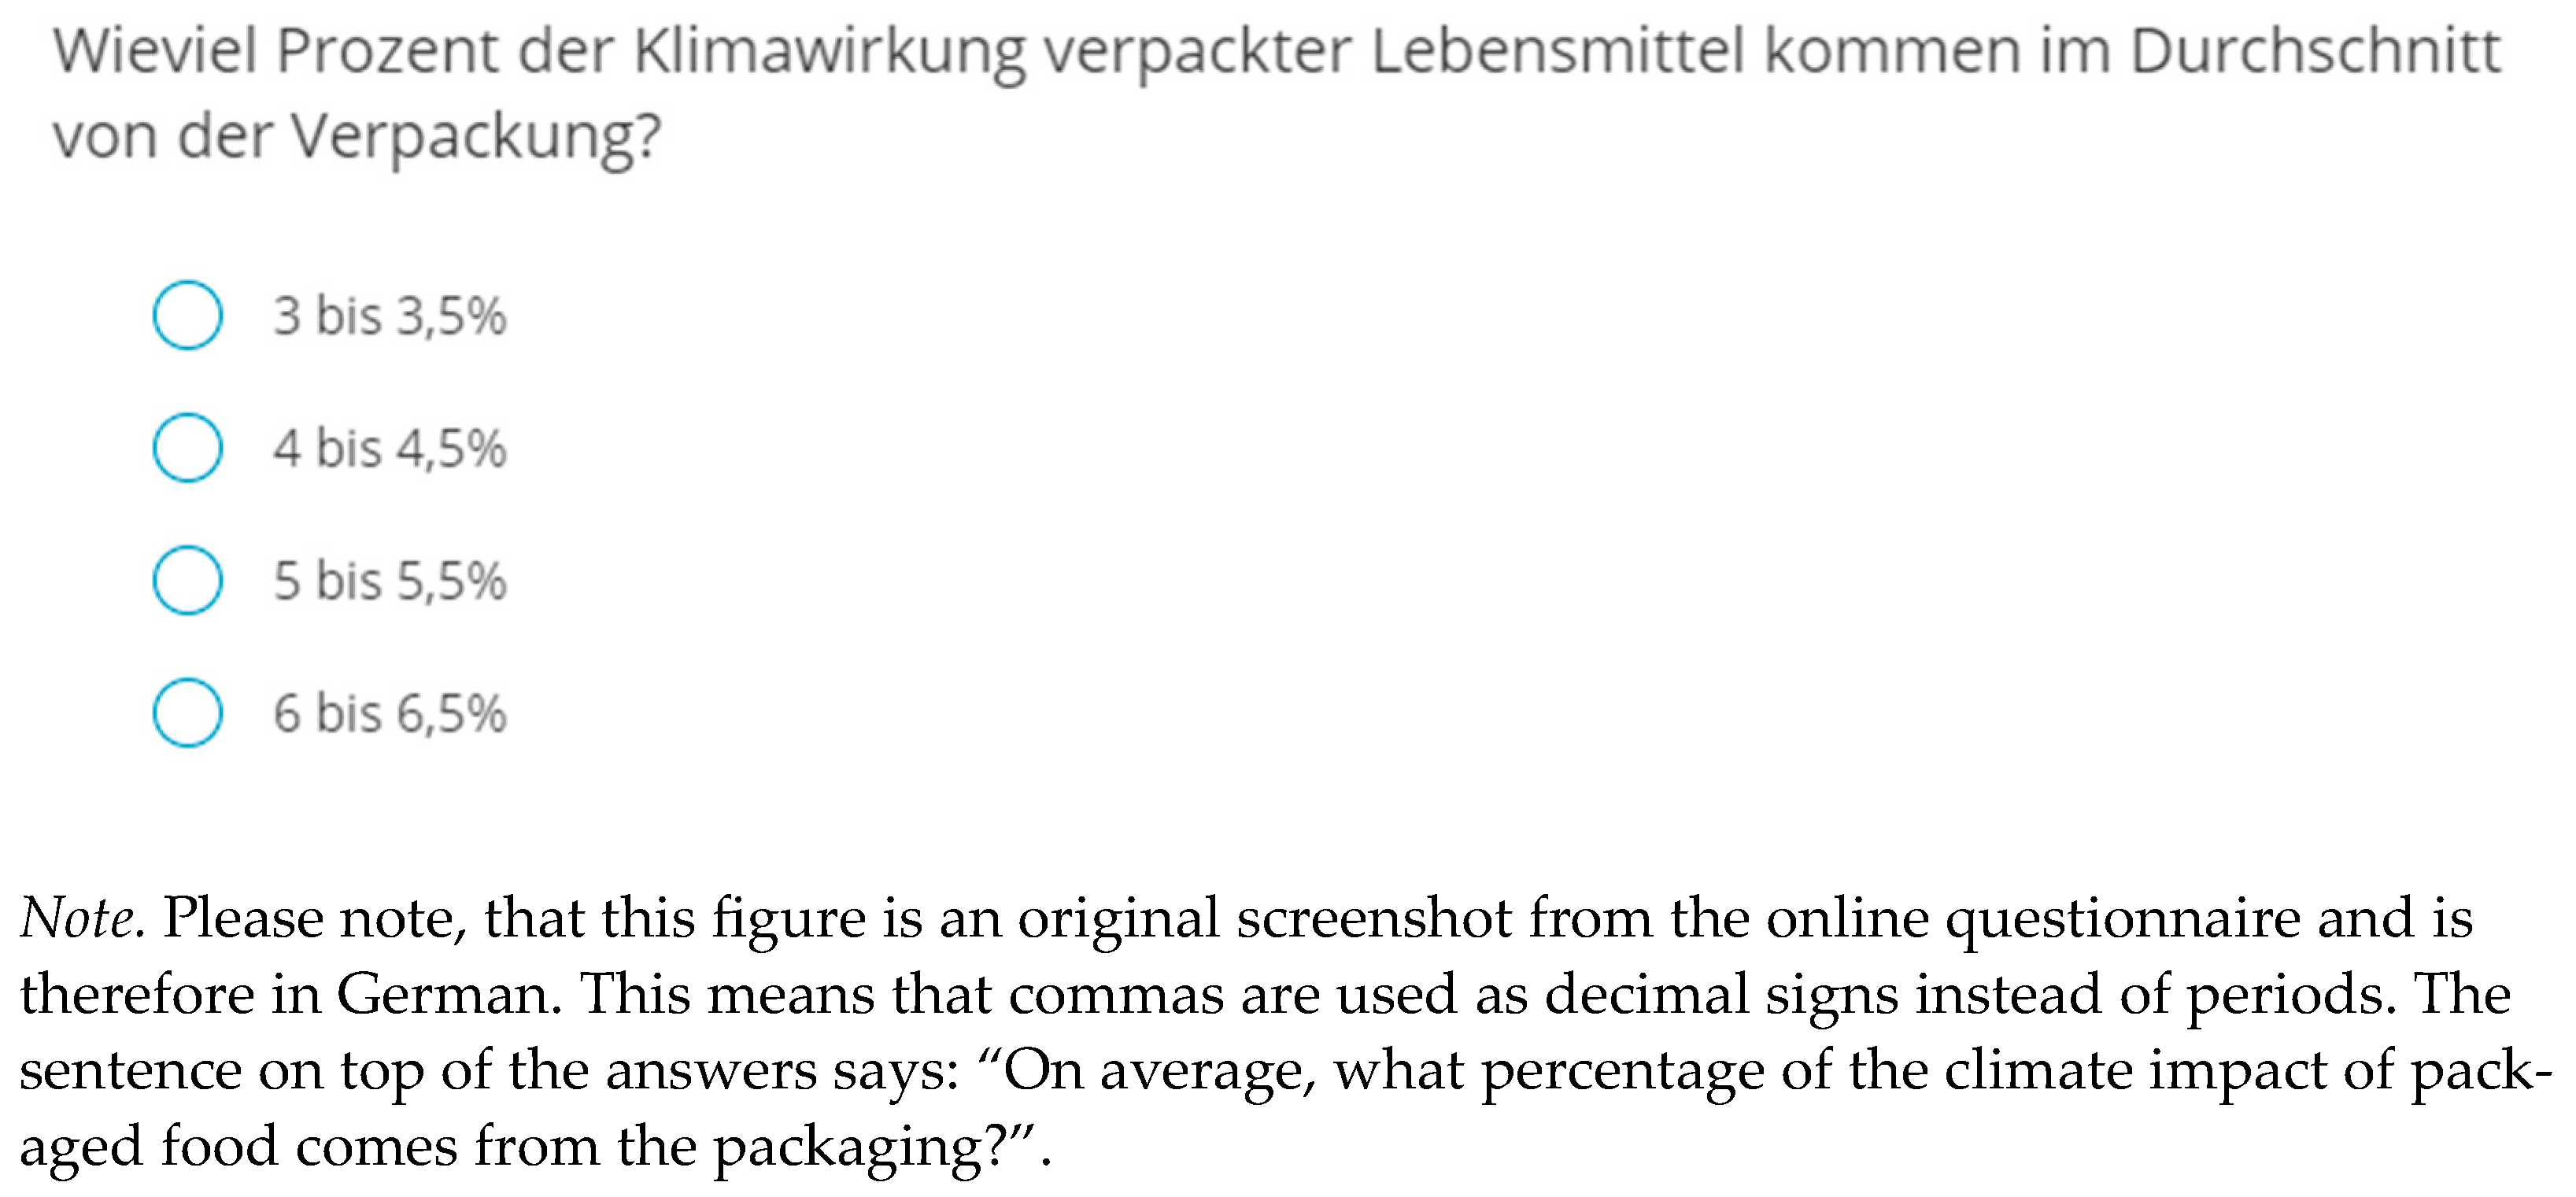
To analyze whether the respondents correctly assessed the benefits and environmental impacts of packaging, a quiz was included at the end of the questionnaire. It contained five questions on the climate impacts of food packaging.
The first three questions were taken from a study on ecological and economic aspects of packaging, which was conducted by the company for packaging market research (GVM) and the Denkstatt Institute in 2019 [
4]. Question four and five were derived from the information in the guide to the research project “Stop Waste—Save Food” and self-authored [
3].
When conducting the survey, participants were asked to answer five questions, each with four possible answers. All questions involved estimating numerical values related to the climate footprint, climate impact, or environmental benefit of packaging, and one point was awarded for each correct answer. The answer choices were coded from one to four. For each question, the first choice was right and reflected the lowest impact. As the number of options increased, the negative impacts of packaging in the answer option also increased numerically. Because of that, the evaluation could also measure whether the respondents overestimate the climatic impact of packaging by analyzing the average response number.
Figure 4 shows an example of a question from the quiz.
2.8. Statistical Method
2.8.1. Analysis in Sawtooth Software
After downloading and cleaning the survey data, the choice-experiment was analyzed in Sawtooth software (version 9.13.0). To determine participants’ preferences for the attribute levels of the attributes price, packaging material, label, and origin, the Hierarchical Bayes (HB) Analysis was used first, which has gained significant and positive influence in the analysis of choice-based conjoint studies in recent years. With the help of HB Analysis, part-worth utilities can be calculated [
26]. A high value reflects a large benefit for the consumer, which indicates a higher purchase probability for the selected product [
27]. In addition, simple segmentation is made possible [
26].
To identify relevant consumer segments, a latent class analysis (LCA) was performed in a second step. LCAs offer the possibility of identifying consumer segments that show a relative homogenous choice behavior in the choice experiment and can afterwards be characterized using several lifestyle constructs [
28]. This method is used in many studies. For example, Leech et al. [
29] used a Latent Class Analysis to divide Australian men and women into segments based on their eating behavior.
In this study, the Latent Classes were formed based on the choices in the choice experiment. Together with the individual part-worth utilities for attribute levels of price, material, label, and origin, three segments with similar preferences concerning these characteristics have been identified and are used for further investigation.
2.8.2. Analysis in SPSS
All further analyses based on HB and latent class analysis were conducted in the Statistical Package for Social Science (SPSS) program (version 27.0.1.0). First, participants’ sociodemographic characteristics were examined in SPSS. Absolute frequencies and percentages in the sample were calculated for the variables gender, employment, and food waste. For gender and employment, the percentages of these variables for the population of generations Y and Z in Germany were reported in addition. For the variables age, available income, household size, waste generated per week, and efforts to avoid waste, the mean values and standard deviation were calculated. The mean of the German generations’ population was added for age, income, and household size. The analysis was extended by including the three consumer segments by indicating the percentage of the variable in the groups as well as the entire sample. A summary of the sociodemographic analysis is later presented in
Table 2 of the results section.
In the second step of the analysis, part-worth utilities for the attribute levels of price, packaging material, origin, label, and no purchase, as well as the relative importance of each attribute, were calculated. This was followed by the factor analysis, which included the items related to the constructs, knowledge about the environment, attitude toward environmental protection, measure of concern for the environment, environmental awareness, price awareness, and positive opinion about labels. Factor analysis was also used in Yadav and Pathak’s study [
19] on young consumers’ green product purchasing behavior, as well as a study of green consumption behavior by Biswas and Roy [
20], where it served as an appropriate means of analyzing statements (Analysis of Variance (ANOVA) and Post Hoc Test (Tukey) were used to identify significant differences between the mean factor scores for each construct and consumer segment). This made a comparison between the three groups possible and allowed a description of the segments in terms of the attitudes depicted. ANOVA and Post-Hoc Tests were also used in a study by Suki to investigate the effects of consumer values on the purchase behavior of environmentally friendly products [
22].
To discover relationships between variables, regression analysis was used next. In this process, an attempt is made to explain a dependent variable by several independent variables, as an influence of these is suspected. In this study, it was examined to what extent the constructs as independent variables explain the dependent variable’s waste prevention efforts.
The quiz was evaluated using the absolute frequencies for each answer choice as well as the percentage of frequencies for the entire sample and the three consumer groups. In addition, the mean values and standard deviations of the quiz scores were calculated.
For the evaluation of the assessed usefulness of the packaging examples, the mean values of the answer options coded from 1 (not at all useful) to 5 (very useful) were calculated for the entire sample and the groups. Similarly, the rankings were analyzed. Here, the mean rankings for each variable were again calculated for the entire sample and the consumer groups.
3. Results
In this results section, we first describe our sample and compare it to the population of Generations Y and Z in Germany to indicate the level of representation. After this, the results of the Hierarchical Bayes model for the whole sample based on the choice-experiment data are shown.
The results of the Hierarchical Bayes model include the relative importance of the attributes to the participants as well as the part-worth utilities of each attribute level within each attribute. This indicates which attribute is most important when choosing the most sustainable option and which attribute levels are perceived as more sustainable than others.
After the results of the Hierarchical Bayes model, we show the results of the latent class analysis to identify homogeneous consumer segments based on their choices in the experiment. The relative importance of the attributes as well as the part-worth utilities are then presented for each of the identified consumer groups. We additionally describe the socio-demographic variables for the estimated segments in the next subsection. This is conducted to identify significant differences between the segments regarding their socio-demographic variables. In our study, we also conducted items for different lifestyle constructs to describe the different consumer groups. First, the results of the factor analysis for these lifestyle constructs are presented. After that, we show the profiling of the latent consumer segments regarding these lifestyle constructs and indicate if there are significant differences between the segments. This helps us to better understand the values and motives of the different consumer segments. These lifestyle constructs are then used as predictors in a regression analysis to explain the efforts to avoid waste.
In the next subsection, the results of the quiz are shown for the different consumer segments. This helps to measure the knowledge of the consumer segments regarding environmental issues related to packaging. In another subsection, we present the results of the package usefulness evaluation for the whole sample and each consumer group. The results of the packaging image ranking are next and indicate how the different packaging materials are perceived by consumers. Here we are also comparing the results of this image ranking to the results of a life cycle assessment to finally see where these two differ.
3.1. Sample Description
The socio-demographic data were analyzed according to the pattern shown in
Table 2. A total of 245 respondents between the ages of 18 and 40 were included in the sample. The average age of the participants is 26, which is slightly lower than the average of Generations Y and Z in Germany. At 51.4%, more men than women (48.6%) participated in the survey, which corresponds to the distribution in the population. On average, respondents live in a two-person household that produces an average of 5.83 kg of estimated self-reported waste per week. Efforts to reduce this are high. Food is thrown away rarely or occasionally by 72.1% of respondents, and often or very often by only 7.8%. Compared to the population of 18- to 40-year-olds in Germany, the share of university students in this study is high at 69% and, in turn, a proportion of 25% employees are rather low. It is likely that most of the students in this study are studying at HAW Hamburg, as we used email lists from our university to distribute the link to the questionnaire. This is also reflected in the comparatively low average available income of €669.6 of this study participants.
Table 2.
Summary of the socio-demographic analysis (N = 245).
Table 2.
Summary of the socio-demographic analysis (N = 245).
| Variable | Levels | Frequency
Sample | Share (%)
Sample | Share (%)
Generation Y and Z |
|---|
| Gender 1 | Male | 126 | 51.40 | 51.60 |
| | Female | 119 | 48.60 | 48.40 |
| Employment | Student 2 | 2 | 0.80 | 2.40 |
| | Apprentice 2 | 7 | 2.90 | 6.30 |
| | University student 3 | 169 | 69.00 | 12.00 |
| | Employee 4 | 60 | 24.50 | 69.50 |
| | Without employment 4 | 3 | 1.20 | 2.80 |
| | Other 5 | 4 | 1.60 | 7.00 |
| Food waste | Rare | 105 | 43.00 | N.A. |
| | Occasionally | 71 | 29.10 | N.A. |
| | Now and then | 49 | 20.10 | N.A. |
| | Often | 17 | 7.00 | N.A. |
| | Very often | 2 | 0.80 | N.A. |
| Variable | Unit of measurement | Mean | Standard deviation (SD) | Mean
Generation Y and Z |
| Age 1 | Years | 25.70 | 5.17 | 29.60 |
| Available income 6 | Euro | 713.19 | 669.60 | 2372.00 |
| Household size 7 | People | 2.39 | 1.23 | 2.03 |
| Amount of waste/week | Kilogram | 5.83 | 6.80 | N.A. |
| Efforts to avoid waste | 1 very much, 5 absolutely not | 1.84 | 0.82 | N.A. |
3.2. Results of the Hierarchical Bayes Model
The Hierarchical Bayes model was used to determine the average preferences (part-worth utilities) of the participants for the attributes, packaging material, price, label, and origin.
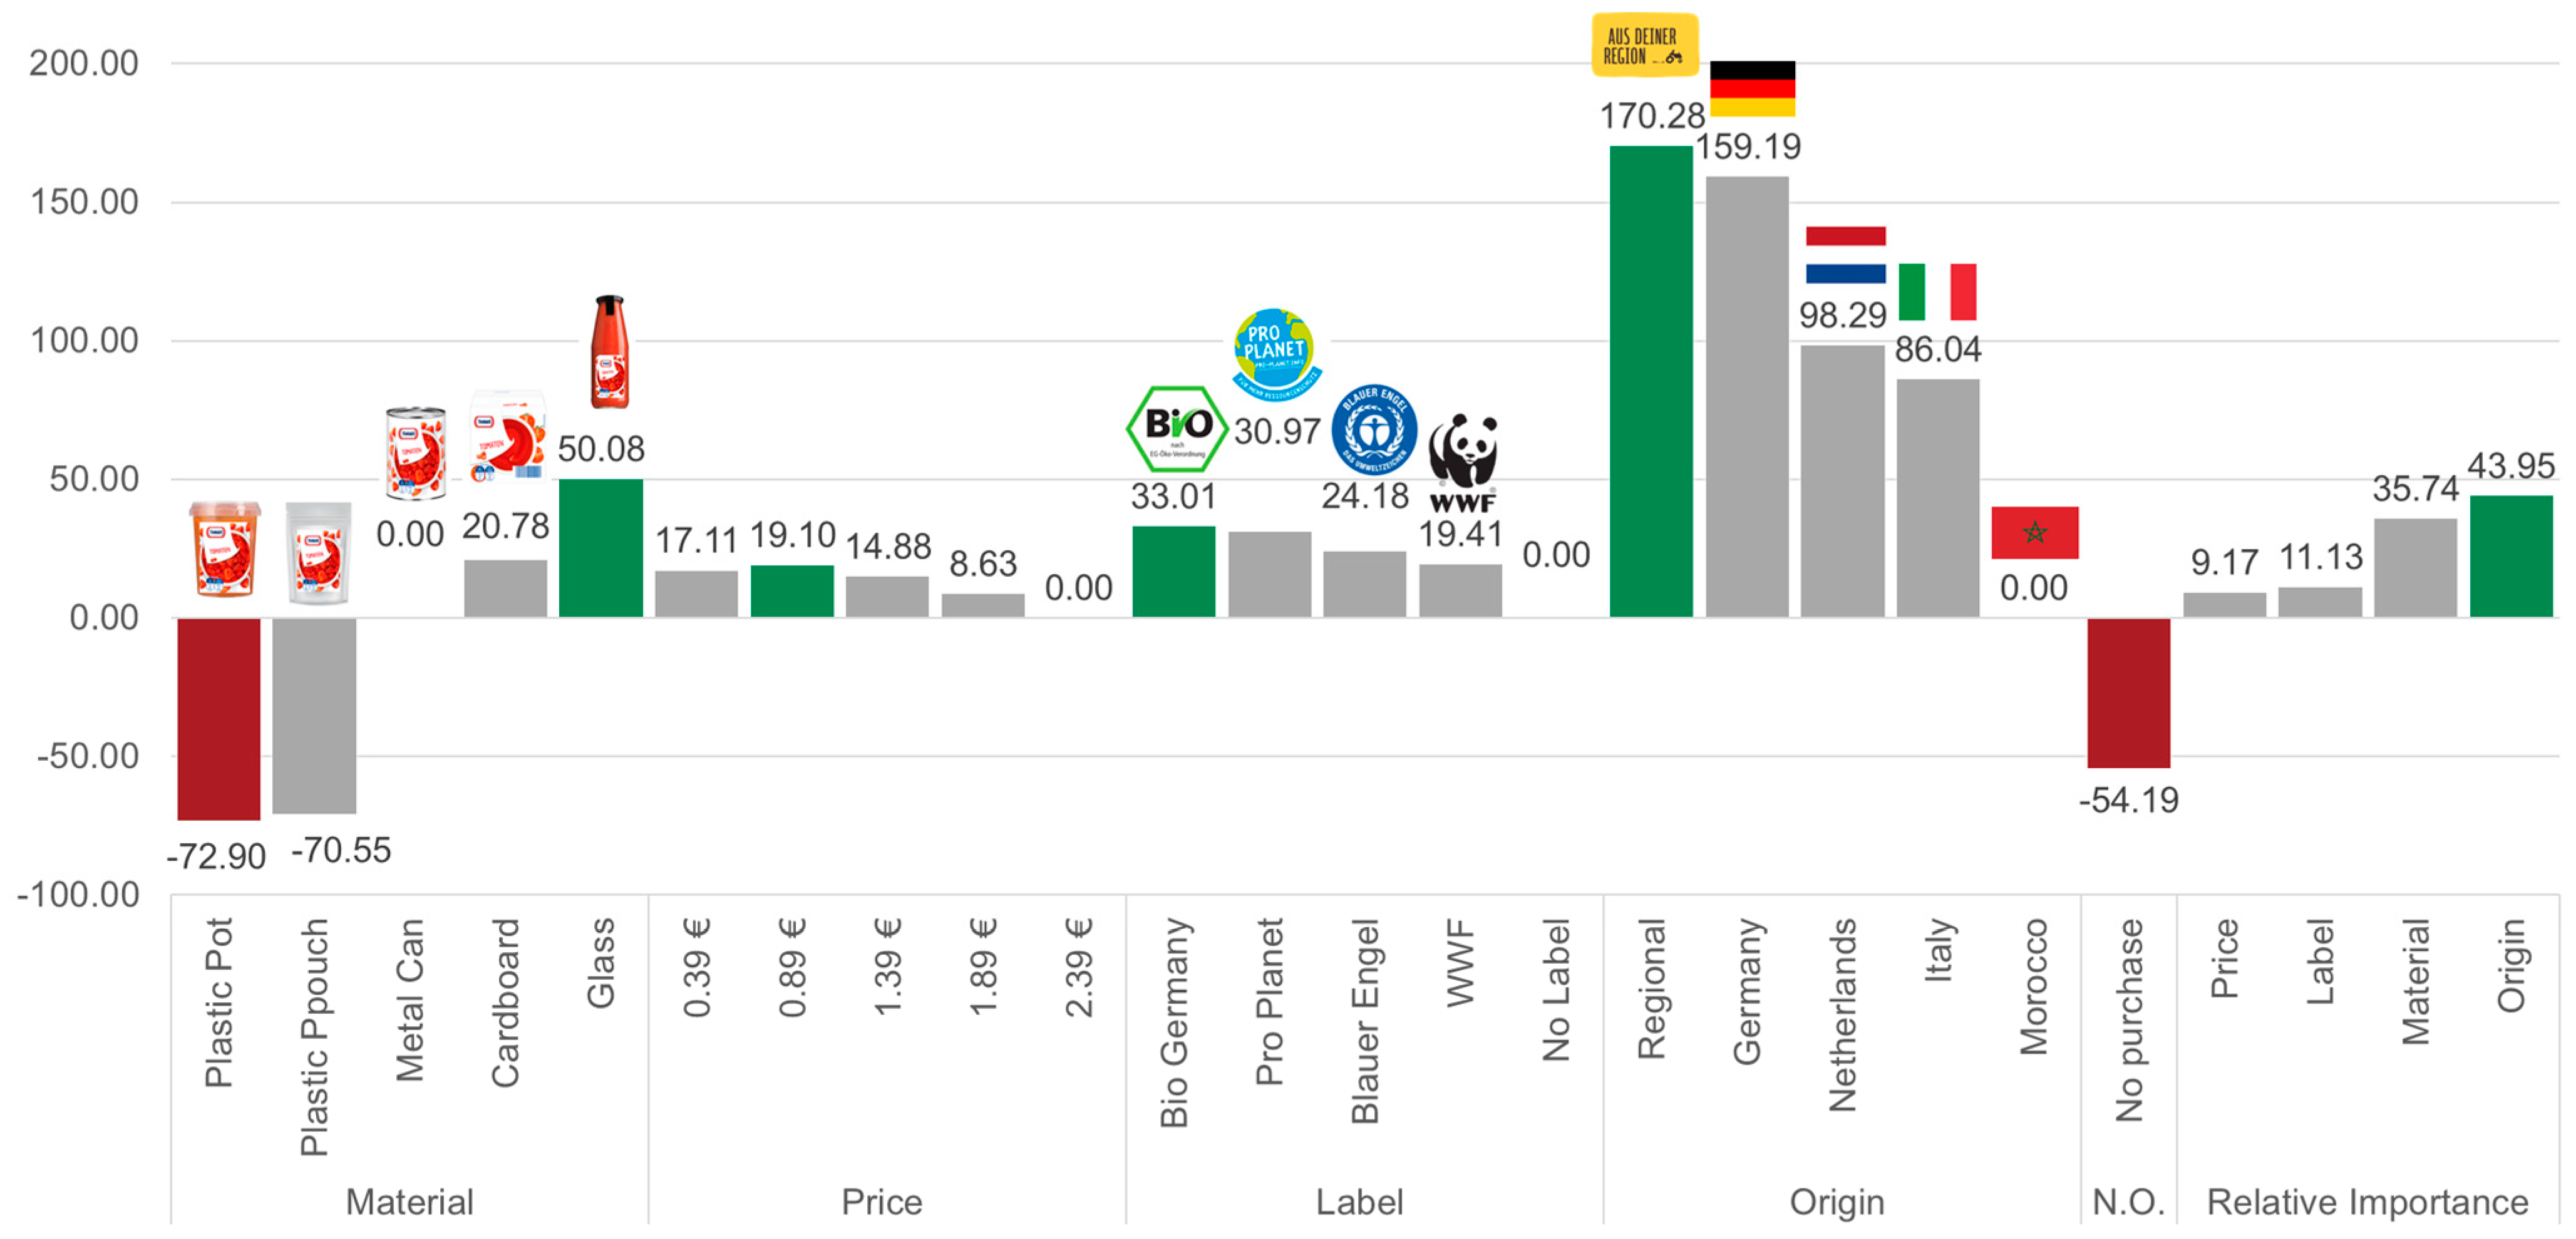
Figure 5 shows the estimated part-worth utilities for each attribute level, the non-option (no purchase), and the relative importance of the attributes. To enable a better comparison, one attribute level of each attribute was set to zero. This applies to the material metal, the highest price, the characteristic no-label, and Morocco as an origin.
The average participant prefers the packaging material glass to cardboard and shows a clear rejection of both plastic packagings. The part-worth utility values decrease slightly with increasing prices, with the exception that the price of €0.89 is preferred over the one of €0.39. In relation to the option no label, the labels show positive part-worth utilities, with the highest values for the German Bio (organic) label. Products from the region are clearly preferred by the respondents. The preferences for regional and German products are similarly close to those from the European countries of France and Italy. Morocco, on the other hand, is clearly lagging.
For the average respondent, the origin is of the highest importance, followed by the packaging material, when choosing perceived environmentally friendly strained tomatoes. Price and label show lower values, whereas price is even less important when choosing the most sustainable alternative in the choice-experiment.
3.3. Results of the Latent Class Analysis
To detect heterogeneity in the sample and form meaningful groups that are similar in their choice of behavior, it is first necessary to decide how many classes to form. Nylund et al. [
30] emphasize that the scientific community disagrees on what the best criteria are for determining the number of classes. Therefore, a combination of criteria, including statistical information criteria such as Akaike’s information criterion (AIC) and Bayesian information criterion (BIC), was used. In addition, the consistent Akaike information criterion (CAIC), which is closely related to loglikelihood, was included in the decision because it was described as an appropriate criterion along with the BIC [
30]. All information criteria have allowed for deeper investigation of a variety of content research areas in the past [
30].
Table 3 shows the criteria calculated for a number of classes ranging from two to five.
The values for CAIC and BIC decrease until the three-group solution and then increase again for the four-group solution. Since small values are preferred, three groups were formed for further analysis [
27].
The results of the latent class analysis for the three group solution are presented in
Table 4. The segment division is based on the decisions of the participants in the choice experiment. The results show the part-worth utilities for each attribute level and for each consumer group. The relative importance of each attribute is shown, as these give an indication of what has the greatest influence on the groups’ decisions.
The consumer groups are very similar in the ranking of the individual attribute levels. For example, all groups have the highest part-worth utility for the material glass, followed by cardboard, and all favor the organic (Bio) label and products from the region and Germany.
Group 1 includes 36.7% of the respondents and is named ‘Plastic Hater’. For the members of this group, the packaging material is most important in the choice of sustainable products. They prefer glass and show the greatest rejection of all groups for both packaging made of plastic, on which the name of this segment is based. For this group, the non-option no purchase has the lowest value, which suggests that the participants also decide on a product if it does not completely correspond to their conceptions.
The largest group, with 39.2% of the respondents, are Origin-Conscious consumers. The name was chosen because origin is of the utmost relative importance for its members. This segment favors, like the other groups, regional products, followed by those from Germany. But they also show the highest part-worth values for the Netherlands and Italy. Even though this group favors glass as a packaging material, the part-worth utility value is rather low in comparison with the other groups, and that for cardboard is the highest of the three segments. Group two is the only one that perceives the plastic pouch more negatively than the plastic pot, and the labels in general have the highest values in this consumer segment.
A mixture of the first two groups is described by the segment of Quality-Oriented consumers (24.1%). For these participants, origin and packaging material play a similar role in the choice of sustainable products. These group members have the highest utility value for glass and the lowest for cardboard. With the highest part-worth utility of 1.39€, this segment favors the highest price of all groups. It is also striking that its members are the only ones that show a positive part-worth utility value for the non-option (no purchase). It can be deduced that these respondents would rather choose no product than one that does not meet their requirements.
3.4. Results of the Socio-Demographic Variables for the Estimated Segments
The socio-demographic data of the participants were collected at the beginning and at the end of the questionnaire.
Table 5 shows the results of these socio-demographic parameters for the three consumer groups formed in the LCA.
It is noticeable that there are no significant, but just small, differences between the three consumer groups regarding their sociodemographic attributes.
Among the Plastic Haters, there are 13.4% more men than women, and the group of Quality-Oriented consumers consists of 8.4% more women than men. For Origin-Conscious consumers, the gender distribution is exactly half women and half men. Group 2 (Origin-Conscious consumers) is the only one with a small proportion of students, the most university students, and the fewest employees. This also results in the lowest average age. The group of Plastic Haters has the largest proportion of employees and the smallest proportion of trainees, which may also result in the highest average age and the highest average income. Even though the values of the segments differ only slightly from each other, small differences in food waste become apparent. A difference of one kilogram, concerning the stated amount of food waste per household and week, can be seen between the Plastic Haters (6.21 kg) and Quality-Oriented consumers (5.22 kg). The participants of Group 1 (Plastic Haters) also show slight deviations from the other groups in the indication of how often food is thrown away. According to their own statements, 8.9% of these group members often throw away spoiled food, which is the highest value of all groups. And with a share of 34.4%, this group shows the lowest value for rare food waste.
3.5. Results of the Factor Analysis for the Lifestyle Constructs
Two principal component factor analyses with varimax rotation were conducted using SPSS for the items measuring respondents’ attitudes toward environmental issues and product attributes. The Kaiser–Meyer–Olkin (KMO) criterion and Bartlett’s test for sphericity (BTS) were used to validate the results. The values of the KMO range from 0 to 1, whereas 0 is the worst and 1 is the best possible situation. Only values above 0.5 are considered acceptable [
31].
In this study, the value of the KMO is 0.728 for the first factor analysis for the construct’s ‘Knowledge about the environment’, ‘Environmentally conscious actions’, ‘Price awareness’, and ‘Opinion on seals’. For the second factor analysis of the factors ‘Attitude toward environmental protection’ and ‘Concern for the environment’ the KMO value is 0.797. Both values are classified as ‘Middling’ according to Kaiser [
31]. Using the BTS, the null hypothesis is tested to determine whether the sample belongs to a population with uncorrelated variables [
27]. The BTS is significant for both analyses, which is why the null hypothesis can be rejected and a factor analysis is possible.
Table 6 shows the results of the factor analysis and all the items used to measure the different psychographic constructs.
When items are used to form a scale, they must have internal consistency, which means that all items measure the same thing and correlate with each other [
32]. To assess internal consistency, the Cronbach’s alpha criterion was used. According to Bland and Altman [
32], alpha values of 0.7 to 0.8 are considered satisfactory for comparing groups. In this study, the values for Cronbach’s alpha range from 0.702 to 0.808, thus meeting the requirements.
Next, the three identified consumer segments are described using the extracted factors from
Table 6.
Table 7 presents the results with means and standard deviations for each group and factor (construct).
The only factor in which the three groups differ significantly is perceived knowledge about the environment. The Plastic Hater segment has the lowest mean values, and the Origin-conscious consumers have the highest. Quality-Oriented consumers include members with both poor and good perceived environmental knowledge.
The Plastic Haters also have the lowest scores for the factors attitude toward environmental protection, concern for the environment, and environmentally conscious actions. Price consciousness is the highest among members of this group. In contrast, the mean values for concern for the environment and environmentally conscious actions are highest among Origin-Conscious consumers. This group has not only good environmental knowledge but also the greatest concerns and acts in the most environmentally conscious way, according to their own estimation. In addition, these participants also have the most positive opinions about labels. Quality-Oriented consumers have the highest value for their attitude toward environmental protection. As expected, price awareness is comparatively low in this segment because members rather focus on quality than on a low price. They also show little interest in labels.
3.6. Results of the Regression Analysis
With the help of regression analysis, relationships between different variables can be examined, and positive or negative correlations can be shown. The model consists of a dependent variable that is to be explained and several independent variables that are assumed to have an influence on the dependent variable [
33].
This study examined the extent to which the six constructs ‘knowledge about the environment’, ‘attitude toward environmental protection’, ‘concern for the environment’, ‘environmentally conscious actions’, ‘price awareness’, and ‘opinion on seals’ as independent variables explain the dependent variable ‘efforts to avoid waste’.
Table 8 shows the standardized beta and significance level for each construct as well as the
for this model.
The results show that ‘knowledge about the environment’, ‘attitude toward environmental protection’, ‘concern for the environment’, as well as ‘environmentally conscious actions’ have a significant positive influence on the participants’ stated efforts to avoid waste. This means the higher the knowledge about the environment, attitude toward environmental protection, concern for the environment, or environmentally conscious actions of the respondent, the more he or she also tries to avoid waste. The strongest effect can be seen for environmentally conscious actions, with a standard beta of 0.224 at a significant level of 0.005. The
represents the percentage of the variation in the outcome that can be explained by the model [
33]. For this analysis, it means that the constructs explain the variance of the effort to avoid waste by 24.2%.
3.7. Results of the Quiz
One point was awarded for each correct answer in the quiz, so that a maximum score of five points could be achieved.
Table 9 shows the frequencies of all point values and the percentage distribution for the entire sample and the three consumer groups.
The average respondent scored 0.54 points, with a standard deviation of 0.75. More than half of the respondents (58.6%) could not answer any question correctly. The highest score of four points was achieved by only one respondent from the Plastic Hater group. Against expectations after the factor analysis, there are no significant differences between the latent classes when it comes to the results in the quiz regarding environmental knowledge.
Table 10 shows the five questions and the frequencies of the chosen answer options in total numbers and percentages for the whole sample. As already described, the answer options were designed in such a way that the negative impact of packaging increases with the number of answers, and the least and first ones were always right. Therefore, a mean answer option was calculated for every question.
For all questions, participants chose the third answer option on average. The highest mean value is shown for the first question. Almost one-third of the attendees estimated the share of packaging in the climate footprint at 4.5–5.0%, which is more than double the correct answer of 1.5–2.0%. For this and the second question, the fewest respondents knew the correct answer (5.7%). For the question that relates packaging consumption to a flight distance, the mean answer of 2.5 is the best because more respondents (20.2%) knew the correct answer than for all other questions. The benefit of packaging through waste prevention was also significantly lower. Almost 30.0% of the sample estimates the environmental benefit to be as high as the environmental costs, although the benefits are 5 to 10 times higher. For the third question, just as many participants chose the correct and best answer as the worst answer option. For all other questions, a majority of the sample chose the worst scenario, followed by the real and best values.
3.8. Results of the Package Usefulness Evaluation
The less packaging material there was, the more useful the packaging was rated by the participants. Especially the absence of plastic influenced the positive rating.
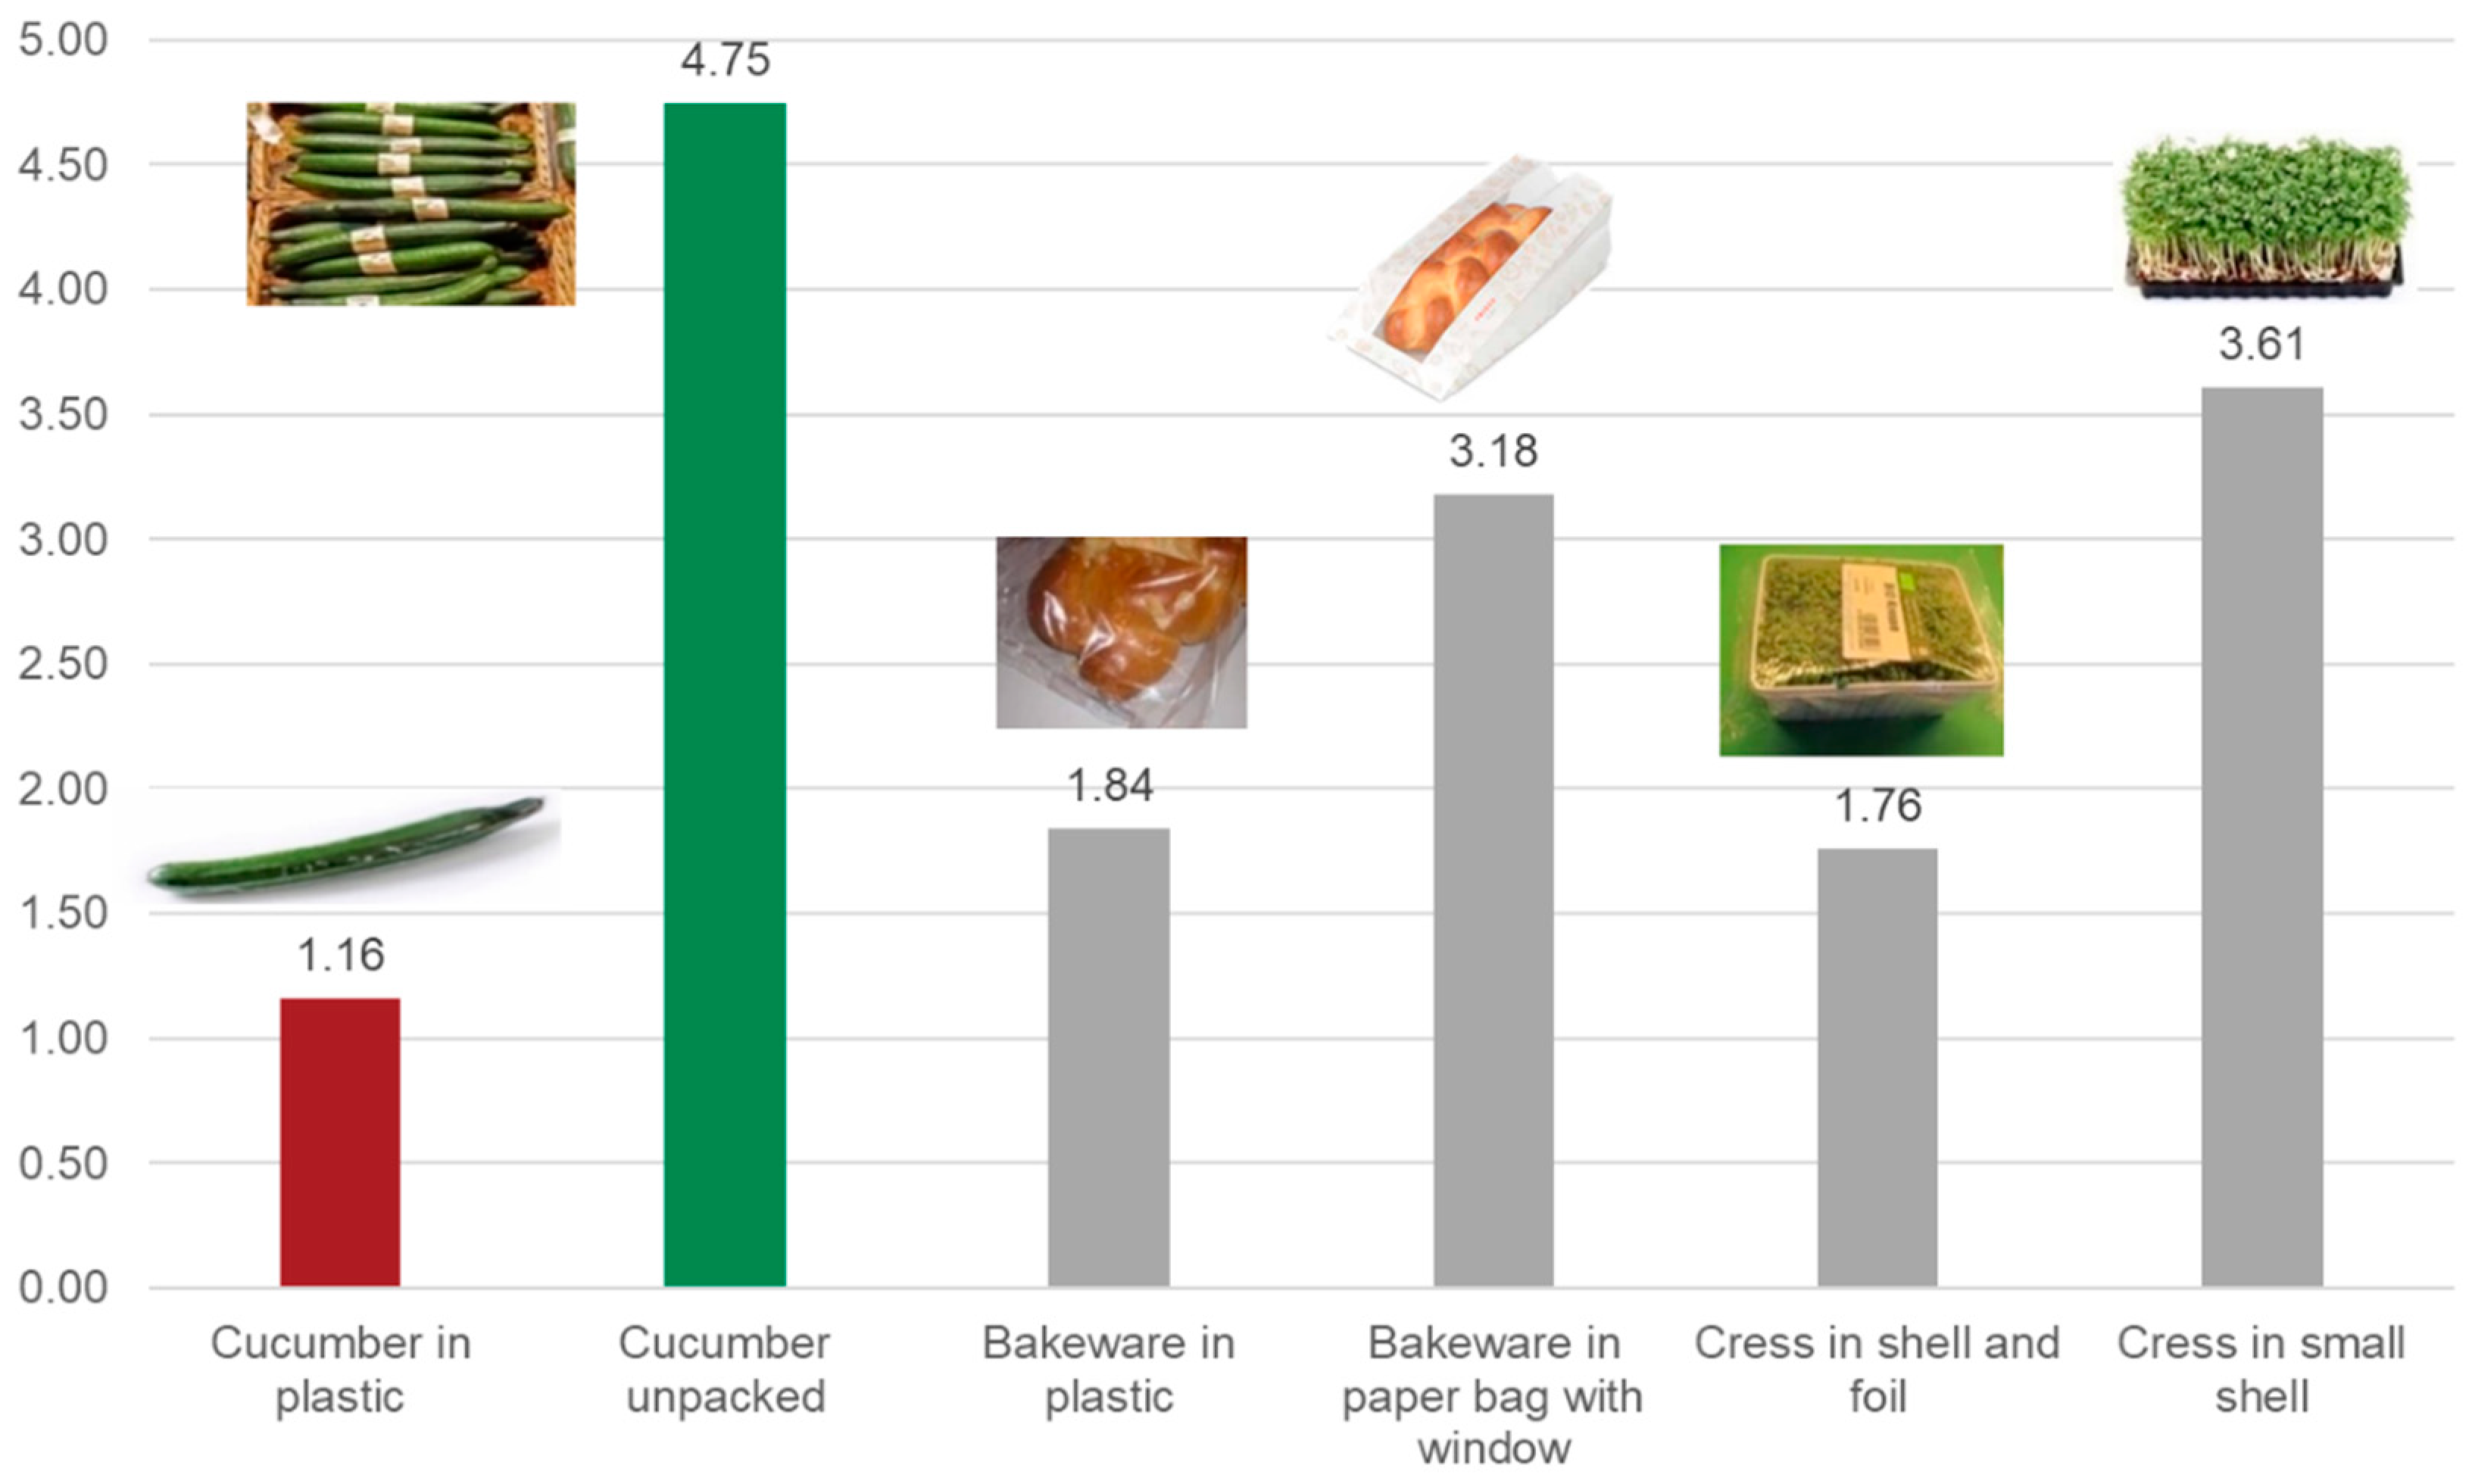
Figure 6 shows the mean values of the evaluated usefulness and the images of the packaging options from the questionnaire.
The biggest difference can be seen in the cucumber. On average, the plastic tube packaging was rated 1.16 and the unpacked version 4.75 on a scale from 1 (not useful at all) to 5 (very useful). The result for cress is similar, although not as pronounced. Only in a plastic tray was it rated 3.61, and with additional foil, the value decreases to 1.76. The smallest difference can be seen in the packaging of the bakeware. Here, the plastic foil received the best rating of the pure plastic packaging with 1.84, and the paper bag with a window received the worst rating of the alternatives with 3.18. The mean scores for the latent classes show no significant differences and can be seen in
Table 11.
3.9. Results of the Package Image Ranking
In the first part, the participants ranked the five types of packaging made of glass, plastic, cardboard, and metal in terms of their sustainability, quality, naturalness, consumer friendliness, and the extent to which they make the food appear tasty.
Figure 7 shows the results in a spider web diagram. Here it is about the perception of the packaging material itself without relation to a particular product example. For example, metal can be perceived as natural.
Glass was ranked best in all categories. For the attributes natural, sustainable, high-quality, and tasty by a large margin over the alternatives, and for the attribute convenient only by a small margin over plastic and cardboard packaging. Cardboard packaging follows glass in most categories but shows declines in the perception of quality. When it comes to quality, the metal can is ranked after glass, which is otherwise behind cartons and even has the worst score for convenience. The plastic pouch and pot both show poor results and have a bad image except for consumer convenience, where they are about equal with the carton and ahead of the metal can. The mean ranks for the whole sample and the three latent consumer groups can be seen in
Table 12.
There are some significant differences in the image ranking between the consumer groups. The Origin-Conscious consumers rated the plastic pot more sustainable than the other two groups, and glass in the same category was worse than for the Quality-Oriented consumers. They also rated cardboard as less natural and high-quality than members of Group 3. On the other hand, Group 2 ranked the plastic pot as more natural than the Quality-Oriented consumers. The ranking continued for sustainability indicators also used in life cycle assessments.
Table 13 provides an overview of the results for the entire sample and latent classes.
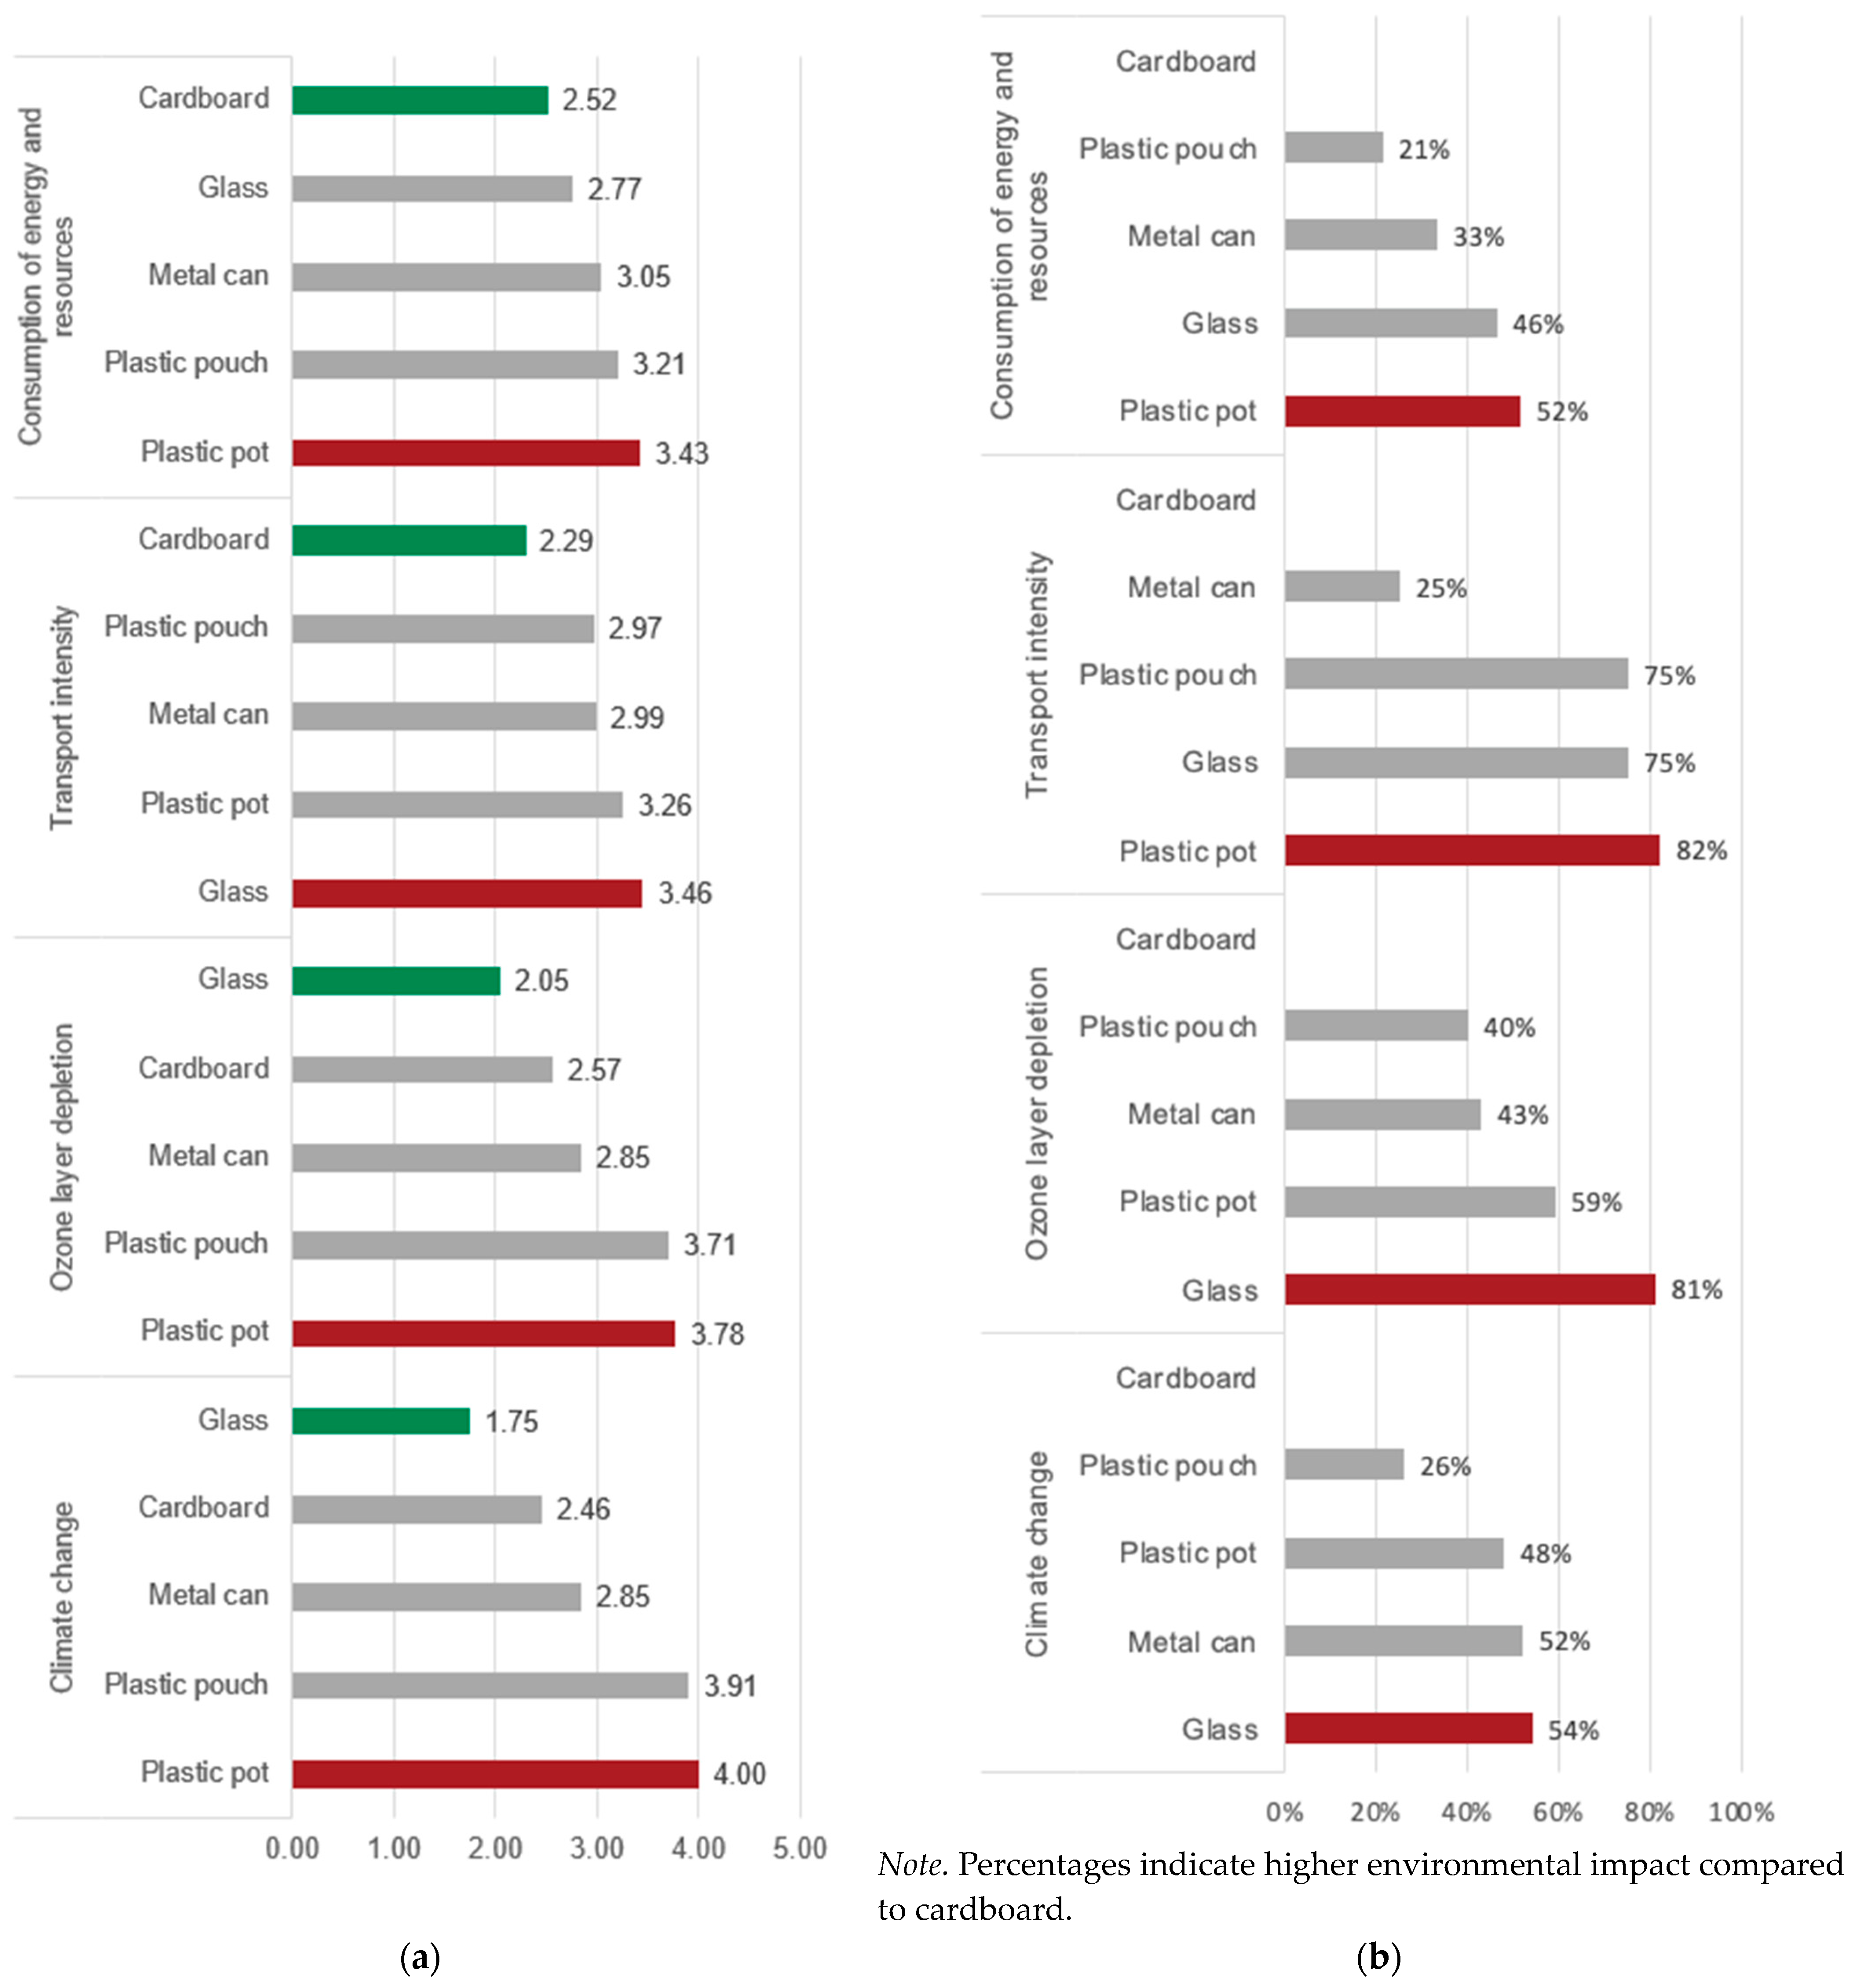
The ranking of the packages according to the middle positions is the same for the contribution to climate change and ozone layer depletion, with glass at the top, followed by cardboard, metal cans, plastic pouches, and plastic pots at the end. Only the gaps between the ranks are clearer for climate change. For transport intensity, cardboard is in the lead with a middle rank of 2.29 and is followed by the plastic pouch (2.97). Glass is in last place, with a mean rank of 3.46. The middle ranks concerning consumption of resources and energy are closest together. Cardboard achieves the best average value with 2.52 and is followed by glass, metal, and plastic packaging. The only significant difference between the latent classes is that the Origin-Conscious consumers ranked the metal can better for the aspect of ozone layer depletion than the Quality-Oriented consumer group. Comparing the results of the survey, which can be seen in
Figure 8a, to the results of the life cycle assessment, shown in
Figure 8b, deviations become apparent.
It should be noted that the numerical values cannot be compared because they are based on different assessment methods. In the lifecycle assessment (LCA), the results for the packaging alternatives are given in relation to cardboard, which performs best in all categories [
18]. Therefore, the comparison just refers to the ranking of the packaging materials.
The greatest deviations are shown for the packaging materials glass and plastic. For the categories ‘consumption of energy and resources’, ‘ozone layer depletion’, and ‘contribution to climate change’, the plastic pouch is in fourth place among the respondents and in second place in the lifecycle assessment. Glass, on the other hand, is rated too positively by the participants in the present study compared to the LCA results. It is in first place among consumers for both ‘contribution to climate change’ and ‘ozone layer depletion’, although it is in last place in the life cycle assessment. In general, the respondents’ assessment in the category of which packaging materials contribute most to climate change differs the most from the actual circumstances.
4. Discussion
In addition to the origin, packaging material plays a major role in the assessment of the sustainability of durable food products by consumers of Generations Y and Z in Germany. They prefer glass and rate it as the most positive in ecological terms. Plastic, on the other hand, is clearly rejected and is only convincing in terms of convenience. Environmental labels have a positive influence on the choice decision, and the respondents do not prefer the lowest price when it comes to a consciously sustainable decision. In general, the label is of greater importance than the price.
Based on the decision in the choice experiment, the respondents can be divided into three groups: (1) Plastic Haters (36.7%), (2) Origin-Conscious consumers (39.2%), and (3) Quality-Oriented consumers (24.1%). The biggest difference between the segments can be seen in the relevance of product attributes when evaluating the sustainability of the alternatives. For the Plastic Haters, the packaging material is of the utmost importance, as is the price. Whereas for the Origin-Conscious consumers, as the name already says, the origin is the most important aspect. Furthermore, they pay the most attention to the label. For the Quality-Oriented consumers, as the smallest group, material and origin are of the same importance, and they pay the least attention to price and label. Apart from the fact that the group of Plastic Haters assesses their own knowledge about the environment significantly worse than the members of group two, the consumer segments are very similar. They do not differ in terms of sociodemographic parameters and do not show any significant differences in their quiz answers or package usefulness ratings.
The image of packaging materials among Generations Y and Z in Germany largely corresponds to that of consumers in other countries [
8,
9,
11,
12]. Otto et al. [
7] show that the sustainability of glass is overestimated and that of plastic packaging is underestimated. Similar results are shown by Tobler et al. [
8], in whose study the environmental impact of packaging was generally overestimated and glass was given the most environmentally friendly rating, in contrast to the LCA results. When it comes to glass as a packaging material, it needs to be mentioned that the weight of glass packaging also affects the carbon footprint in transport [
34]. These results are confirmed in the present study, as the ecological assessment of the participants deviates from the data of the LCA, especially for the materials glass and plastic. The overestimation of the environmental impact of packaging in general can also be verified by looking at the quiz results. Furthermore, the scores show that the knowledge of the respondents about the environmental impact of specific product attributes is worse than they themselves estimated by the evaluation of the factor ‘knowledge about the environment’.
The research by Otto et al. [
7] also shows that the function of packaging and the associated protection against food waste are often not considered, which leads to very sustainable ratings of unpacked food. This finding can also be confirmed by the results of the usefulness evaluation in this study. With the help of practical data on food waste in Austrian retail, the Denkstatt Institute carried out an ecological evaluation of packaged and unpackaged cucumbers. According to this, the carbon footprint of the packed one is better if the waste rate of the unpackaged variant in retail and among consumers is more than six percent higher than the waste rate of the cucumber packed in plastic [
4]. It is important to emphasize that this calculation only refers to the carbon footprint and does not lead to a statement about which product is more sustainable. For an accurate sustainability assessment, not only one aspect but many can be used. But nevertheless, under certain circumstances, this packaging also has a benefit that was maybe not considered in the participants’ assessment as ‘not useful at all’.
4.1. Implications and Suggestions
The results of the present study show that consumers include the packaging material in a sustainable decision but have difficulties correctly assessing the environmental impact of the different materials. The sustainable choice corresponds mainly to what the respondents personally perceive as natural, appetizing, or ecological. In addition, consumers overestimate their own level of knowledge and do not act as environmentally conscious as their stated efforts would suggest.
The positive attitude towards environmental protection combined with concern for nature nevertheless indicates a willingness to act sustainably. One possibility why theoretical and actual actions differ could be that the information that is available to consumers is not suitable to support them in making sustainable purchasing decisions. Often, these are based on a variety of different evaluation methods that are hard to understand or cannot be comprehended at all. According to Tanner and Jungbluth [
35], this misbehavior is not only a problem of lack of information but also the result of built-in cognitive mechanisms that lead people to translate environmental knowledge in such a way that it can lead to an incorrect assessment of the environmental friendliness of a product.
In addition, Tanner and Jungbluth [
35], Otto et al. [
7], and Lindh et al. [
10] also see the need for guidance for consumers with the help of labels that enable them to make sustainable choices. As it is too complex to inform consumers about all environmentally friendly-relevant dimensions, Tobler et al. [
8] recommend simple communication tools as suggested in the domain of nutrition labels. For example, a three-level ecolabel system adapts the design of a traffic light system [
8]. The findings from this study, that all the labels investigated have a positive influence on choice behavior, hold potential for the development of new labels to assist consumers in making sustainable product choices.
4.2. Limitations
There are also limitations that need to be considered in this study. The sample is only representative of the German population for gender but not for age or employment. The average age of this study participants is lower than that of Generations Y and Z in Germany, and a large proportion of the respondents are students, which may also be the reason for the low available income of the sample. Future research should include more participants who are not university students. The gap between consumer perceptions of food product packaging material sustainability and life cycle assessment results might be even bigger if fewer students were surveyed. In addition, the participant’s choice of behavior is based on the request to make it as sustainable as possible. That is why the data from the choice experiment does not reflect the usual purchasing behavior. Possible conclusions for action are therefore aimed at consumers who are willing to make sustainable decisions.
Assessing the sustainability of products proves to be complex, which leads to a limited selection of sustainability indicators that must be questioned critically. The life cycle assessment results used in this study were carried out by the IFEU on behalf of SIG Combibloc Services AG, a provider of aseptic cardboard packaging. The data published by SIG only gives an overview of the results, not of the methods and materials used for data collection. Furthermore, no precise information about the packages is given, although the type and quantity of material are decisive for the environmental impact [
17]. Furthermore, a life cycle assessment is only one method of many to examine the environmental impact of products. Another possibility is the use of a utility value analysis, in which decision alternatives are compared with each other using weighted criteria [
36]. Ms. Waldner, an employee of the Hamburg Packaging Institute (BFSV), presented several utility value analyses. However, since these are based on internal company evaluation benchmarks and precise information on packaging and material composition is necessary, an additional evaluation of the packaging alternatives with this method was not possible [
37]. This once again makes clear how complex and individual the ecological assessment of different product characteristics is.
Another limitation of this study is that biodegradable packaging was not considered. This alternative to conventional plastic could evolve into a more environmentally friendly packaging alternative that has most of the useful characteristics of conventional plastic packaging without its negative impact on the environment [
38].
5. Conclusions
Sustainable consumption that protects the environment and preserves resources is becoming increasingly important, especially among the younger generations. As a result, packaging and the waste it creates are getting the focus of consumers and, in the saturated food market, also the marketing strategies of companies. Against this background, the present study investigated the relevance of different product attributes in the evaluation of the sustainability of durable food in Generations Y and Z in Germany.
The results of the conjoint analysis show the highest relative importance for the origin of the product and the material of the packaging, which are thus decisive factors for a sustainable purchase decision. The participants favored regional or German products packaged in glass or cardboard. Packaging made of plastic shows by far the lowest part-worth utilities and has a poor image.
Comparing the respondents’ evaluation to data from product lifecycle assessments, it becomes clear that the participants’ choice behavior is not as sustainable as intended. The existing willingness to act environmentally friendly suggests that there is a lack of suitable opportunities for consumers to evaluate packaging in an ecologically correct way rather than according to personal impressions.
The development of transparent, universally valid evaluation schemes is therefore of great importance. As is the translation of these into communication tools that help consumers who want to make a sustainable choice. Further research needs to be conducted to investigate whether these tools will be accepted and deliver the desired results.


