Article

Analysis of Equivalent CO2 Emissions of the Irrigation System—A Case Study

by
Daniel Benalcázar-Murillo
1,
Silvia Vilcekova
2 and
Miguel Ángel Pardo
1,*
1
Department of Civil Engineering, University of Alicante, Carretera de San Vicent del Raspeig s/n, 03690 Alicante, Spain
2
Institute of Sustainable and Circular Construction, Faculty of Civil Engineering, Technical University of Košice, Vysokoškolská 4, 04200 Košice, Slovakia
*
Author to whom correspondence should be addressed.
Sustainability 2023, 15(23), 16240; https://doi.org/10.3390/su152316240
Submission received: 25 October 2023 / Revised: 15 November 2023 / Accepted: 18 November 2023 / Published: 23 November 2023

Abstract

:
This work aims to assess the emissions related to the useful life of the irrigation network on the campus of the University of Alicante (Spain). A life cycle assessment has been developed employing the One Click LCA software to calculate material proportion, repair rate, energy consumption, water volume, transport, and irrigation surface. This has been used in a real pressurised irrigation network, such as the one at the University of Alicante delivering water to the grass. Two potential cases which consider the pipelines made of polyvinyl chloride (variant 1) and high-density polyethene (variant 2) have also been analysed. Energy consumption had the most influence on emissions discharges (42%), followed by materials (37%) and repairs (18%) in the current water irrigation network. Variant 1 shows higher emissions produced in network materials (47%), energy consumption (27%), and repairs (24%). Variant 2 has high emissions because of energy consumption (47%), materials manufacturing and transport (34%), and repairs (17%). It has been determined that a network of disposed polyethene pipes will reduce the total Global Warming Potential emitted into the atmosphere. Materials (127.9 Tn CO2e) and energy (145.5 Tn CO2e) are the stages where the highest Global Warming Potential is produced. Other stages that also stand out are repairs (62 Tn CO2e), construction (6.3 Tn CO2e), and transport of materials (3.5 Tn CO2e). Renewable energy sources could reduce energy consumption. Variant 2 has 11% lower emissions than the current network (variant 0), making it a workable choice for infrastructure design.

1. Introduction

The continual use of resources and ongoing urban expansion leads to pollution and disrupts the environmental equilibrium. The construction industry and its supply chains manage resource allocation and energy use, leading to a steady escalation in greenhouse gas (GHG) emissions. The European Commission has set it as one of its fundamental objectives, reducing GHG with strategies for the economic, industrial, and social transition by 2050. The European Union published the document titled “Pathways for the transition to a net-zero greenhouse gas emissions economy and strategic priorities” [1]. This report highlights Europe’s heavy reliance on oil and gas, which accounted for 55% of its energy demand in 2018. It also proposes a strategic policy to maximize renewable energy sources and promoting adoption of electricity to achieve complete decarbonization of Europe’s energy supply. On a global scale, emissions are produced from industrial activities (35%) [2,3], and agriculture (15–20%) [4,5]. Industry accounts for 20% of emissions in Spain, road traffic 25%, and agriculture and livestock 15%. In recent years, there has been a notable advancement in environmental research focused on buildings and their surroundings, targeting environmental concerns. It aims to reduce energy consumption and carbon emissions because of the environmental impact of the construction industry. Construction accounts for up to 39% of total CO2 emissions into the environment and around 35% of the total landfill waste stream [6]. Therefore, in Central Europe, a need to move towards an effective waste hierarchy, progressing from recycling to waste prevention and the reuse of products and components. Life Cycle Assessment (LCA) is a systematic and comprehensive method for evaluating the environmental impacts of a product, process, or service throughout its entire life cycle [7,8]. The life cycle considers the extraction of raw materials, production, transportation, use, and end-of-life disposal or recycling. LCAs include (i) defining the objectives of the assessment and the boundaries of the system, (ii) compiling a detailed inventory of all inputs (e.g., raw materials, energy) and outputs (e.g., emissions, waste) associated with each stage of the product’s life cycle, (iii) assessing the potential environmental impacts of the inputs and outputs, and (iv) interpreting the results of the life cycle inventory and impact assessment to draw conclusions and identify areas for improvement. The LCA approach is employed to delve deeper into the environmental impact of buildings and the built environment. It examines various aspects such as the environment, energy consumption, waste disposal, and the associated environmental consequences when buildings reach the end of their useful life. This approach serves as a valuable tool for identifying areas of improvement to reduce GHG emissions. By considering different shapes, window sizes, or orientations, we can make improvements in building design [9]. The impact of improving buildings to achieve higher energy standards is evaluated in terms of life cycle [10,11,12,13]. Many studies focus on assessing different material options in buildings [14,15]. Kazemi and Zardari, (2020) [16] show that materials have an important influence on Global Warming Potential (GWP). A different approach was taken with the primary emphasis of the study being on the life span of the building [17]. The next study [18] is centred on the recycling potential of building material at the end of the building’s life cycle. Some studies focus on one building and its embodied energy [19], while others compare representative building types for a region [20]. Most studies point to the share of life cycle phases on the equivalent amount of CO2 emissions. Targeting life stages with high emissions, the goal is to reduce global GHG emissions. Transportation by traffic road produces the largest emissions [21,22], materials including manufacturing and processing (81%) [23], and installation, considering the layout of the structure [24,25] and considering recycling materials [26,27], being a workable choice for diminishing emissions produced in this life stage (22–58% reduction) [28]. So, this highlights how important these stages are in the life cycle analysis of any infrastructure. The landscape character assessment is a helpful tool in landscape planning and policy management [29]. It encompasses both environmental and societal initiatives, making it applicable in a wide range of contexts. The study by Nguyen et al. (2017) [26] presents an LCA model that evaluates the trade-offs and synergies between intensification and carbon-sequestering conservation measures in annual crop production landscapes to assess local climate mitigation potential. The development of the Swiss Agricultural Life Cycle Assessment (SALCA) as an LCA tool to estimate and compare the impacts of specific land uses and management options is introduced [30]. Recently, LCA has also been used to quantify the environmental impacts of engineering constructions and networks. In addition to the creation of GHG emissions, irrigation is a major consumer of water and energy in southwestern Europe [31,32,33].
The primary sources of greenhouse gas emissions by the economic sector in the United States are transportation (29%), industry (30%), commercial and residential (30%), and agriculture (11%) [34]. Other approaches have showed the potential to elevate this figure by as much as 20% [35], while others have reported comparable findings (10%) [36] on a global scale.
Emissions stemming from energy activities associated with irrigation, which encompass activities like water pumping and conveyance, constitute a substantial share, ranging from 50% to 70%, of the overall emissions originating from energy-related activities within the agriculture sector [37]. Soil use and crop types, traditional or modern [38], condition the irrigation (sprinklers, flooding, etc.) and the machinery used. The life cycle analysis of an irrigation network is a common approach used to compare different irrigation methods. For example, using smart sprinklers reduces 38% of water and energy consumption [39,40]. Similarly, systems based on decision support systems (DSSs) have shown a 42% reduction in resource usage [36]. Using reclaimed water reduces freshwater consumption, energy usage, and fertilizer needs, leading to a 23.8% decrease in emissions [41,42]. Some other techniques for measuring GHGs in agriculture are chamber-based techniques (open and closed) [43] and irrigation management practices (flood irrigation versus drip and sprinkler irrigation) also influence the GHG emissions as the rate of CO2 increases under low irrigation [44]. Based on a review of research papers focusing on LCAs, it can be concluded that a lack of studies focused on the analysis of environmental impacts during the life cycle of irrigation systems. Therefore, the primary outcome of this study involves evaluating the CO2 equivalent emissions for the selected irrigation system and pipe materials. The University of Alicante’s irrigation network was selected for developing this study. Using GWP, carbon dioxide equivalent (CO2-e) emissions can be quantified within cradle-to-gate and cradle-to-grave boundaries over a 25-year period. The study outlines the analysis, data collection, methodologies, software, results, and interpretation. Furthermore, the aim is to answer a series of questions: the stage in the system’s life that produces the most emissions (I), the proportion between the different life stages (II), the decisions and policies to be adopted to reduce emissions (III), the influence of the different materials in the useful life of the infrastructure (IV), and the emissions derived from its manufacture and commissioning (V). The analysis yielded essential data to make environmental decisions about the infrastructure, and to evaluate the system’s operability about water, energy, and carbon flow [45]. It can also be utilised in research quantifying the emissions of the life cycles of these networks or any considered infrastructure. The method described can be exported to other locations, with few limitations in its universal application. However, as seen, most of the parameters are imposed by the geographical location of the installation, and we can change a few.
This study determined the data and software necessary to analyse equivalent CO2 emissions. After obtaining the results, a general summary of the calculations performed is made. An analysis of the irrigation network findings from the University of Alicante is conducted and compared with earlier research. Finally, a series of conclusions are obtained that respond to the questions asked.

2. Materials and Methods

Life Cycle Assessment (LCA) is used to figure out the CO2 emissions from the University of Alicante’s irrigation network. LCA comprises four basic steps: goal and scope, inventory analysis, impact assessment, and interpretation of results.

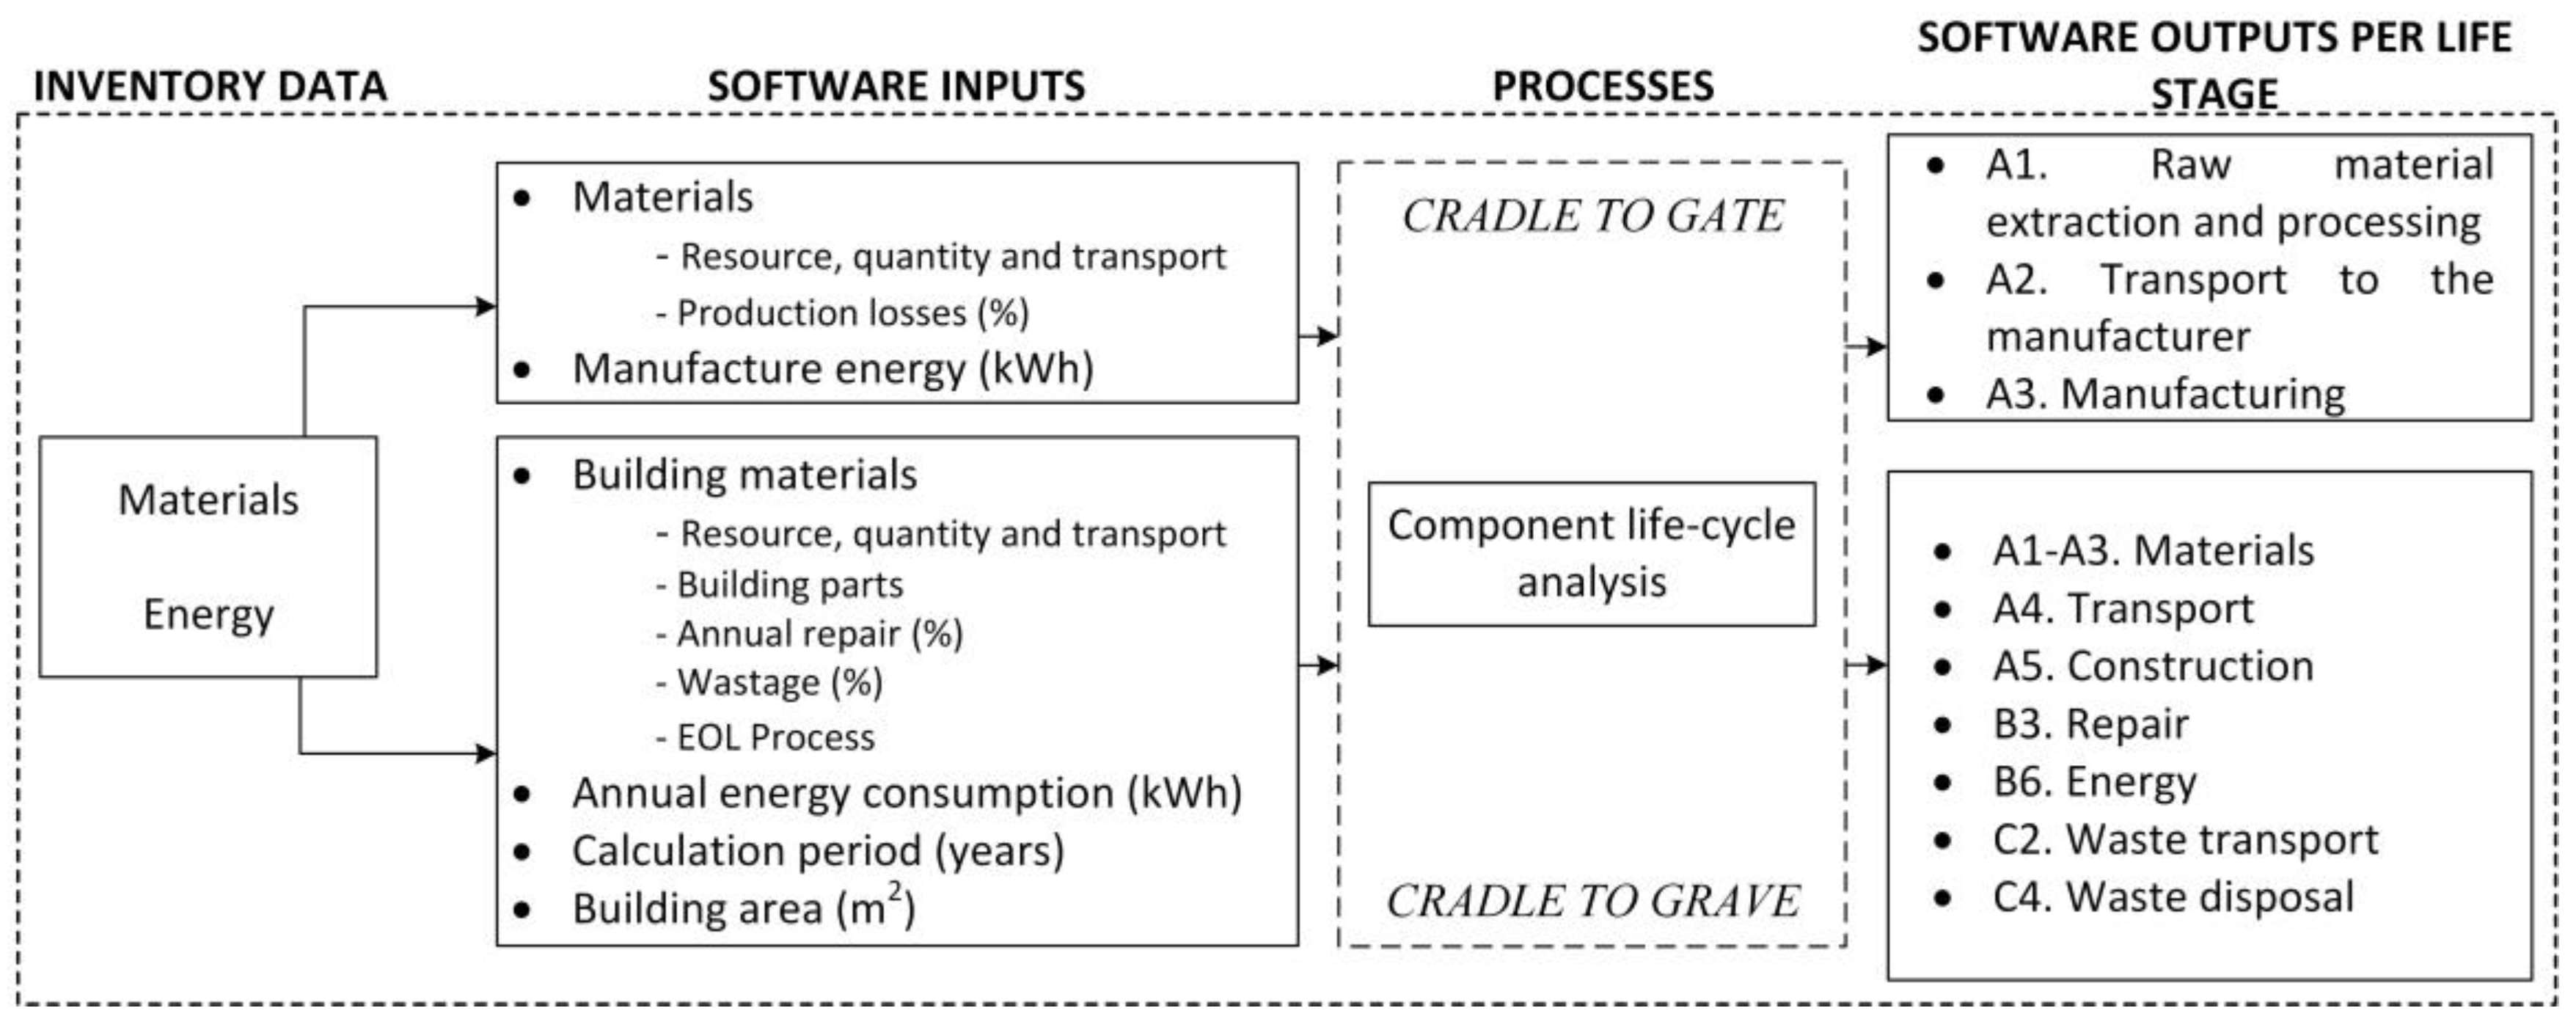
2.1. Inventory Analysis

The data needed for quantifying the carbon footprint follow the process in Figure 1.
Data collection is a determination of the materials’ mass and their characteristics. The first analysis (“cradle-to-gate”) considers raw materials extraction (A1), their transport to the factory (A2), and their manufacture (A3). The second analysis (“cradle-to-grave”) includes the product stage (A1–A3), transport to the construction point (A4), and installation (A5). Other stages included are related to the operation, such as repairs (B3) and energy consumption (B6). Finally, it includes the stages after the useful life of the infrastructure, such as waste transportation (C2) and disposal (C4).

2.2. Life Cycle Impact Assessment

Software One Click LCA was selected for determining CO2e emissions. The GWP of the life cycle of civil works comes from environmental product declarations and meets requirements stated by ISO 14025 [46] standard. The One Click LCA software provides environmental impact data according to quality standards, which can help reduce costs [47]. In pursuit of this objective, five rationalization methodologies are implemented, as elucidated [48]. These methodologies encompass excluding specific life cycle stages, processes, or impact categories, thereby streamlining the analysis. Furthermore, they involve substituting conventional inventory data with quality assessments of outcomes or quantified information, enhancing the precision of the evaluation. Additionally, methodological standardisation is implemented through adopting established assessment tools and standards, ensuring consistency in the analytical process. Finally, automation plays a pivotal role in this endeavour, as life cycle analyses are conducted with the assistance of software that seamlessly integrates essential product information, thereby enhancing efficiency and accuracy in the assessment process [48]. It also reports the GHG emissions produced throughout the life of the infrastructure.
Calculating Life Cycle Assessment (LCA) analysis following the normative ISO 21930 [49], ISO 14021 [50], ISO 14025 [46], EN 15804 [51], and EN 15978 [52] is important for many reasons:
  • Standardisation. These ISO and EN norms provide a standardised framework for conducting LCA, ensuring consistency and comparability of results across different products, processes, or services. Adhering to these standards allows for meaningful and accurate comparisons between different life cycle stages and different products or systems.
  • Environmental Performance Evaluation: LCA analysis helps evaluate the environmental performance of products, processes, or services throughout their entire life cycle.
  • Product Improvement: LCA analysis helps find areas for product or process improvement. By quantifying the environmental effects and identifying the principal contributors, it becomes easier to target specific areas for optimization, such as material selection, production processes, packaging, transportation, and end-of-life management. This leads to more sustainable design choices and helps drive continuous improvement.
  • Communication and Transparency: The ISO and EN norms provide guidelines for preparing Environmental Product Declarations (EPDs) and Environmental Product Information (EPI), which enhance transparency and ease communication of environmental performance with stakeholders.
  • Regulatory Compliance: Following these norms ensures compliance with international standards and regulations for LCA and environmental labelling.
  • International Acceptance: ISO and EN norms are recognised and accepted standards for LCA analysis. By adhering to these norms, LCA results are more likely to be accepted and understood by stakeholders worldwide, including customers, investors, government agencies, and environmental organizations. It enhances the credibility of your analysis and allows for meaningful comparisons across regions and industries.
Adhering to the normative ISO 21930 [49], ISO 14021 [50], ISO 14025 [46], EN 15804 [51], and EN 15978 [52] when conducting LCA analysis ensures standardisation, enables comprehensive environmental performance evaluation, facilitates product and process improvement, enhances communication and transparency, supports regulatory compliance, and ensures international acceptance and credibility of LCA results.
Global Warming Potential (GWP) expressed per declared unit (kg CO2e/DU) and energy rating meet the requirements according to EN 15804 [51], ISO 14021 [50] and ISO 21930 [49]. A second result refers to the same parameter, GWP expressed per functional unit (kg CO2e/FU) and energy rating, but following the EN 15978 [52] standard. The primary goal is to consider the entire infrastructure and its operation until the end of its life, 25 years. This concept includes a “cradle-to-grave” system boundary and for this One Click LCA Levels are used.

3. Case Study

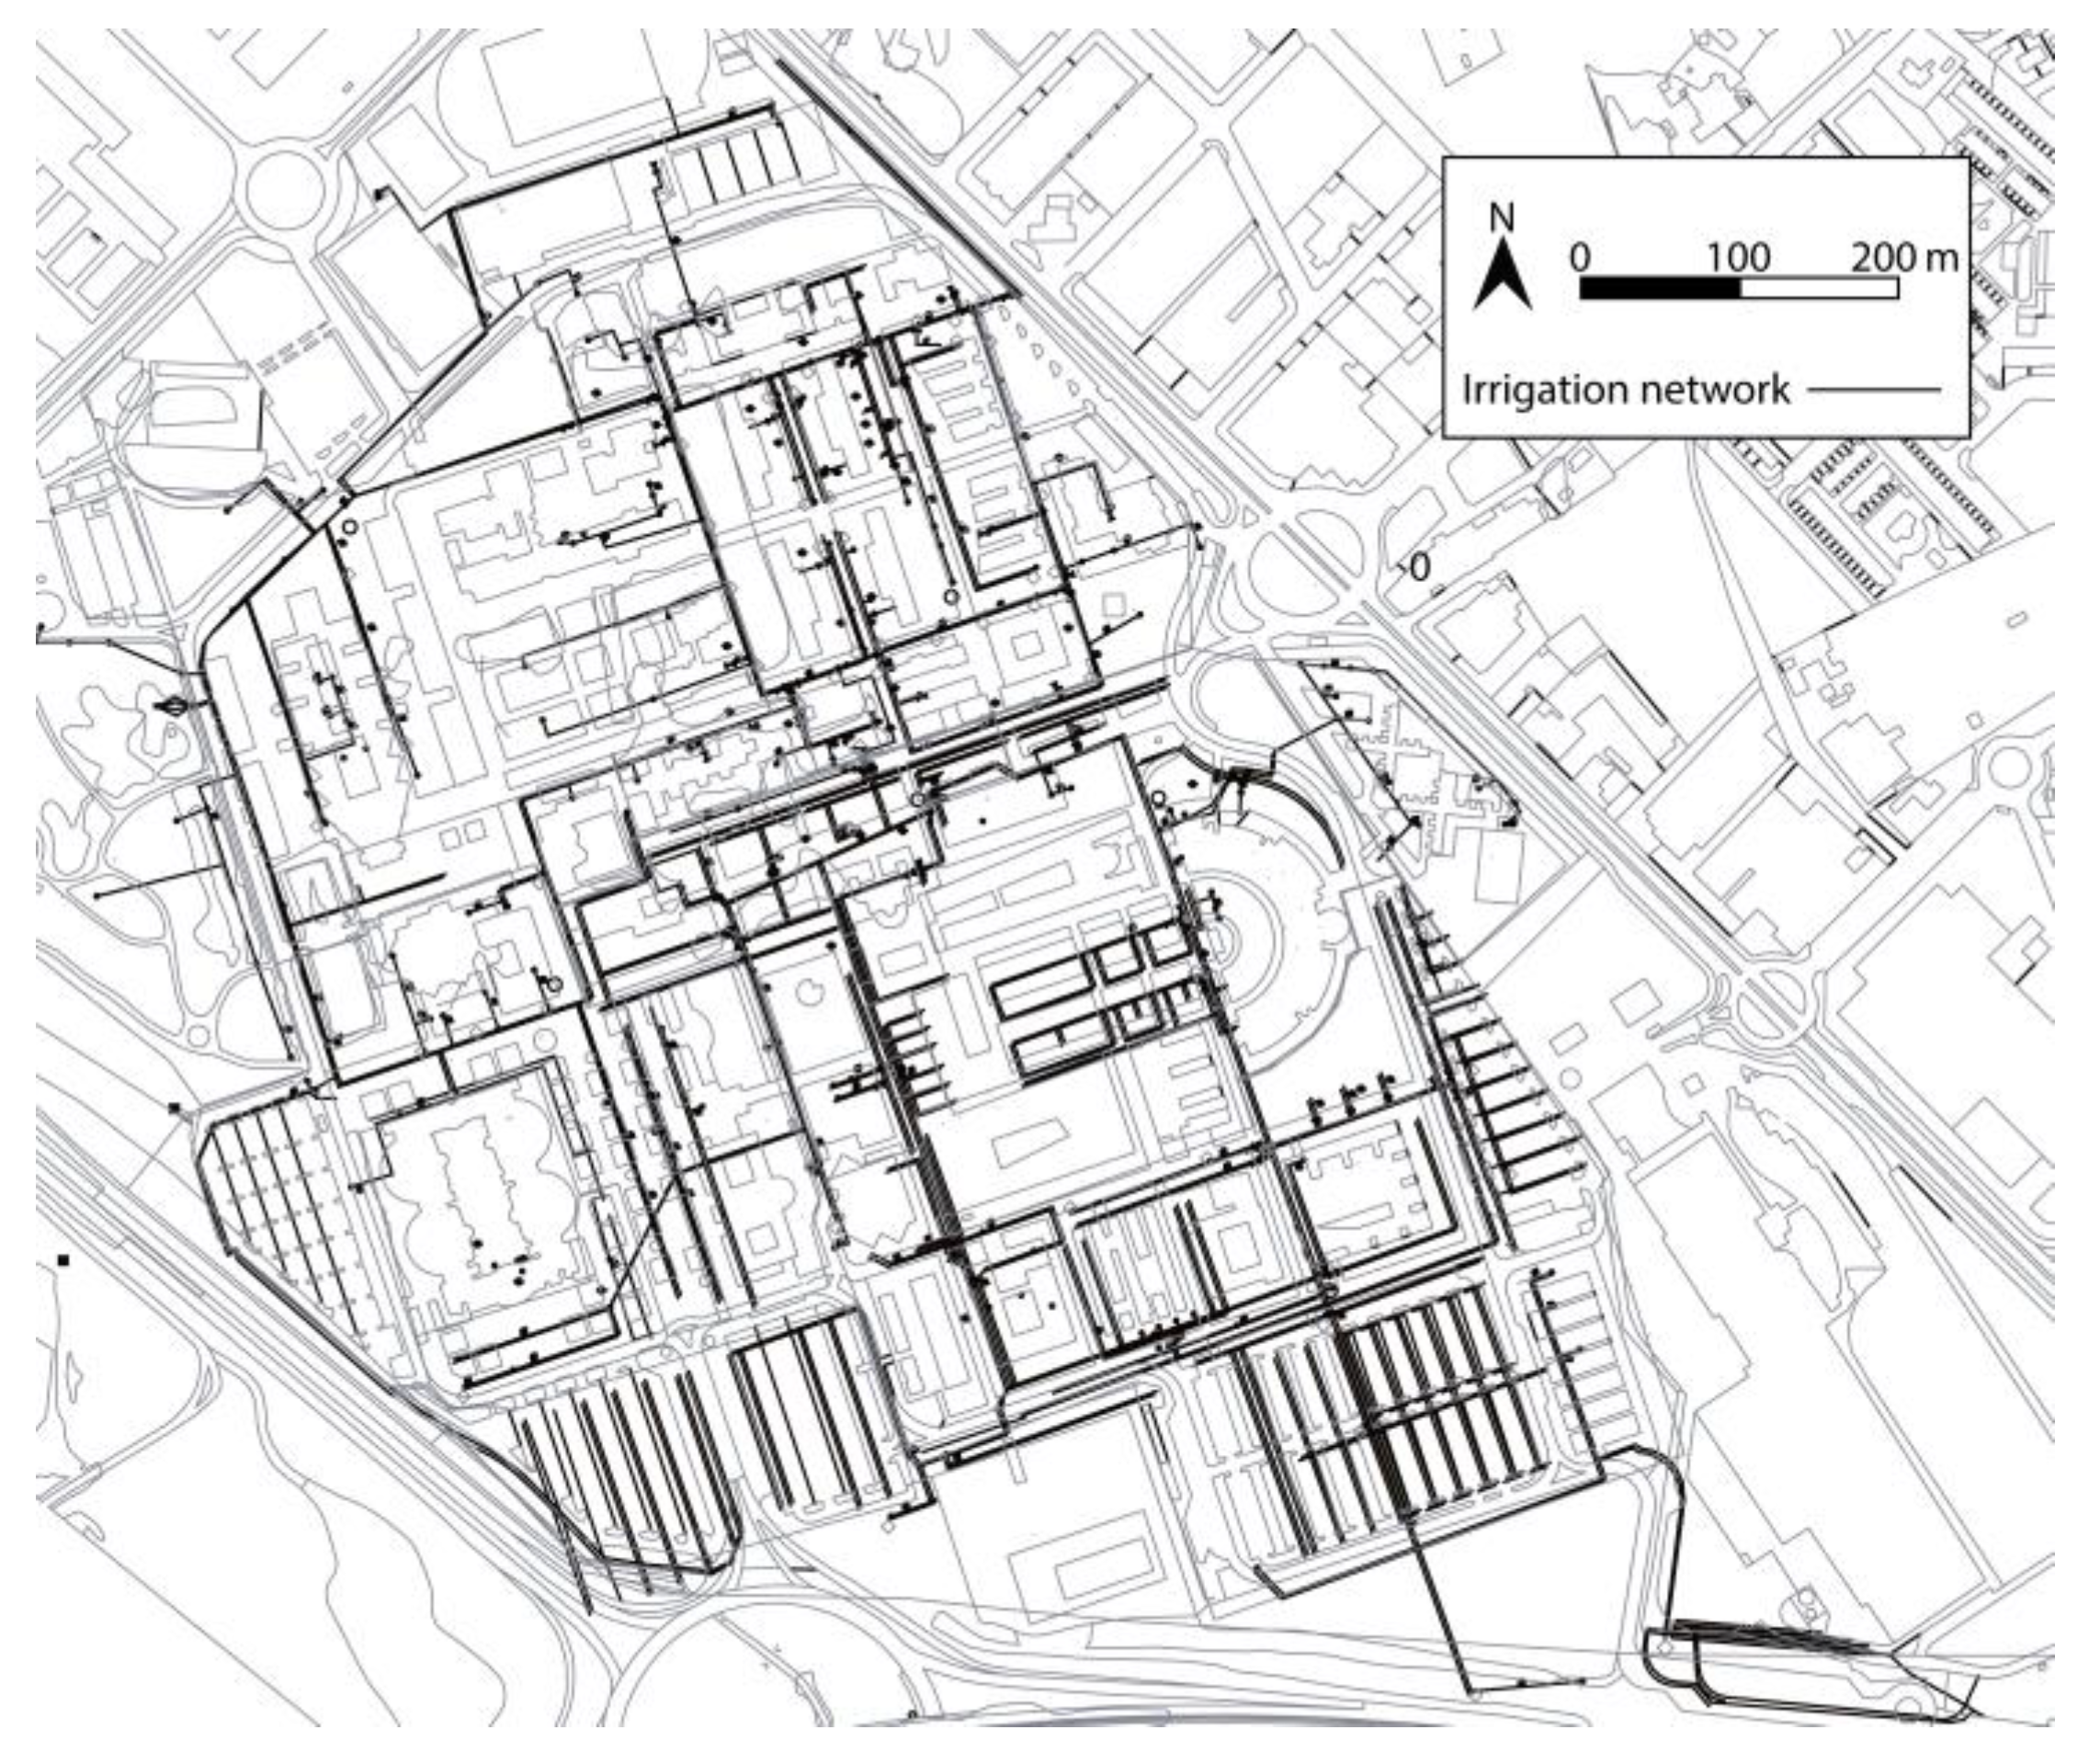
3.1. Irrigation Network of the University of Alicante

The chosen site for the case study is within the premises of the University of Alicante, in the municipality of San Vicente del Raspeig, Alicante (Spain) (38°23′4.06″ N, 0°30′44.06″ W). This site was chosen because of higher energy/water usage and GHG emissions [53]. About 40.86% (329,271 m2) of the total land area of the university is covered by green spaces, irrigated with brackish water from the underlying aquifer [54], on which a reverse osmosis desalination treatment is performed because of its high salinity [55,56]. Desalinated water is discharged into a regulation lake. This lake is used to irrigate the university’s parks and gardens. The irrigation network distributes water through sprinkling and drip irrigation to vegetation. The irrigation network comprises a looped system (Figure 2) that spans the entire length of the campus, extending from the regulation lake to the southeast end of the University.
The network spans 23 km and comprises 70% polyvinyl chloride (PVC) pipes and the remaining 30% of asbestos cement pipes. The university’s network still uses asbestos cement pipes, even without upkeep or renovation. PVC was chosen for the irrigation network in new areas because of its minimal environmental and human effects.

3.2. Actual Data in the Network

GHG emissions from the university’s irrigation network have been calculated (Table 1). Most are generated from its manufacture and transport [57]. Materials and quantities have been provided by the University of Alicante. Following this way, real quantities and annual energy consumption are known.
Note there is no repair percentage for asbestos cement material, as replaced by PVC if any faults. PVC material is brought from Gaillon, France, and high-density polyethene (HDPE) is brought from L’Hospitalet de Llobregat, Barcelona. From their factories, the material is transported to be installed at the University of Alicante.

3.3. Variants

The study aims to focus on the analysis of the CO2e emissions produced during the life cycle of the current irrigation network. Two variants with different materials are compared to the current network. So, it is possible to obtain which materials are more suitable in terms of CO2e emissions. The three variants studied are:
  • Variant 0. The current irrigation network comprises PVC (70% of the network) and asbestos cement (the remaining 30%).
  • Variant 1. The irrigation network is made of PVC.
  • Variant 2. The irrigation network is composed of HDPE.

4. Results

4.1. Variants

The One Click LCA software gives two main results: total greenhouse gas emissions from the construction and demolition of the infrastructure, and embodied carbon emissions. The first quantifies GWP emitted throughout the infrastructure’s construction and demolition, which encompasses the entire supply chain of materials, from manufacturing to end-of-life. The second is calculated by dividing the emissions per unit of surface area, providing an energy rating based on the total GWP per functional unit emitted.
The above-mentioned standards present several impact category indicators, such as ozone depletion potential (ODP), acidification potential (AP), eutrophication potential (EP), photochemical ozone creation potential (POCP), and others. In this study, our emphasis centred on the GWP indicator in connection with the European Green Deal goals and the European climate law. The latter sets the goal of reducing net greenhouse gas emissions by at least 55% by 2030 compared to 1990 levels [58]. Thus, the GWP indicator is the primary focus of our study.

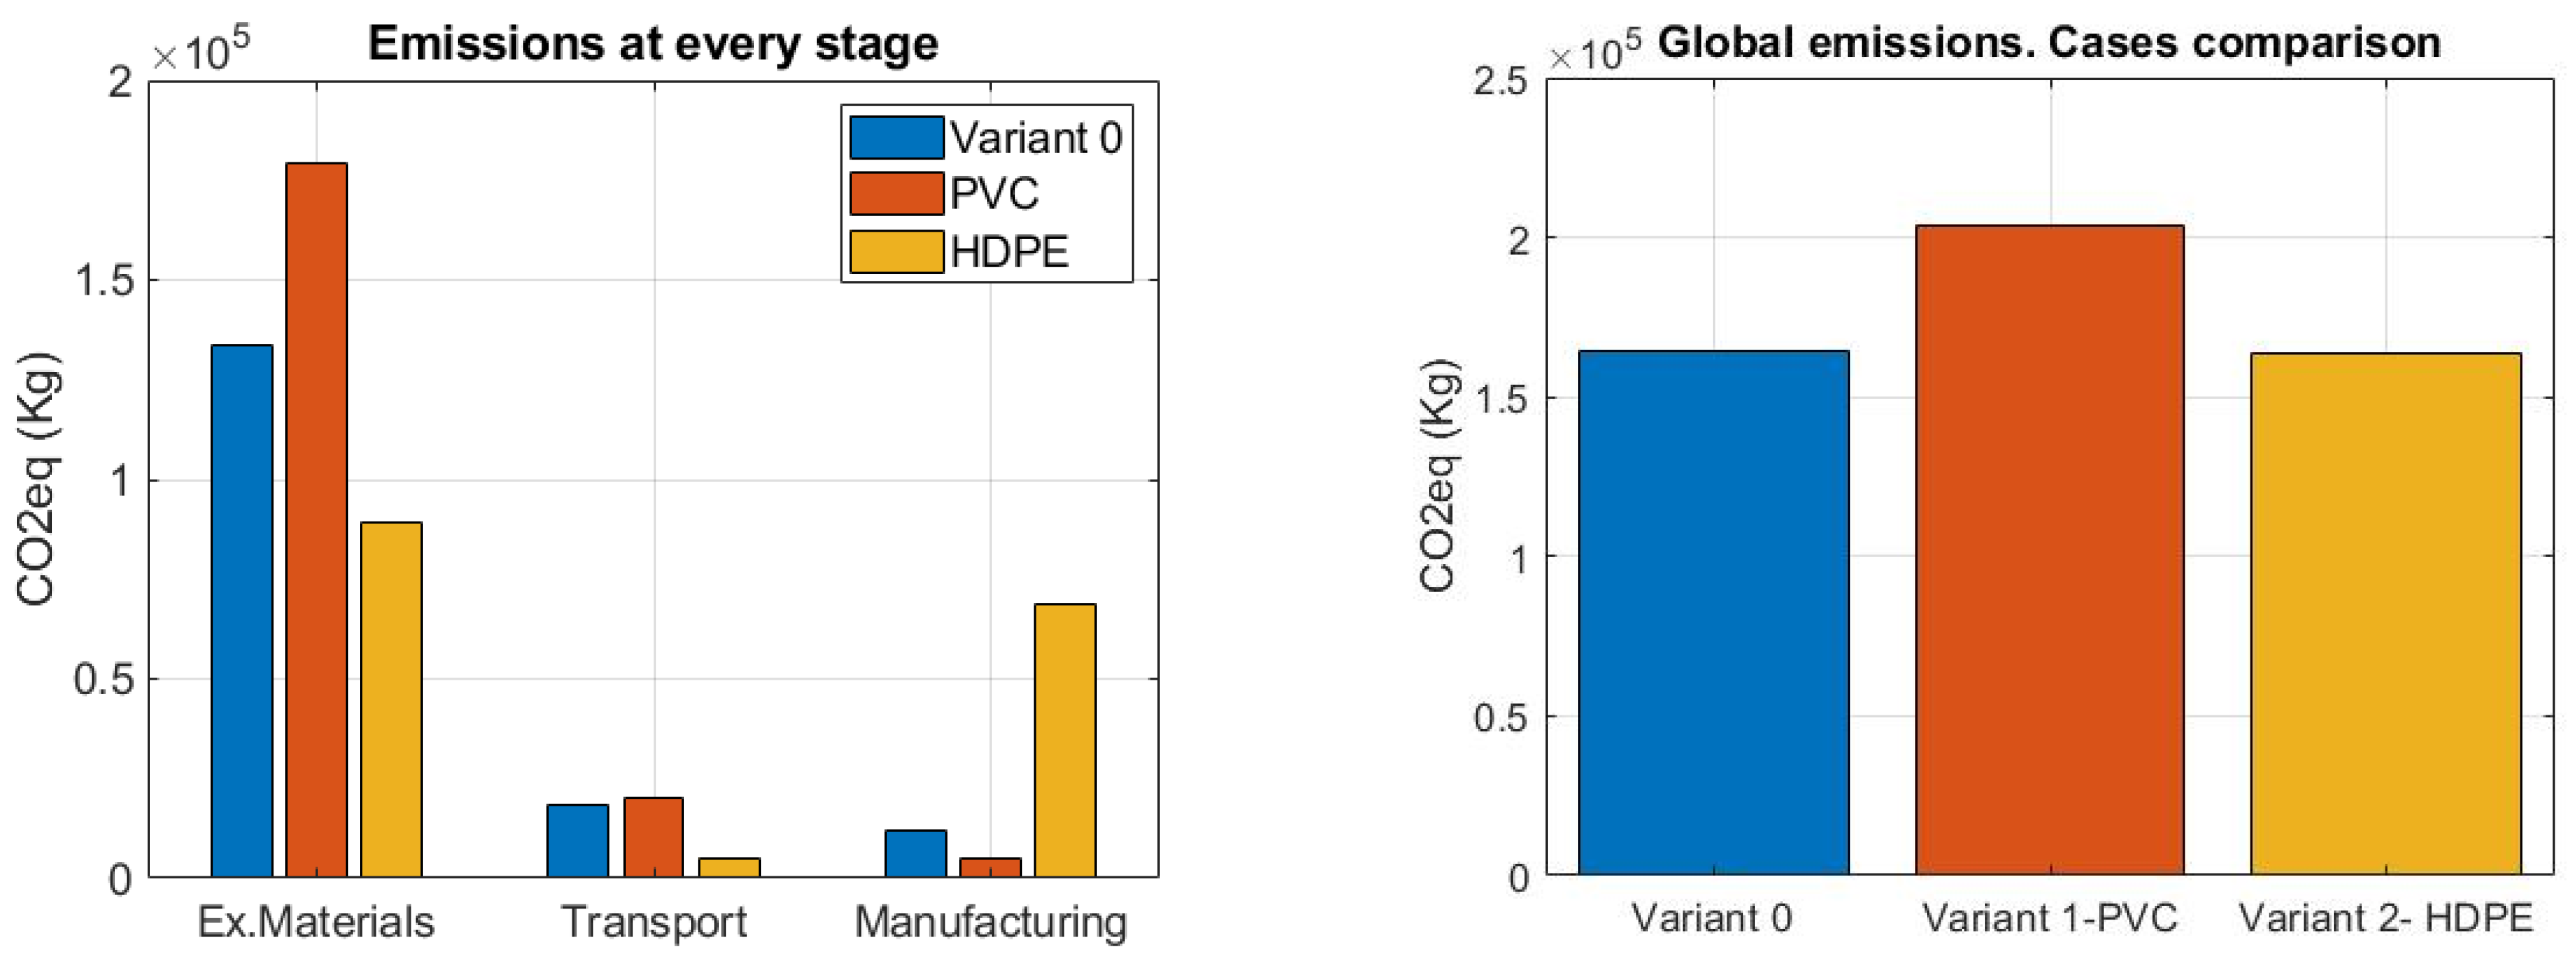
4.2. The Impact of Products on GWP within “Cradle-to-Gate” Analysis

In the following, the goal is to find how the material affects emissions (kg CO2e) within the “cradle-to-gate” system boundary for the three defined variants. The results are presented in Table 2.
The irrigation network comprises sections with different diameters. To take into account the emissions associated with each diameter, the total lengths for each diameter shall be entered. Emissions based on diameter, production process, material, and energy consumption shall be considered. Recording pipe lengths can make sure emissions calculations consider different diameters. Emissions vary with the material used and manufacturing processes.
The data show that raw material extraction (A1) is the process with the greatest influence on the GHG emissions of the product used. PVC and HDPE have different impacts on manufacturing processes, even though they are both petroleum products. This A1 module is the largest contributor to emissions (80–55%) for the variants analysed. Variant 2 (HDPE) involves a higher energy consumption and higher CO2e emissions during the pipe manufacturing phase (A3, 42.2%). The comparison of the results for the total values of CO2e is shown in Figure 3.

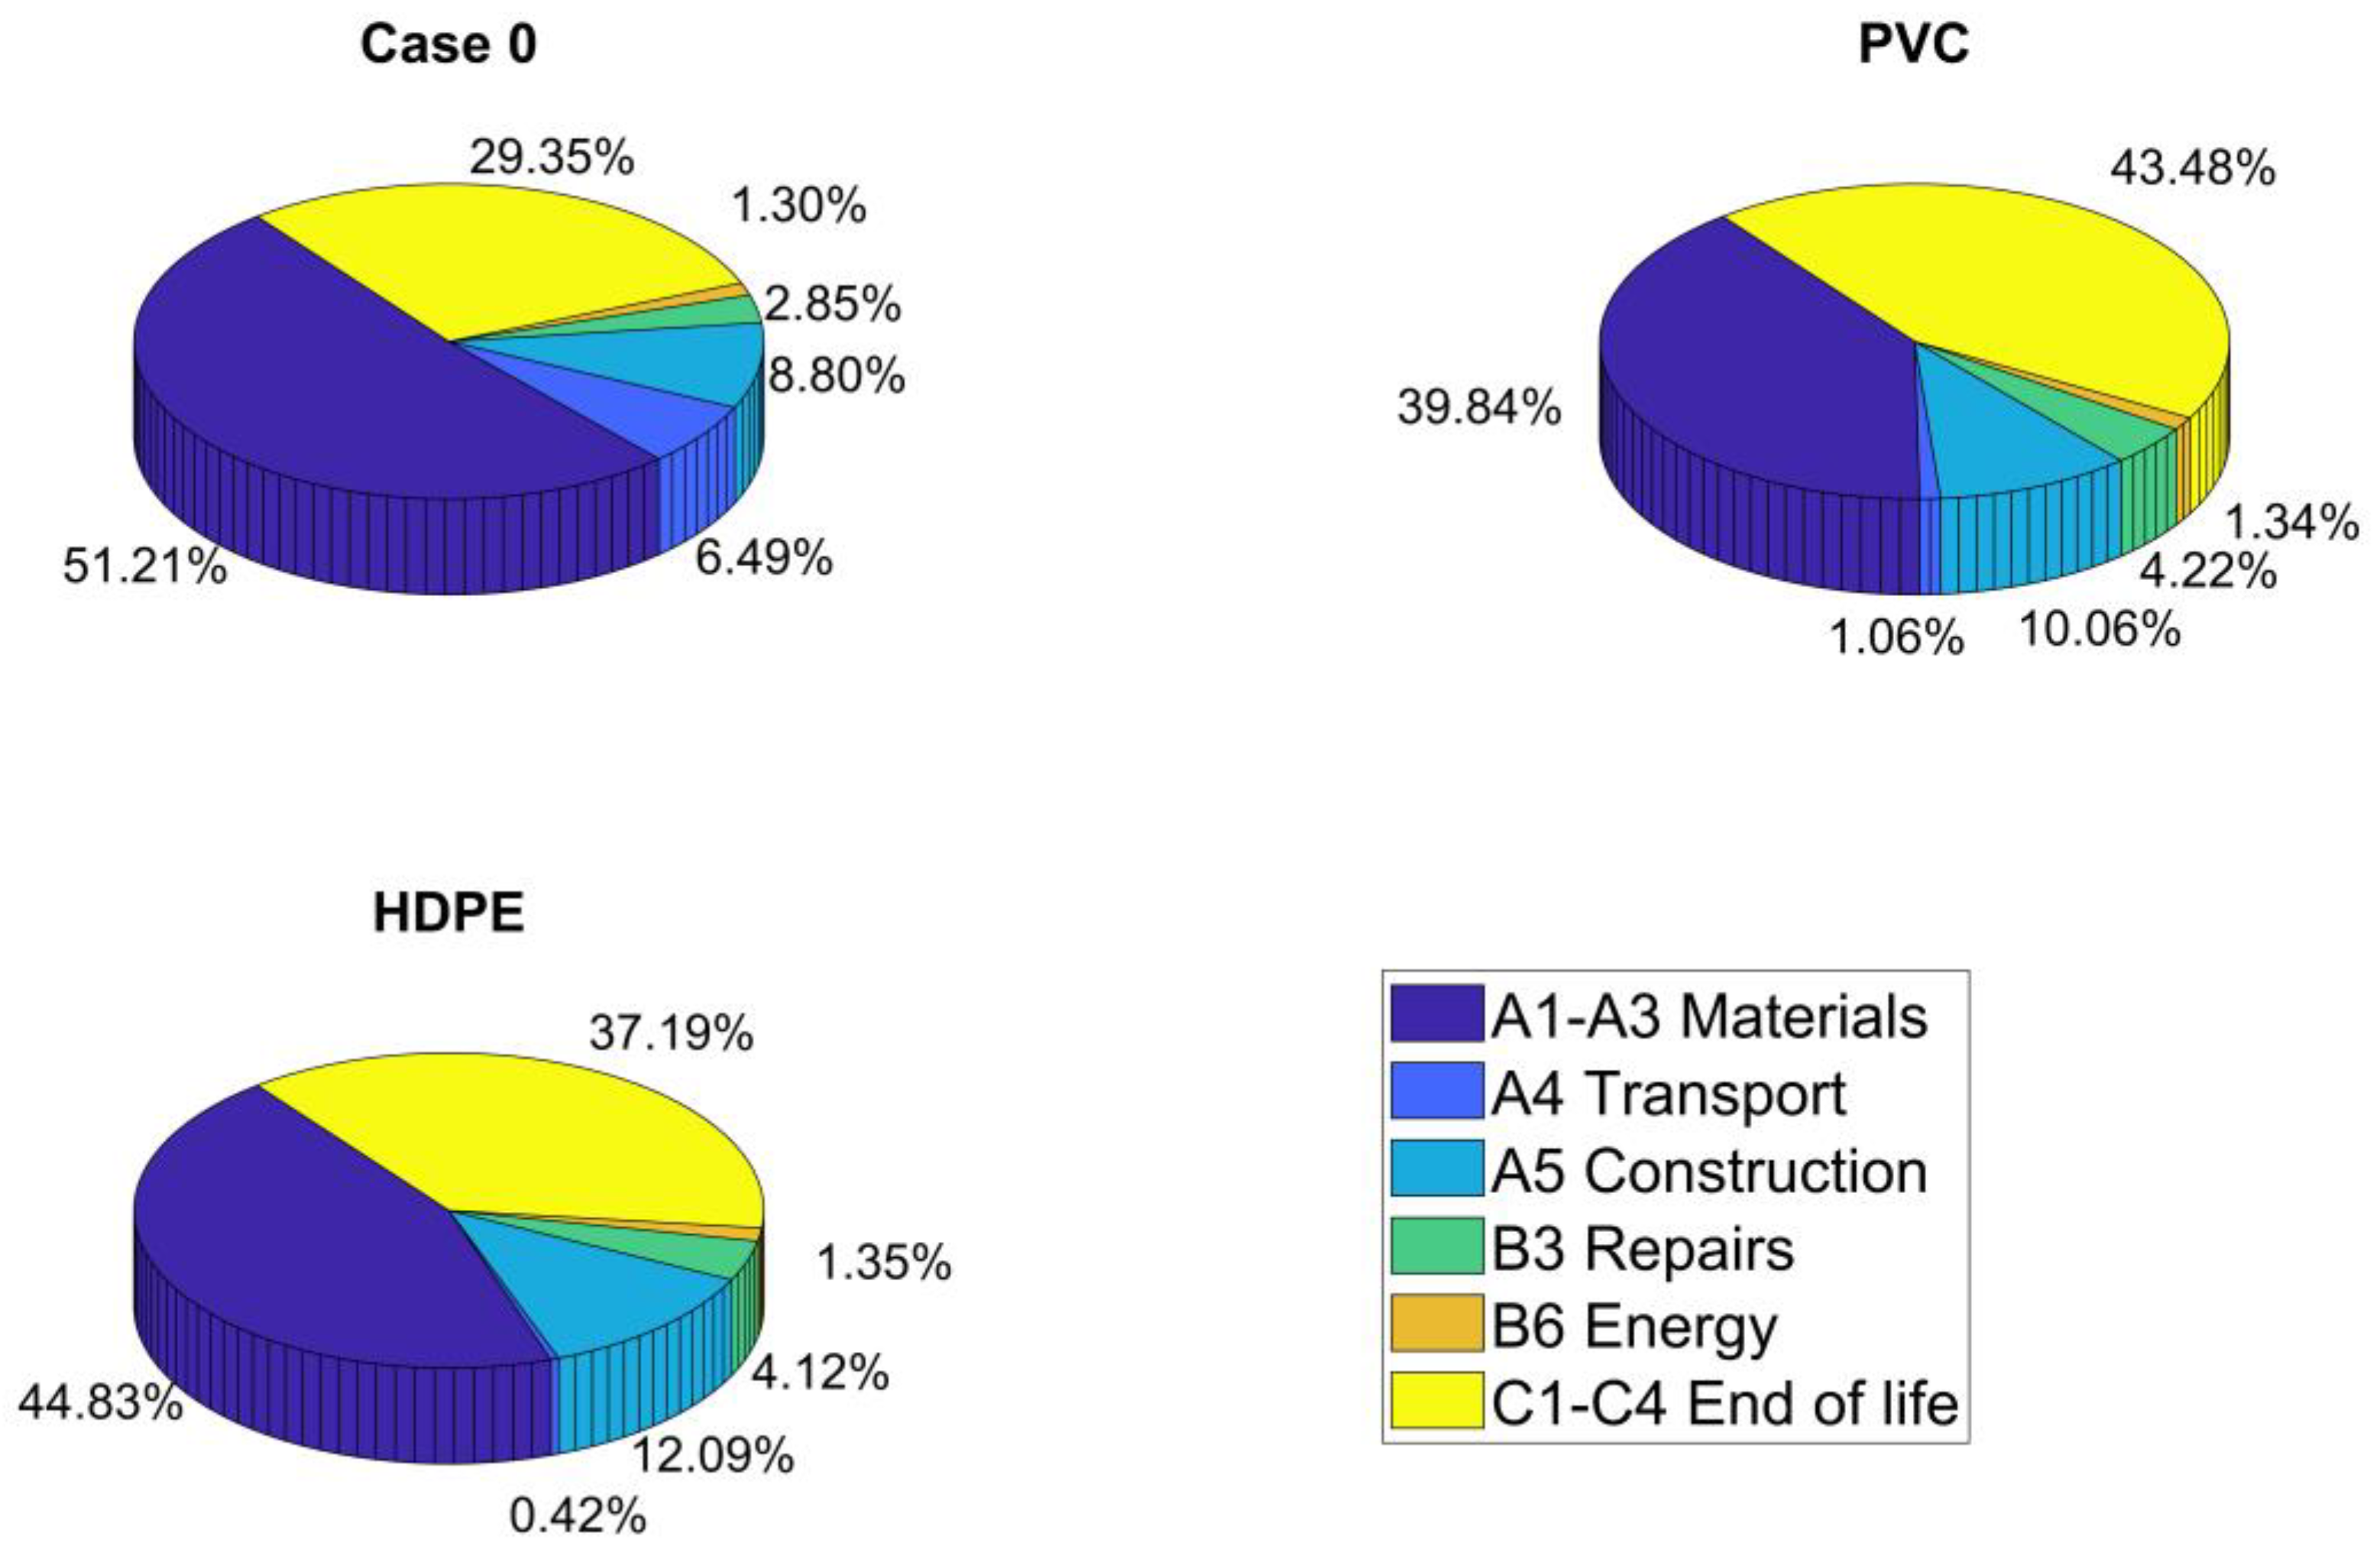
4.3. The Impact of Products on GWP within “Cradle-to-Grave” Analysis

The analysed variants in terms of materials for the “cradle-to-grave” system boundary expressed in kg CO2e are summarised in Table 3. In the table, the results are broken down for a reference service life of 25 years.
The results presented in Table 3 are discussed for the different variants:
  • Variant 0. In the current irrigation network, the stages corresponding to products (A1–A3) and energy consumption (B6) have a significant influence on overall emissions (37% and 42%). The GWP of transport (A4, 1%), construction (A5, 2%) and end-of-life (C2, C4; 0%) is reduced as they are stages that occur at specific times, causing environmental impacts only once during the life cycle.
  • Variant 1. Network repairs produce high emissions (24%), while energy consumption has a 27% contribution. However, the influence of the network materials (A1–A3) is the highest in this variant (47%), being this life stage as the principal contributor to GWP.
  • Variant 2. The stages in the life cycle that contribute the most to high GHG emissions are energy consumption (47%), materials manufacturing and transport (34%), and repairs (17%). Energy consumption is consistent across all variants, but the second variant has the highest emission ratio.
Even though PVC and HDPE are materials derived from petroleum, the results show that the effect of repairs on the pipe shows a significant difference between the two materials. The emissions of PVC (129,343.9 kg CO2e) are 2.5 times higher than those produced by HDPE (51,969.9 kg CO2e). In every variant, energy consumption remains unchanged despite having different percentage contributions.
As a summary, the overall infrastructure data for the 25-year analysis is Figure 4.

4.4. Sensitivity Analysis

Under ISO 14044, a sensitivity analysis is imperative for evaluating results and conclusion reliability. The primary aim of this analysis is to ascertain the extent to which uncertainties in data and allocation methods, among other factors, impact the results and conclusions. It is strongly advised to conduct sensitivity analysis for variations in input raw materials, including secondary materials, alterations in transportation distances, modifications in the production process, changes in energy mix, and adjustments in end-of-life scenarios [57].
This study examined how the pipes would be affected by a 10% increase in length. Table 4 points out that, within the system boundary ‘cradle-to-grave,’ the percentage reduction in GWP for module A1 amounts to 6.81%, 3.48%, and 6.31% for variants 0, 1, and 2, respectively.
Expanding the irrigation network by 10% allows for more plots to be irrigated on campus. The extension has the potential to make the network more efficient and cover more areas for irrigation. Variant 1 has a higher environmental impact in terms of Global Warming Potential (GWP) for module A1 compared to other variants. Variant 1 has higher emissions in the A1–A3 module, as shown in Table 3. This is because of the material supply aspect (A1), which has higher values (Table 2).

5. Discussion

Upon scrutinizing around 200 articles, only a select few were found suitable to include in the discussion section. Most of these articles centre their attention on Life Cycle Assessment (LCA) concerning building materials and complete structures, spanning diverse categories like residential and commercial buildings. Their primary focus revolves around the attributes of materials and various phases of the life cycle. This research, however, distinguishes itself by delving into the intricacies of the irrigation system, a subject relatively unexplored in existing literature. Hence, it is apt to regard this study as a valuable contribution and a pioneering pilot investigation in this specific domain.
This study determines the CO2e emissions produced in an irrigation network and irrigated fields. The network produced 37% of GHGs from the irrigation system, besides those produced by the existing vegetation. It has been determined that a network comprising HDPE pipes (variant 2) was found to have lower total GWPs emitted into the atmosphere. This conclusion has also been reached in the study [59]. HDPE accounts for 68% of the PVC material’s carbon emissions (215 kgCO2e/m out of 315 kgCO2e/m) when considering production, transport, and installation (Table 5). In this study, the transport emissions (A2) are like the actual irrigation network (variant 0) and the PVC and HDPE variants are exposed. The distance varied depending on the case in the study by [59] than in the university’s network.
Other approaches [60] quantified an increase in GWP expressed as CO2e for one meter of HDPE pipes (25.5 kgCO2e/m) compared to the PVC material (21.1 kgCO2e/m). The results are shown in Table 5.
In Table 5, the authors presented emission results from different irrigation systems. Various factors contribute to the differences in emission results obtained across different irrigation systems. Drip irrigation emits less water than flood irrigation because of its efficient delivery. Technology and design differences caused this. Water management practices play a significant role where well-executed practices lead to reduced emissions. The choice of energy source influences emissions, as systems powered by renewable energy emit less than those reliant on fossil fuels.
Furthermore, the specific soil can also impact emissions, with flood irrigation potentially causing higher emissions in certain anaerobic soil conditions. Maintaining and operating systems properly can improve performance and may reduce emissions. Emissions can be affected by regional climate, soil characteristics, and water availability. To fully understand emission variations among different irrigation systems, all these elements must be considered [61]. Notably, greenhouse gas emissions from HDPE production account for 16%, slightly exceeding those from PVC production at 14%, when considering pipelines of similar size in drinking water transport and distribution networks [61]. This study [61] highlighted the crucial role of the operational stage, which influences GWP and involves the highest energy consumption. Analyses of various pipeline networks emphasized carbon steel pipelines contribute more to GWP compared to those made from alternative materials. Manufacturing emerges as the second most impactful stage in terms of GWP. In terms of materials, this study show that carbon steel pipes exhibit higher GWP than pipes made from other materials, while manufacturing concrete pipes contributes less to GWP than other materials. The study observes that, owing to the weight of concrete, the transportation of concrete pipelines results in the highest GWP. Conversely, the lightweight nature of HDPE translates to a lower environmental impact during transportation compared to other pipeline materials. Other approaches [61] focused on urban agriculture, conducted an LCA of urban farms and community gardens in several locations. The findings reveal that the primary sources of environmental impacts were attributed to infrastructure elements such as irrigation pipes and hydroponics structures, as well as factors like irrigation, compost, and peat used for seedlings. Water scarcity impacts were predominantly influenced by irrigation (90% to 99%). Among the various contributors to energy use, irrigation emerged as the largest, contributing an average of 19% to climate change impacts and 27% to energy resource use.
Given that electricity contributes to environmental impacts, it is noteworthy that the study [61] underscores the scenario investigated for 2019 as having the highest impact on climate change, totalling 57 Mt. of CO2e*year−1, attributed to coal and natural gas technologies. Although the emissions are expected to be eliminated by 2050, there will still be a climate change impact from other energy plant life cycle processes, amounting to 12 Mt. of CO2e*year−1 in 2050, reflecting an 80% reduction from the 2019 levels. The intermediate scenario for 2030 shows a moderate reduction of 47% compared to the 2019 impact. The study [61] advocates integrating Life Cycle Assessment (LCA) methods in future-oriented low-carbon building design and global urban planning to discuss anthropogenic climate change.

6. Conclusions

The total CO2e emissions produced by the irrigation network of the University of Alicante in every stage of its useful life have been quantified. The proposed calculation method responds to the questions planned before.
(I)
During the reference service life (25 years) 345 tonnes of CO2e are emitted. Materials (127.9 Tn CO2e; 37%) and energy (145.5 Tn CO2e; 42%) are the stages where the highest GWP is produced and where action should be taken.
(II)
Apart from these high percentages for materials and energy, repairs also stand out, with 18% (62 tonnes of CO2e) of the emissions produced. Construction (6.3 tonnes of CO2e) and transport of materials (3.5 tonnes of CO2e) account for approximately 1%. These figures for transport, although they seem small compared to other stages, occur at a single point in time (during manufacture). It is possible to reduce the impact produced by this factor by using local suppliers.
(III)
Following the results obtained, a potential solution to reduce emissions is to reduce operational energy in the use stage (B6). Renewable energy sources emerge as a workable choice considering the climate conditions in the region (solar, wind, etc.). Another potential choice (in the infrastructure design phase) would use materials with lower emissions as HDPE. This material (HDPE) has 11% fewer emissions compared to the current case (PVC and asbestos cement). This solution reduces modules A1 and B3.
(IV)
We can see the influence of materials at the product stage (A1–A3) and in the stage of repairs (B3). The current network (PVC and asbestos cement) and a network comprising PVC pipes (variants 0 and 1) show higher GHG emissions. Therefore, the network comprising HDPE pipes (variant 2) results as the best choice for emission reduction in the product stage (A1–A3) as seen in Table 2.
(V)
Manufacturing of the materials contributes to one-third (for PVC) to one-half (for HDPE) of the total emissions from the irrigation network’s life cycle. HDPE has a lower impact in the production stage (A1–A3) but contributes more emissions in the repair and end-of-life stages (C2–C4) based on EN 15978 [52] standards.
It has been proved that by replacing the current network with one made of HDPE pipes, a reduction is obtained in all stages. The reduction in this context can be observed in specific stages that have a onetime contribution rather than a cumulative effect. Shorter distances between suppliers and installation sites have led to a 73.3% decrease in transport emissions. Installing the network also leads to reducing 17.2% in emissions. The results obtained allow us to find materials (40%) and energy (42%) are the key stages with the greatest effects and, therefore, the ones to be acted upon first. Nearby suppliers can help reduce emissions by using eco-friendly materials. Furthermore, adopting renewable energy sources such as solar and wind power can serve as a sustainable alternative to conventional electricity, significant given that energy consumption is identified as a primary factor responsible for 42% of emissions. In terms of irrigation methods, drip irrigation is a more contemporary and efficient approach compared to flood or sprinkler systems. Additionally, the use of materials with lower environmental footprints and the implementation of water-conservation policies plays pivotal roles in curtailing emissions.
The present work has emphasized identifying the stages of the life cycle of an irrigation network and the corresponding emissions. Undoubtedly, this study identifies materials manufacturing and energy consumption during operation as the primary producers of emissions. Therefore, the results can be extrapolated to other similar facilities, as these life cycle stages should be addressed, as they are the most significant sources of emissions.

Author Contributions

Conceptualization, D.B.-M. and M.Á.P.; methodology, M.Á.P.; software, D.B.-M.; validation, S.V.; formal analysis, D.B.-M., S.V. and M.Á.P.; resources, S.V.; data curation, D.B.-M. and M.Á.P.; D.B.-M.; writing—original draft preparation, D.B.-M.; writing—review and editing, S.V. and M.Á.P.; visualization, M.Á.P.; supervision, M.Á.P.; project administration, M.Á.P.; funding acquisition, S.V. All authors have read and agreed to the published version of the manuscript.

Funding

This work has been funded by the research project “Hi-Edu Carbon” Erasmus Plus Programme, Key Action KA22021, action type (2021-1-SK01-KA220-HED-000023274).

Institutional Review Board Statement

Not applicable.

Informed Consent Statement

Not applicable.

Data Availability Statement

Data are contained within the article, as no datasets were generated or analysed during the current study.

Conflicts of Interest

The authors declare no conflict of interest.

Abbreviations

Emissions related to:
A1Raw materials extraction
A2Transport to the factory
A3Manufacturing
A4Transport
A5Construction
B3Repairs
B6Energy consumption
C2Waste transport
C4Waste disposal
CO2-eCarbon dioxide equivalent
DSSDecision support system
GHGsGreenhouse gases
GWPGlobal Warming Potential
HDPEHigh-density polyethylene
LCALife cycle assessment
PVCPolyvinyl chloride

References

  1. European Comission. A Clean Planet for All. A European Strategic Long-Term Vision for a Prosperous, Modern, Competitive and Climate Neutral Economy 2018. Brussels, 28.11.2018 COM(2018) 773. Available online: https://eur-lex.europa.eu/legal-content/EN/TXT/?uri=CELEX%3A52018DC0773 (accessed on 24 October 2023).
  2. Worrell, E.; Bernstein, L.; Roy, J.; Price, L.; Harnisch, J. Industrial Energy Efficiency and Climate Change Mitigation. In Renewable Energy; Routledge: London, UK, 2018; pp. Vol1_548–Vol1_568. [Google Scholar]
  3. Moscoso, R.O.A. La Industria y Sus Efectos En El Cambio Climático Global. RECIAMUC 2018, 2, 595–611. [Google Scholar] [CrossRef]
  4. Moreau, T.L.; Moore, J.; Mullinix, K. Mitigating Agricultural Greenhouse Gas Emissions: A Review of Scientific Information for Food System Planning. J. Agric. Food Syst. Community Dev. 2012, 2, 237–246. [Google Scholar] [CrossRef]
  5. Alfaro, M.; Muñoz, C. Ganadería y Gases de Efecto Invernadero. Informativo INIA no. 90. Remehue 2012. Available online: https://hdl.handle.net/20.500.14001/4744 (accessed on 17 November 2023).
  6. Kamali, M.; Hewage, K.; Sadiq, R. Conventional versus Modular Construction Methods: A Comparative Cradle-to-Gate LCA for Residential Buildings. Energy Build. 2019, 204, 109479. [Google Scholar] [CrossRef]
  7. Mhatre, P.; Gedam, V.; Unnikrishnan, S.; Verma, S. Circular Economy in Built Environment–Literature Review and Theory Development. J. Build. Eng. 2021, 35, 101995. [Google Scholar] [CrossRef]
  8. Joensuu, T.; Leino, R.; Heinonen, J.; Saari, A. Developing Buildings’ Life Cycle Assessment in Circular Economy-Comparing Methods for Assessing Carbon Footprint of Reusable Components. Sustain. Cities Soc. 2022, 77, 103499. [Google Scholar] [CrossRef]
  9. Monteiro, H.; Freire, F.; Soares, N. Life Cycle Assessment of a South European House Addressing Building Design Options for Orientation, Window Sizing and Building Shape. J. Build. Eng. 2021, 39, 102276. [Google Scholar] [CrossRef]
  10. Blengini, G.A.; Di Carlo, T. The Changing Role of Life Cycle Phases, Subsystems and Materials in the LCA of Low Energy Buildings. Energy Build. 2010, 42, 869–880. [Google Scholar] [CrossRef]
  11. Citherlet, S.; Defaux, T. Energy and Environmental Comparison of Three Variants of a Family House during Its Whole Life Span. Build. Environ. 2007, 42, 591–598. [Google Scholar] [CrossRef]
  12. Dahlstrøm, O.; Sørnes, K.; Eriksen, S.T.; Hertwich, E.G. Life Cycle Assessment of a Single-Family Residence Built to Either Conventional-or Passive House Standard. Energy Build. 2012, 54, 470–479. [Google Scholar] [CrossRef]
  13. Lewandowska, A.; Noskowiak, A.; Pajchrowski, G. Comparative Life Cycle Assessment of Passive and Traditional Residential Buildings’ Use with a Special Focus on Energy-Related Aspects. Energy Build. 2013, 67, 635–646. [Google Scholar] [CrossRef]
  14. Monahan, J.; Powell, J.C. An Embodied Carbon and Energy Analysis of Modern Methods of Construction in Housing: A Case Study Using a Lifecycle Assessment Framework. Energy Build. 2011, 43, 179–188. [Google Scholar] [CrossRef]
  15. Chen, Z.; Gu, H.; Bergman, R.D.; Liang, S. Comparative Life-Cycle Assessment of a High-Rise Mass Timber Building with an Equivalent Reinforced Concrete Alternative Using the Athena Impact Estimator for Buildings. Sustainability 2020, 12, 4708. [Google Scholar] [CrossRef]
  16. Kazemi, H.; Zardari, S. Energy Analysis and Greenhouse Gas Emission from Strawberry Production under Two Irrigation Systems. Walailak J. Sci. Technol. (WJST) 2020, 17, 1–10. [Google Scholar] [CrossRef]
  17. Mequignon, M.; Haddou, H.A.; Thellier, F.; Bonhomme, M. Greenhouse Gases and Building Lifetimes. Build. Environ. 2013, 68, 77–86. [Google Scholar] [CrossRef]
  18. Thormark, C. A Low Energy Building in a Life Cycle—Its Embodied Energy, Energy Need for Operation and Recycling Potential. Build. Environ. 2002, 37, 429–435. [Google Scholar] [CrossRef]
  19. Asif, M.; Muneer, T.; Kelley, R. Life Cycle Assessment: A Case Study of a Dwelling Home in Scotland. Build. Environ. 2007, 42, 1391–1394. [Google Scholar] [CrossRef]
  20. Bastos, J.; Batterman, S.A.; Freire, F. Life-Cycle Energy and Greenhouse Gas Analysis of Three Building Types in a Residential Area in Lisbon. Energy Build. 2014, 69, 344–353. [Google Scholar] [CrossRef]
  21. Nwanya, S.C.; Offili, I. Global Warming Potential Implications and Methodological Challenges of Road Transport Emissions in Nigeria. Energy Environ. Res. 2013, 3, 169. [Google Scholar] [CrossRef]
  22. Yaacob, N.F.F.; Mat Yazid, M.R.; Abdul Maulud, K.N.; Ahmad Basri, N.E. A Review of the Measurement Method, Analysis and Implementation Policy of Carbon Dioxide Emission from Transportation. Sustainability 2020, 12, 5873. [Google Scholar] [CrossRef]
  23. Acharya, S.; George, B.; Aye, L.; Nair, S.; Nawarathna, B.; Malano, H. Life Cycle Energy and Greenhouse Gas Emission Analysis of Groundwater-Based Irrigation Systems. Irrig. Drain. 2015, 64, 408–418. [Google Scholar] [CrossRef]
  24. Torrellas, M.; Antón, A.; López, J.C.; Baeza, E.J.; Parra, J.P.; Muñoz, P.; Montero, J.I. LCA of a Tomato Crop in a Multi-Tunnel Greenhouse in Almeria. Int. J. Life Cycle Assess. 2012, 17, 863–875. [Google Scholar] [CrossRef]
  25. Rufí-Salís, M.; Petit-Boix, A.; Villalba, G.; Sanjuan-Delmás, D.; Parada, F.; Ercilla-Montserrat, M.; Arcas-Pilz, V.; Munoz-Liesa, J.; Rieradevall, J.; Gabarrell, X. Recirculating Water and Nutrients in Urban Agriculture: An Opportunity towards Environmental Sustainability and Water Use Efficiency? J. Clean. Prod. 2020, 261, 121213. [Google Scholar] [CrossRef]
  26. Nguyen, L.; Hsuan, G.Y.; Spatari, S. Life Cycle Economic and Environmental Implications of Pristine High Density Polyethylene and Alternative Materials in Drainage Pipe Applications. J. Polym. Environ. 2017, 25, 925–947. [Google Scholar] [CrossRef]
  27. Istrate, I.-R.; Juan, R.; Martin-Gamboa, M.; Domínguez, C.; García-Muñoz, R.A.; Dufour, J. Environmental Life Cycle Assessment of the Incorporation of Recycled High-Density Polyethylene to Polyethylene Pipe Grade Resins. J. Clean. Prod. 2021, 319, 128580. [Google Scholar] [CrossRef]
  28. Nakem, S.; Pipatanatornkul, J.; Papong, S.; Rodcharoen, T.; Nithitanakul, M.; Malakul, P. Material Flow Analysis (MFA) and Life Cycle Assessment (LCA) Study for Sustainable Management of PVC Wastes in Thailand. In Computer Aided Chemical Engineering; Elsevier: Amsterdam, The Netherlands, 2016; Volume 38, pp. 1689–1694. [Google Scholar]
  29. Terkenli, T.S.; Gkoltsiou, A.; Kavroudakis, D. The Interplay of Objectivity and Subjectivity in Landscape Character Assessment: Qualitative and Quantitative Approaches and Challenges. Land. 2021, 10, 53. [Google Scholar] [CrossRef]
  30. Klein, N.; Herzog, F.; Jeanneret, P.; Kay, S. Validating Farmland Biodiversity Life Cycle Assessment at the Landscape Scale. Environ. Sci. Technol. 2023. [Google Scholar] [CrossRef]
  31. González-Cebollada, C. Water and Energy Consumption after the Modernization of Irrigation in Spain. WIT Trans. Built. Environ. 2015, 168, 457–465. [Google Scholar] [CrossRef]
  32. Pardo, M.A.; Riquelme, A.J.; Jodar-Abellan, A.; Melgarejo, J. Water and Energy Demand Management in Pressurized Irrigation Networks. Water 2020, 12, 1878. [Google Scholar] [CrossRef]
  33. Martin-Gorriz, B.; Martínez-Alvarez, V.; Maestre-Valero, J.F.; Gallego-Elvira, B. Influence of the Water Source on the Carbon Footprint of Irrigated Agriculture: A Regional Study in South-Eastern Spain. Agronomy 2021, 11, 351. [Google Scholar] [CrossRef]
  34. EPA Inventory of, U.S. Greenhouse Gas. Emissions and Sinks: 1990-2021—Main. Report; 2023. U.S. Environmental Protection Agency, EPA 430-R-23-002. Available online: https://www.epa.gov/ghgemissions/inventory-us-greenhouse-gas-emissions-andsinks-1990-2021 (accessed on 24 October 2023).
  35. Lokupitiya, E.; Paustian, K. Agricultural Soil Greenhouse Gas Emissions. J. Environ. Qual. 2006, 35, 1413–1427. [Google Scholar] [CrossRef]
  36. Smith, P.; Martino, Z.; Cai, D. “Agriculture”. In Climate Change 2007: Mitigation; Cambridge University Press: Cambridge, UK, 2007. [Google Scholar]
  37. Zou, X.; Li, Y.; Li, K.; Cremades, R.; Gao, Q.; Wan, Y.; Qin, X. Greenhouse Gas Emissions from Agricultural Irrigation in China. Mitig. Adapt. Strat. Glob. Chang. 2015, 20, 295–315. [Google Scholar] [CrossRef]
  38. Fotia, K.; Mehmeti, A.; Tsirogiannis, I.; Nanos, G.; Mamolos, A.P.; Malamos, N.; Barouchas, P.; Todorovic, M. LCA-Based Environmental Performance of Olive Cultivation in Northwestern Greece: From Rainfed to Irrigated through Conventional and Smart Crop Management Practices. Water 2021, 13, 1954. [Google Scholar] [CrossRef]
  39. de Figueirêdo, M.C.B.; de Boer, I.J.M.; Kroeze, C.; Barros, V.d.S.; de Sousa, J.A.; de Aragão, F.A.S.; Gondim, R.S.; Potting, J. Reducing the Impact of Irrigated Crops on Freshwater Availability: The Case of Brazilian Yellow Melons. Int. J. Life Cycle Assess. 2014, 19, 437–448. [Google Scholar] [CrossRef]
  40. Canaj, K.; Parente, A.; D’Imperio, M.; Boari, F.; Buono, V.; Toriello, M.; Mehmeti, A.; Montesano, F.F. Can Precise Irrigation Support the Sustainability of Protected Cultivation? A Life-Cycle Assessment and Life-Cycle Cost Analysis. Water 2021, 14, 6. [Google Scholar] [CrossRef]
  41. Hospido, A.; Núñez, M.; Antón, A. Irrigation Mix: How to Include Water Sources When Assessing Freshwater Consumption Impacts Associated to Crops. Int. J. Life Cycle Assess. 2013, 18, 881–890. [Google Scholar] [CrossRef]
  42. Canaj, K.; Morrone, D.; Roma, R.; Boari, F.; Cantore, V.; Todorovic, M. Reclaimed Water for Vineyard Irrigation in a Mediterranean Context: Life Cycle Environmental Impacts, Life Cycle Costs, and Eco-Efficiency. Water 2021, 13, 2242. [Google Scholar] [CrossRef]
  43. Zaman, M.; Kleineidam, K.; Bakken, L.; Berendt, J.; Bracken, C.; Butterbach-Bahl, K.; Cai, Z.; Chang, S.X.; Clough, T.; Dawar, K.; et al. Methodology for Measuring Greenhouse Gas Emissions from Agricultural Soils Using Non-Isotopic Techniques. In Measuring Emission of Agricultural Greenhouse Gases and Developing Mitigation Options using Nuclear and Related Techniques: Applications of Nuclear Techniques for GHGs; Zaman, M., Heng, L., Müller, C., Eds.; Springer International Publishing: Cham, Switzerland, 2021; pp. 11–108. ISBN 978-3-030-55396-8. [Google Scholar]
  44. Sapkota, A.; Haghverdi, A.; Avila, C.C.E.; Ying, S.C. Irrigation and Greenhouse Gas Emissions: A Review of Field-Based Studies. Soil. Syst. 2020, 4, 20. [Google Scholar] [CrossRef]
  45. Alghamdi, A.; Hu, G.; Haider, H.; Hewage, K.; Sadiq, R. Benchmarking of Water, Energy, and Carbon Flows in Academic Buildings: A Fuzzy Clustering Approach. Sustainability 2020, 12, 4422. [Google Scholar] [CrossRef]
  46. EN ISO 14025:2010; Environmental Labels and Declarations—Type III Environmental Declarations—Principles and Procedures. European Standards Organization: Brusseles, Belgium, 2010.
  47. Košičan, J.; Pardo Picazo, M.Á.; Vilčeková, S.; Košičanová, D. Life Cycle Assessment and Economic Energy Efficiency of a Solar Thermal Installation in a Family House. Sustainability 2021, 13, 2305. [Google Scholar] [CrossRef]
  48. Haun, P.; Müller, P.; Traverso, M. Improving Automated Life Cycle Assessment with Life Cycle Inventory Model Constructs. J. Clean. Prod. 2022, 370. [Google Scholar] [CrossRef]
  49. ISO 21930:2017; Sustainability in Building Construction; Environmental Declaration of Building Products. International Organization for Standardization: Geneve, Switzerland, 2017.
  50. ISO 14021:2016; Environmental Labels and Declarations-Self-declared Environmental Claims (type II Environmental Labelling). International Organization for Standardization: Geneve, Switzerland, 2016.
  51. 15804:2012+A2:2019; Sustainability of Construction Works—Environmental Product Declarations—Core Rules for the Product Category of Construction Products. European Committee for Standardization (CEN): Brussels, Belgium, 2019.
  52. UNE-EN 15978:2011; Sustainability of Construction Works—Assessment of Environmental Performance of Buildings–Calculation Method. European Committee for Standardization (CEN): Brussels, Belgium, 2019.
  53. Alghamdi, A.; Hu, G.; Chhipi-Shrestha, G.; Haider, H.; Hewage, K.; Sadiq, R. Investigating Spatiotemporal Variability of Water, Energy, and Carbon Flows: A Probabilistic Fuzzy Synthetic Evaluation Framework for Higher Education Institutions. Environment 2021, 8, 72. [Google Scholar] [CrossRef]
  54. Sellés, J.N.; Rodes, J.M.A.; Arias, M.F.C.; Mejuto, M.F.; Rocamora, R.P. Caracterización Del Acuífero de San Vicente (Alicante). In Proceedings of the Congreso Nacional del Agua Orihuela: Innovación y Sostenibilidad; Universitat d’ Alacant/Universidad de Alicante: Alicante, Spain, 2018; pp. 1387–1398. [Google Scholar]
  55. Chillón Arias, M.F.; Varó Galvañ, P.J. Planta de Tratamiento de Aguas de La Universidad de Alicante. 2014. Available online: http://hdl.handle.net/10045/36884 (accessed on 20 November 2023).
  56. Rico, D.P.; Arias, M.F.C.; Mateo, R.M.; Gómez, C.M.; Azpitarte, R.U. Proyecto de Gestión Integral de Recursos Hídricos y Energéticos En La Universidad de Alicante. Rev. Digit. Del. Cedex 1998, 110, 73. [Google Scholar]
  57. European Environment Agency Greenhouse Gas Emissions from Transport in Europe; European Environment Agency: Copenhagen, Denmark, 2019.
  58. European Commission. Regulation (EU) 2021/1119; European Commission: Geneva, Switzerland, 2021; Volume 2021, p. 17. [Google Scholar]
  59. Du, F.; Woods, G.J.; Kang, D.; Lansey, K.E.; Arnold, R.G. Life Cycle Analysis for Water and Wastewater Pipe Materials. J. Environ. Eng. 2013, 139, 703–711. [Google Scholar] [CrossRef]
  60. Hajibabaei, M.; Nazif, S.; Sereshgi, F.T. Life Cycle Assessment of Pipes and Piping Process in Drinking Water Distribution Networks to Reduce Environmental Impact. Sustain. Cities Soc. 2018, 43, 538–549. [Google Scholar] [CrossRef]
  61. Sanjuan-Delmás, D.; Petit-Boix, A.; Gasol, C.M.; Villalba, G.; Suárez-Ojeda, M.E.; Gabarrell, X.; Josa, A.; Rieradevall, J. Environmental Assessment of Different Pipelines for Drinking Water Transport and Distribution Network in Small to Medium Cities: A Case from Betanzos, Spain. J. Clean. Prod. 2014, 66, 588–598. [Google Scholar] [CrossRef]
Figure 1. Life cycle analysis stages.
Sustainability 15 16240 g001
Figure 2. Looped irrigation network of the University of Alicante.
Sustainability 15 16240 g002
Figure 3. Variants comparison for “cradle-to-gate” system boundary.
Sustainability 15 16240 g003
Figure 4. Percentage share of life cycle stages on total CO2e emissions for 25 years.
Sustainability 15 16240 g004
Table 1. Quantities needed to carry out the cradle-to-gate and cradle-to-grave analysis.
ModuleParameterUnitQuantityObservations
Cradle-to-Grave AnalysisPVCA1Material supplym16,106.3Life stage PVC length of the irrigation network
A2Transportkm1611Distance from raw material extraction to the manufacturer
A3EnergykWh38,694Energy used in material production
ACA1Material supplym6902.7Life stage asbestos cement length of the irrigation network
A2Transportkm1511Total distance from leaving the factory to the construction site
A3EnergykWh60,136Energy used in material production
Cradle-to-Grave Analysis A1–A3Productsm23,009Total network length
A5Constructionm211,504.5Building surface
B6Operational energykWh·year−114,366Energy consumed (pumping and distribution equipment)
PVCB3 Repairs%2Annual repair rate
A1–A3Loses%5Percentage of losses in production
ACB3 Repairs%0Annual repair rate
A1–A3Loses%5Percentage of losses in production
Table 2. Results of CO2e emissions for “cradle-to-gate” system boundary.
ModuleStageVariant 0Variant 1Variant 2
A1Materials supply133,507.8 (81.4%)179,021.5 (87.8%)89,333.2 (54.6%)
A2Transport18,315.5 (11.2%)19,996.1 (9.8%)5215.8 (3.2%)
A3Manufacturing12,172.9 (7.4%)4765.9 (2.4%)68,934.8 (42.2%)
TOTAL163,996.2203,783.5163,483.9
Table 3. Results of CO2e emissions for “cradle-to-grave” system boundary.
ModuleStageVariant 0Variant 1Variant 2
A1–A3Product127,934.1 (37%)255,598.8 (47%)102,809.5 (34%)
A4Transport3533.7 (1%)2481.0 (0%)943.7 (0%)
A5Construction6274.5 (2%)12,934.4 (2%)5197.0 (2%)
B3Repairs61,994.1 (18%)129,343.9 (24%)51,969.9 (17%)
B6Operational energy145,474.2 (42%)145,474.2 (27%)145,474.2 (47%)
C2Waste transport15.9 (0%)321.9 (0%)98.8 (0%)
C4Waste disposal14.1 (0%)286.0 (0%)87.8 (0%)
TOTAL345,240.6546,440.2306,580.9
Table 4. GHG emission distribution with alternative options for pipe length.
Variant% Share of A1 on the GWP Total% Reduction
Variant 038.67−6.81
Variant 132.76−3.48
Variant 229.1−6.31
Table 5. Comparison of pipe materials.
GWP (kgCO2e/m)University NetworkDu et al. (2013), Reference [59]Hajibabaei et al. (2018), Reference [60]
ActualPVCHDPEPVCHDPEPVCHDPE
Production5.6 (93%)11.1 (94%)4.5 (91%)315 (99%)215 (99%)21.1 (63%)25.5 (67%)
Installation0.27 (5%)0.56 (5%) 0.23 (5%)2.8 (1%)2.8 (1%)3.8 (11%)3.8 (10%)
Transport0.15 (2%)0.11 (1%)0.23 (4%)0.26 (0%)0.17 (0%)8.8 (26%)8.8 (23%)
Disclaimer/Publisher’s Note: The statements, opinions and data contained in all publications are solely those of the individual author(s) and contributor(s) and not of MDPI and/or the editor(s). MDPI and/or the editor(s) disclaim responsibility for any injury to people or property resulting from any ideas, methods, instructions or products referred to in the content.

