Article

Design and Optimization of a Coal Substitution Path Based on Cost–Benefit Analysis: Evidence from Coal Resource-Based Cities in China

1
State Key Laboratory of Environmental Criteria and Risk Assessment, Chinese Research Academy of Environmental Sciences, Beijing 100012, China
2
College of Water Sciences, Beijing Normal University, Beijing 100875, China
*
Author to whom correspondence should be addressed.
Sustainability 2023, 15(21), 15448; https://doi.org/10.3390/su152115448
Submission received: 5 September 2023 / Revised: 23 October 2023 / Accepted: 27 October 2023 / Published: 30 October 2023

Abstract

:
Coal burning is a major contributor to air pollution. Selecting the optimal coal alternative path with economic feasibility and maximum environmental benefits is an important policy choice to mitigate air pollution. It could provide a basis for the design of energy transition policies and the green development of coal resource-based cities. This study designed a coal substitution policy based on the multi-objective optimization model, explored the optimal coal substitution path in coal resource-based cities with the goal of minimizing the costs and maximizing the benefits of coal substitution, and assessed the maximum emission reduction potential of air pollutants. The results show that: (1) by 2025, coal consumption in the study area must be reduced to 85%. The optimal coal substitution path is 90.00% coal-to-electricity and 10.00% coal-to-gas for civil emission sources and 83.94% coal-to-electricity and 16.06% coal-to-gas for industrial boiler emission sources. (2) by 2030, coal consumption must be reduced to 75%. The optimal coal substitution path is 90.00% coal-to-electricity and 10.00% coal-to-gas for civil sources and 78.80% coal-to-electricity and 21.20% coal-to-gas for industrial boiler sources. (3) by implementing the coal substitution policy, emissions of six key air pollutants such as SO2, NOX, CO, VOCs, PM10, and PM2.5 could decrease significantly.

1. Introduction

Due to the great energy endowment and low-price advantage, coal resources have become the main energy structure of coal resource-based cities, providing vital support for local economic development and social life [1,2]. In addition to the release of harmful gases such as methane during coal mining [3,4,5], a large number of atmospheric pollutants such as SO2, NOX, and particulate matter are emitted during coal combustion; its negative externalities significantly affect the atmospheric environment [6,7,8,9]. Zhang et al. reported that residential coal combustion contributes 46% of the monthly average concentration of particulate matter, with an aerodynamic diameter ≤ 2.5 μm (PM2.5) in the Beijing–Tianjin–Hebei region [10]. Huang et al. indicated that heating emission sources and other industry emission sources are the most important SO2 contributors in Beijing, taking up 66.1% of the emission source contribution ratio [11], indicating that coal burning greatly increases ambient air pollution.
In response to the persistent heavy smog in northern China, the State Council has issued air pollution control policies such as the “Air Pollution Prevention and Control Action Plan” and “Three-year Action Plan to Make Skies Blue Again”, taking actions to accelerate the substitution of residential solid fuels with electricity or natural gas, upgrade coal-fired boilers, cap coal consumption in key regions, and set ambitious new air quality targets.
The effects of rural clean heating policies [12,13] on air quality [14,15], health [16,17,18], carbon emissions [19], and economic costs [20] have been assessed in numerous previous studies. However, clean energy replacement policies for coal-fired boilers [21,22,23] have rarely been evaluated. Furthermore, clean energy replacement policies for both rural clean heating and coal-fired boilers have been evaluated in few studies, and there is a lack of research on the scientific planning for coal substitution policies by projecting coal reductions and increased supply of clean energy, as well as systematic cost–benefit evaluations of substitution paths.
In this study, Changji, Xinjiang, a coal resource-based city, was used as the research area. First, a phased implementation plan of coal substitution was designed from the overall perspective of benefits in the planning cycle using the analysis and projection of coal reductions and the increased clean energy supply in the target year. Second, a multi-objective optimization model was constructed to optimize the coal substitution path by utilizing the proportions of the two major clean energy substitution modes (coal-to-electricity and coal-to-gas) of emission sources as the variables. The goals were to minimize coal substitution operation costs and maximize the emission reduction potential of air pollutants.Unlike previous studies on the impact of a single coal substitution policy, this study designed and optimized a coal substitution path from the perspective of the macro-distribution of energy transition by considering the advantages and characteristics of various coal substitution solutions to enhance the scientific nature of coal substitution planning and benefits of substitution. This study provides a scientific basis for the design of energy transition policies and the green development of coal resource-based cities.

2. Materials and Methods
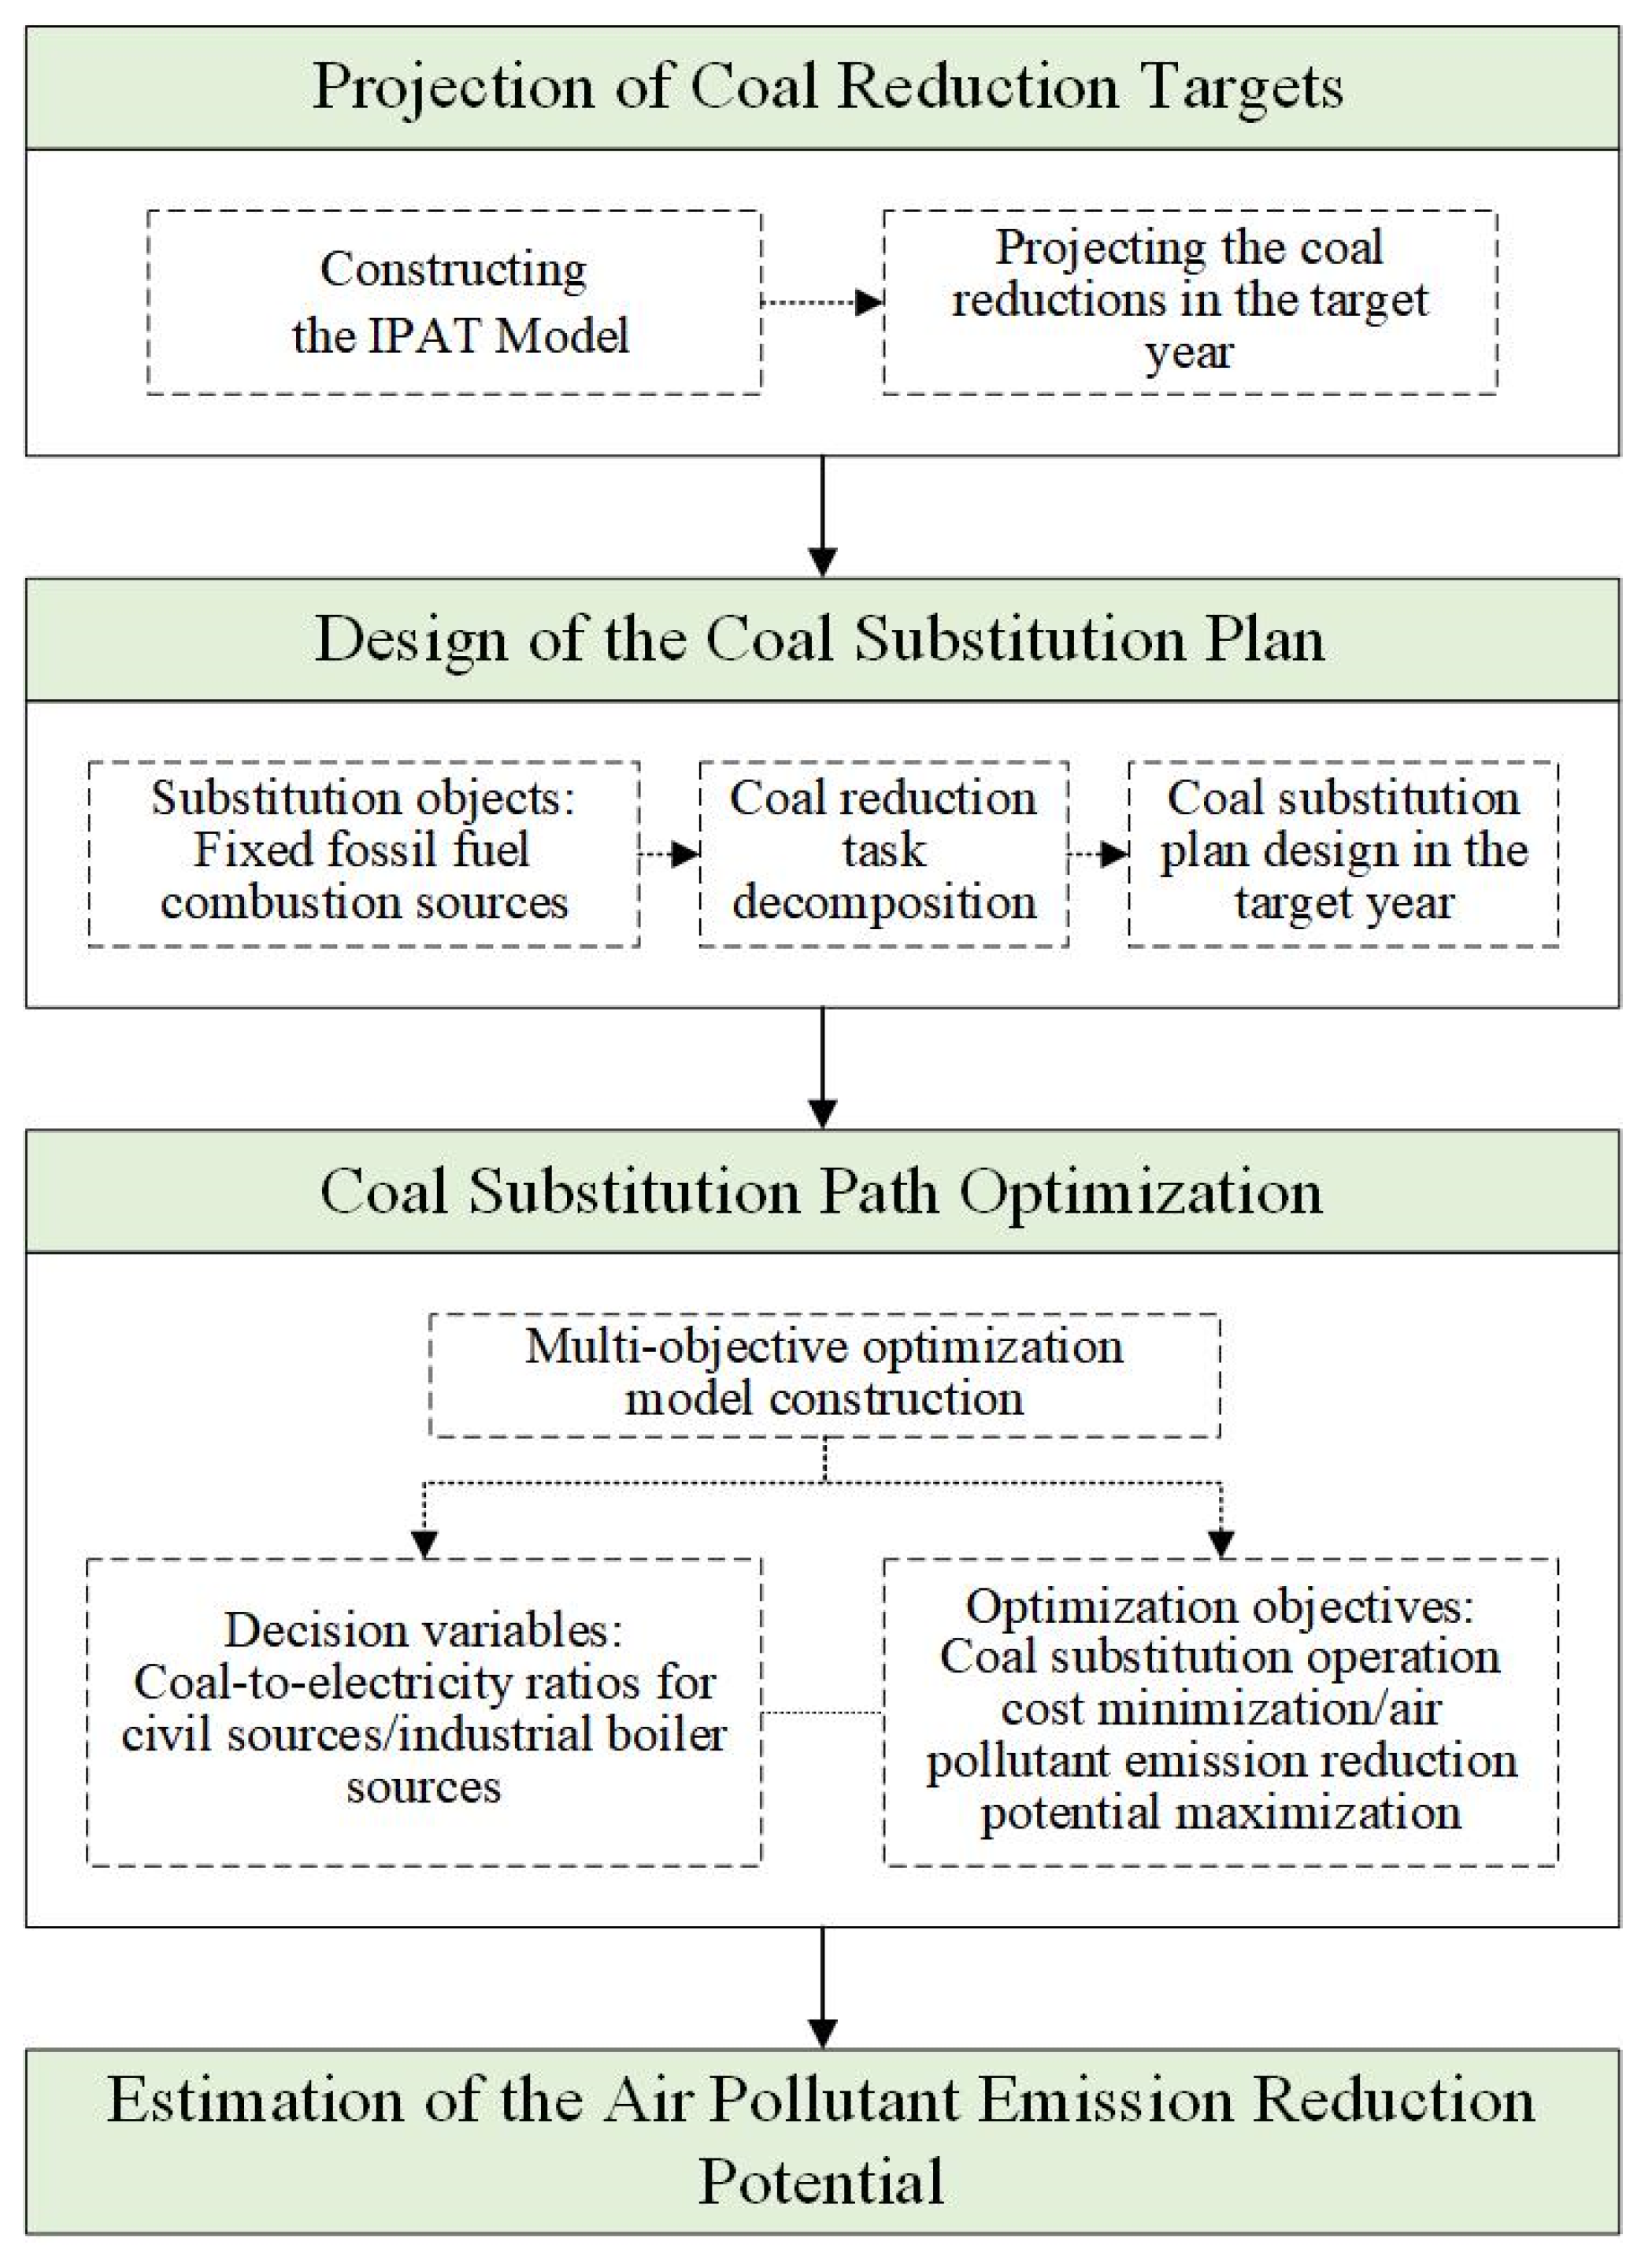
2.1. Study Design

The research framework for this study is presented in Figure 1.
(1) Projecting coal reduction targets: in this study, 2020 was used as the base year, and 2025 and 2030 as the target years. The total energy consumption in the target year was projected by setting the average annual decline rate of the energy intensity, and the coal consumption in the target year was projected by setting the proportion of coal consumption, and then the coal reductions achieved by the target year were projected.
(2) Designing a coal substitution plan: to achieve coal consumption reductions by 2025 and 2030, coal substitution plans were formulated for the study area. In these plans, two major policy measures, that is, clean energy transition for coal-fired boilers and rural clean heating, were implemented, and the fixed combustion sources of fossil fuels were used as substitution objects.
(3) Optimizing coal substitution path: a multi-objective optimization model was constructed to identify the optimal path of coal substitution. The decision variables were the coal-to-electricity ratios for civil emission and industrial boiler sources, and the optimization objectives were the minimum operation costs of coal substitution and the maximum emission reduction potential of air pollutants.
(4) Estimating the emission reduction potential of air pollutants under the optimal path: based on the emission coefficient method, emission reductions in air pollutants due to the reduction in coal consumption were estimated.

2.2. Methodology

2.2.1. The IPAT Model

In this study, the extended IPAT model was used to forecast coal consumption in the study area. As it reflects the development of multiple systems under the goal of a low-carbon economy, the IPAT model is widely applied to characterize the correlation among population, economy, energy, and environment [24,25]. Chontanawat analyzed the historical increases in CO2 emissions over the period of 1971–2013 using the IPAT approach combined with the variance analysis technique [26]. Cansino et al. used an extended version of the IPAT model to assess the contribution of drivers of CO2 emissions for the 1995–2009 period [27]. The general form of the IPAT equation is as follows:
I = P · G / P · I / G = P · A · T ,
where I is the environmental impact indicator; P is the population indicator; A is the affluence indicator; T is the technology indicator; and G is Gross Domestic Product (GDP). The object of this study is coal consumption, which is assosiated with GDP, energy consumption per unit of GDP (i.e., energy intensity) and proportion of coal consumption. Let C replace I to represent coal consumption in the target year and E replace T to represent energy intensity, where k is the proportion of coal consumption, and then the mutual relationship between economic development and coal consumption can be expressed as follows:
C t = P · A · T = G t · E t · k t ,
G t = G 0 · 1 + γ n ,
E t = E 0 · 1 + δ n ,
where C t is the coal consumption in the target year (million tons of coal equivalent, Mtce).
  • G t is the GDP of year t (millions of CNY).
  • G 0 is the GDP of the base year (millions of CNY).
  • γ is the average annual GDP growth rate (%). Based on the economic growth rate of the study area in the “13th Five-Year Plan” (the average annual growth rate of the GDP is 6.3%) and the expected target of the “14th Five-Year Plan” (the average annual growth rate of the GDP is approximately 7.5%), this study took 6.5% as the average annual GDP growth rate of the study area during 2021–2030.
  • n is the year.
  • E t is the energy consumption per unit of GDP (equal value) of year t (tce/CNY 10,000).
  • E 0 is the energy consumption per unit of GDP (equal value) in the base year (tce/CNY 10,000).
  • δ is the annual reduction rate of energy consumption per unit of GDP (equal value; %). In reference to the target requirement of a 3% reduction in energy consumption per unit of GDP issued by the state to Xinjiang in 2021 and the urgent demand for upgrading industrial chains and optimizing the energy structure, we selected 5.5% as the average annual energy consumption reduction rate per unit of GDP of the study area from 2021 to 2030. Shah et al. found that the average energy efficiency score of China during 1995–2020 was about 0.65, which is lower than the average level of G20 countries during that period of 0.8577, but it still has an improvement potential of 35 percent [28]. Compared with it, the value used in this study is reasonable.
  • k t is the coal consumption proportion of year t (%). The proportion of coal consumption in the study area in the base year was 93.65%. According to the existing coal substitution policy goals in the study area, rural clean heating and clean energy replacement for coal-fired boilers with capacities under 65 steam tons per hour (t/h) should be completed before 2025, and this was estimated to account for 7.5% of total coal consumption in 2020. We considered 85% as the coal consumption proportion by 2025 and 75% by 2030.
The coal consumption of the study area in the target year was estimated based on the above-mentioned settings.
The coal reduction in the study area in the target year was estimated based on Equation (5):
C = C t C 0 ,
where C is the reduction in coal consumption, Mtce; C 0 is the coal consumption in the base year, Mtce.

2.2.2. Multi-Objective Optimization Model

It has been proven that multi-objective optimization is an effective tool for studying the trade-off among multiple conflicting objectives [29,30]. Sharafi and ELMekkawy applied a particle swarm optimization (PSO) simulation-based approach to tackle a multi-objective optimization problem with minimum cost, CO2 emission, and maximum reliability [31].
To explore the optimal path of coal substitution, a multi-objective optimization model was constructed. The decision variables were the coal-to-electricity ratios for civil emission and industrial boiler sources, and the optimization objectives were to minimize the operation cost of coal substitution and maximize the emission reduction potential of air pollutants.
The construction method was as follows: (1) the objective function was set based on the overall goal of reducing the operation costs of coal substitution and increasing the emission reduction in air pollutants. (2) Based on the study area’s current situation and various development plans, the model constraints were set to maximum coal-to-electricity and coal-to-gas ratios for the civil emission and industrial boiler sources, maximum renewable energy power generation, maximum gas supply, and equity of power and gas supply. (3) The model was run to realize the rational optimization of the coal substitution path for civil emission and industrial boiler sources.

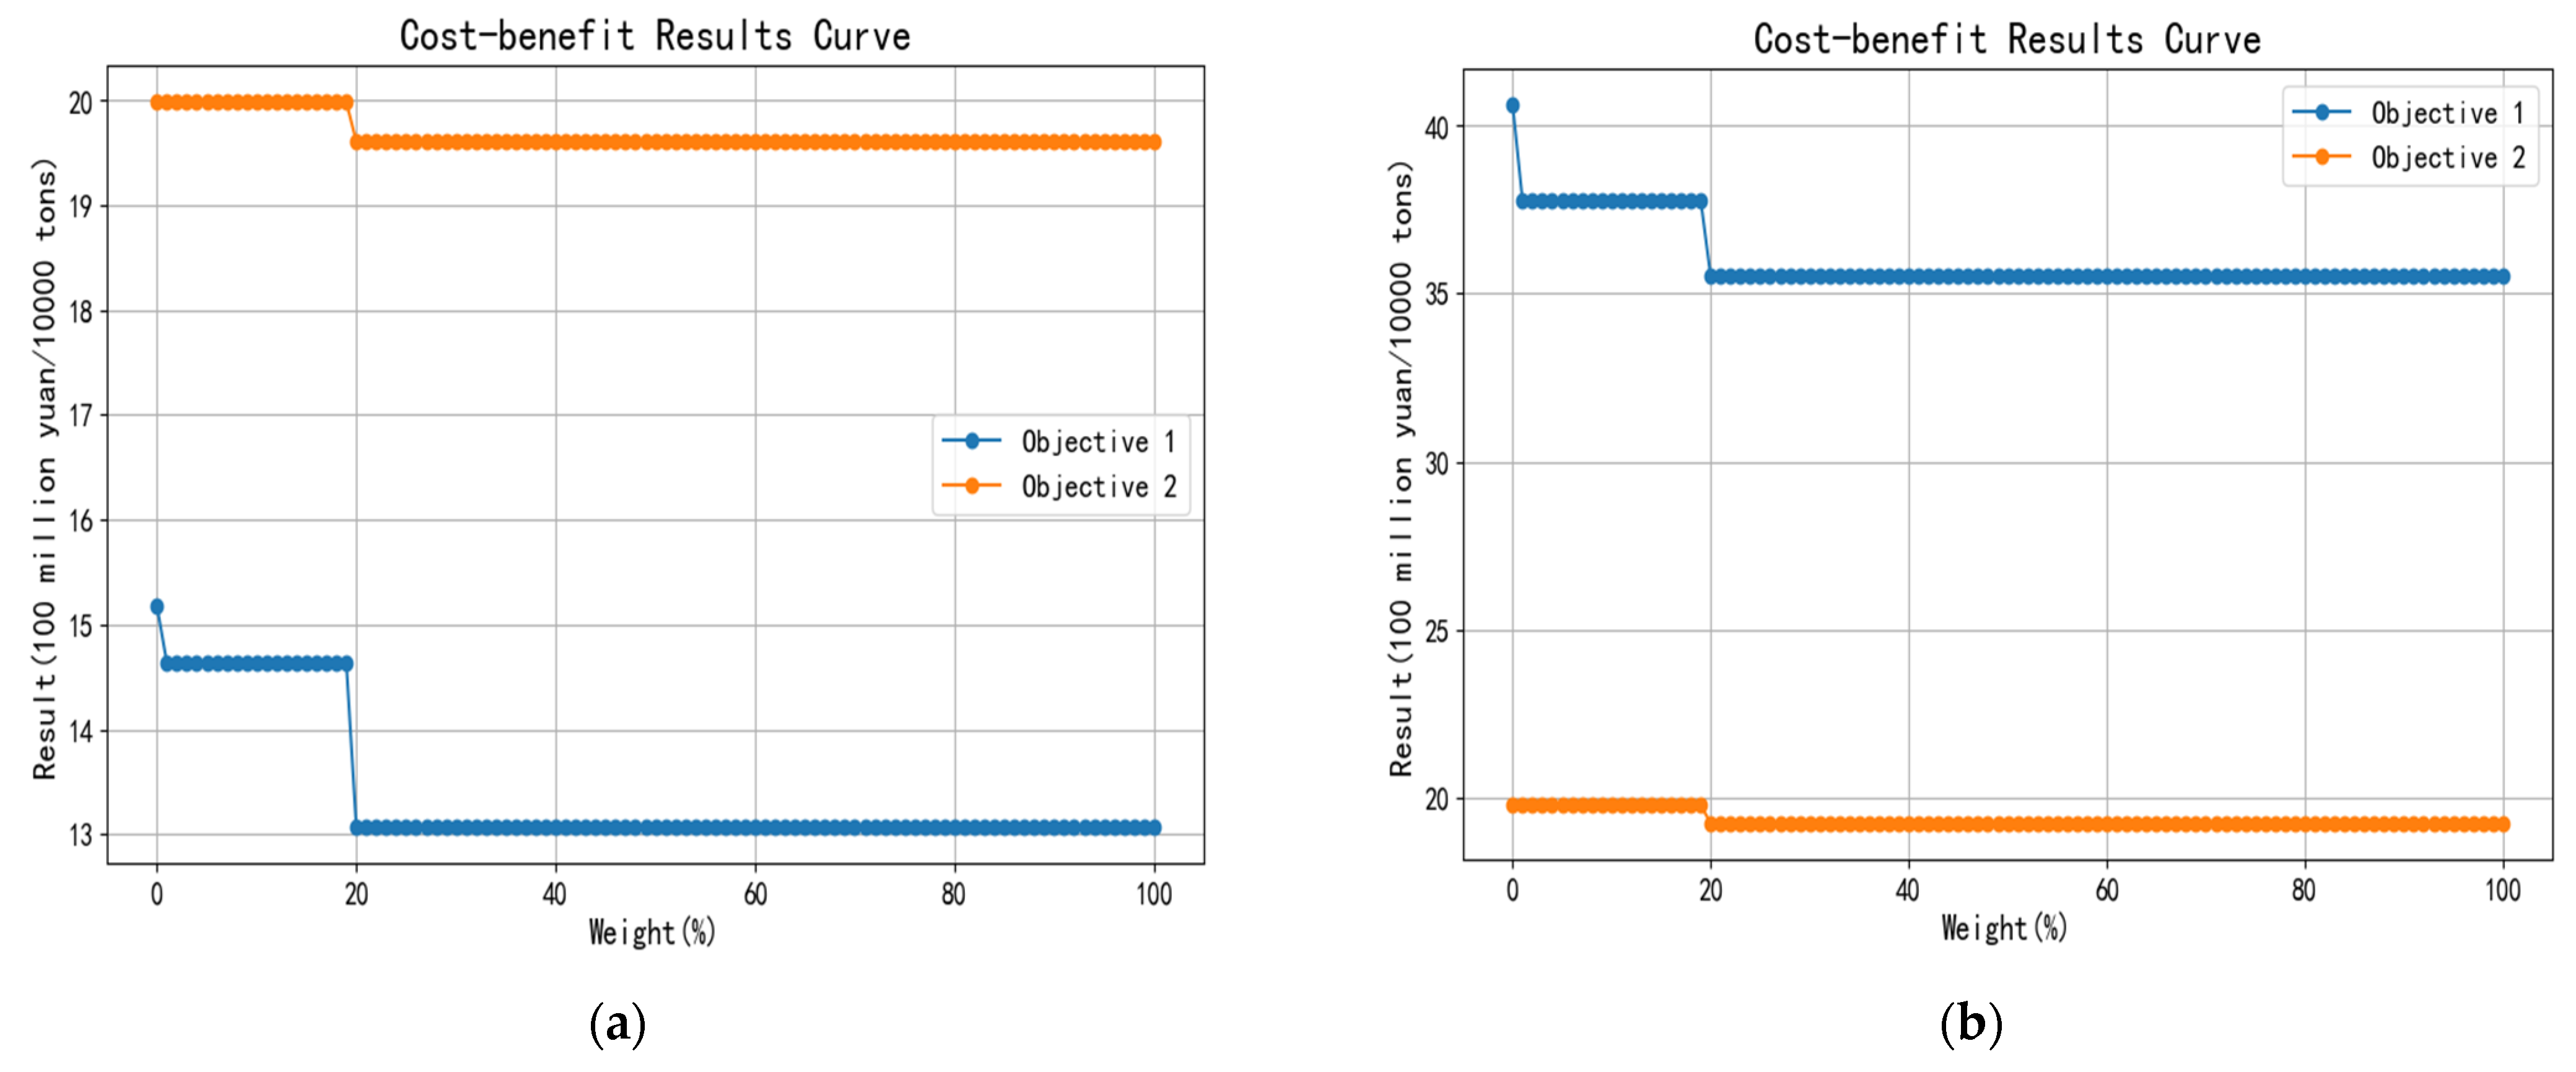
2.2.3. Linear Weighted Method

There are two main methods dealing with the multi-objective optimization problem. One is to simplify the multi-objective optimization problem to a single-objective optimization problem, which is mainly accomplished by weighting different objective functions and combining them into one objective function; the other is to find Pareto-optimal solutions by clarifying the priorities or weights of different goals, identifying Pareto solution sets with optimal optimization conditions under different weights, and selecting the solution according to the preferences or application scenarios of decision makers. In this study, the linear weighted method was applied to combine these two methods.
Based on the importance of each objective in the problem, every objective function in multi-objective programming can be assigned a weight, the sum function of these objective functions with coefficients is then used as the evaluation function. Consequently, the multi-objective problem is transformed into a single-objective problem [32,33] as follows:
min Z = i = 1 n f i ( x ) w i ,
s . t . i = 1 n w i = 1 ,
where Z is the multi-objective function; f i ( x ) is the objective function; and w i is the weight of the objective function.
The search algorithm can be used to determine the best weights for the cases of a new problem with unknown weights. Taking dual objective programming as an example, the model can be rewritten as:
min Z = w f 1 x + 1 w f 2 ( x ) ,
By adding loop statements, conducting a traversal search for w, and solving the model, a varying number of Pareto-optimal weight solutions can be obtained, and the most reasonable optimal solution can be selected manually according to the actual situation of the study area and the expectation of the target.

2.3. Study Area

The Changji Hui Autonomous Prefecture, with a total area of 73,500 km2 and a total population of 1,613,600, is on the northern slope of the Tianshan Mountain Economic Belt and Wu–Chang–Shi city cluster. Changji is rich in natural resources. Predicted coal reserves reach 573.2 billion tons, accounting for 26% and 12% of Xinjiang and China, respectively. Changji has a heavy industrial structure, including the coal power–coal chemical industry, mechanical and electrical equipment manufacturing, non-ferrous metal processing, and agricultural and sideline product utilization and deep processing. The enrichment of coal resources and development of the coal power–coal chemical industry control the coal-based energy consumption structure in Changji. The development potential of wind, solar, and water energy resources is huge, but the production and consumption of renewable energy account for relatively low proportions. Changji has a high energy consumption intensity (six times the national average), facing greater pressure of energy conservation and emission reduction. Changji is under great pressure with respect to the reduction in emissions of major air pollutants such as PM2.5, PM10, and NOX. The average number of days with a good ambient air quality of Changji is 278 days (accounting for 76.2%), 10% lower than the national average. Changji faces severe challenges with respect to the prevention and control of air pollution.

2.4. Data Sources

According to the research needs and model requirements, the data required for this study can be divided into three categories: socioeconomic, energy supply and consumption, and air pollution emission. Socioeconomic data are available on the official website of Changji’s government (http://www.cj.gov.cn/ (accessed on 4 September 2023). Energy supply and consumption data can be obtained from the Statistical Bulletin of National Economic and Social Development of Changji and field investigations from local administrative departments. Air pollution emission data can be obtained from the 2019 Air Pollutant Source Emission Inventory of Changji.

3. Results and Discussion

3.1. Projection of Coal Reduction Targets

3.1.1. Projection of Coal Consumption Trends

Based on the extended IPAT model, it has been projected that the total energy consumption in the study area will continue to increase annually from 2021 to 2030, with an average annual growth rate of 0.64%. The total energy consumption is estimated to reach 49.567 and 51.180 Mtce by 2025 and 2030, respectively. The energy-dependent industrial economic structure and rigid demand for energy consumption will promote a continuous increase in regional energy consumption. Due to significant tightening on the incremental energy consumption control targets in Xinjiang, the predicted annual growth rate of 0.64% of the total energy consumption scheme agrees with the current and projected results for the study area, as well as with the results of previous research [34,35]. The coal consumption in the study area will reach 42.132 and 38.385 Mtce by 2025 and 2030, respectively.

3.1.2. Projection of Coal Reduction

The coal reduction in the study area was estimated to be 2.825 Mtce by 2025 and 6.572 Mtce by 2030.
In this scenario, the coal reduction amounts achieved by 2025 and 2030 are positive values, which meet the policy requirements with respect to the total quantity control of coal consumption. At the same time, tightening existing policies can provide pressure and impetus for industrial transformation and accelerate the improvement in green development. In general, the coal reduction goals we set to have high rationality and accessibility. The policy priority in the study area is to reduce total coal consumption annually, especially that of non-electric coal.

3.2. Design of the Coal Substitution Plan

3.2.1. Decomposition of Coal Consumption Reductions

To reduce coal consumption, the policy objective of energy transition each year was formulated using the fixed combustion sources of fossil fuels as adjustment objects. By 2022, the government of the study area had implemented a series of emission reduction measures for the four secondary emission sources of fixed fossil fuel combustion sources, including electric heating, industrial boiler, civil boiler, and civil combustion sources. With respect to electric heating sources, 100% of the generators in the region have achieved ultra-low emissions. With respect to industrial and civil boiler sources, the elimination and clean energy replacement of coal-fired boilers with capacities under 65 t/h should be completed by 2025. With respect to civil combustion sources, it is necessary to complete rural clean heating by 2025.
Based on the Air Pollutant Source Emission Inventory of 2019 of the study area, the maximum coal reductions in clean energy replacement for coal-fired boilers and rural clean heating by 2025 were 2.010 Mt (1.351 Mtce) under existing coal consumption control policies (Table 1). However, a gap of 1.474 Mtce of coal reductions remains to meet the coal consumption proportion target of 85% by 2025.
As generators of electric heating sources in the study area have ultra-low emissions, the marginal efficiency of continuing to implement air pollution emission reduction policies is low. Therefore, industrial boiler, civil boiler, and civil combustion sources were selected to implement more stringent measures to reduce coal that cannot be achieved through existing policies. The new measure was to substitute coal from newly increased energy consumption after the base year. As the energy consumption of the civil emission source (including civil combustion and civil boiler sources) is relatively stable and the expected increase is minimal, the total amount of coal replacement in the annual new energy consumption was assumed to originate from industrial boiler sources. Table 2 shows the detailed decomposition scheme of coal reduction tasks by 2025 and 2030 in the study area.
Table 3 shows the coal control plans for the study area by 2025 and 2030.

3.2.2. Design of the Coal Substitution Plan

At present, coal-to-gas and coal-to-electricity are the two major clean energy substitutions in northern China and the study area. Approximately 6.01 million m2 of household heating transitioned from coal to electricity during the “13th Five-Year Plan” period in the study area, and a total of 6.5 million m2 of household heating transitioned from coal to natural gas from 2014 to 2017. Therefore, a coal substitution plan was designed in this study (Table 4): 100% implementation of coal-to-electricity, 100% implementation of coal-to-gas, and partial implementation of coal-to-electricity and coal-to-gas.

3.3. Coal Substitution Path Optimization

3.3.1. Design of the Path Optimization Model

The two major clean energy substitutions, coal-to-electricity and coal-to-gas, have their own advantages and disadvantages in terms of economic costs and environmental benefits. Limited by the installed capacity and power generation of clean energy as well as the supply of natural gas, the task of replacing coal from civil emission and industrial boiler sources in the study area cannot be completed through single-mode coal-to-electricity or coal-to-gas transitions. Hence, a multi-objective optimization model was constructed to explore the most favorable approach for coal substitution, aiming at striking a balance between lower operation costs of coal substitution and higher reductions in air pollutants.

3.3.2. Objective Functions

Minimum economic costs. The optimal objective of economic costs is to minimize the increased operation costs of coal substitution:
m i n f 1 x = i = 1 I k = 1 K x i E i ω e P i e + 1 x i E i ω k P i k i = 1 I E i ω c P c ,
where f 1 x represents the net operating costs of coal substitution in the study area, in billions of CNY; i is the emission source (i = civil emission sources, industrial boiler sources); I is the number of emission sources; k is the utilization mode of natural gas (k = final consumption, heating); K is the number of natural gas utilization modes; x i is the coal-to-electricity ratio of emission source i, %; E i is the total coal consumption replaced by the emission source i, Mtce; ω e , ω k , and ω c are the conversion factors from electricity to coal equivalent (104 tce/108 kWh), from natural gas to coal equivalent of natural gas utilization mode k (104 tce/108 m3), and from raw coal to coal equivalent (104 tce/104 t), respectively; P i e , P i k , and P c are the electricity price of emission source i (CNY/kWh), gas price of utilization mode k (CNY/m3), and coal sales price (CNY/t), respectively.
Maximum environmental benefits. The optimal goal of environmental benefits is to maximize the emission reductions in six key air pollutants caused by coal consumption reduction:
m a x f 2 x = m = 1 M Q m i = 1 I m = 1 M 1 x i E i ω k μ i m ,
where f 2 x represents the emission reductions in six key air pollutants caused by coal consumption reductions in the study area, 104 t; m is the type of air pollutant (m = SO2, NOx, CO, VOCs, PM10, PM2.5); M is the number of air pollutant types; Q m is the emission reductions in air pollutants caused by coal reduction, 104 t; and μ i m is the amount of air pollutant m emitted by gas from the emission source i, g/m3. (As renewable energy does not produce air pollutants, air pollution emissions of coal-to-electricity of zero were assumed in this study. Emissions of air pollutants caused by coal-to-gas transition were derived from fuel consumers and corresponding emission factors).
The objective function is as follows:
m i n F x = m i n f 1 x ,   f 2 x ,
Based on Equation (8), after weighted processing:
m i n F x = w f 1 x + 1 w f 2 x ,
where m i n F x is the overall objective function, including the objects of minimum coal substitution costs and minimum incremental emissions of air pollutants caused by increased gas consumption (the object of maximum environmental benefits was transformed into the object of minimum incremental emissions of air pollutants).

3.3.3. Constraints

Constraint of renewable energy generation capacity. The cumulative power generation of renewable energy from emission sources cannot surpass the planned generation capacity of renewable energy in the study area. The types of renewable energy used here are related to the renewable energy generation structure of the local power grid. There are mainly two types of renewable energy used in the study area: solar energy and wind energy.
i = 1 I x i E i ω e W n e ,
where n represents the year (n = 2025, 2030), and W n e indicates the generation capacity of renewable energy for year n, 108 kWh.
Constraint of gas supply capacity. The supply of gas from different emission sources cannot exceed the designated supply capacity of gas in the study area.
i = 1 I k = 1 K 1 x i E i ω k W n g ,
where W n g is the supply capacity of gas for year n, 108 m3.
Constraint of equity. To ensure the equitable distribution of renewable energy electricity and natural gas from different emission sources while minimizing costs and preventing the one-sided allocation of renewable energy electricity/natural gas to emission sources with a higher coal substitution efficiency, the Gini coefficient was introduced to investigate the equity of power and gas supply:
i = 1 , i = 2 I i > i I x i E i ω e k = 1 K 1 x i E i ω k x i E i ω e k = 1 K 1 x i E i ω k I x i E i ω e k = 1 K 1 x i E i ω k ε ,
where ε is the Gini coefficient. The larger the Gini value, the greater the inequality in the electricity and gas supply. Based on the regulations of United Nations-related organizations, a Gini value of less than 0.2 indicates absolute equity, 0.2–0.3 denotes relative equity, 0.3–0.4 shows basic reasonableness, 0.4–0.5 means a great discrepancy, and >0.5 represents high inequity. As the Gini value of 0.4 is used internationally as the warning standard, the model assumes that ε = 0.4 is the upper limit of the constraint.
Constraint that the variable is a non-negative and non-limit value. The coal-to-electricity ratios from emission sources are greater than zero. As households and industries can independently choose the two major clean energy substitution modes according to their own conditions and preferences, it is not possible that all households and industries choose the single coal-to-electricity mode in the actual application process. Therefore, to remain realistic, the coal-to-electricity ratio from each emission source cannot exceed 0.9.
0 x i 0.9 ,   i

3.3.4. Analysis of Model Results

NumPy (the fundamental package for scientific computing in Python) was applied to program Equations (9)–(16). The results are shown in Figure 2.
In the 2025 scenario (Figure 2a), the following two satisfactory solutions were obtained based on the multi-objective optimization model: (1) when the coal substitution costs of objective 1 are CNY 1.520 billion, the air pollutant emission reductions in objective 2 are 199,864.200 tons, the proportion of coal-to-electricity for civil emission sources is 76.07%, and the proportion of coal-to-electricity for industrial boiler sources is 90.00%. (2) When the net operating costs of coal substitution are CNY 1.465 billion and the emission reductions in air pollutants are 199,813.625 t, the proportion of coal-to-electricity for civil emission sources is 90.00%, and the proportion of coal-to-electricity for industrial boiler sources is 83.74% (the third satisfactory solution shown in Figure 2a, that is, when the coal substitution costs are CNY 1.309 billion, the air pollutant emission reductions are 196,047.000 tons, 90.00% of coal-to-electricity for civil emission sources, and 0.00% of coal-to-electricity for industrial boiler sources, was not adopted because it did not meet the constraint of equity). Considering that the study area belongs to a less developed region in China, the income of local residents is relatively low, the high economic costs of “coal-to-electricity” and “coal-to-gas” would pose a heavy burden. Therefore, we considered the minimum coal substitution costs as the dominant factor in selecting the optimal solution. The weight of the economic costs minimum objective function of the second satisfactory solution ranges between 1 and 20%, and its economic costs value is the lowest; hence the second satisfactory solution was selected as the optimal solution.
In the 2030 scenario (Figure 2b), the following two satisfactory solutions were obtained based on the multi-objective optimization model: (1) when the coal substitution costs of objective 1 are CNY 4.063 billion, the air pollutant emission reductions in objective 2 are 198,025.960 t, the proportion of coal-to-electricity for civil emission sources is 17.14%, and the proportion of coal-to-electricity for industrial boiler sources is 90.00%. (2) When the net operating costs of coal substitution are CNY 3.777 billion and the emission reductions in air pollutants are 197,758.175 t, the proportion of coal-to-electricity for civil emission sources is 90.00%, and the proportion of coal-to-electricity for industrial boiler sources is 78.80% (the third satisfactory solution shown in Figure 2b, that is, when the coal substitution costs are CNY 3.551 billion, the air pollutant emission reductions are 192,306.778 tons, 90.00% of coal-to-electricity for the civil emission sources, and 37.33% of coal-to-electricity for the industrial boiler sources, was not adopted because it did not meet the constraint of equity). The most important development obejective by 2035 in the study area would still be increasing the income of local residents, hence reducing the impact of economic costs on the residents remains the main consideration in the selection of the optimal coal alternative path in 2030. Therefore, the second satisfactory solution was selected as the optimal solution.
Previous research has shown that regional variations existed in the selection of a coal reduction approach for rural clean heating in Beijing–Tianjin–Hebei and surrounding areas in 2018. The coal-to-gas mode is prevalent in Hebei, accounting for 91% of the province’s clean energy substitutions. The coal-to-electricity mode is favored in Beijing, Tianjin, and Henan, encompassing ~76%, 54%, and 72% of users in each area, respectively [36].
It can be concluded that the results of the optimal coal substitution path by 2025 and 2030 in the study area obtained by the multi-objective optimization model are credible. Firstly, the study area boasts favorable conditions for renewable energy resources such as wind and solar energy. This is evidenced by the construction of a new energy infrastructure with a capacity of 10 million kW for wind and photovoltaic energy, indicating a substantial potential for further development and utilization. Secondly, it is unlikely that the supply and demand capacity of natural gas in the study area can be greatly improved in the near future, and the planning and promotion of coal-to-gas transition are rational and prudent.
In accordance with this optimal coal substitution plan, Table 5 shows the projected coal reductions in the study area for 2025 and 2030, along with anticipated increments of natural gas and electricity by sources. To secure a steady supply of clean energy, it is imperative to develop clean energy, strengthen the construction of peak load capacity, promote the systematic growth of distributed photovoltaic power generation, broaden the channels of wind energy and solar energy consumption, and expand the local consumption capacity in the study area.

3.4. Estimation of the Emission Reduction Potential of Air Pollutants

The emissions of six key air pollutants such as SO2, NOX, CO, VOCs, PM10, and PM2.5 in the study area decrease significantly under the optimal coal substitution path (Table S4).
Particulate matter, SO2, and CO display the largest cumulative emission reductions. As neither renewable energy nor natural gas emit particulate matter and SO2, civil emission and industrial boiler sources can achieve near-zero particulate matter emissions by 2025 (PM10 emissions could be declined by 98.67% while PM2.5 emissions by 99.38%), and SO2 emissions can be reduced by 86.62% compared with that in 2019. In addition, although CO is also emitted during gas usage, the emission reduction potential for CO remains huge considering that CO’s emission factor of coal is much higher than that of gas. By 2025, CO emissions from civil emission and industrial boiler sources can be reduced by 91.23% compared with 2019. By 2030, CO emissions may slightly rebound with the increase in gas consumption, but a reduction rate of 90.71% can still be achieved.
The emission reduction effects of volatile organic compounds (VOCs) and NOX are also noteworthy. By 2025, the VOCs and NOX emissions from civil emission and industrial boiler sources can be reduced by 53.99% and 54.58%, respectively, compared with the levels observed in 2019. By 2030, although VOCs and NOX emissions are projected to increase due to higher gas consumption, reduction rates of 52.20% and 41.74% can be accomplished, respectively.
Xue et al. reported that it may be possible to reduce NOX and other air pollutant emissions by 94% and 90% by 2030, respectively, if advanced flue gas purification technologies are implemented and natural gas is used to replace coal in most existing industrial coal-fired boilers in Beijing [37], which is consistent with our results: once the clean energy substitution of existing industrial boiler capacities is complete, NOX and other air pollutant emissions can be reduced by 97.01% and 99.45%, respectively. The higher results obtained in this study are due to the lower coal-to-gas ratio in existing industrial boilers (16.06%), as the other 83.94% of industrial boilers use renewable energy to replace coal power generation, which is cleaner than natural gas.
Analysis of the emission reduction potential of civil sources in each district under the optimal coal substitution path: the results show that taking coal substitution action with respect to civil sources can lead to significant reductions in the emissions of six key air pollutants and a notable improvement in ambient air quality (Table S5).
Our results indicate that it is possible to attain a 100.00% reduction in SO2, VOCs, and particulate matter emissions compared with the reference year of 2019. Furthermore, NOX emissions from civil combustion and civil boiler sources can be reduced by 93.86% and 98.70%, respectively. Compared with 2019 levels, CO emissions from civil combustion and civil boiler sources can be reduced by 99.95% and 99.54%, respectively.
Therefore, due to high environmental benefits, energy transition actions, such as promoting rural clean heating and the clean energy substitution of industrial boilers, should be supported and implemented.
“Coal-to-electricity” and “coal-to-gas” policies could reduce air pollutants. Considering the substitution conditions (clean energy supply) and economic factors in different regions, the coal substitution policy is feasible for coal resource-based cities. From the perspective of China, the policy of “coal-to-electricity” and “coal-to-gas” can not only reduce coal consumption but also ensure economic growth, which is a reliable policy path.

4. Conclusions

To reduce the coal consumption in Changji to 85% by 2025, the coal consumption must be decreased by 2.82 Mt compared with 2020. To decrease the coal consumption in Changji to 75% by 2030, the coal consumption must be reduced by 10.02 Mt compared with 2020.
The optimal 2025 coal substitution path is 90.00% coal-to-electricity and 10.00% coal-to-gas for civil emission sources, as well as 83.94% coal-to-electricity and 16.06% coal-to-gas for industrial boiler emission sources. Under the above-mentioned path, zero emissions of particle matter could be achieved. The emissions of SO2, CO, NOX, and VOCs can be reduced by 86.62%, 91.23%, 54.58%, and 53.99%, respectively, compared with 2019.
The optimal 2030 coal substitution path is 90.00% coal-to-electricity and 10.00% coal-to-gas for civil emission sources, as well as 78.80% coal-to-electricity and 21.20% coal-to-gas for industrial boiler emission sources. Under this path, CO, VOCs, and NOX emissions can be reduced by 90.71%, 52.20%, and 41.74%, respectively, compared with 2019.
In this study, a bottom-up strategy was adopted to estimate the maximum emission reduction in air pollutants based on households and boiler data obtained from the Air Pollutant Source Emission Inventory, but it failed to link with ambient air quality by simulating concentration changes in six key air pollutants. In the future, the grid allocation of emission reduction to specific emission sources should be considered, and air quality models such as WRF-CAMx and diffusion models should be applied to project concentration change trends of the six key air pollutants, so as to obtain the improvement degree of regional air quality.

Supplementary Materials

The following supporting information can be downloaded at: https://www.mdpi.com/article/10.3390/su152115448/s1. Table S1: Electricity and natural gas prices of civil sources in the study area; Table S2: Electricity and natural gas prices of industrial boiler sources in the study area; Table S3: Sales price of coal in the study area; Table S4: Emission reduction potential under the optimal coal substitution path; Table S5: Emission reduction potential of civil sources under the optimal coal substitution path.

Author Contributions

Conceptualization, J.W. and H.L.; data curation, Q.F. and X.Z.; formal analysis, J.W. and N.W.; investigation, J.W. and Q.F.; methodology, J.W. and Z.F.; resources, Z.Z.; software, J.W. and C.D.; visualization, C.D.; writing—original draft, J.W.; writing—review and editing, J.W. All authors have read and agreed to the published version of the manuscript.

Funding

This research was funded by the Fundamental Research Funds for the Central Public-Interest Scientific Institution, Chinese Research Academy of Environmental Sciences (2022YSKY-68).

Institutional Review Board Statement

Not applicable.

Informed Consent Statement

Not applicable.

Data Availability Statement

Details about data sources are provided in the Supplementary Materials.

Conflicts of Interest

The authors declare no conflict of interest.

References

  1. Yu, J.; Li, J.; Zhang, W. Identification and Classification of Resource-Based Cities in China. Acta Geogr. Sin. 2018, 73, 677–687. [Google Scholar] [CrossRef]
  2. Long, R.; Li, H.; Wu, M.; Li, W. Dynamic Evaluation of the Green Development Level of China’s Coal-Resource-Based Cities Using the TOPSIS Method. Resour. Policy 2021, 74, 102415. [Google Scholar] [CrossRef]
  3. Martirosyan, A.V.; Ilyushin, Y.V. The Development of the Toxic and Flammable Gases Concentration Monitoring System for Coalmines. Energies 2022, 15, 8917. [Google Scholar] [CrossRef]
  4. Bosikov, I.I.; Martyushev, N.V.; Klyuev, R.V.; Savchenko, I.A.; Kukartsev, V.V.; Kukartsev, V.A.; Tynchenko, Y.A. Modeling and Complex Analysis of the Topology Parameters of Ventilation Networks When Ensuring Fire Safety While Developing Coal and Gas Deposits. Fire 2023, 6, 95. [Google Scholar] [CrossRef]
  5. Malozyomov, B.V.; Golik, V.I.; Brigida, V.; Kukartsev, V.V.; Tynchenko, Y.A.; Boyko, A.A.; Tynchenko, S.V. Substantiation of Drilling Parameters for Undermined Drainage Boreholes for Increasing Methane Production from Unconventional Coal-Gas Collectors. Energies 2023, 16, 4276. [Google Scholar] [CrossRef]
  6. Lyu, W.; Li, Y.; Guan, D.; Zhao, H.; Zhang, Q.; Liu, Z. Driving Forces of Chinese Primary Air Pollution Emissions: An Index Decomposition Analysis. J. Clean. Prod. 2016, 133, 136–144. [Google Scholar] [CrossRef]
  7. Xu, C.; Zhao, W.; Zhang, M.; Cheng, B. Pollution Haven or Halo? The Role of the Energy Transition in the Impact of FDI on SO2 Emissions. Sci. Total Environ. 2021, 763, 143002. [Google Scholar] [CrossRef]
  8. Wu, L.; Sun, L.; Qi, P.; Ren, X.; Sun, X. Energy Endowment, Industrial Structure Upgrading, and CO2 Emissions in China: Revisiting Resource Curse in the Context of Carbon Emissions. Resour. Policy 2021, 74, 102329. [Google Scholar] [CrossRef]
  9. Kostakis, I.; Arauzo-Carod, J.-M. The Key Roles of Renewable Energy and Economic Growth in Disaggregated Environmental Degradation: Evidence from Highly Developed, Heterogeneous and Cross-Correlated Countries. Renew. Energy 2023, 206, 1315–1325. [Google Scholar] [CrossRef]
  10. Zhang, Z.; Wang, W.; Cheng, M.; Liu, S.; Xu, J.; He, Y.; Meng, F. The Contribution of Residential Coal Combustion to PM2.5 Pollution over China’s Beijing-Tianjin-Hebei Region in Winter. Atmos. Environ. 2017, 159, 147–161. [Google Scholar] [CrossRef]
  11. Huang, Q.; Cheng, S.; Perozzi, R.E.; Perozzi, E.F. Use of a MM5–CAMx–PSAT Modeling System to Study SO2 Source Apportionment in the Beijing Metropolitan Region. Environ. Model. Assess. 2012, 17, 527–538. [Google Scholar] [CrossRef]
  12. Barrington-Leigh, C.; Baumgartner, J.; Carter, E.; Robinson, B.E.; Tao, S.; Zhang, Y. An Evaluation of Air Quality, Home Heating and Well-Being under Beijing’s Programme to Eliminate Household Coal Use. Nat. Energy 2019, 4, 416–423. [Google Scholar] [CrossRef]
  13. Zhou, M.; Liu, H.; Peng, L.; Qin, Y.; Chen, D.; Zhang, L.; Mauzerall, D.L. Environmental Benefits and Household Costs of Clean Heating Options in Northern China. Nat. Sustain. 2022, 5, 329–338. [Google Scholar] [CrossRef]
  14. Liu, J.; Mauzerall, D.L.; Chen, Q.; Zhang, Q.; Song, Y.; Peng, W.; Klimont, Z.; Qiu, X.; Zhang, S.; Hu, M.; et al. Air Pollutant Emissions from Chinese Households: A Major and Underappreciated Ambient Pollution Source. Proc. Natl. Acad. Sci. USA 2016, 113, 7756–7761. [Google Scholar] [CrossRef]
  15. Meng, W.; Zhong, Q.; Chen, Y.; Shen, H.; Yun, X.; Smith, K.R.; Li, B.; Liu, J.; Wang, X.; Ma, J.; et al. Energy and Air Pollution Benefits of Household Fuel Policies in Northern China. Proc. Natl. Acad. Sci. USA 2019, 116, 16773–16780. [Google Scholar] [CrossRef] [PubMed]
  16. Markandya, A.; Sampedro, J.; Smith, S.J.; Van Dingenen, R.; Pizarro-Irizar, C.; Arto, I.; González-Eguino, M. Health Co-Benefits from Air Pollution and Mitigation Costs of the Paris Agreement: A Modelling Study. Lancet Planet. Health 2018, 2, e126–e133. [Google Scholar] [CrossRef] [PubMed]
  17. Zhang, X.; Jin, Y.; Dai, H.; Xie, Y.; Zhang, S. Health and Economic Benefits of Cleaner Residential Heating in the Beijing–Tianjin–Hebei Region in China. Energy Policy 2019, 127, 165–178. [Google Scholar] [CrossRef]
  18. Liu, M.; Lei, Y.; Wang, X.; Xue, W.; Zhang, W.; Jiang, H.; Wang, J.; Bi, J. Source Contributions to PM2.5-Related Mortality and Costs: Evidence for Emission Allocation and Compensation Strategies in China. Environ. Sci. Technol. 2023, 57, 4720–4731. [Google Scholar] [CrossRef]
  19. Wang, J.; Zhong, H.; Yang, Z.; Wang, M.; Kammen, D.M.; Liu, Z.; Ma, Z.; Xia, Q.; Kang, C. Exploring the Trade-Offs between Electric Heating Policy and Carbon Mitigation in China. Nat. Commun. 2020, 11, 6054. [Google Scholar] [CrossRef]
  20. Liu, H.; Mauzerall, D.L. Costs of Clean Heating in China: Evidence from Rural Households in the Beijing-Tianjin-Hebei Region. Energy Econ. 2020, 90, 104844. [Google Scholar] [CrossRef]
  21. Gao, J.; Yuan, Z.; Liu, X.; Xia, X.; Huang, X.; Dong, Z. Improving Air Pollution Control Policy in China—A Perspective Based on Cost–Benefit Analysis. Sci. Total Environ. 2016, 543, 307–314. [Google Scholar] [CrossRef] [PubMed]
  22. Wang, K.; Tong, Y.; Yue, T.; Gao, J.; Wang, C.; Zuo, P.; Liu, J. Measure-Specific Environmental Benefits of Air Pollution Control for Coal-Fired Industrial Boilers in China from 2015 to 2017. Environ. Pollut. 2021, 273, 116470. [Google Scholar] [CrossRef] [PubMed]
  23. Zhao, Q.; Zhao, J.; Zhang, W.; Hu, X.; Zhang, J.; Xue, W.; Jiang, L.; Zhang, J.; Liu, X.; Jiang, H.; et al. Revealing Inter-Regional Environmental Inequities Hidden in China’s Energy Transition. Environ. Sci. Technol. 2023, 57, 11852–11862. [Google Scholar] [CrossRef] [PubMed]
  24. Ehrlich, P.; Holdren, J. Impact of Population Growth. Science 1971, 171, 1212–1217. [Google Scholar] [CrossRef] [PubMed]
  25. Roca, J. The IPAT Formula and Its Limitations. Ecol. Econ. 2002, 42, 1–2. [Google Scholar] [CrossRef]
  26. Chontanawat, J. Decomposition Analysis of CO2 Emission in ASEAN: An Extended IPAT Model. Energy Procedia 2018, 153, 186–190. [Google Scholar] [CrossRef]
  27. Cansino, J.M.; Sánchez-Braza, A.; Rodríguez-Arévalo, M.L. Driving Forces of Spain’s CO2 Emissions: A LMDI Decomposition Approach. Renew. Sustain. Energy Rev. 2015, 48, 749–759. [Google Scholar] [CrossRef]
  28. Ul Hassan Shah, W.; Zhu, N.; Hao, G.; Yan, H.; Yasmeen, R. Energy Efficiency Evaluation, Technology Gap Ratio, and Determinants of Energy Productivity Change in Developed and Developing G20 Economies: DEA Super-SBM and MLI Approaches. Gondwana Res. 2024, 125, 70–81. [Google Scholar] [CrossRef]
  29. Coello Coello, C.A.; Lamont, G.B.; Van Veldhuizen, D.A. Evolutionary Algorithms for Solving Multi-Objective Problems; Genetic and Evolutionary Computation; Springer: New York, NY, USA, 2007; ISBN 978-0-387-33254-3. [Google Scholar]
  30. Sharafi, M.; ELMekkawy, T.Y. Multi-Objective Optimal Design of Hybrid Renewable Energy Systems Using PSO-Simulation Based Approach. Renew. Energy 2014, 68, 67–79. [Google Scholar] [CrossRef]
  31. Mayer, M.J.; Szilágyi, A.; Gróf, G. Environmental and Economic Multi-Objective Optimization of a Household Level Hybrid Renewable Energy System by Genetic Algorithm. Appl. Energy 2020, 269, 115058. [Google Scholar] [CrossRef]
  32. Abdullah, M.A.; Muttaqi, K.M.; Agalgaonkar, A.P. Sustainable Energy System Design with Distributed Renewable Resources Considering Economic, Environmental and Uncertainty Aspects. Renew. Energy 2015, 78, 165–172. [Google Scholar] [CrossRef]
  33. Zhao, R.; Liu, Y.; Zhang, N.; Huang, T. An Optimization Model for Green Supply Chain Management by Using a Big Data Analytic Approach. J. Clean. Prod. 2017, 142, 1085–1097. [Google Scholar] [CrossRef]
  34. Zhou, C.; Chen, X. Predicting Energy Consumption: A Multiple Decomposition-Ensemble Approach. Energy 2019, 189, 116045. [Google Scholar] [CrossRef]
  35. Wang, M.; Wang, W.; Wu, L. Application of a New Grey Multivariate Forecasting Model in the Forecasting of Energy Consumption in 7 Regions of China. Energy 2022, 243, 123024. [Google Scholar] [CrossRef]
  36. He, K.; Li, X. China Dispersed Coal Governance Report 2018; Natural Resources Defense Council: Beijing, China, 2018. [Google Scholar]
  37. Xue, Y.; Tian, H.; Yan, J.; Zhou, Z.; Wang, J.; Nie, L.; Pan, T.; Zhou, J.; Hua, S.; Wang, Y.; et al. Temporal Trends and Spatial Variation Characteristics of Primary Air Pollutants Emissions from Coal-Fired Industrial Boilers in Beijing, China. Environ. Pollut. 2016, 213, 717–726. [Google Scholar] [CrossRef] [PubMed]
Figure 1. Research framework.
Sustainability 15 15448 g001
Figure 2. Cost–benefit results for different coal substitution paths (a) by 2025 and (b) by 2030.
Sustainability 15 15448 g002
Table 1. Maximum coal reductions from the fixed fossil fuel combustion sources under existing coal control policies in the study area.
Primary Emission SourceSecondary Emission SourcesPolicy ObjectivesBoilers/Households InvolvedCoal Reductions (Mt)
Fixed fossil fuel combustion sourcesCivil combustionAll rural households achieve clean heating by 2025.132,1831.06
Civil boilerExisting coal-fired civil boilers with capacities under 65 t/h complete clean energy replacement by 2025.5270.22
Industrial boiler1500.73
Total-2.01
Table 2. Coal reduction task decomposition scheme for the study area.
YearSecondary Emission SourcesPolicy ObjectivesBoilers/Households InvolvedCoal Reductions in Existing Capacity
(Mt)
Coal Substitutions in New Capacity
(Mt)
2025Civil combustion100% complete.132,1831.060
Civil boiler5270.220
Industrial boiler100% complete, a portion of newly increased energy consumption will be supplied by clean energy from 2021.1500.732.26
2030Civil combustion-000
Civil boiler000
Industrial boilerA portion of newly increased energy consumption will be supplied by clean energy.008.01
Table 3. Coal control plans for the study area.
YearMaximum Coal ReductionsCivil SourcesIndustrial BoilerElectric HeatingTotal
Civil CombustionCivil Boiler
2025Coal reductions in existing capacityMt1.060.220.730.002.01
Mtce0.730.150.480.001.35
Coal substitutions in new capacityMt0.000.002.260.002.26
Mtce0.000.001.470.001.47
TotalMt4.27
Mtce2.82
2030Coal reductions in existing capacityMt1.060.220.730.002.01
Mtce0.730.150.480.001.35
Coal substitutions in new capacityMt0.000.008.010.008.01
Mtce0.000.005.220.005.22
TotalMt10.02
Mtce6.57
Table 4. Design of a coal substitution plan for the study area.
Clean Energy SubstitutionSubstitution Plan
100% Coal-to-Electricity100% Coal-to-GasPartial Coal-to-Electricity and Coal-to-Gas
Incremental operation costs of coal substitutionCoal reductions × electricity priceCoal reductions × gas priceCoal-to-electricity ratio × coal reductions × electricity price + coal-to-gas ratio × coal reductions × gas price
Savings of coal substitutionCoal reductions × coal sales price
Net incremental operation costs of coal substitutionIncremental operation costs of coal substitution—savings of coal substitution
Emission reduction potential of air pollutantsEmission reductions in air pollutants from coal reductionEmission reductions in air pollutants from coal reduction—emission increments in air pollutants from increased gas consumptionEmission reductions in air pollutants from coal reduction—coal-to-gas ratio × emission increments in air pollutants from increased gas consumption
Table 5. Energy consumption projections for 2025 and 2030 in the study area.
Year20252030
Clean energy substitutionCivil sources90.00% electricity
10.00% gas
90.00% electricity
10.00% gas
Industrial boiler sources83.94% electricity
16.06% gas
78.80% electricity
21.20% gas
Coal reductions
(compared with 2020; Mt)
4.2710.02
Incremental gas
(million m3)
Civil sources7373
Industrial boiler sources257991
Total3291063
Incremental electricity
(million kWh)
Civil sources26052605
Industrial boiler sources540814,837
Total801317,442
Disclaimer/Publisher’s Note: The statements, opinions and data contained in all publications are solely those of the individual author(s) and contributor(s) and not of MDPI and/or the editor(s). MDPI and/or the editor(s) disclaim responsibility for any injury to people or property resulting from any ideas, methods, instructions or products referred to in the content.

