Article

Traffic Calming Measures and Their Slowing Effect on the Pedestrian Refuge Approach Sections

by
Stanisław Majer
and
Alicja Sołowczuk
*
Department of Construction and Road Engineering, West Pomeranian University of Technology in Szczecin, 71-311 Szczecin, Poland
*
Author to whom correspondence should be addressed.
Sustainability 2023, 15(21), 15265; https://doi.org/10.3390/su152115265
Submission received: 13 September 2023 / Revised: 16 October 2023 / Accepted: 23 October 2023 / Published: 25 October 2023

Abstract

:
The ever-increasing use of motor vehicles causes a number of traffic safety and community issues, which are particularly severe in cities, accompanied by a scarcity of parking spaces and challenges encountered in road layout alteration projects. The commonly applied solutions include the designation of through streets, the implementation of on-street parking on residential streets, and retrofitted traffic calming measures (TCMs). This article presents the results of the study conducted on a two-way street where the Metered Parking System (MPS) was implemented together with diagonal and parallel parking spaces, refuge islands, horizontal deflection, and lane narrowing by a single-sided chicane. The aim of this study was to identify those TCMs that effectively helped to reduce the island approach speed. The heuristic method was applied to assess the effect of the respective TCMs on reducing the island approach speed, and the key speed reduction determinants were defined using a cause-and-effect diagram and a Pareto chart. The determinants were evaluated with the binary system and tautological inference principles, whereby a determinant was rated as true when it was found in the field, with a simultaneous speed reduction determined in the survey. Determinants that were not confirmed in the field were rated untrue. Comparative analyses were carried out to rate the respective TCMs as effective, moderately effective, or ineffective. In this way, the following three determinants were rated as the most important for speed reduction at refuge islands: free view, visibility of a pedestrian on the right-hand side of the island, and the refuge island surroundings. Although the study was limited to a single street in Poland, the findings may hold true in other countries where similar TCMs are used.

1. Introduction

The ever-increasing use of motor vehicles causes more and more severe traffic issues in urban areas in particular. Various traffic management measures are applied to address these issues, including the designation of urban transit routes, implementation of traffic calming schemes, parking planning, etc. A well-planned metered parking system requires a smooth coincidence of traffic calming plans with the planned parking spaces and carefully planned pedestrian mobility improvements. The design aspects of different traffic calming measures (TCMs) are laid out in the basic design guidelines [1,2,3,4,5]. TCMs include raised intersections, speed tables, narrowing the carriageway by chokers or pinch points, various speed humps, and speed bumps. Horizontal deflections are also applied in the planning of parking spaces depending on the parking configuration.
Elvik [6] suggests using a meta-analysis approach in designating urban transit routes or traffic calming zones to address the relevant traffic safety issues. These should lead to defining a hierarchical road system and moving through traffic out of the residential streets, thus improving traffic safety in these residential areas. Different approaches to urban traffic safety and traffic and parking resource management scenarios in metered parking settings are presented, for example, in [7,8,9,10]. It should be noted, though, that the issues tackled in these articles concern mainly parking in urban areas. A different TCM study approach, taking into account their effect on traffic performance, traffic safety, the natural environment, public health, and the economy, was presented in articles [11,12,13,14,15,16], showing that traffic calming has some undesirable effects as well. The group of TCMs that were found to have undesirable environmental effects included speed cushions, speed bumps, speed humps, and stop signs.

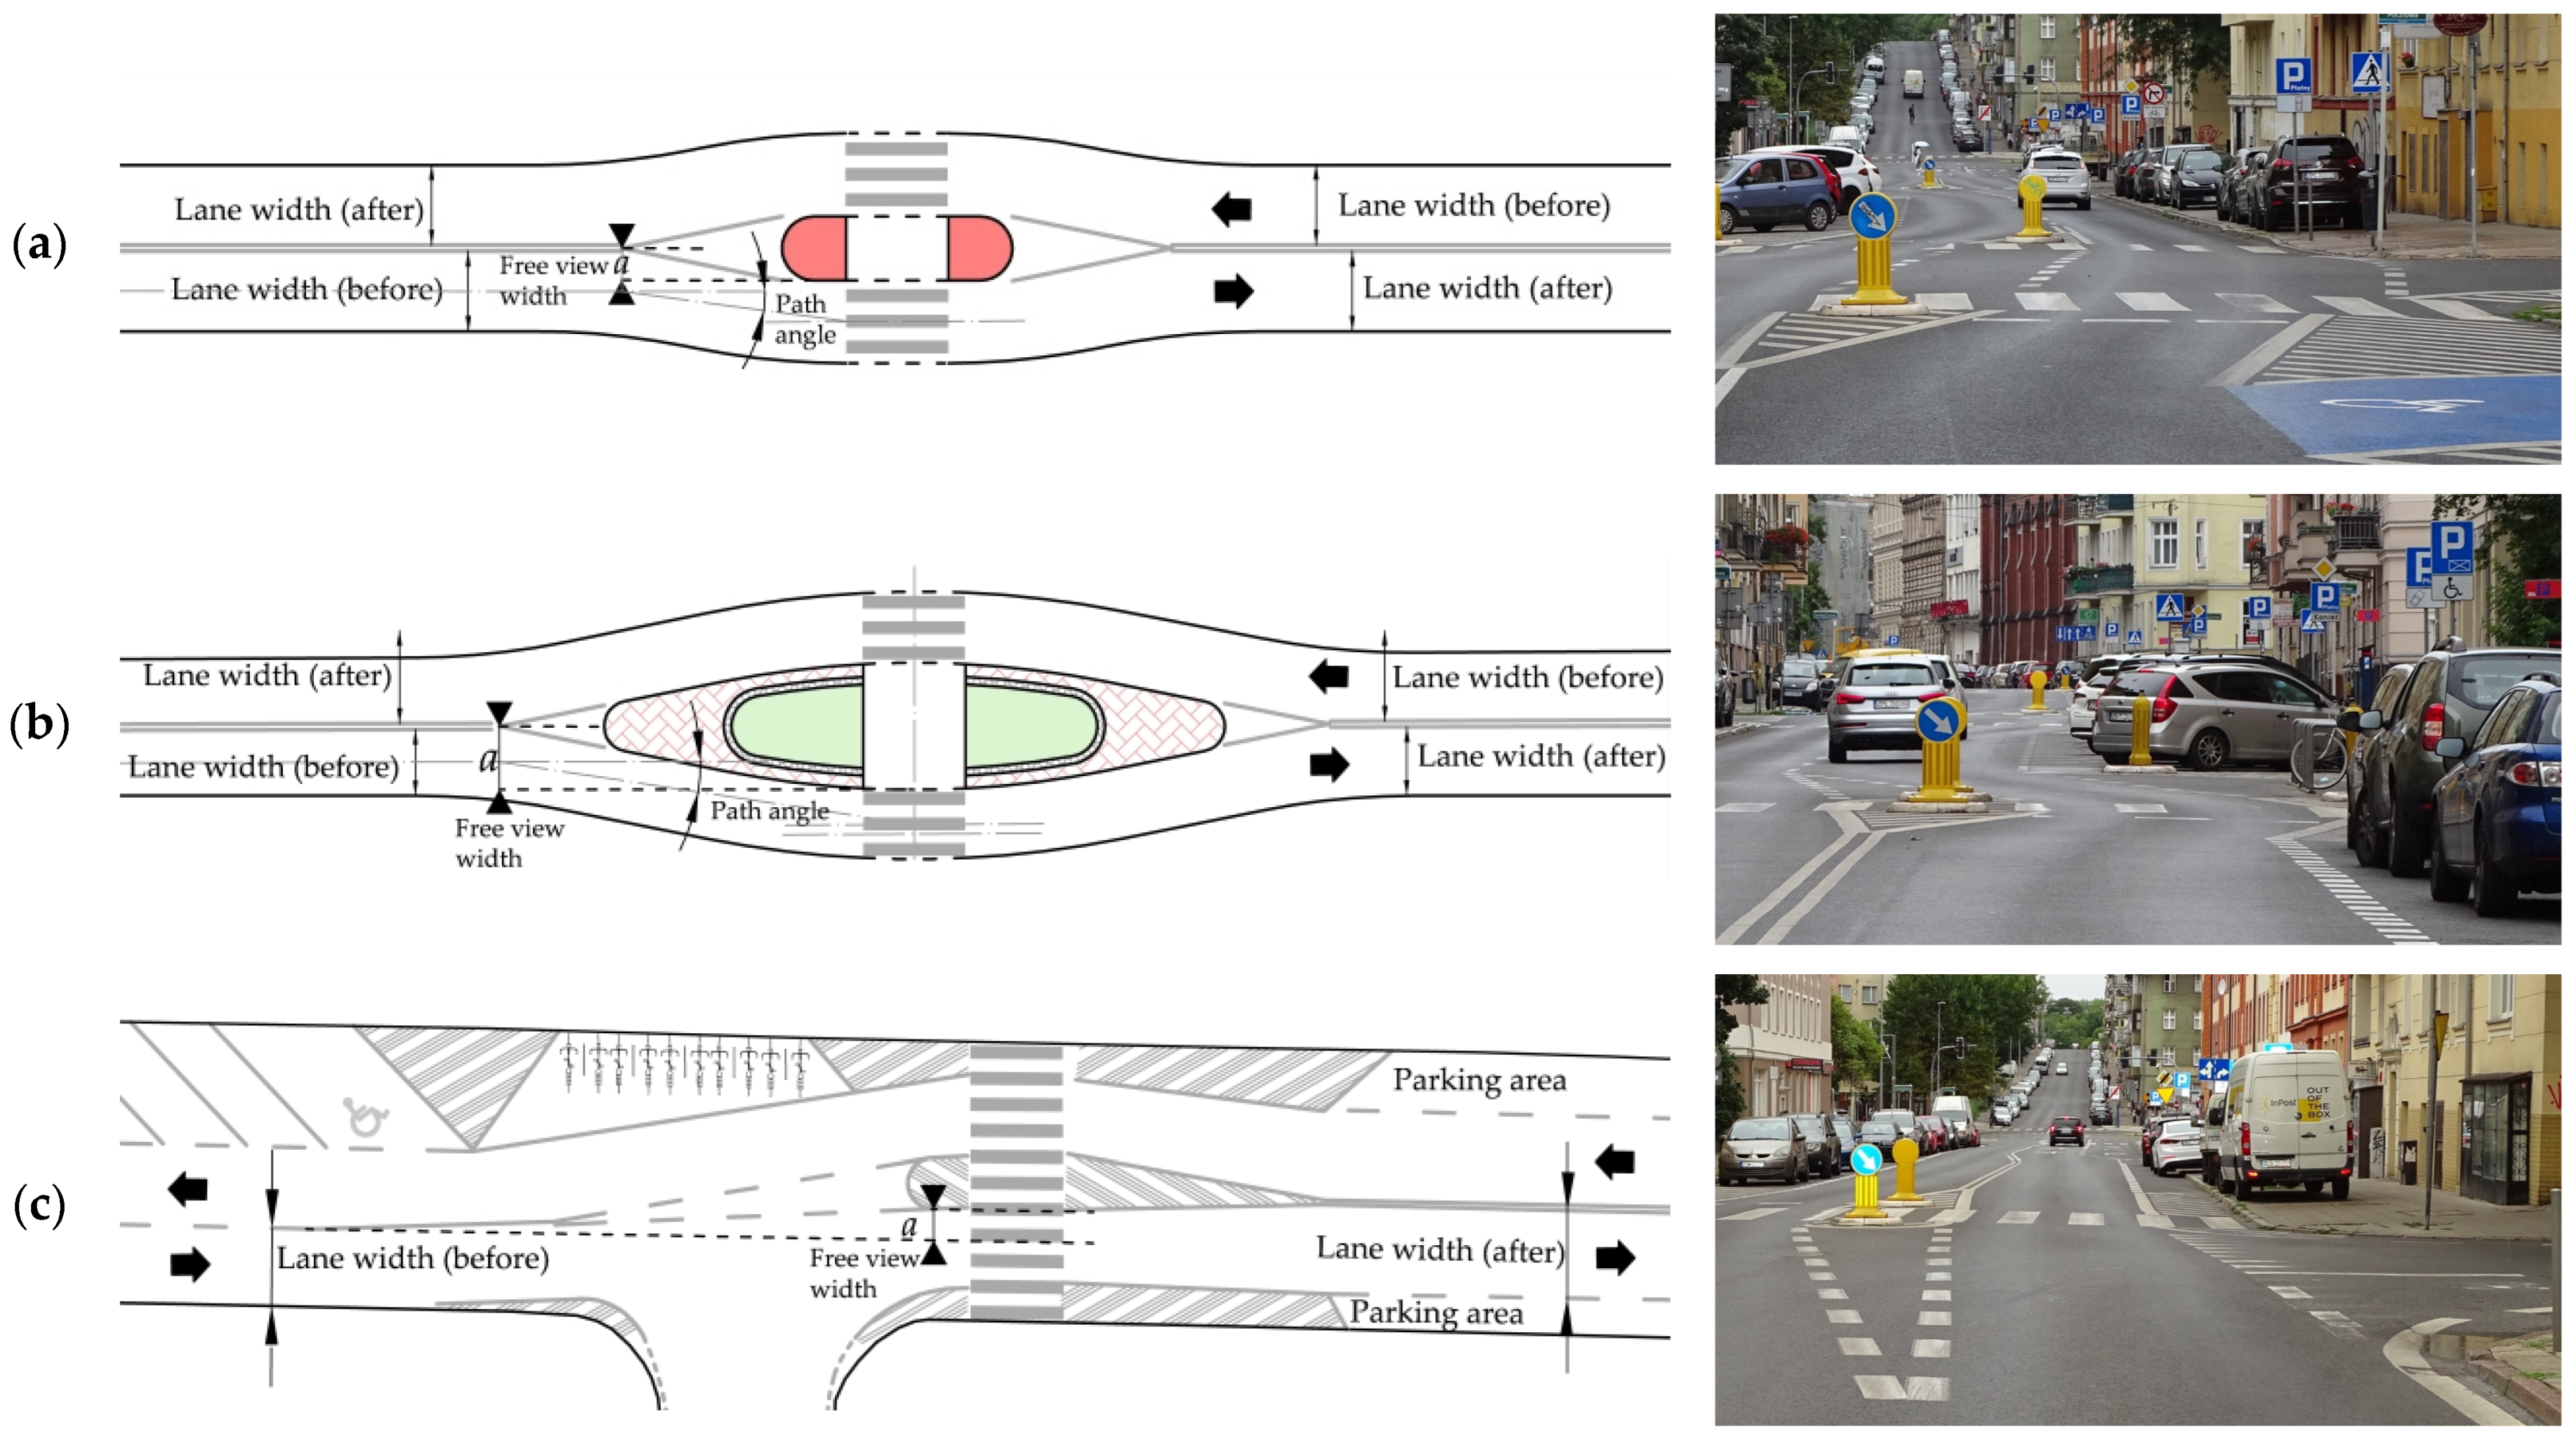
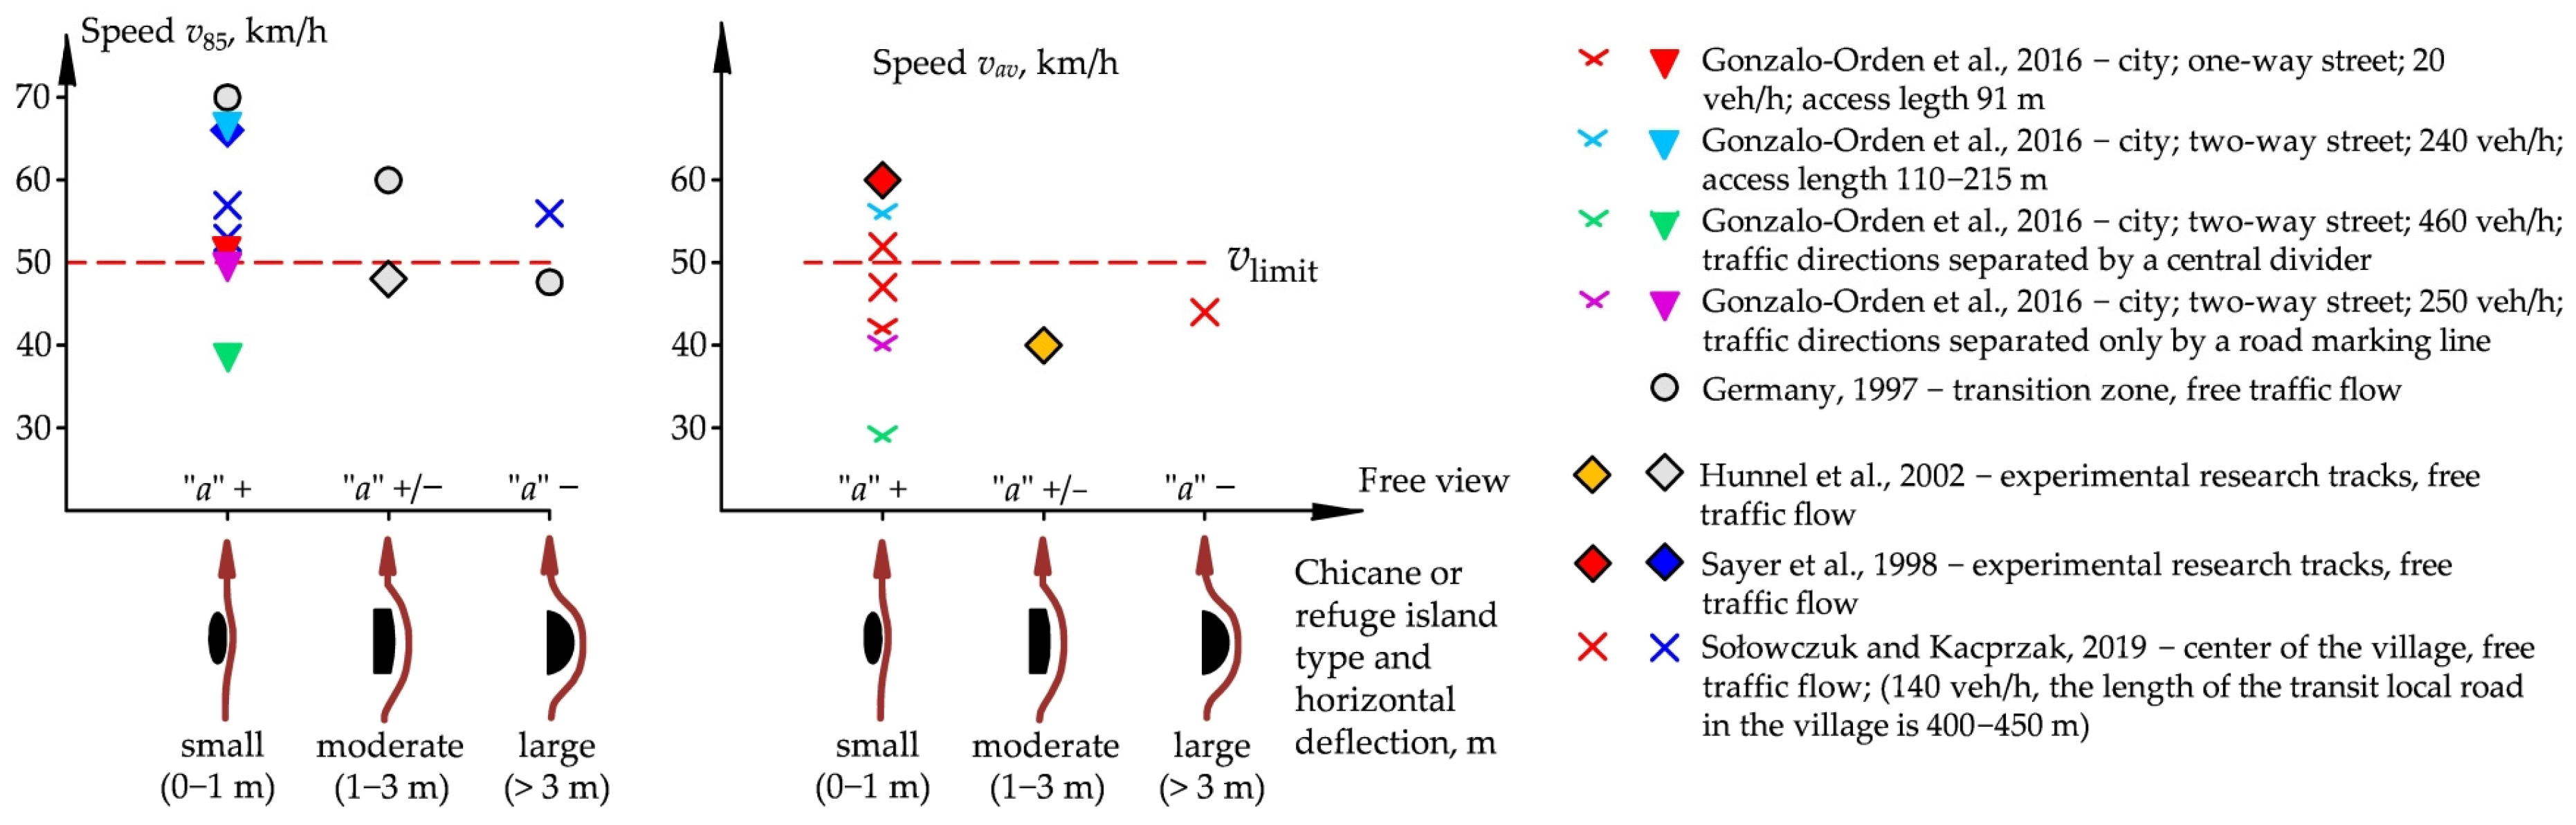
1.1. Review of Studies on the Speed-Reducing Effect of Horizontal Deflections Located on the Refuge Island Approach Sections

The efficacy of various TCMs used on city streets, i.e., their slowing effect, has been studied by many researchers. In most cases, these studies analyse TCMs in relation to traffic safety improvement [17,18,19,20]. The article by Le et al. [12] is different in this respect in that it also considers the environmental and public health impacts of the analysed TCMs.—the study involved in situ tests conducted using a special test vehicle. Le et al. [12] used a comparative analysis technique to demonstrate the superiority of chicanes among the analysed TCMs, except in terms of vehicle emissions. That said, most studies are limited to analysing the efficacy of speed humps, speed tables, and chicanes in terms of speed reduction on the approach to pedestrian crossings. Some authors took into account landscape features and visibility of the pedestrian crossing and the road ahead, relating the obtained speed reduction not only to the TCMs but also to various factors of the townscape surrounding the refuge island [21,22]. For example, Balant and Lep [22] analysed the improvement in community life thanks to the implemented traffic calming scheme. Other researchers noted the slowing effect of repeating the speed humps or speed tables and the length of slowed driving [23,24,25,26,27].
The efficacy of various TCMs was analysed, for example, by Gonzalo-Orden et al. [28]. They compared through comparative analyses the speed reductions obtained with the applied raised crossings, lane narrowings or chokers, speed cameras, and speed camera signs. These analyses led to the conclusion that the obtained speed reductions depended on the TCM type, its geometric features, and emplacement in the street. Distefano & Leonardii [29,30] arrived at similar conclusions on the efficacy of chicanes and horizontal deflections in city streets. They compared speed profiles (85th percentile and average values) on local streets before and after installation of speed tables and up to 1 m wide chicanes on a one-way street and road narrowing treatment accompanied by a horizontal deflection on a two-way street. The before-and-after study results presented by Distefano & Leonardi [29] show the highest percentage reduction of operating speed for a single-lane chicane installed on a narrow one-way street with an on-street parallel parking configuration. The lowest percentage reduction was, in turn, noted on a two-way street with a carriageway narrowing treatment on one side, accompanied by a horizontal deflection (with parallel on-street and pavement parking). In this case, very good visibility of the road past the narrowing treatment was ensured. Kruszyna & Matczuk-Pisarek [31] arrived at different conclusions in their study on speed reduction obtained with a refuge island, speed table on the approach section, or a raised pedestrian crossing. The comparative analyses showed that raised pedestrian crossings offered the highest speed reductions. Sołowczuk [32] studied speed reductions obtained with raised pedestrian crossings in a downtown Tempo 30 zone, relating the obtained values not only to the TCM geometry and the townscape surrounding the street but also to the specific traffic volume in a given street.
Akgol et al. [33] and Aydin et al. [34] conducted a driving simulator study to investigate the effect of chicanes installed near pedestrian crossings. The factors they considered in their study included the effective lane width, the shapes of islands, and vehicle trajectories. In conclusion [33], it is stated that effective speed reduction may be obtained with a set of three chicanes located at the refuge island on streets with a 3-m effective lane width or with a more economical option of two chicanes on streets with a 2.7-m effective lane width. Hussain et al. also used a driving simulator, yet with a different approach, as presented in their article [35] investigating the effect of roadway narrowing, horizontal deflection, and various road markings and upright signs. These studies confirmed the highest efficacy of road narrowing used in combination with horizontal deflection and carriageway narrowing obtained by zigzag markings or variable message signs.
The first study that related speed reduction to the travel path deflection by a median island or chicanes was conducted in the UK by Sayer and Parry [36,37]. In the test track trials, the test vehicles navigated through artificially simulated horizontal deflection and chicanes. Experienced drivers were employed for these trials. The output of the study confirmed that the primary speed reduction factors were the stagger length, free view through the chicane, deflected path angle, and the visual obstruction type (Figure 1). In this study, the free view width “a” had a positive value if the median island between opposing lanes allowed the driver to see the travel lane behind it at the road surface level. If, on the contrary, the driver approaching the island could not see the whole lane width at the road surface level past the island, “a” acquired a negative value. The wider the median island, and thus, the less of the travel lane at the road surface level was visible to the driver, the greater the obtained speed reduction. These findings were confirmed by Zhang et. al. [38], who, in addition, investigated reductions in noise and vehicle emissions.
The above literature review allowed us to compile in Figure 2 and compare the calculated 85th percentile and mean speeds noted just before the pedestrian crossing or chicane. Figure 2 shows a high degree of inconsistent data obtained by different researchers due to different locations (test tracks, transition zone, village centre, suburban two-lane, single-carriageway streets) and data selection. As regards the data selection, the researchers chose to analyse free traffic flow only or use the steady traffic flow data with varying hourly volumes and separately the free traffic flow data.

1.2. Review of Previous Before-And-After Speed Studies with the Use of the Heuristic Method

Heuristic methods are used in management analyses when dealing with complex situations and lots of information. They allow us to assess the efficacy of the analysed parameters based on the established determinants. The principles of this method were described by different scholars, including Juran (first edition in 1951) [41,42,43] and Deming [44] (first edition in 1982), and were elaborated by Kaoru Ishikawa, who proposed seven basic quality tools for the Total Quality Management (TQM) system [45,46,47] and their researchers [48,49,50,51,52,53]. Quality management principles may be used successfully for assessments of other issues, including road maintenance [54,55], road operating speed management [56,57,58,59,60], or very specific applications, such as analysing fluid velocity variations in medical equipment [61]. The seven tools developed by Kaoru Ishikawa [45,46,47] are:
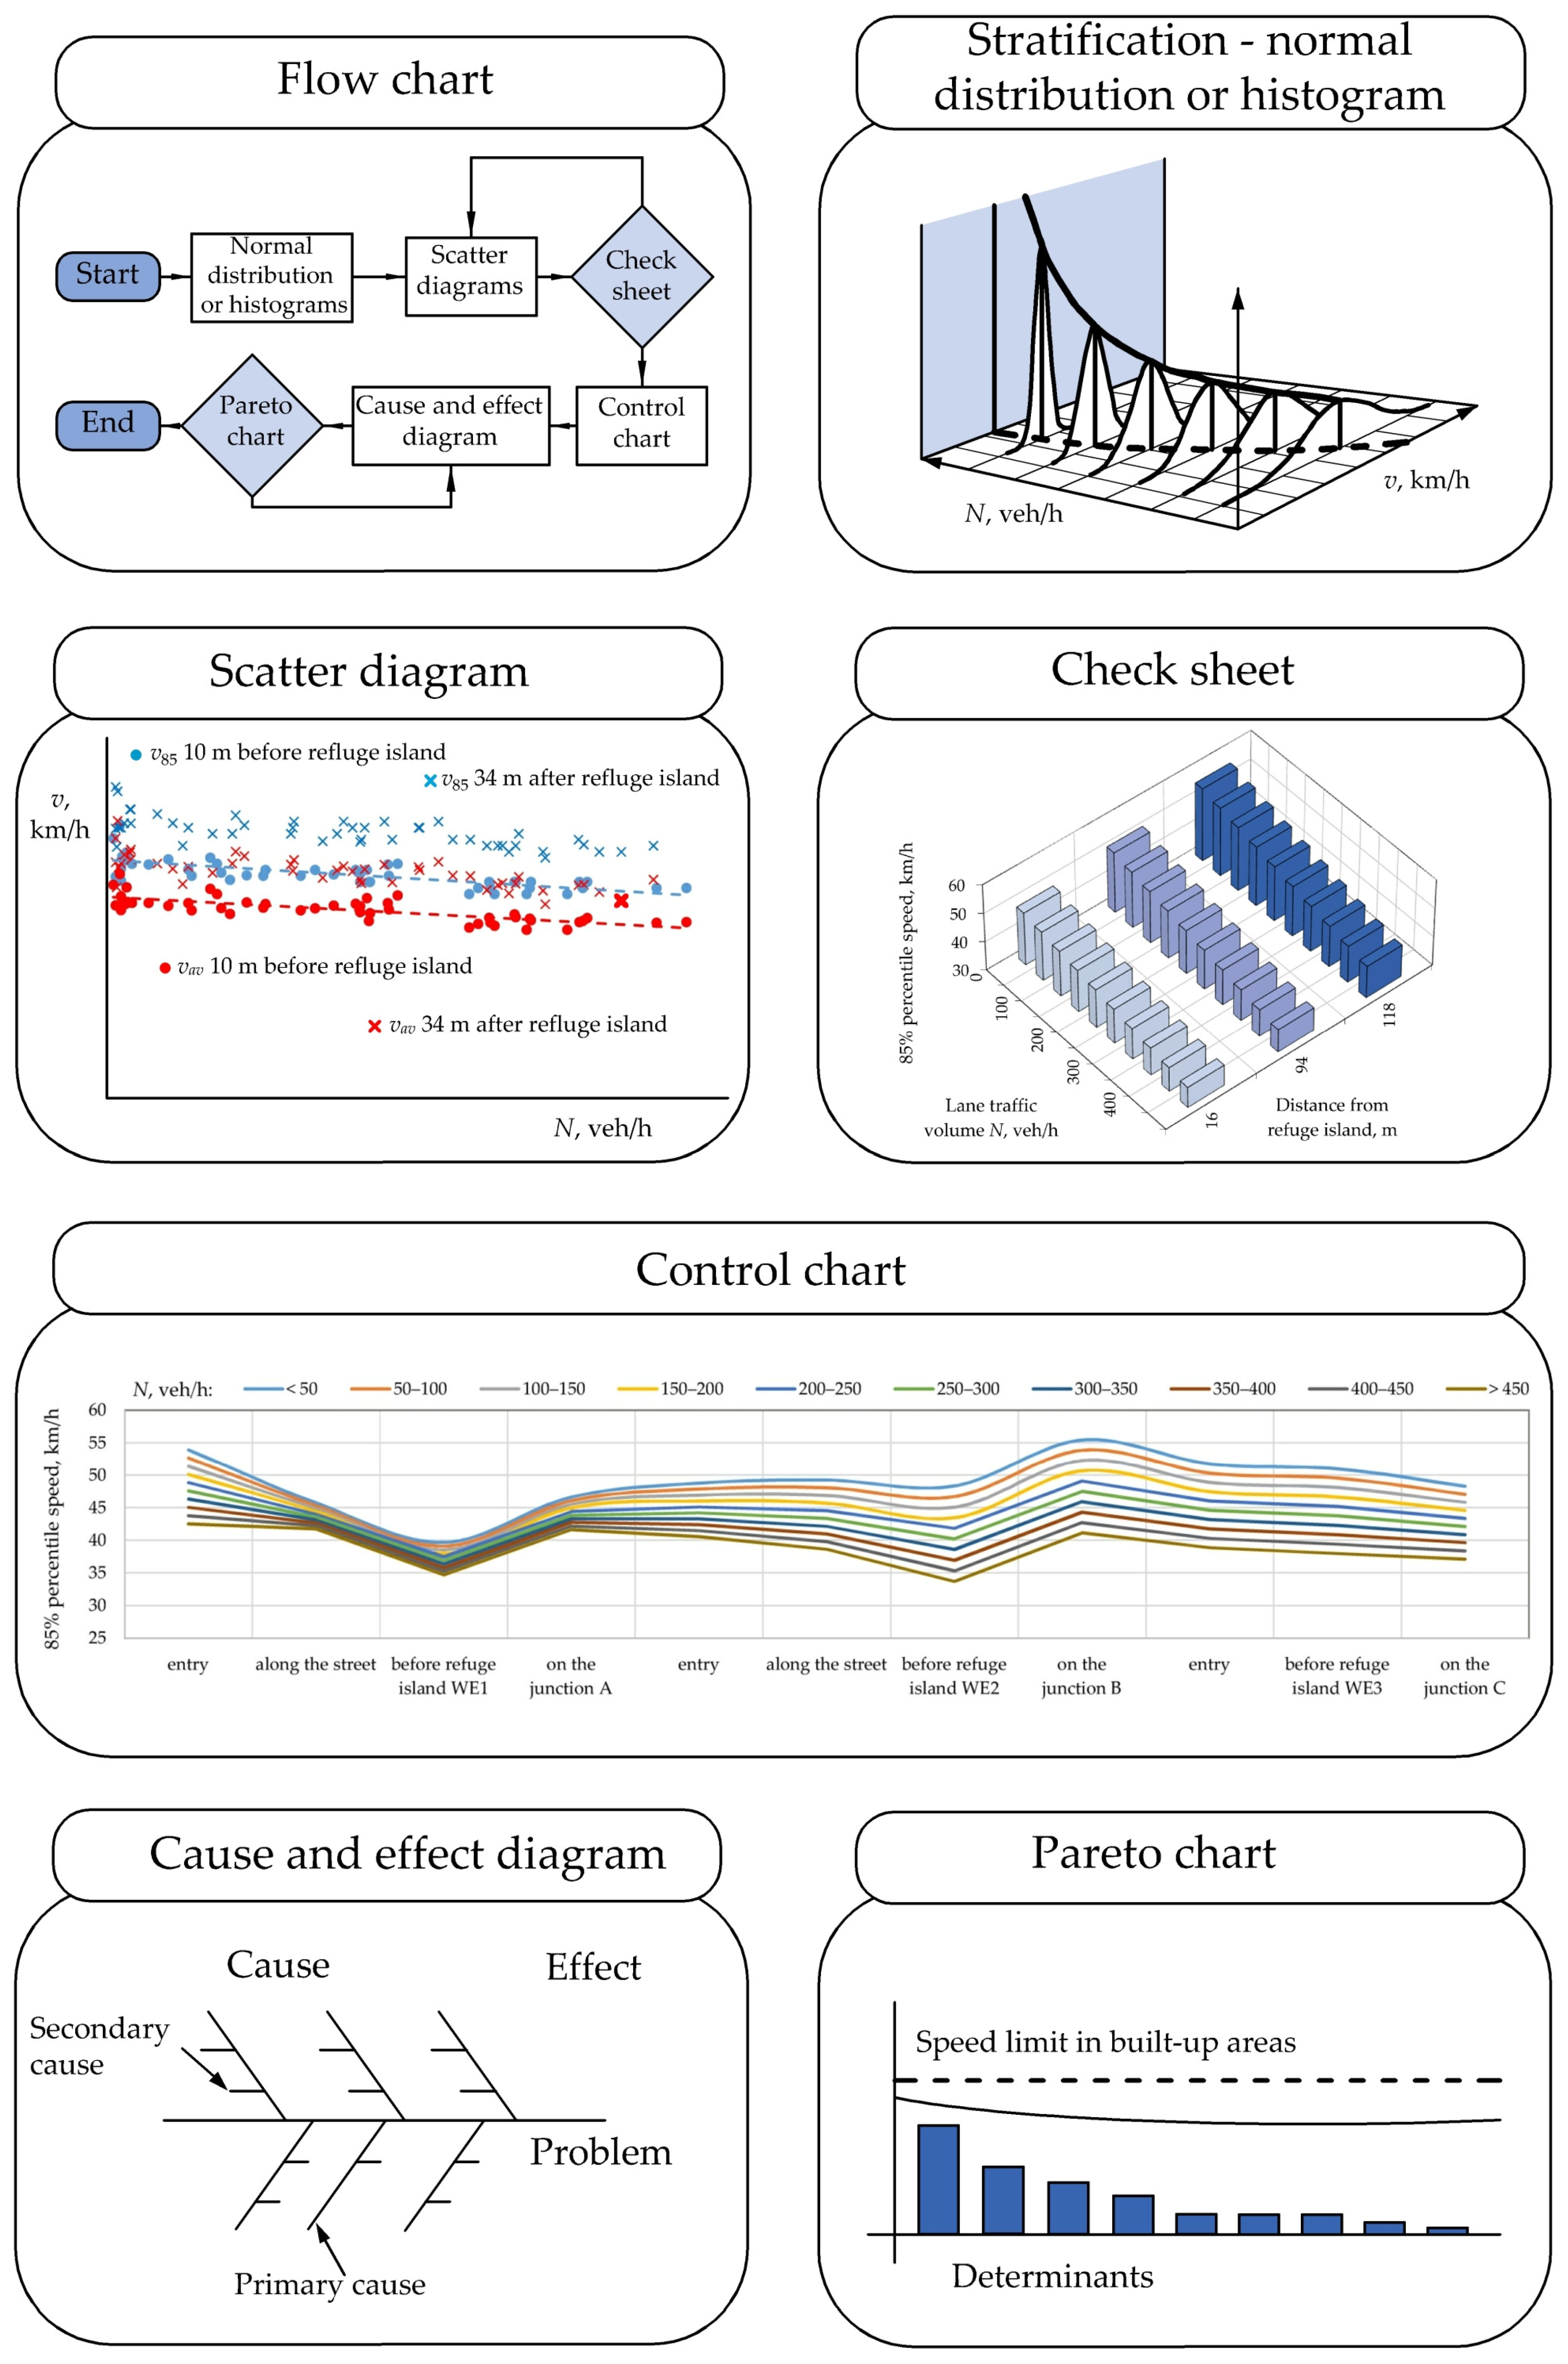
  • flow chart presenting the steps of the analysis,
  • check sheet, specifically statistical tests to check speed consistency among the consecutive survey sites deployed on the street under analysis,
  • normal distribution histograms,
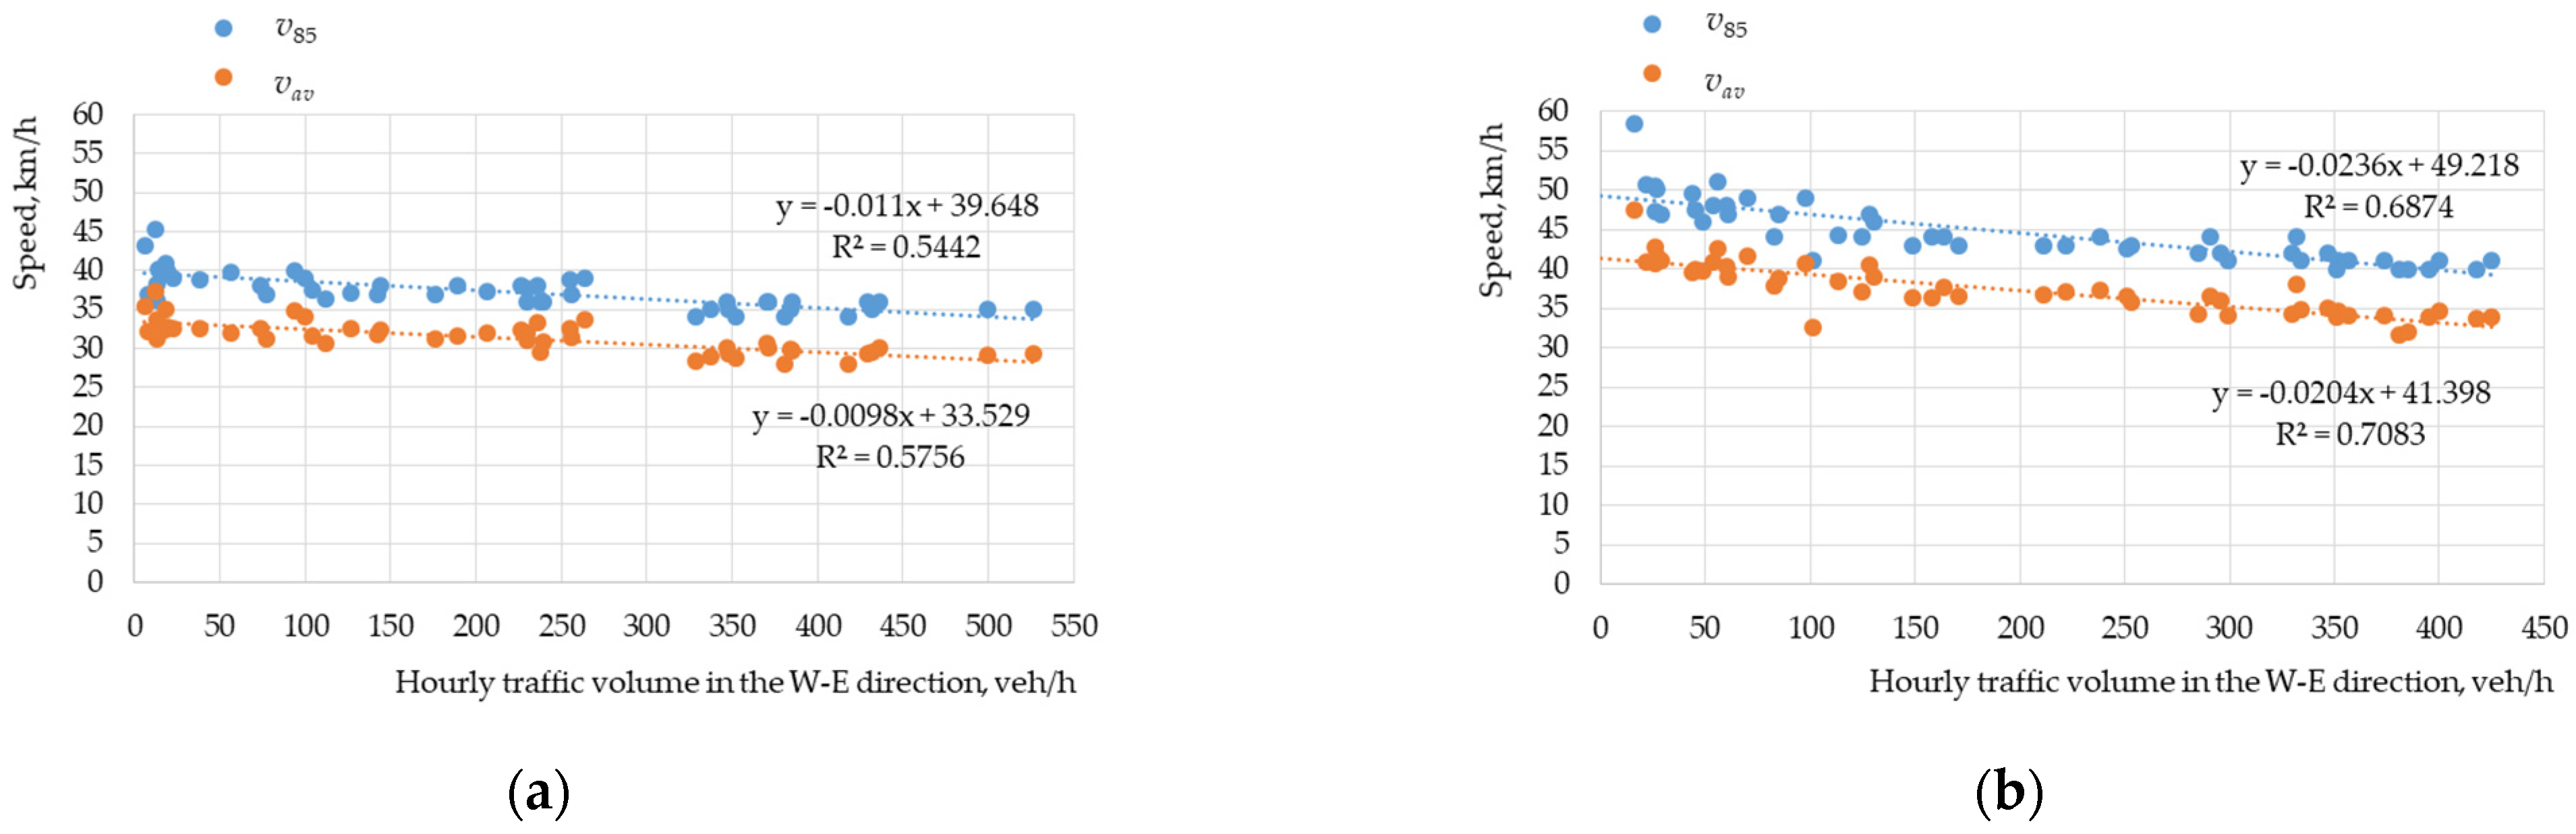
  • scatter diagram showing relationships,
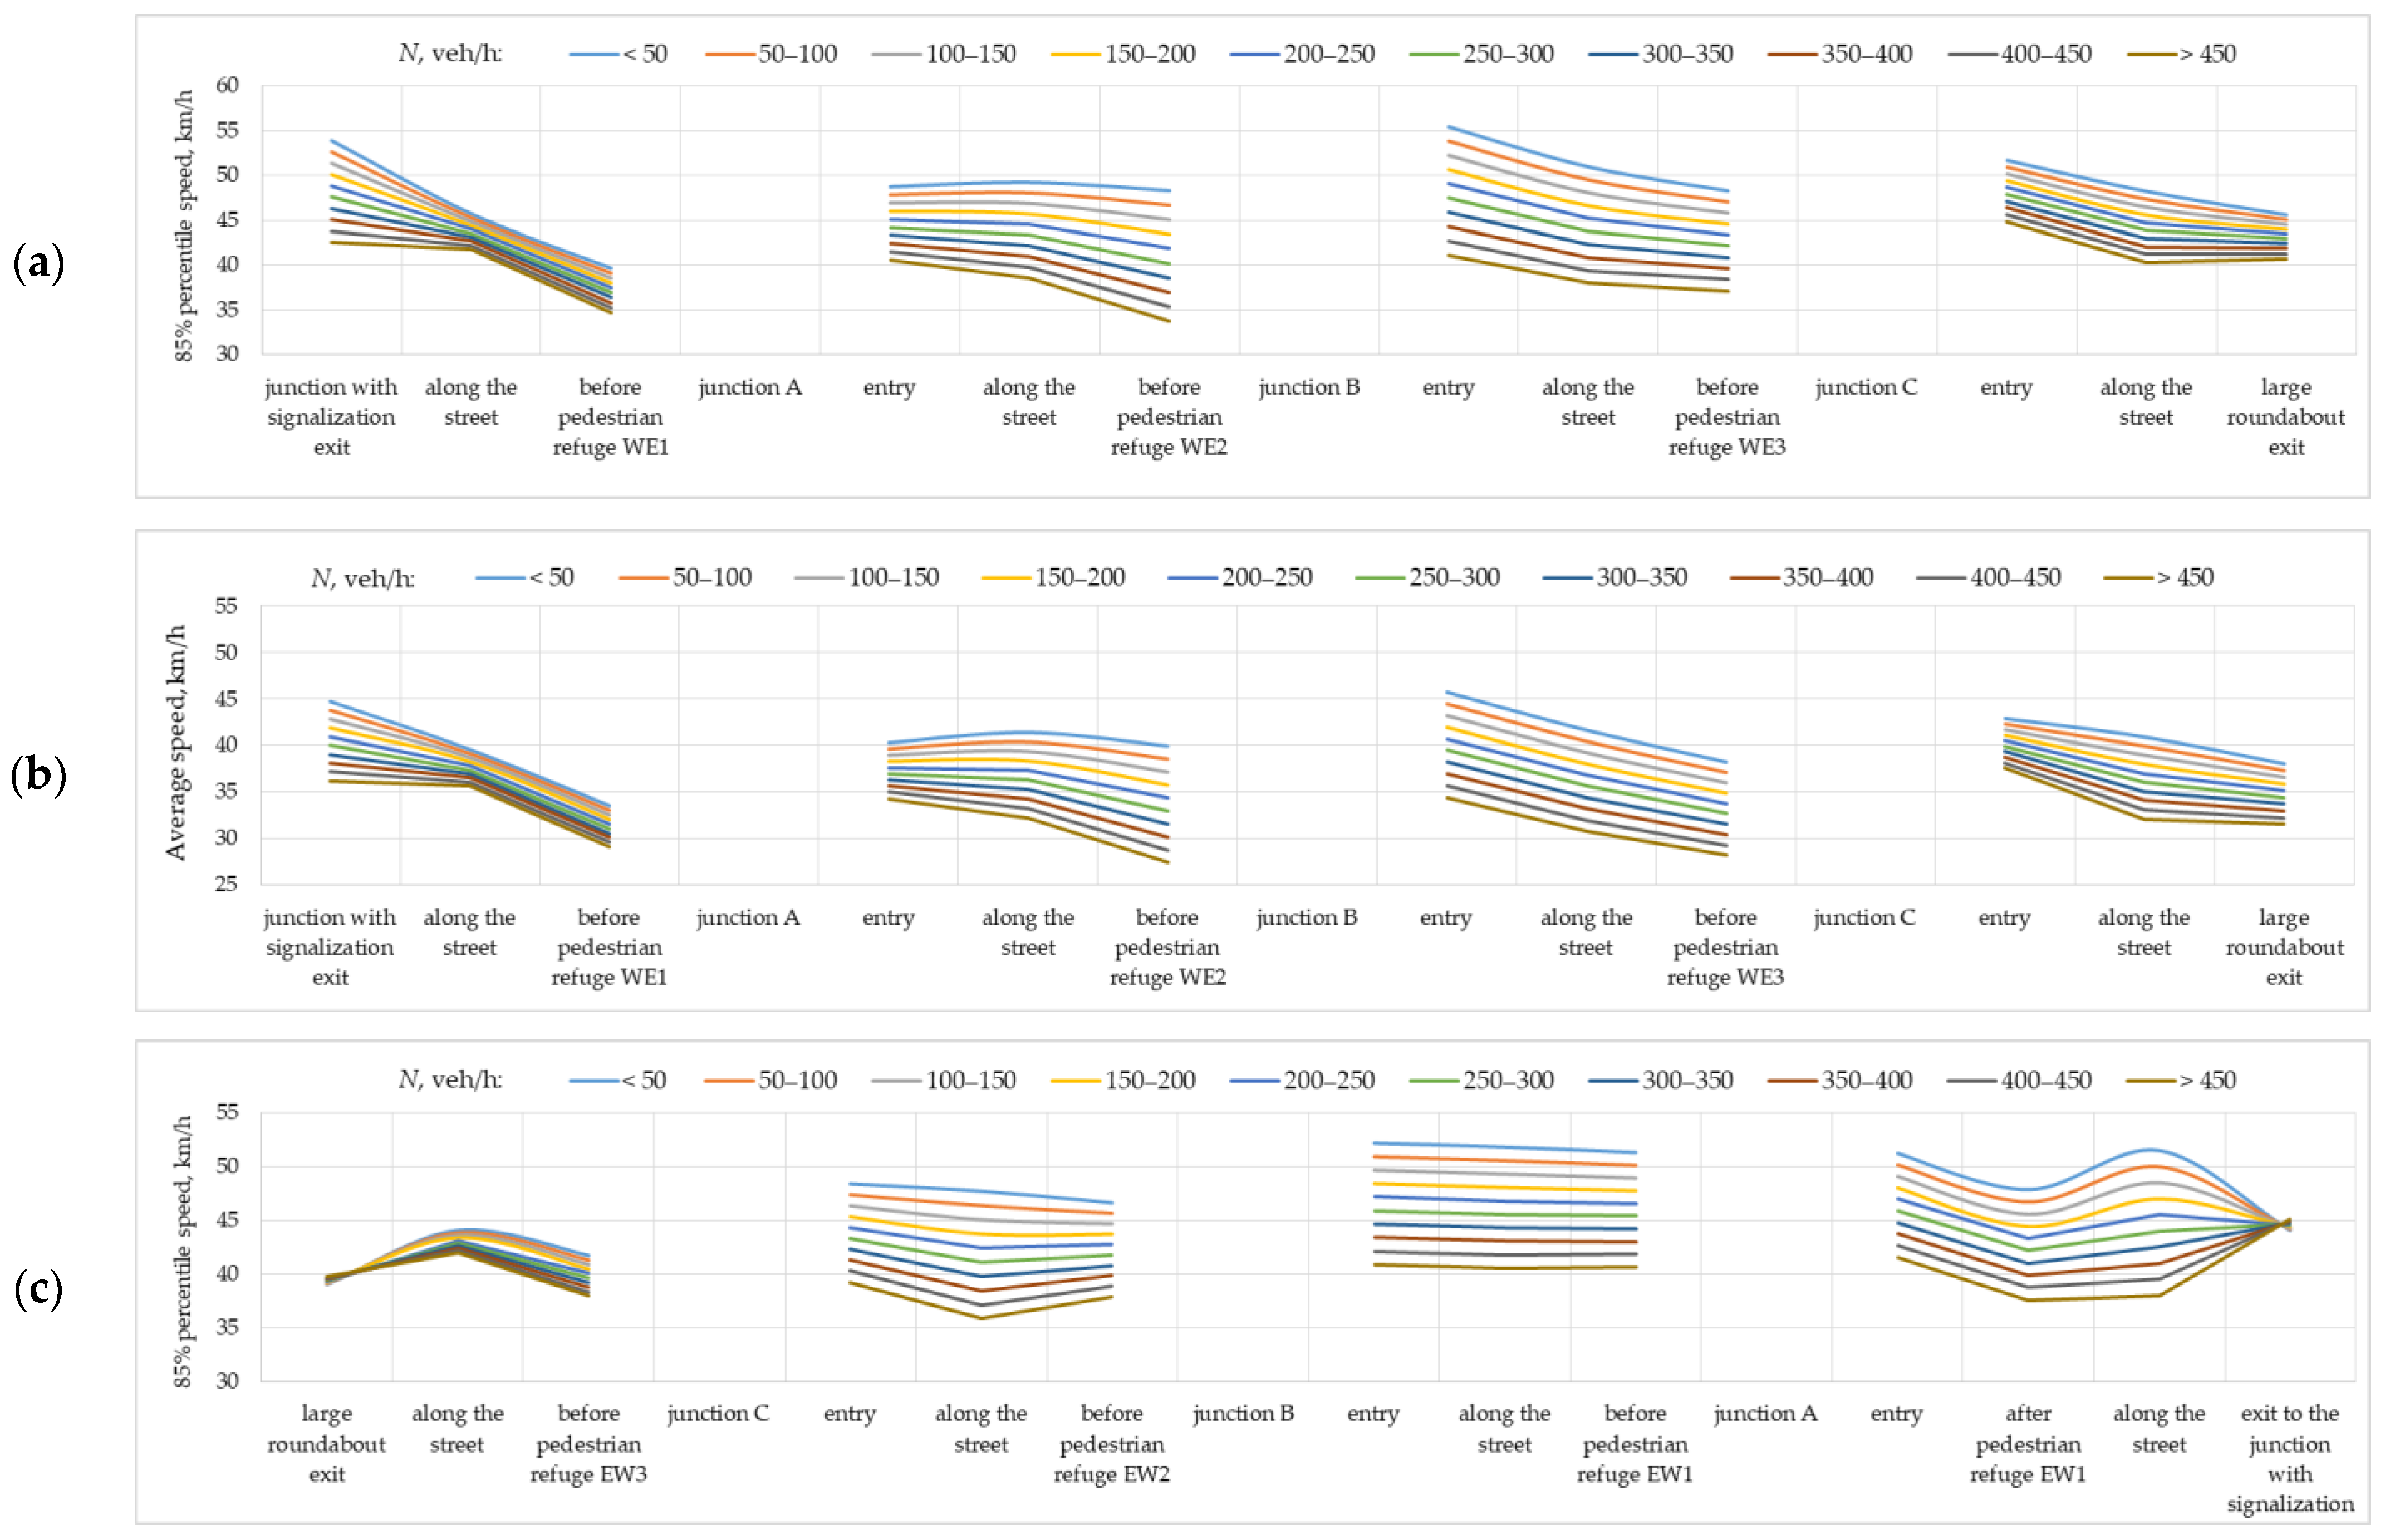
  • control chart showing speed changes along the analysed street,
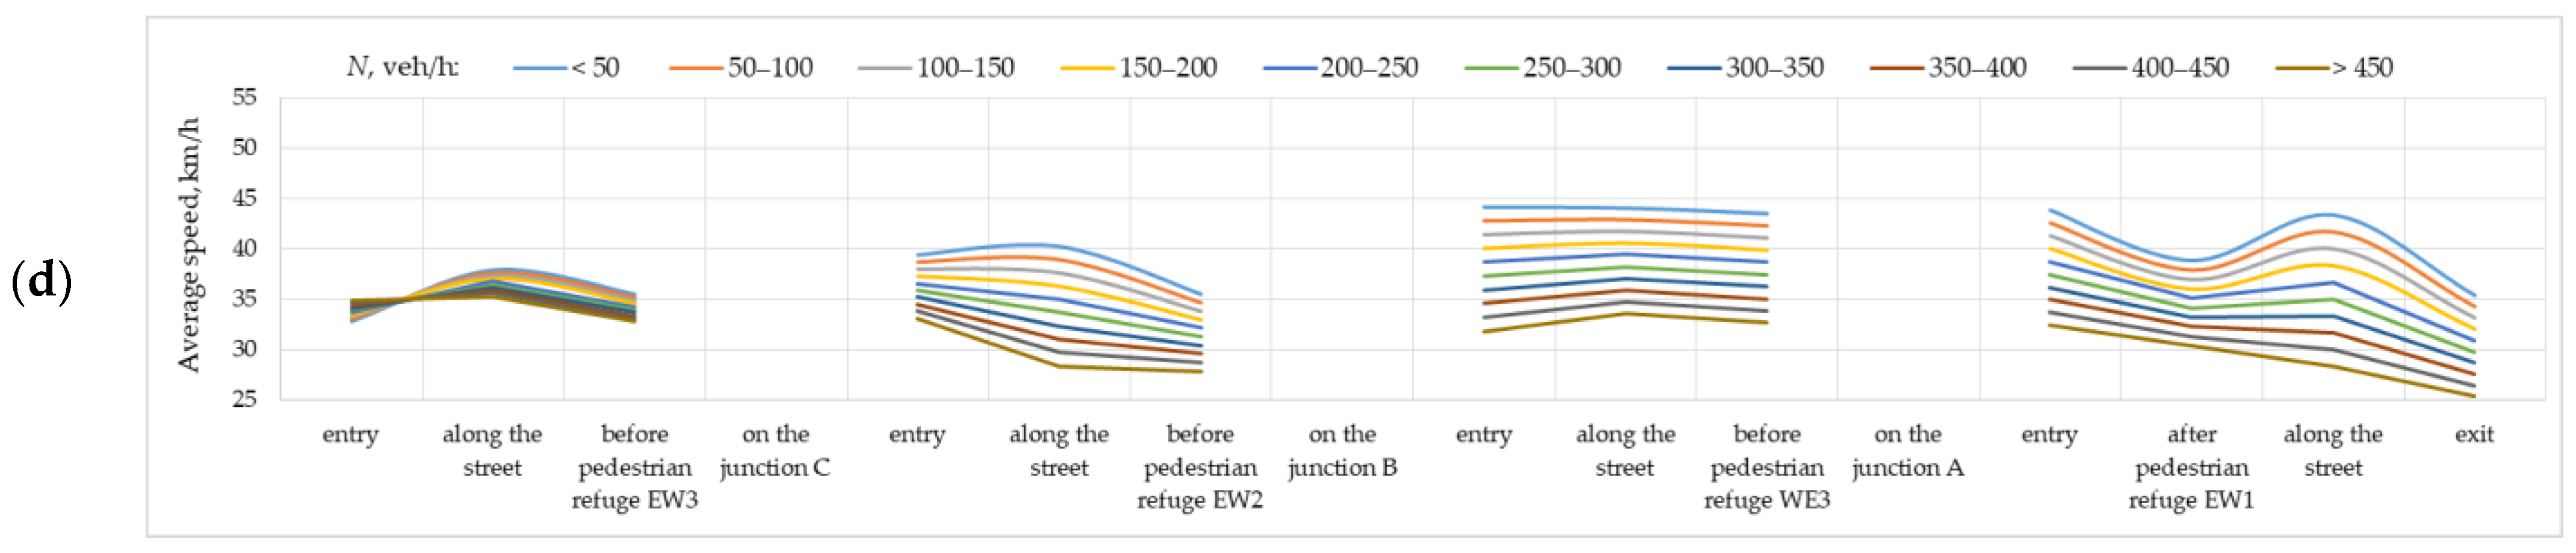
  • cause-and-effect diagram (diagram fishbone diagram or Ishikawa diagram) for defining the primary and secondary factors,
  • Pareto chart to define the final identified speed reduction determinants.
These allow the determination of factors that contributed to attaining the final effect in consideration.
In traffic speed studies, the heuristic method allows us to estimate the influence of the different determinants on the final operating speed reduced by various treatments, including TCMs. The abovementioned seven tools of the heuristic method were used in this study to assess the efficacy of different TCMs implemented in the analysed downtown street section.
The above literature review revealed that the research publications and various existing design guidelines have so far not covered the issue of the efficacy of repeated and varied TCMs before refuge islands on two-way city streets. The purpose of this study was to find the most effective TCM configuration before refuge islands located on two-way streets in urban areas. TCM effectiveness is understood as a reduction in operating speeds to improve traffic safety as a result. Section 1 of this article presents the literature review on TCM application near refuge islands and a general description of the heuristic method principles. In Section 2, the reader will find:
-
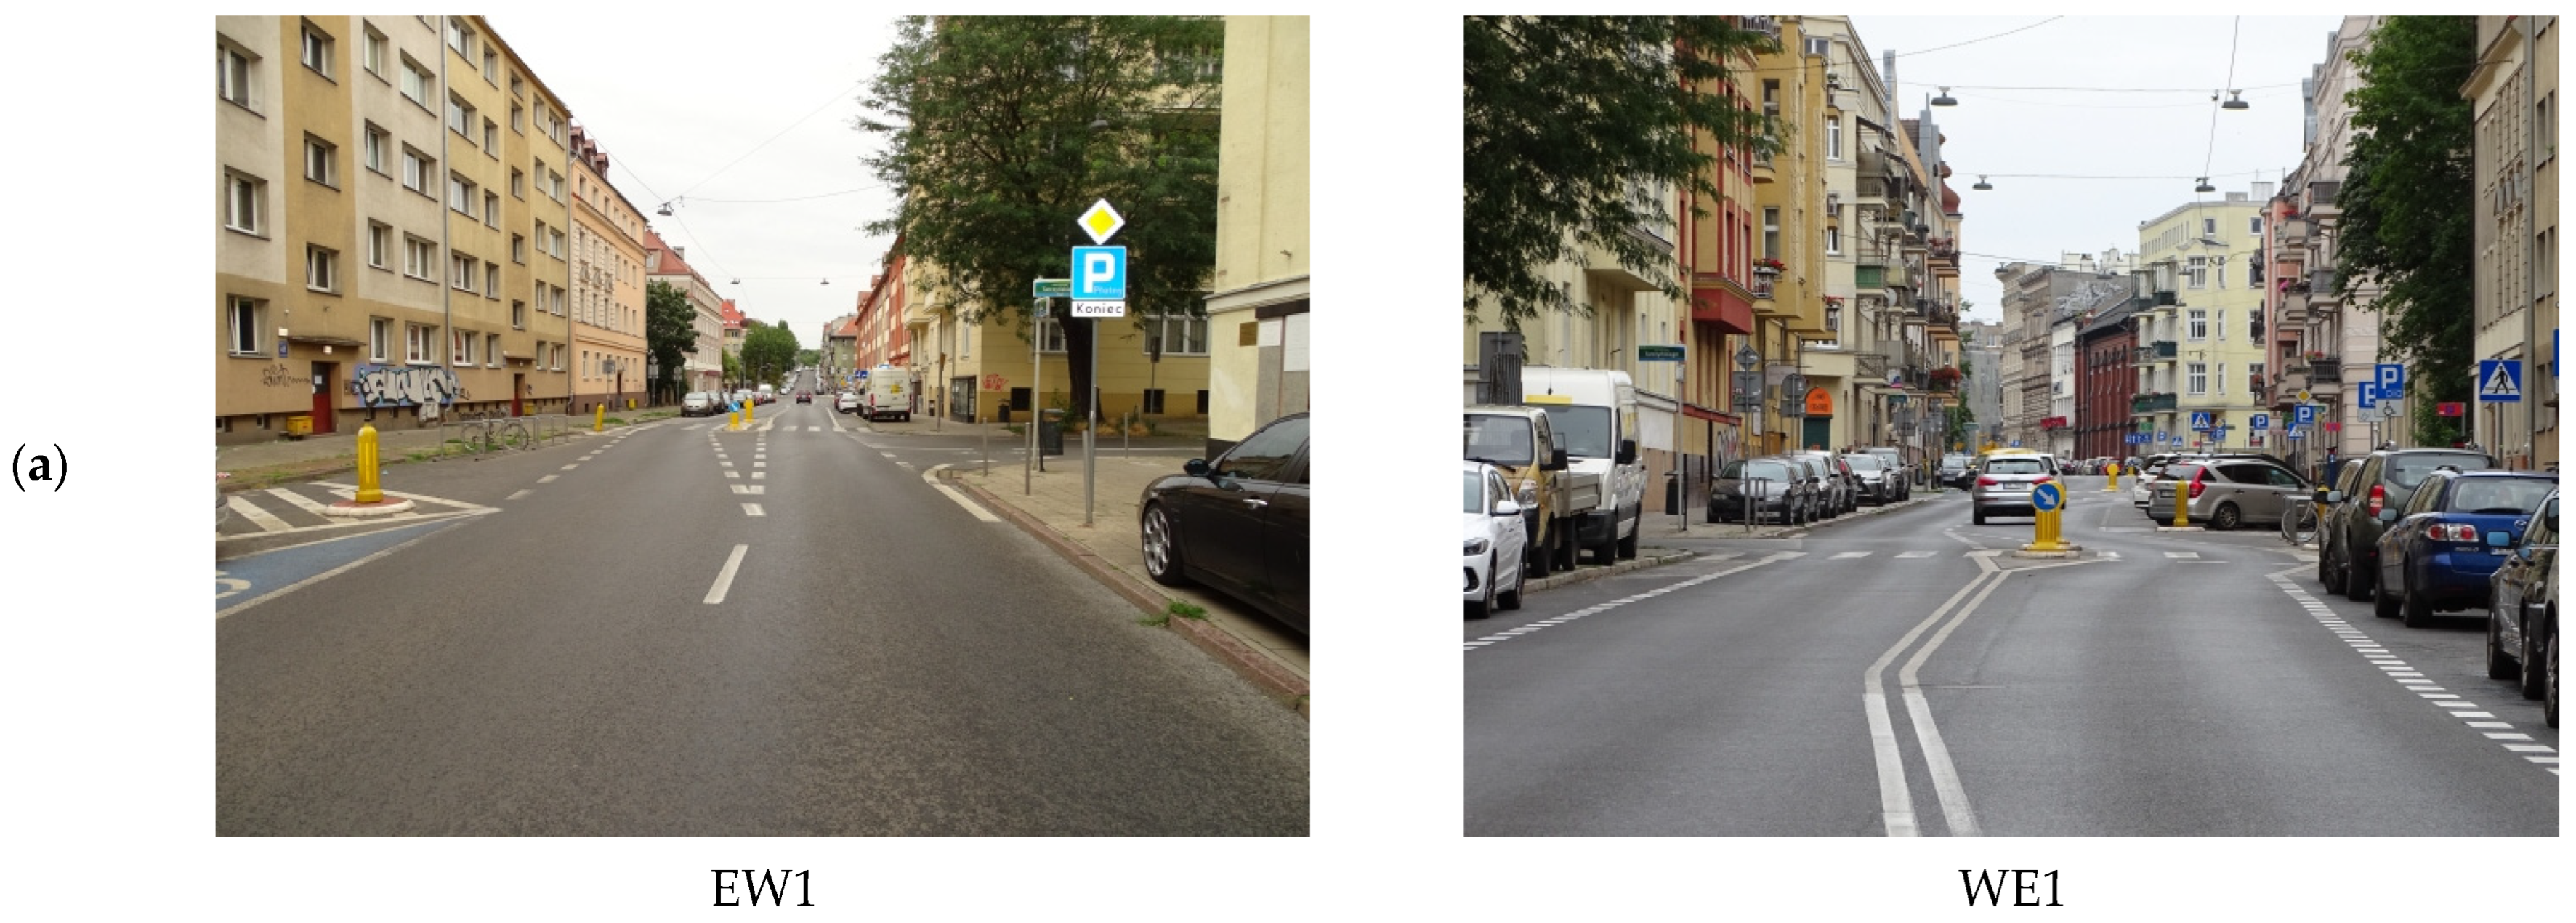
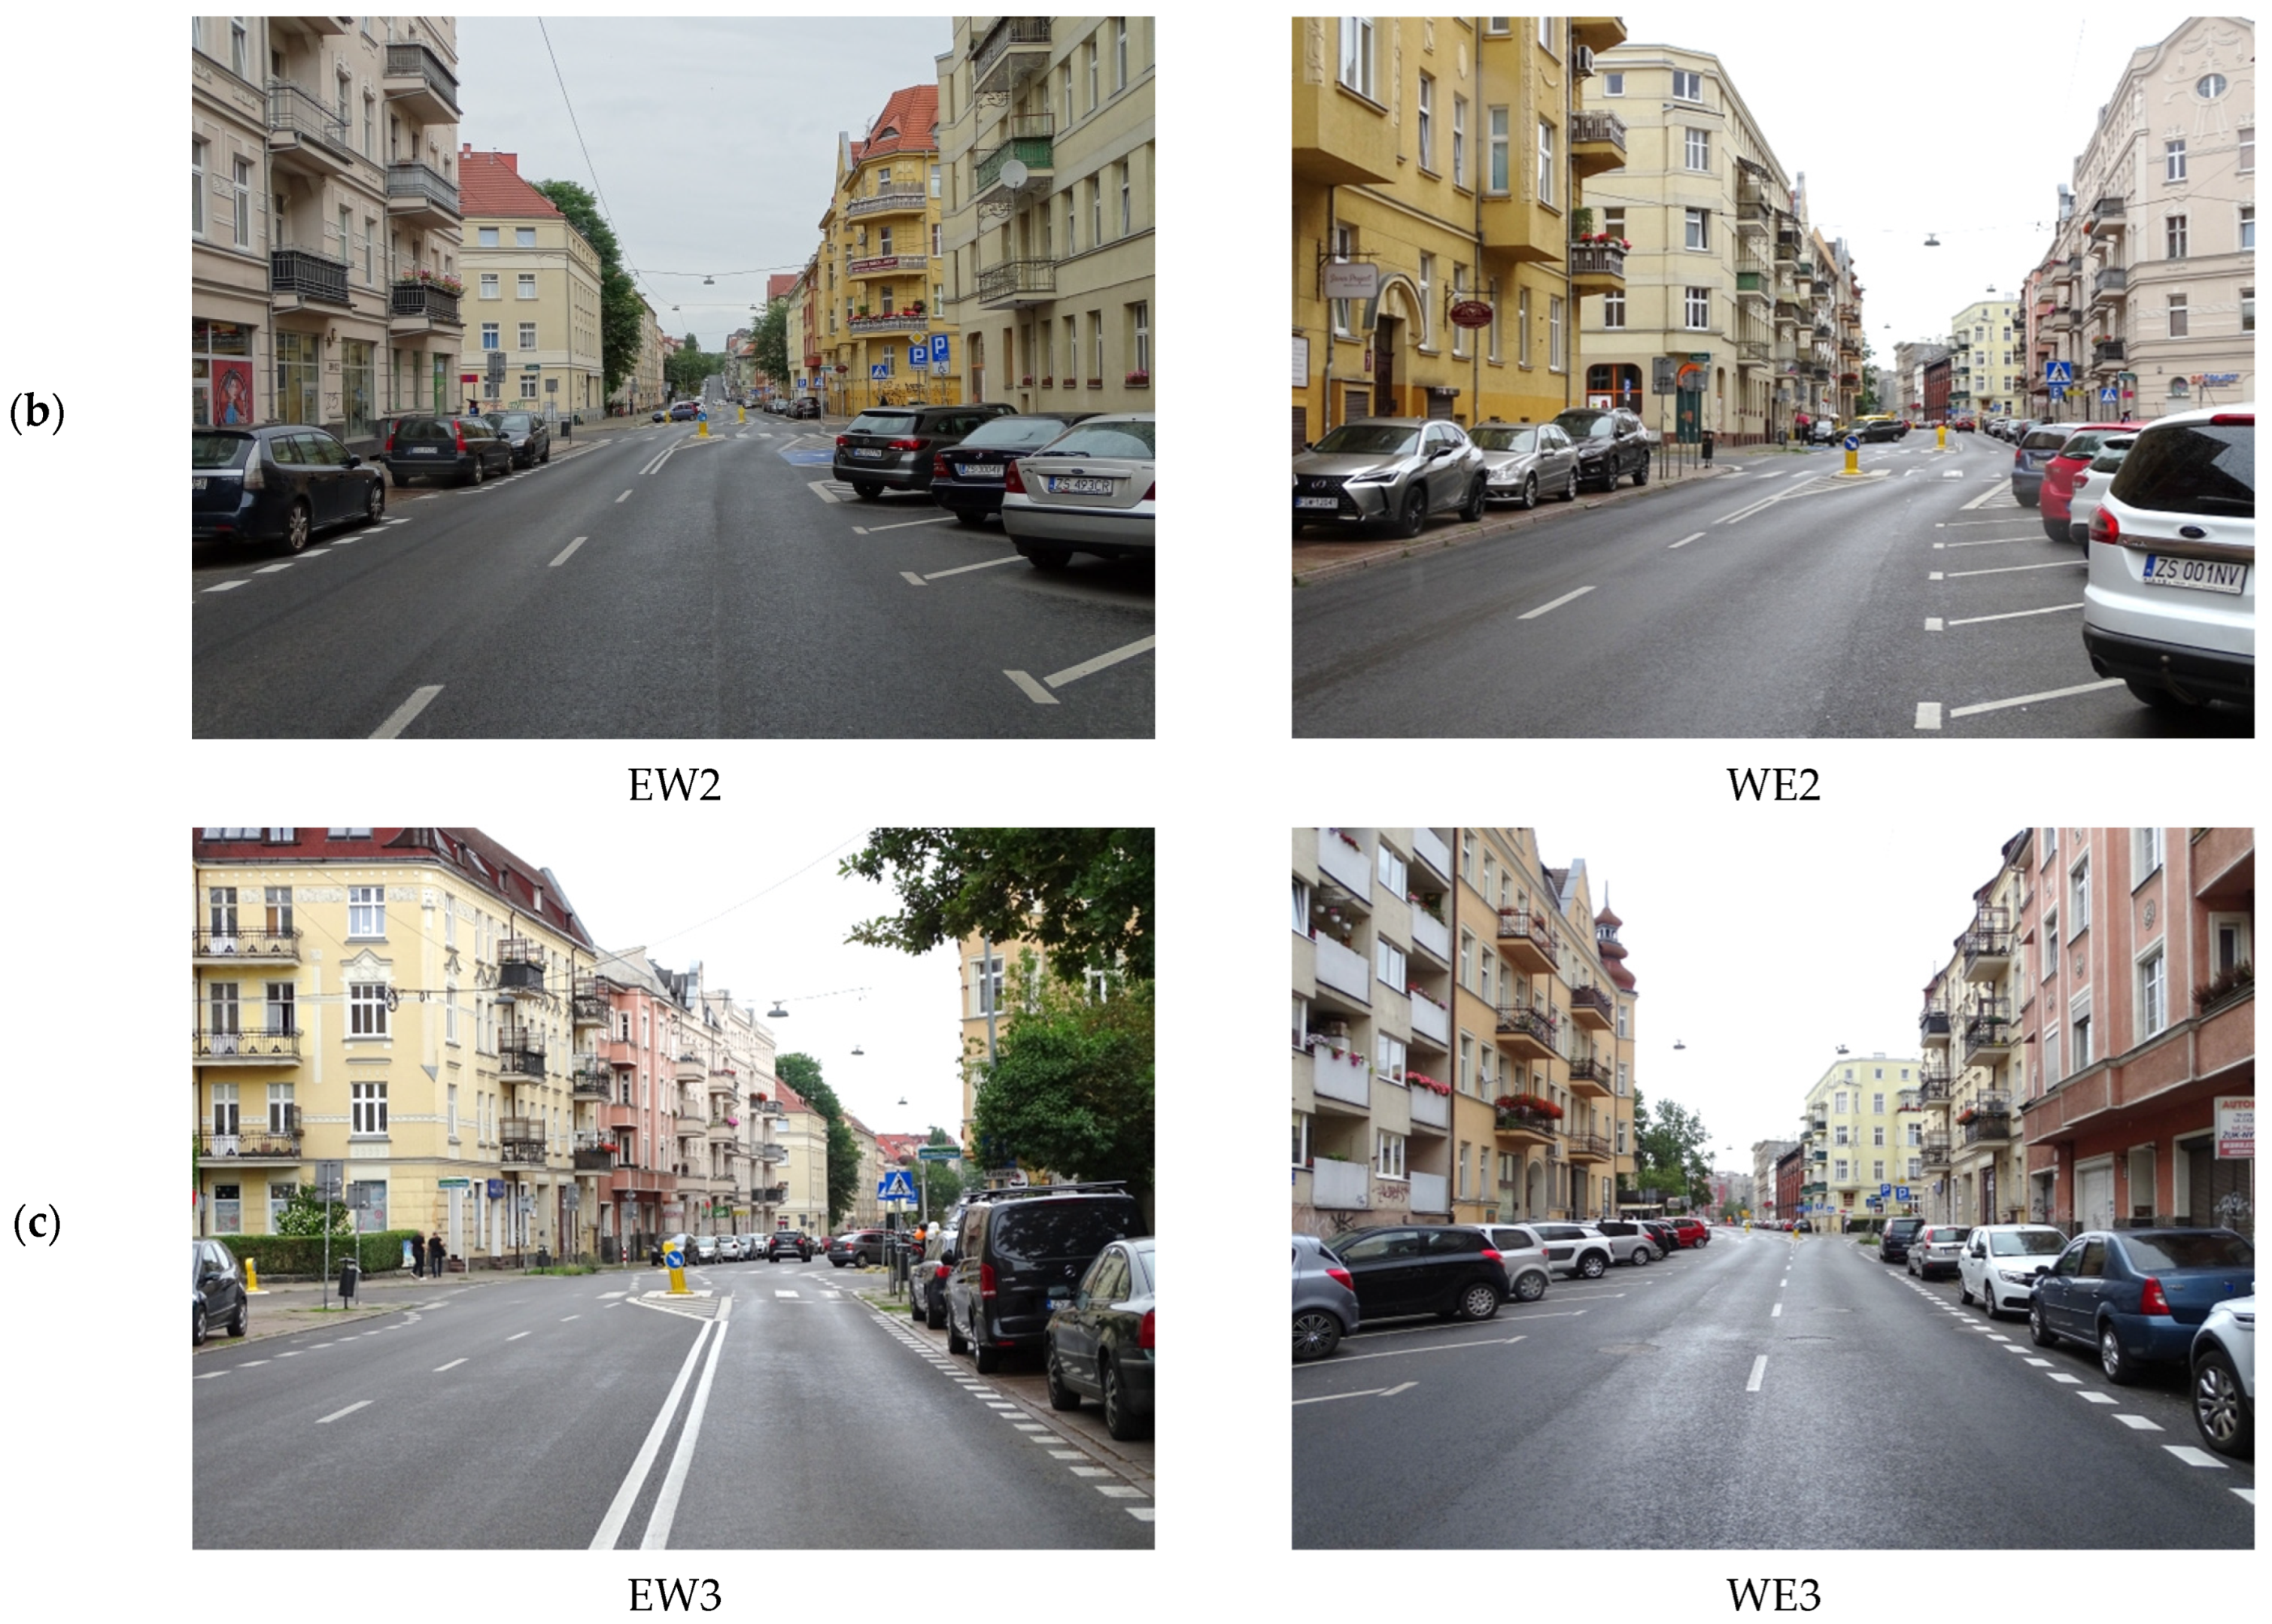
information on the study site (a two-way city street with 50 km/h speed limit) and details of the respective study sections with different parking and TCM arrangements,
-
traffic safety analyses before and after changes to the traffic organisation plan,
-
description of the heuristic method used in the study.
Section 3 presents the results of speed change analyses for the studied street sections. Section 4 discusses the obtained results and analyses the predefined determinants that, in combination with hourly traffic volumes, may cause operating speed reduction ahead of the refuge island. These analyses were made with the use of a cause-and-effect diagram and Pareto charts. Section 5 presents conclusions that may be used by traffic engineers designing traffic calming for two-way city streets. The sequence of analyses as they appear in the article is presented in Figure 3.

2. Materials and Methods
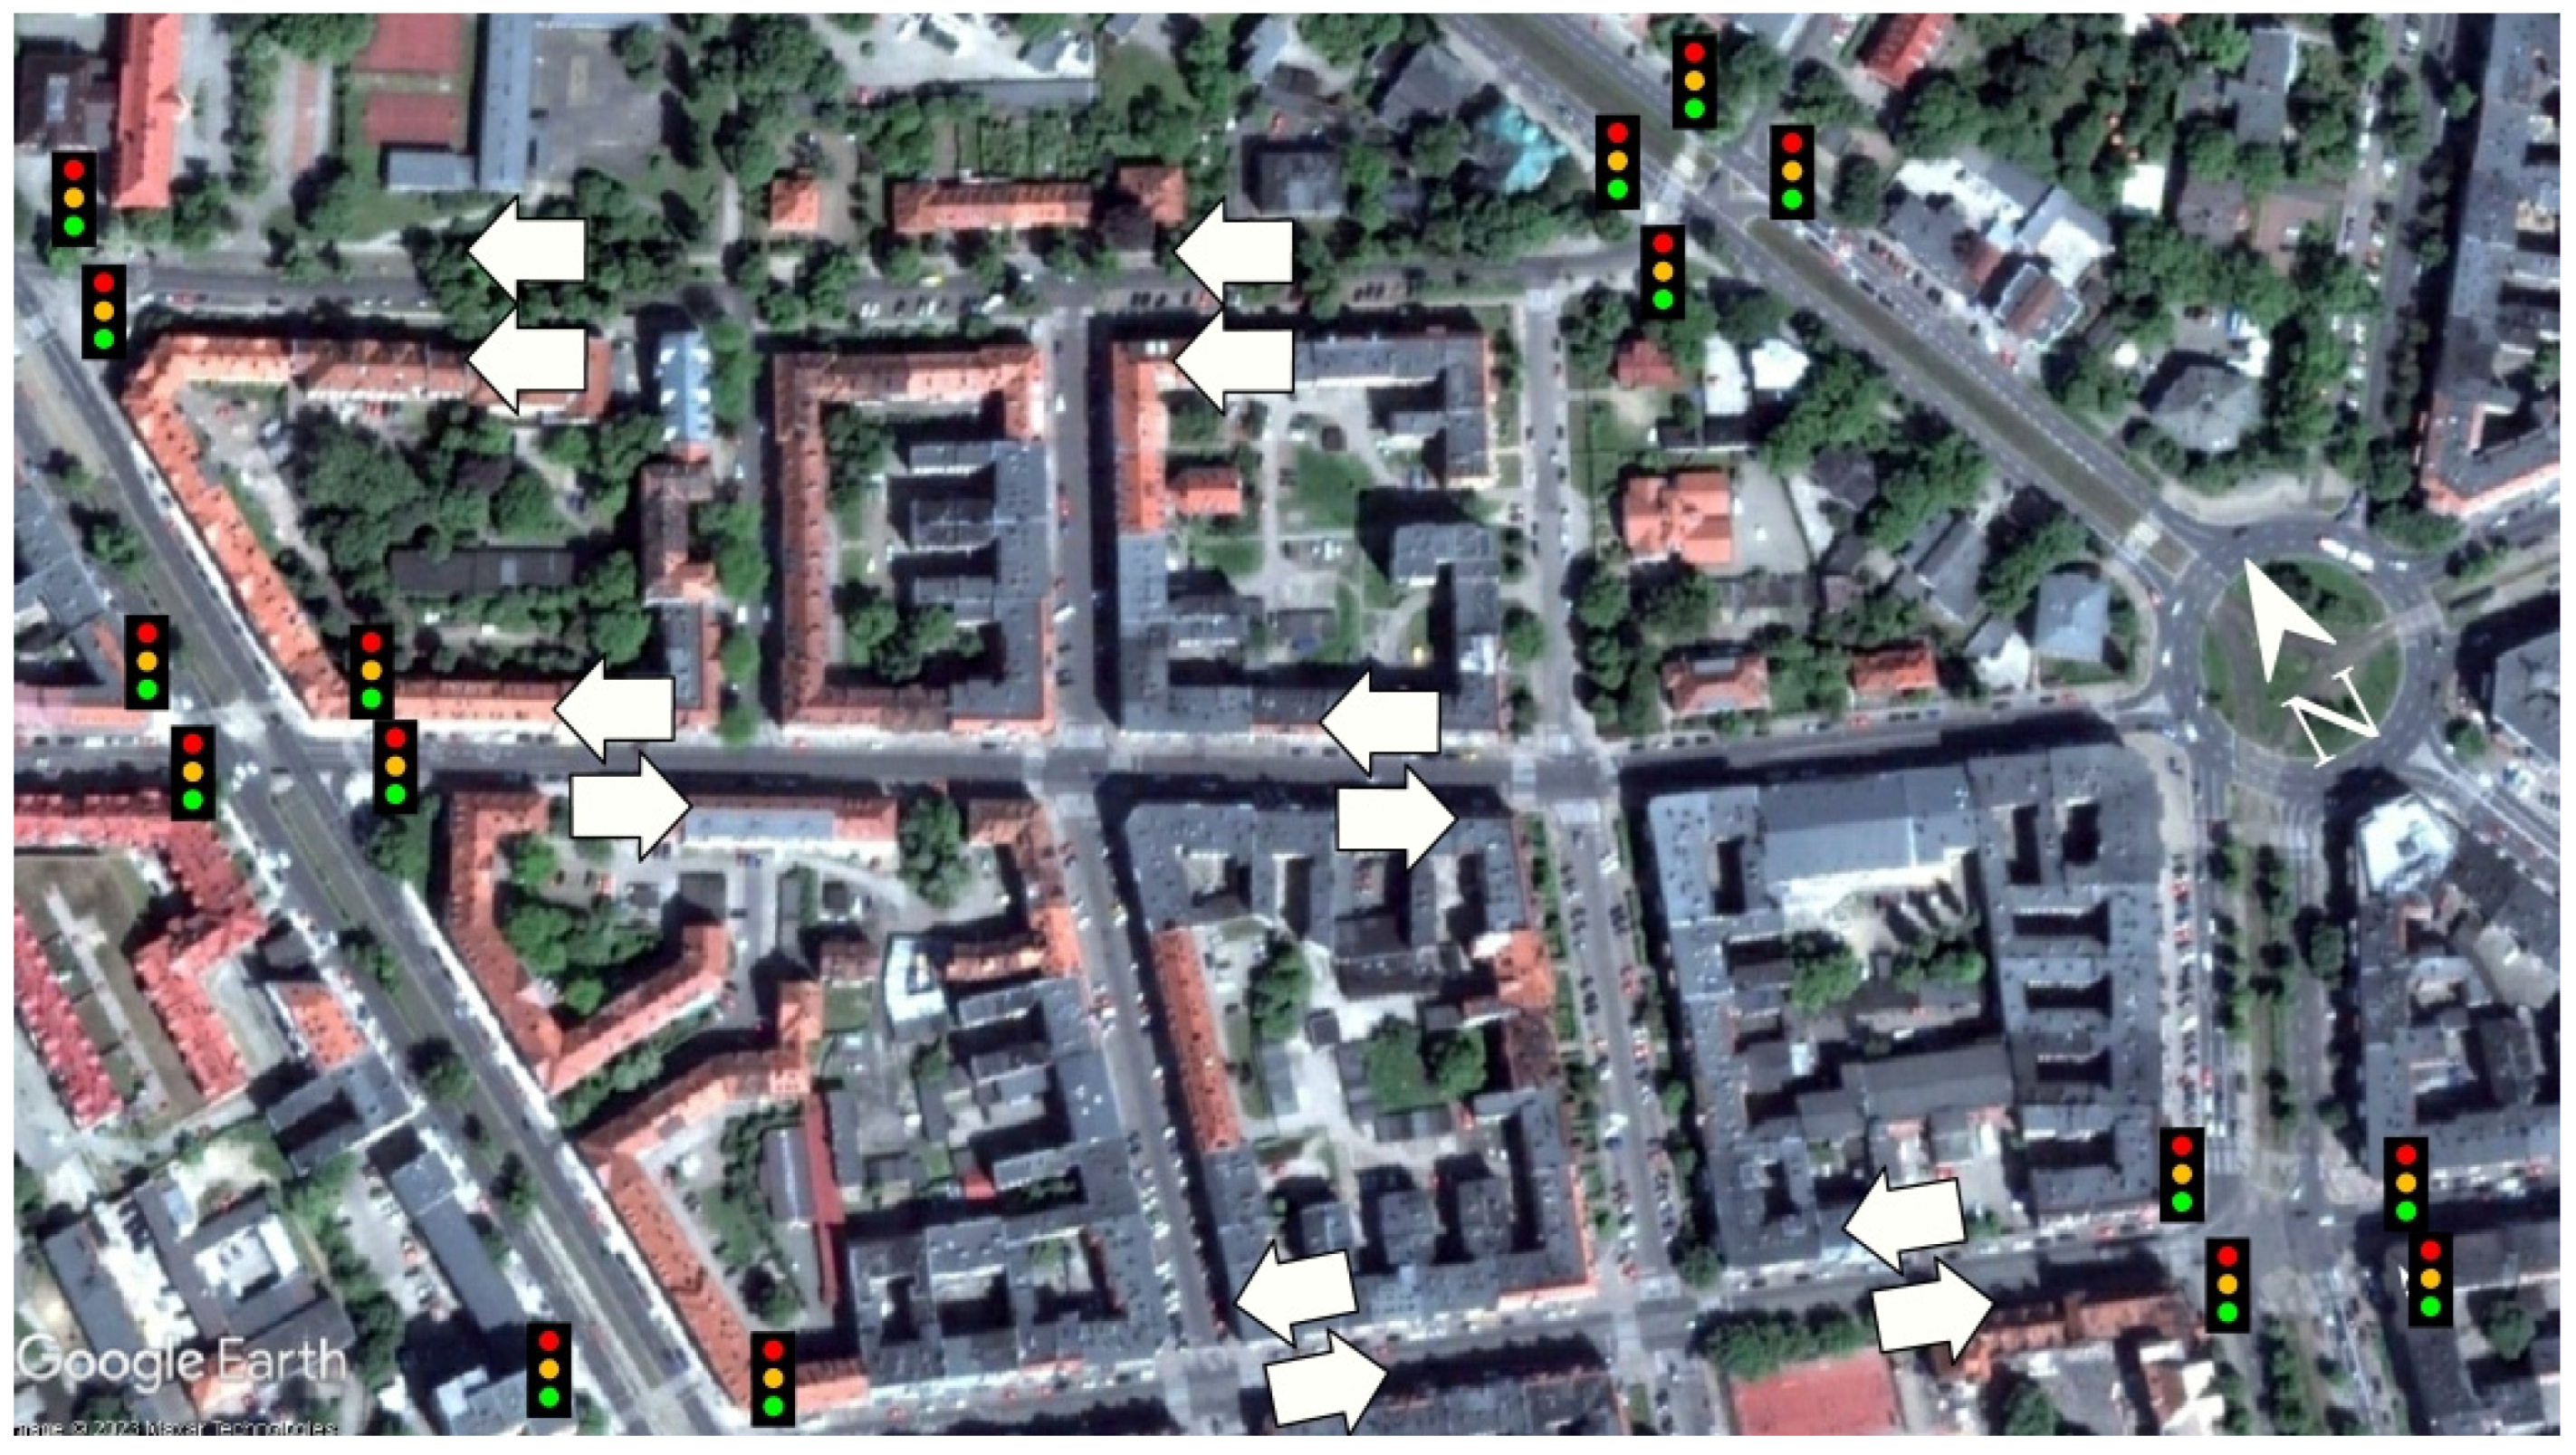
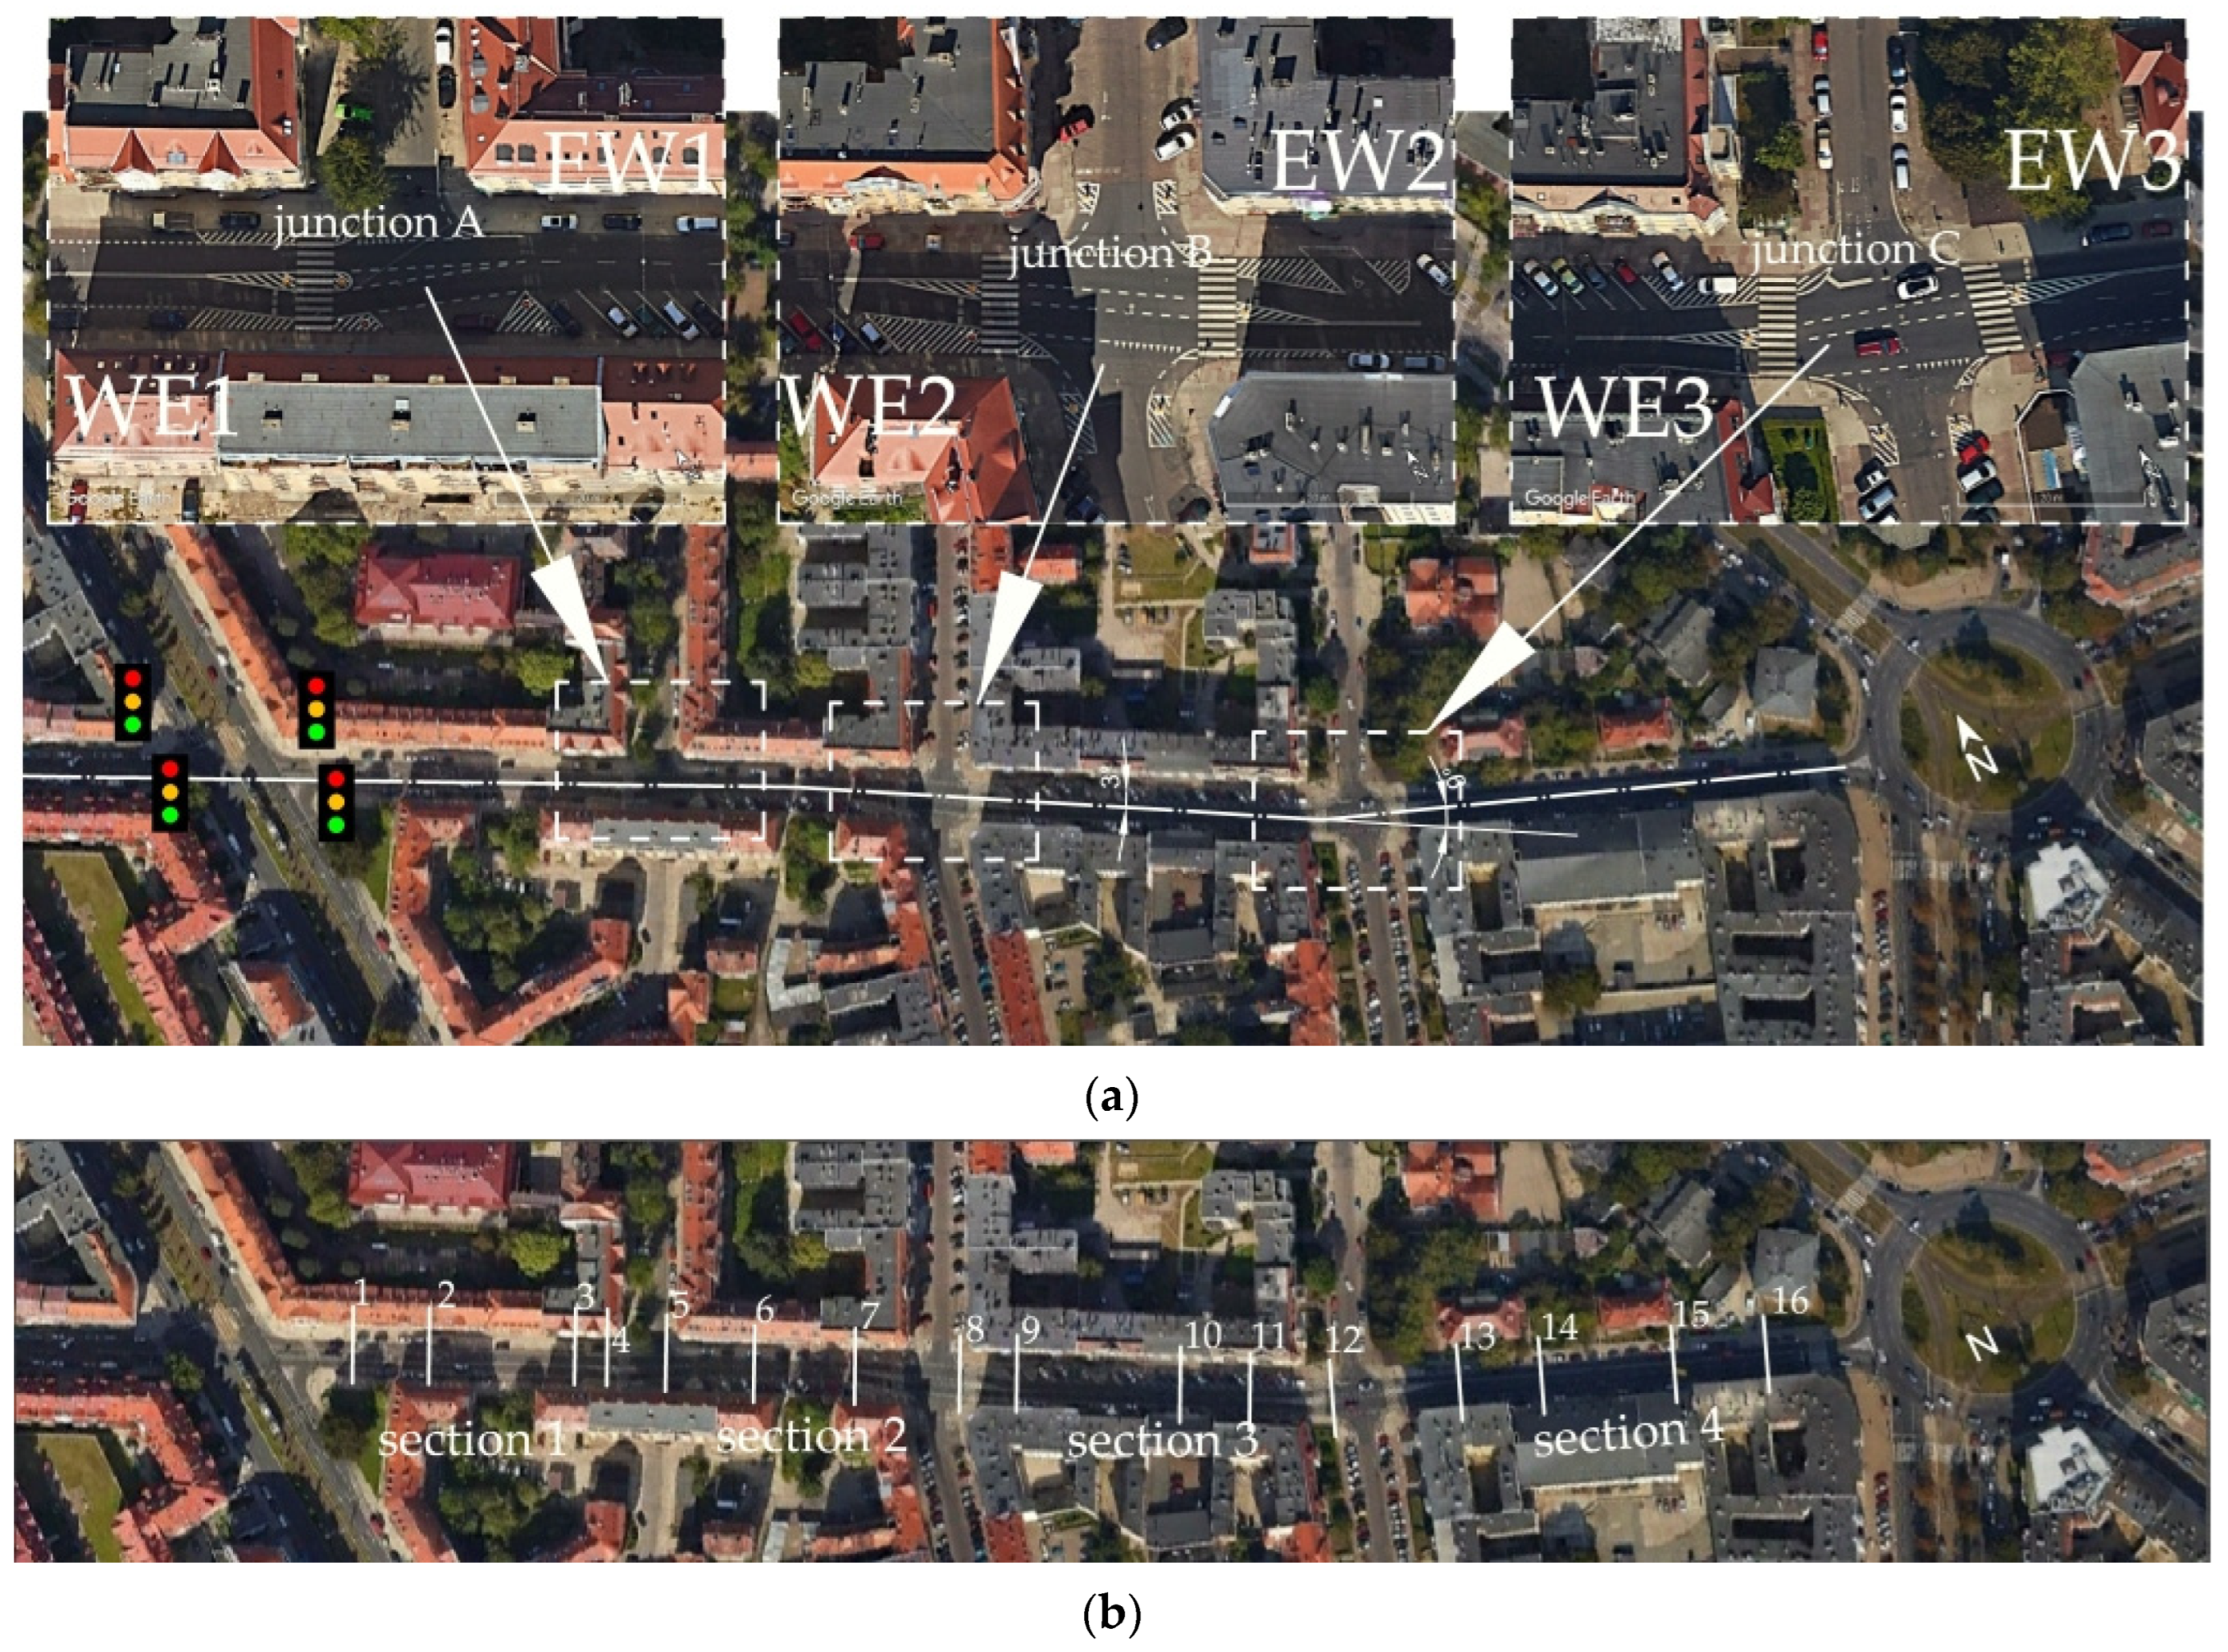
2.1. Study Area

A two-way street in downtown Szczecin, Poland, was chosen as the study site. In 2015, an urban block alteration scheme was started in Szczecin in order to improve the transport network and in relation to the planned Metered Parking System MPS implementation. This required the demarcation of metered parking spaces. Tempo 30 zones were introduced on some streets, and various TCMs were implemented elsewhere in the area as part of this road system alteration scheme [62]. This study deals specifically with a two-way street, including demarcated parking spaces, refuge islands, and horizontal deflection of the travel path imposed by road markings and refuge islands (Figure 4 and Figure 5). The street had a 50 km/h speed limit. In Poland, a 10 km/h allowance is applied in routine speed checks by means of speed cameras, as guided by relevant codes [63]. This allowance is deemed to account for measurement and driver errors, as the case may be.
Considering the two-way traffic arrangement on the analysed street, the study sections were identified with geographical symbols and numbers (Figure 5 and Figure 6). Thus, in the direction W→E, sections between the signal-controlled junction and the roundabout were designated WE1, WE2, and WE3. Accordingly, in the direction E→W, sections located in the same area were designated EW1, EW2, and EW3. All the study sections are shown in Figure 5. The geometrical features of the respective study sections are given in Figure A1 in Appendix A.

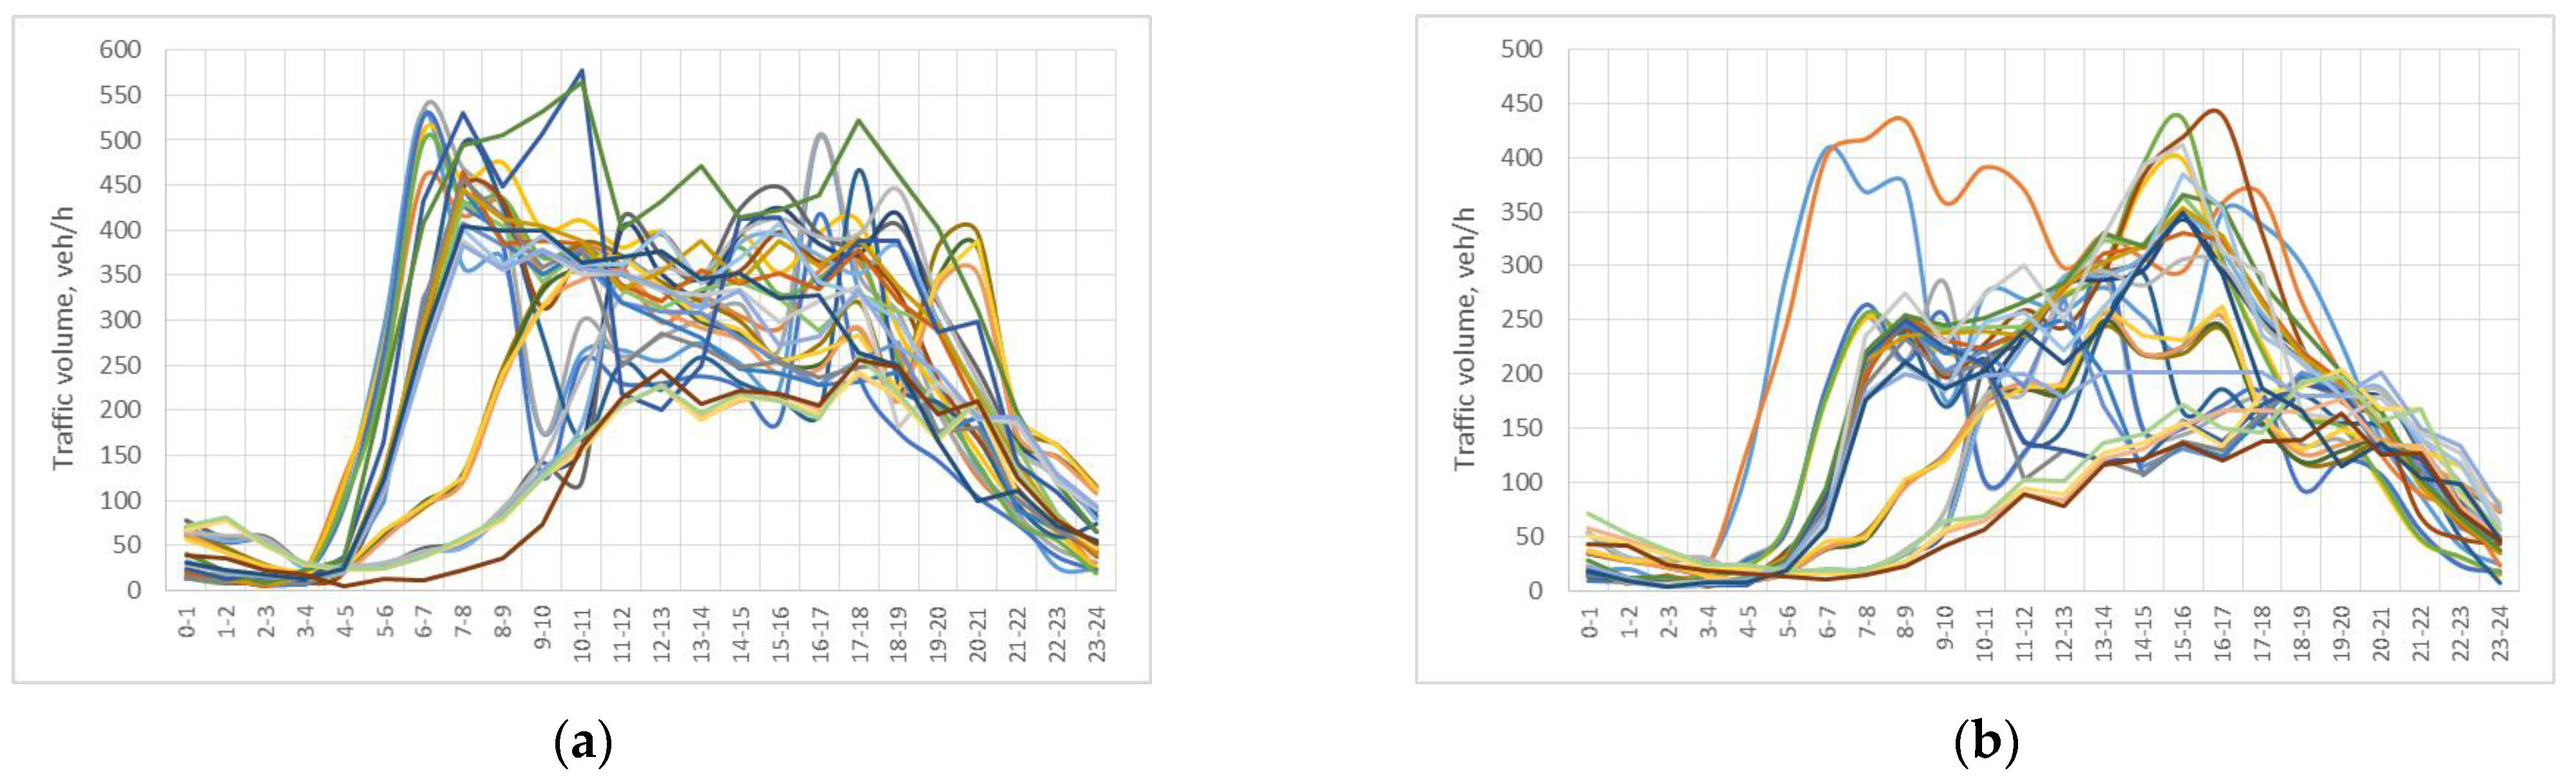
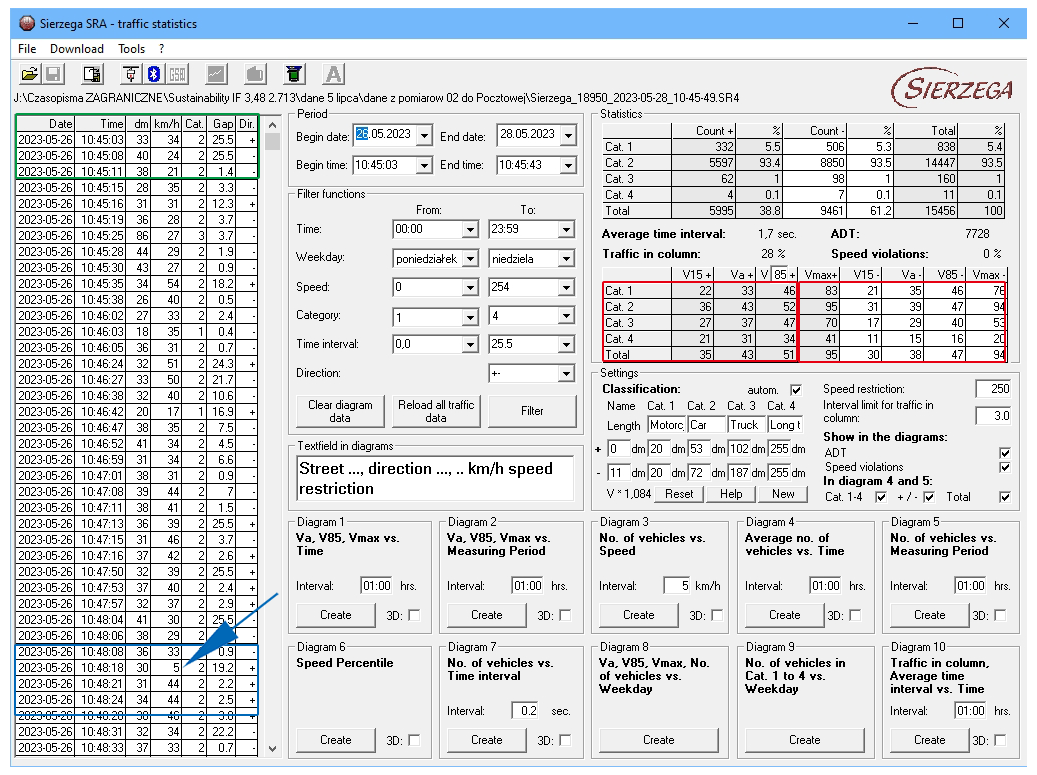
2.2. Traffic Safety and Volume Count Data for the Analysed Street

The effect of the changed traffic management arrangements on the analysed street was assessed through a road incident statistical analysis carried out using the Accident and Collision Registration System SEWIK [65] software program output data. These input and output data are given in Table 1 below.
The statistical test results compiled in Table 1 have not definitely confirmed the efficacy of the changed traffic arrangements, i.e., fewer road incidents and vehicle/pedestrian collisions. However, the substantial growth of traffic on the analysed street in the timespan of the study must be taken into account at this point, as it could have some bearing on the number of road incidents. The traffic volume output data are given in Figure A2 in Appendix B. The cause of a higher traffic volume in one direction of travel is the local traffic arrangement with a two-lane, one-way in the direction E→W street to the north and a two-way street to the south, the latter including a two-way tram line (Figure 4). This arrangement results in nonuniform traffic loading of the two travel directions with almost two times higher in the direction W→E traffic volume (Figure A2 in Appendix B).

2.3. Measurement and Analysis Method

In order to assess the slowing effect of the implemented modification of the traffic arrangements, round-the-clock traffic count and speed measurement surveys were carried out on site for two days, i.e., for a total of 48 h on each of the sixteen survey stations. SR4 [66] synchronised traffic detection devices were used and mounted on the existing signposts. The locations of the sixteen survey stations and deployment positions of the SR devices are shown in Figure 5.
Traffic counts and speed measurement surveys started on Friday morning and ended on Sunday. These weekend surveys lasted through May and June. The weather was dry during that time, ensuring uniform driving conditions. Four survey stations were deployed on each one-block section, positioned as follows: at the section (block) entry, just before the refuge island, and within and past the junction. This deployment allowed observation of speed variation along a given portion of the street under analysis. In total, 16,000–18,000 travel speed readings were logged at each survey station.
Considering daily variations in traffic volume (ranging from a few to dozen plus veh/h overnight to about 500 veh/h during the day), the data were subjected to a statistical analysis using the Two-sample Kolmogorov-Smirnov test and Median test in order to determine whether the hourly traffic volumes may be analysed as one group or must be treated individually. The authors conducted a two-day preliminary traffic count and speed measurement surveys at two survey stations on the analysed street before and after metered parking and TCM scheme implementation. For a majority of the results, the standard deviation was a variable statistic, and negative results were obtained in both tests. Therefore, it was required for statistical analysis purposes to split the speed data set into subsets corresponding to traffic volume intervals of 50 veh/h. The statistical tests for four of these subsets for different traffic flow directions (including two “before” and two “after” subsets) are given in Table 2.
Note also that since the lowest hourly traffic of up to 50 veh/h was recorded only during a few hours overnight, with the actual number of only a dozen plus vehicles per hour, the collective analysis of these data with daytime speeds measured at two or even three times greater traffic volumes, would not be in line with the design of experiments (DOE) principles. However, another issue supporting the subdivision of the speed data set into hourly volume subsets was only sporadic crossing of the street or walking across or driving out of the parking spaces during nighttime.
The main objective of this study was to assess the efficacy of the applied TCMs used, understood as speed reduction, before the refuge island. To this end, the authors conducted preliminary measurements of the initial velocity at which drivers applied brakes before the pedestrian crossing and the drive-in and drive-out speeds. These speeds were measured with an SR4 synchronised traffic detector combined with a video camera during preliminary 1-h long observations on two one-block sections with diagonal on-street parking. The SR4 [66] logging chart example is shown in Figure A3 in Appendix C. These preliminary results were analysed, and the readings below 10 km/h were left out, as they were most likely associated with braking before the pedestrian crossing or driving in or out of parking. The number of occurrences of these speeds in the dataset varied from just one to several depending on the time of the day (boxed in blue in Figure A3 in Appendix C). Generally, there were not more than 2–4% of such speeds in each hourly data set. An increased frequency of their occurrence (from a few to a dozen plus records) coincided with higher traffic volumes, i.e., 250–450 veh/h in the morning between 7 a.m. and 8 a.m. and in the afternoon between 4 p.m. and 6 p.m. The final speed analysis results, with or without considering the readings below 10 km/h in each subset, were:
-
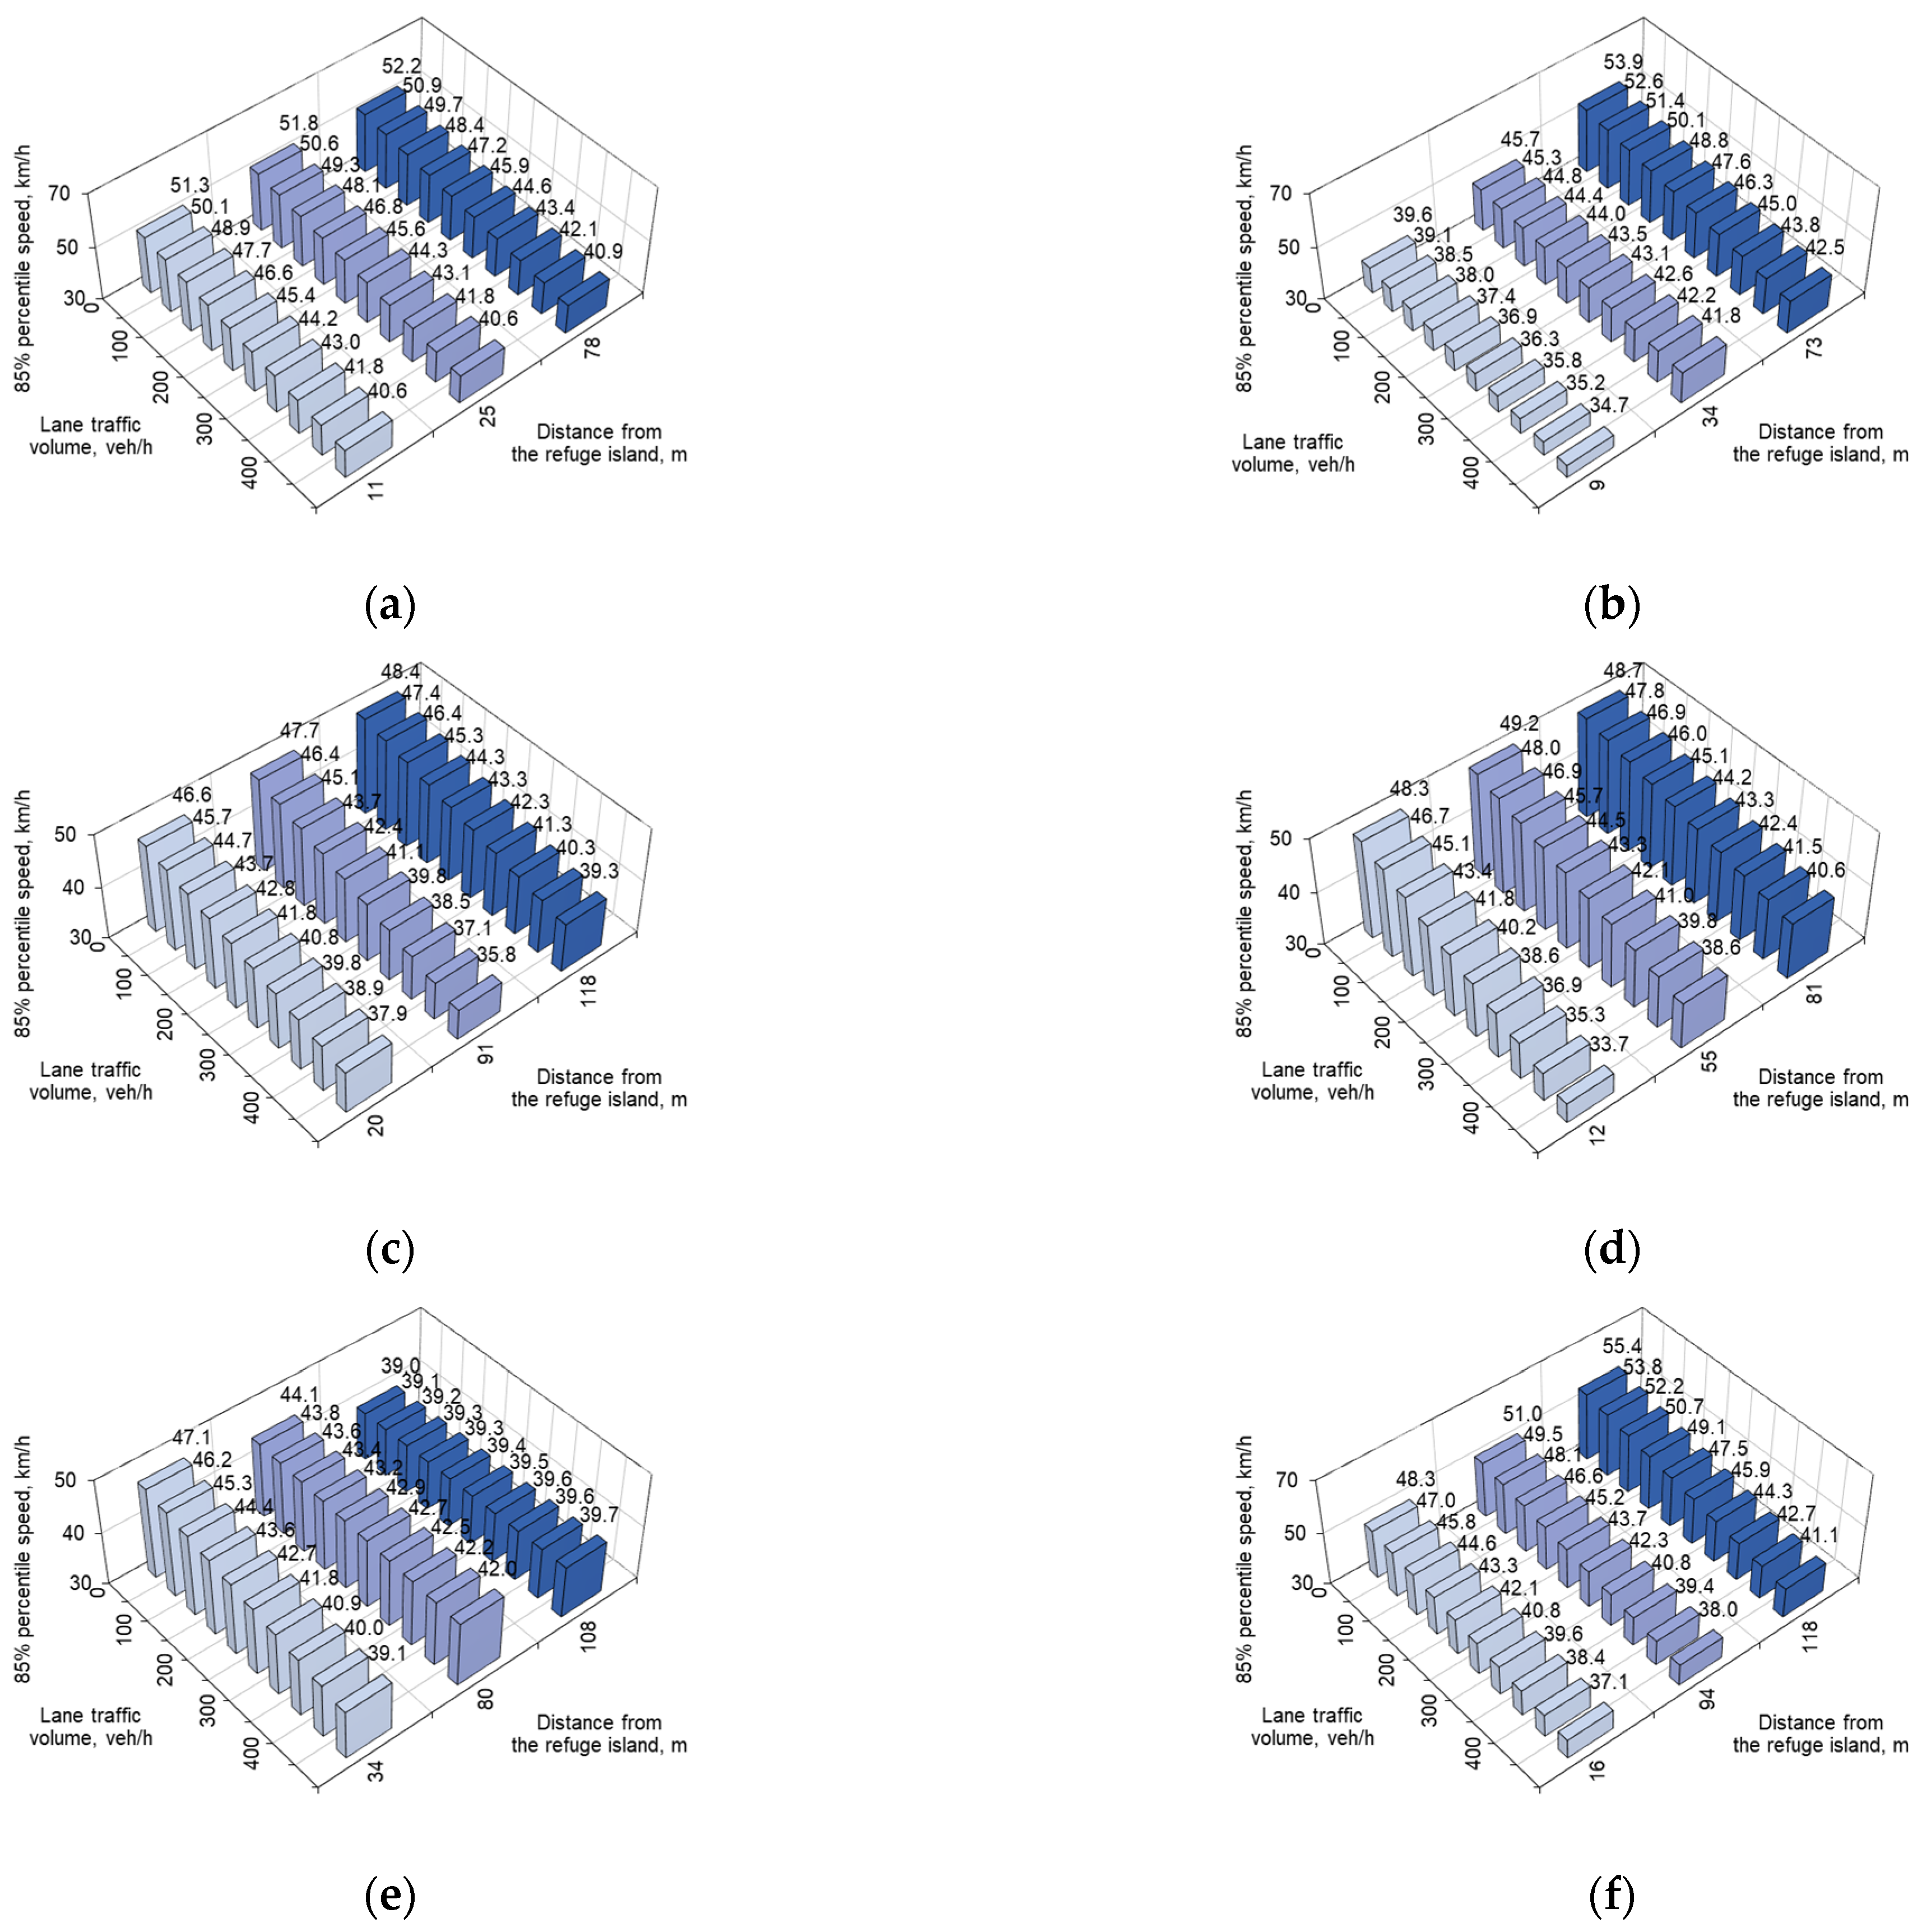
85th percentile speeds varied by up to 0.1–0.2 km/h,
-
average speeds ranged from 0.5 to 1.0 km/h.
The data recorded by the SR4 traffic detectors (boxed in green in Figure A3 in Appendix C): vehicle speed in km/h, headway in meters, time intervals, measurement date and time to one-second accuracy, and all the statistical data (values boxed in brown and red in Figure A3 in Appendix C). These data allowed the carrying out of other, supplementary analyses, for example, to determine the effect of braking on the speed of the following vehicle. The results showed lower following vehicle speeds for up to 4 sec time intervals between consecutive readings (boxed in blue in Figure A3 in Appendix C), which depended on the headway to the decelerating vehicle. For time intervals greater than four seconds, the following vehicle speed readings that depended on the headway to the decelerating or parking vehicles did not depart from the relevant mean speeds of other vehicles in the street. For the sake of consistency of the data used in the speed variation analysis, the readings below 10 km/h were left out in all analyses; this is in line with the design of experiment (DOE) principles [67,68,69].

2.4. Research Methods

The analysed parameters were 85th percentile speed, mean speed, and speed reduction ratio, determined in the data subsets defined by hourly traffic volume ranges. As mentioned, the heuristic method was chosen for the purposes of this study.
The sequence of the flow chart analyses is shown in Figure 7. Standard statistical analyses are conducted as the first step (Figure 7), including the normality test, plotting histograms of the factors under analysis, Two-sample Kolmogorov–Smirnov test, and median test. The third tool of the heuristic method used in this study was scatter diagrams relating the vehicle speeds to the hourly traffic volumes (Figure 7). Relationships between v85 and vav on the one hand and the hourly traffic volumes on the other were obtained in almost all cases with a correlation coefficient greater than 0.7. However, this relationship was not confirmed for entry to and exit from a signalled junction or roundabout. On all other survey stations, both these speeds were found to depend on the hourly traffic volume.
The fourth tool of the heuristic method used in this study was 3D diagrams (Figure 7) representing speed and speed reduction ratio variations between the block entry and the refuge island. The speed and speed reduction ratio distributions turned out useful and were used to define the determinants associated with the refuge island itself and its visibility to the driver.
The fifth tool was 3D and linear control charts of speed changes and speed reduction ratios along the street under analysis (Figure 7). The analyses of the geometric and qualitative parameters, various speed distributions, and statistical test results were used to define the determinants initially. These determinants were presented in the Ishikawa cause-and-effect diagram, the sixth tool of the heuristic method applied in this study. A division into primary and secondary causes of the analysed slowing effect was made at this point. It was assumed that these determinants may be related to each other or independent. Stratification or concordance matrices are applied when dealing with a large number of determinants, most conveniently represented in the Pareto charts [47,48,49,50,51,52,53], the seventh tool of the heuristic method. In the Pareto chart, the determinants were rated in the order of decreasing effect, i.e., from the lowest to the highest approach speed or from the greatest to the lowest speed difference between the block entry and the refuge island station. The determinants were assessed in two ways: as a series of speed values before the refuge island and speed differences related to a given determinant or using an illustrated, summed-up number of determinants confirmed on a given study section. The adopted sequence of the heuristic method analyses allowed us to identify the refuge island approached at the lowest speeds or featuring the greatest speed difference on the approach section (Figure 7) and, as the final outcome, also identify the relevant determinants. In the summary of the conducted analyses, it will also be possible to identify the most effective among the applied TCMs. The control charts, in turn, allowed the determination of treatments having a prolonged slowing effect also past the terminal junction, i.e., in the next section of the street.

3. Results

As mentioned, the speed data set was subdivided into subsets defined by hourly traffic volume ranges. Considering the amount of data from the round-the-clock, two-day speed survey with about 16,000–18,000 readings per one SR4 detector, it was necessary to decide on the appropriate approach to be taken in the subsequent analyses. The parameters considered in previous studies [28,29,30,35,36] were the 85th percentile speed and the mean speed, while in traffic safety analyses, mean speed was considered [12,22,27,70,71,72,73,74,75] Kruszyna & Matczuk-Pisarek [31], in turn, used a speed reduction ratio, and Distefano et al. [29,30] expressed the speed reductions between the point in front of the refuge island and some distance earlier in percentages. Jamroz et al. [25] used solely the 85th percentile speed as this parameter is used for the purpose of speed limit analyses and the associated selection of the appropriate speed limit sign. From this wide selection of the available speed parameters, 85th percentile speed, mean speed, and speed difference (between the section entry and refuge island) were chosen for the purposes of this study, i.e., TCM efficacy assessment. Having in hand such an extensive database, it was possible also to consider in this study the hourly traffic volume effect. The analysis of 24-h speed data with the measurement time given to 1 sec accuracy (Figure A3 in Appendix C) showed that the so-far used free-flow speed may be deemed to correspond to the values obtained at an hourly traffic volume below 50 veh/h. However, one should bear in mind that these speeds concern mainly the night period when they are not influenced by pedestrian traffic (Appendix B Figure A2).
As per the adopted methodology and the statistical test results (Table 2), the speed data normality and stratification depending on the hourly traffic volume and the survey station location in relation to the analysed refuge island were checked as the first step. The obtained results of speed changes at the refuge island are shown in Figure 8. Figure 8 shows the 85th percentile speed distribution among three survey stations for all six analysed street sections along the refuge island approach section. The obtained speed changes presented in Figure 8 show a strong relationship with the hourly traffic volume and other factors, including those related to the implemented TCMs. These are most likely the determinants sought in this study.
The values of v85 and vav were calculated for all the survey stations and each survey hour. Next, the speed results data set was subdivided into hourly traffic volume subsets, and regression analyses were carried out. Appropriate regression relationships were obtained for all the results. Considering low hourly volumes overnight (not exceeding a dozen plus veh/h), larger scatters of v85 and vav were obtained only for the up to 50 veh/h range. Illustrative speed vs. hourly traffic volume relationships are given in Figure 9.
Linear control charts were the next heuristic method tool used in this study. Specifically, these were linear speed change diagrams along the analysed street sections (Figure 10). From the graph in Figure 10, it can be figured out that not all the refuge island-related TCMs should be considered effective. The greatest speed variations were noted in the direction W→E sections WE1, WE3, and WE2 (Figure 10a,b). In the direction E→W, the speed changes were only minute. Figure 10c,d also shows an increase in speed past the refuge island EW1 associated with the widening of the carriageway to two travel lanes ahead of a signalled junction and signal phases rather than the applied TCMs.

4. Discussion

4.1. Primary and Secondary Determinants—Cause-and-Effect Diagram

Figure 11a,c shows the driver’s central vision area at different speeds. In order to reflect the 50 km/h speed limit on the analysed street (i.e., the statutory built-up area speed limit in Poland), the driver’s central vision area at this speed was represented by a colour area on the images of the respective refuge islands, turned to greyscale in the fringe vision area. The latter is also a focal vision area, yet it requires the driver to move ahead and direct their eyes sideways while driving. In line with the heuristic method principles and guidelines to use the cause-and-effect diagram to identify the determinants, the probable determinants noted on the analysed refuge island are presented in Figure 11b as the next step of the mentioned analyses. The probable determinants in Figure 11b were identified initially based on the TCMs located at the refuge islands shown in Figure 11a,c.
The parameters recorded on the analysed refuge islands showed the relevance of free view width “a” in line with the already published findings [34,35,36]. The studies described in [34,35,36] investigated the effect of horizontal deflection treatment located before a median island on speed reduction past the island. It is a different case in this article, where we assess the slowing effect of TCMs and refuge islands on the approach section to the latter. A double horizontal deflection treatment with a 1.3-m offset to the right, followed by a 3.3-m offset to the left was found only in the study section WE1 (Figure 11c). The free view width “a” was large there, encompassing the whole lane past the refuge island. The greatest speed differences were noted, in this case, in all hourly traffic ranges. A 1 m offset (equal to half the refuge island width) to the right was noted at WE3 (Figure 11c). The study sections WE2 and EW2 (Figure 11a,c) featured a horizontal deflection to the right, clearly visible to the approaching driver, located before the junction with half the refuge island width offset, and a horizontal deflection to the right with the same offset on the section past the junction. The sections EW1 and EW3 had no deflections, giving small, if any speed, differences noted there (Figure 11a). Horizontal deflection and free view are intrinsically linked to visibility, as shown in Figure 11 and Figure 12. Figure 12a,c also shows the driver’s central vision area against the clear sight width at the road surface level before the first refuge island (green area) and past the second refuge island (blue area). The issue of visibility at refuge islands was dealt with by several researchers [25,76,77,78,79,80,81,82]. The vision field depends on the driving speed and stopping distance (braking distance plus reaction distance) [78,80,82,83,84,85,86,87]. In the abovementioned articles, vision fields varied, as besides the driving speed, they depended on different country standard reaction times and decelerations, the road surface condition, and the longitudinal profile of the carriageway.
For the purposes of this study, a 13 m clear sight width was adopted as per the guidance of [83]. The field of vision analysis presented in Figure 12 showed that in horizontal deflection layouts, the fields of vision add up, and a driver approaching the refuge island for pedestrians, sees a vehicle parked past the island as a side obstacle with a clear sight width past the island obstructed by the traffic signs located on the island (Figure 11a). The combined effect of these determinants may be considered the most likely cause of the large speed reduction in the approach to WE1. The layout of traffic signs located on the refugee islands and the horizontal and vertical curves in the C junction also partly restrict the clear sight width past the WE3 island and past the junction (Figure 12c). Horizontal deflection was also found there. However, the geometrical features, two lanes past the junction, a cycle lane, and cars parked on the footpath, were found to have less effect on the speed reduction before WE3 [3]. In the next section, WE2, the configuration of these geometrical features was found to have much less effect on the speed reduction obtained before the refuge island (Figure 12b).
On the sections located in the opposite traffic direction, the geometrical features and the TCMs were not found to have any significant slowing effect. EW1 may be an exception to that, where the view of cars parked partly on the carriageway on the right-hand side and restricted view past the island due to traffic signs positioned on the refuge island could possibly have some effect on the small, any-way speed reduction (Figure 6a and Figure 12a).
The next of the identified determinants concerns the applied painted taper before the refuge island. It is similar to the path angle issue addressed in [35]. However, the TRL trial data [35] cannot be compared with the results of this study, as the former (speed data from over a dozen TRL track rides by experienced drivers) lacks traffic volume information. Nevertheless, the TRL trial data may still be roughly compared with the results obtained in this study at 50 veh/h traffic volume level. Note that the data given in this article relate to the actual traffic conditions in an existing street, taking into account a number of other determinants. The tapered design varied among the analysed refuge islands, with 1:5 tapers on WE1, WE2, and EW2 and 1:10 tapers on WE3. EW1 and EW3 islands had no tapers at all (Figure 12). The issue of tapers in front of refuge islands was tackled in [25]. It was concluded that a 1:5 taper should be used in city traffic conditions, possibly with one or more painted tapers before. However, it should not be used at entrances to sections that include TCMs.
A determinant that may affect the desired slowing before refuge islands could also be a variation in the number of lanes heading in one direction before and past the junction. Such variation in the number of lanes occurs in the terminal sections WE3 and EW1, shown in Figure 11 above and in Figure A1 in Appendix A. The next three determinants identified for the purposes of this study are related to the travel lane geometry (arrangement of straight sections and curves on the approach to and within the junction) and parking orientation on both sides of the street. Change of parking configuration from parallel to diagonal, or vice-versa, imposes a horizontal deflection, the use of horizontal curves, and the associated road markings (Figure 4, Figure 11, and Figure 12).

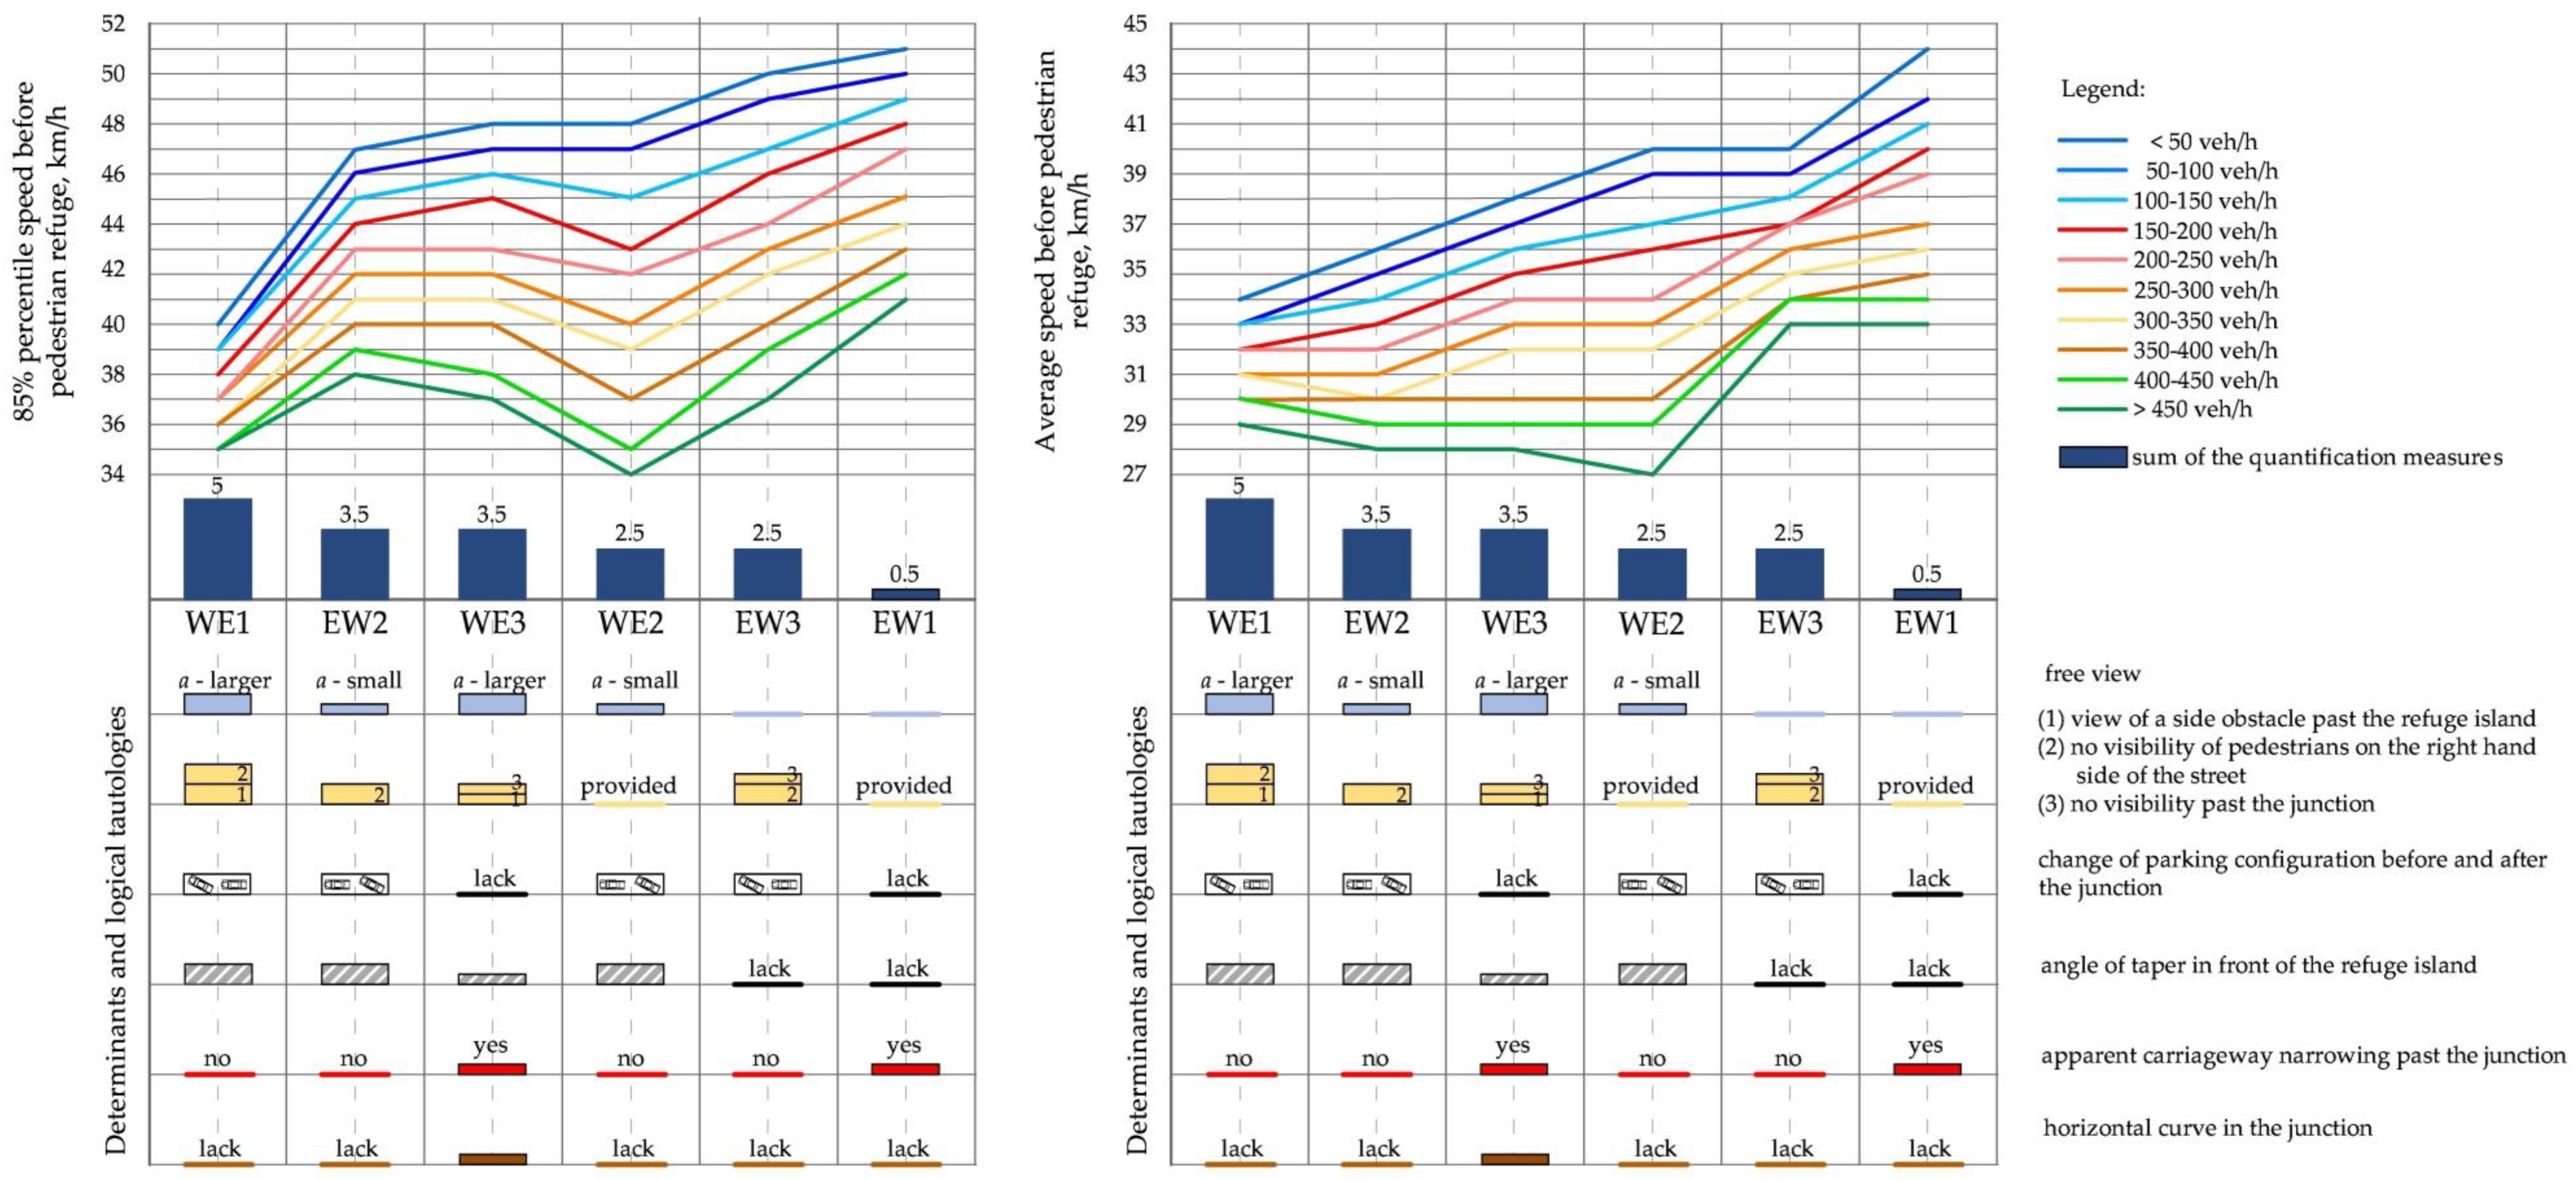
4.2. Analysis of Determinants Based on the Pareto Chart

The identified determinants, as defined in Section 4.1 above, were assessed using logical tautologies. Thus, if a determinant was confirmed in a given section on the approach to the refuge island, it received a quantification measure score of 1 as per the binary system. Otherwise, it received a 0 score. In some cases, a 0.5 score was given as an intermediate value. This includes free view “a”—(small) situations, in line with the conclusions of [37] (WE2 and EW2 in Table 3). Similarly, an intermediate score was given for a 1:10 painted taper; this is in line with the recommendations of [25] (Table 3—WE3). Intermediate scores were also given where a left-hand curve was found in the junction (WE3 in Table 3), as the horizontal curve configuration had a direct bearing on the visibility of the road section past the junction. A possibility of apparent carriageway narrowing past the junction was confirmed in two cases, possibly due to compromised visibility of the road surface past the junction (WE3 and EW1 in Table 3). The determinants used in the analysed sections and their quantification scores are summarised in Table 3. Table 3 includes only the determinants that were found in the sections under analysis.
The classified quantification measures assigned to logical tautologies were separate and joint. The Pareto chart (Figure 13 left) shows the 85th percentile speeds before the refuge island and their total scores. The upper part of the Pareto chart shows stratification of the 85th percentile speeds recorded before the refuge island at different hourly traffic volumes, and the bottom part shows the confirmed determinants and total scores of the quantification measure applied to them. Having a closer look at the data presented in Figure 13 left, we see that speed variation at the refuge island depends on the combined effect of all the above determinants and the traffic volume rather than any one of them on their own. The 85th percentile speed variations on the respective sections showed their strong relationship with free view and visibility parameters. That said, the strongest relationship was found for the combination of the confirmed logical tautologies and the hourly traffic volume, especially for the volumes greater than 150–200 veh/h (Figure 13). Similar analyses are presented for the mean speed variations before refuge islands (Figure 13 right). The mean speed analysis showed that it depended even more on the hourly traffic volume above the 100–150 veh/h range and on the combined effect of the following determinants: free view, visibility, change of parking configuration, and painted taper. However, this dependency is very complex. The joint analysis of the mean speed variation, traffic volumes, and the determinants showed that the more determinants are involved (including TCMs), the greater their overall effect on the speed of vehicles approaching a refuge island. For example, without painted tapers, with travel lane visibility before the island, without visibility of pedestrians approaching the island from the right-hand side, and poor visibility of the road surface past the junction on EW3 or no confirmed determinants as was the case on EW1, we obtained a 85th percentile speed of about 50 km/h (Figure 13 left), i.e., the statutory built-up area speed limit in Poland and 40–45 km/h mean speed (Figure 13 right). Now, based on the above analyses, we can rate the analysed TCMs and other factors noted at the refuge islands as:
(a)
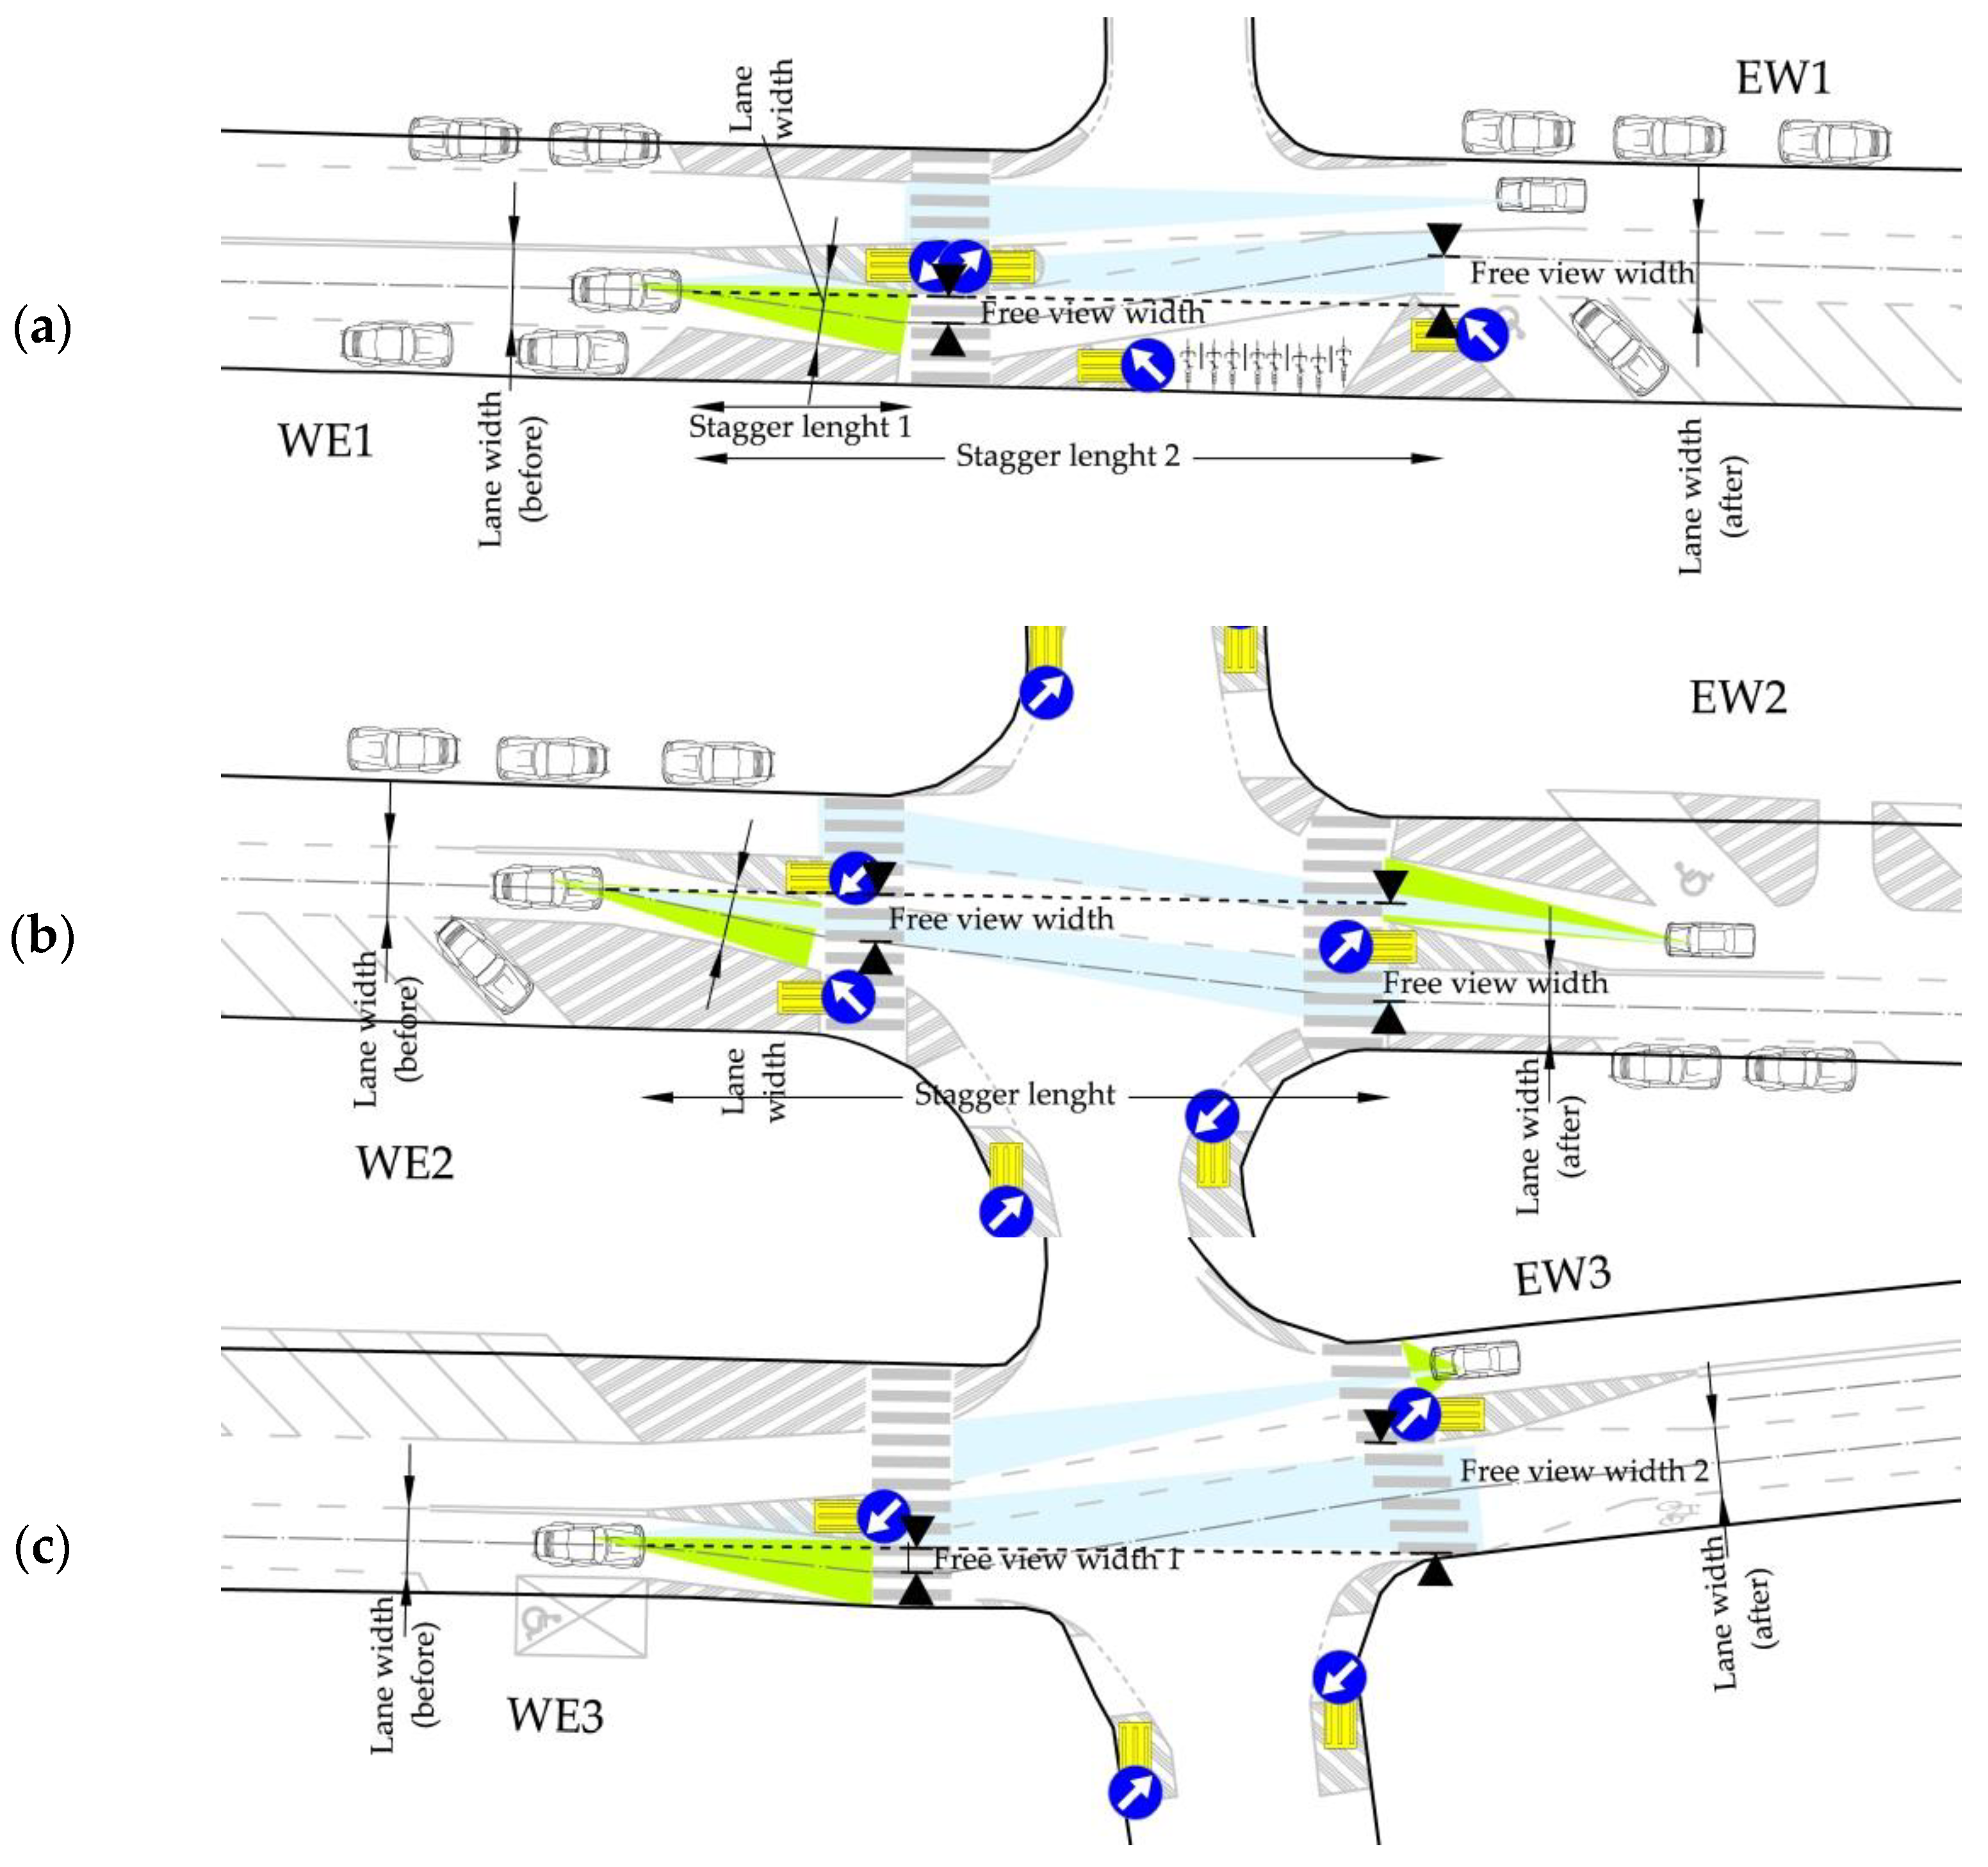
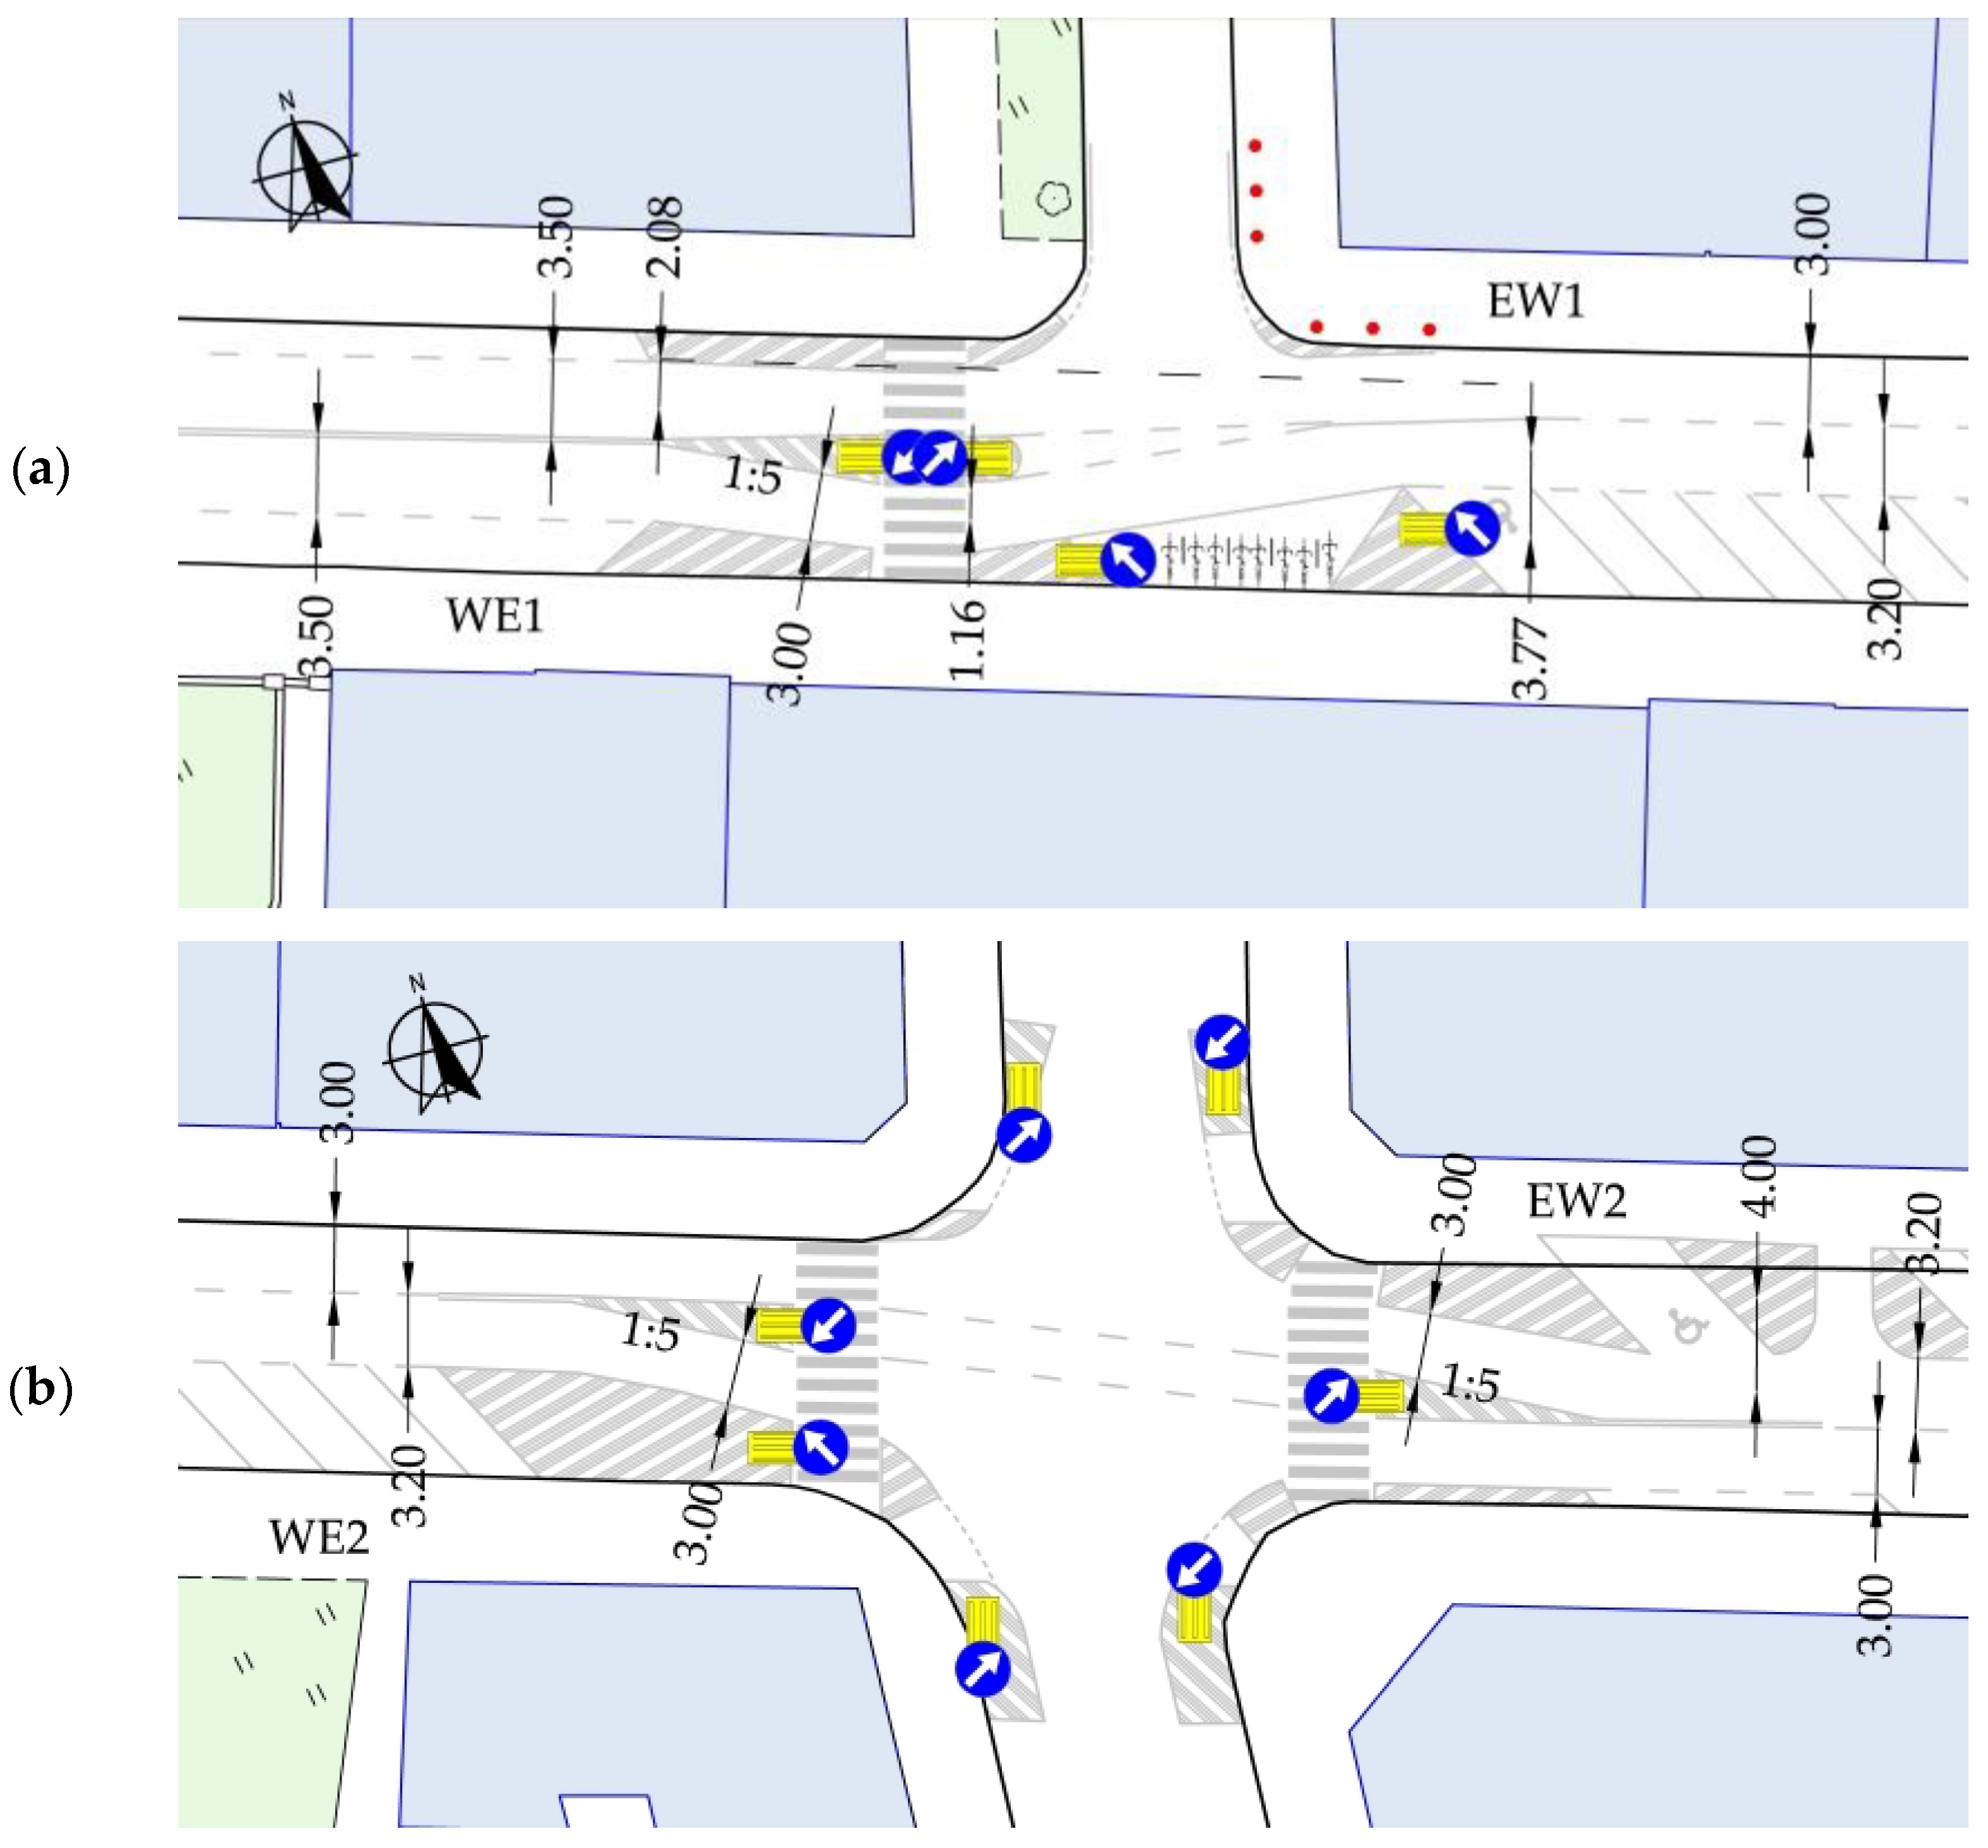
effective (WE1)—with a change of on-street parking configuration from parallel to diagonal or vice-versa requiring the driver to change the travel path, a 1:5 taper or road and island geometry designed to get free view “a”—larger so that a vehicle parked in the travel lane is visible as a side obstacle and the travel lane at the road surface level past the island is not visible by the driver approaching the island, altogether resulting in lower island approach speeds;
(b)
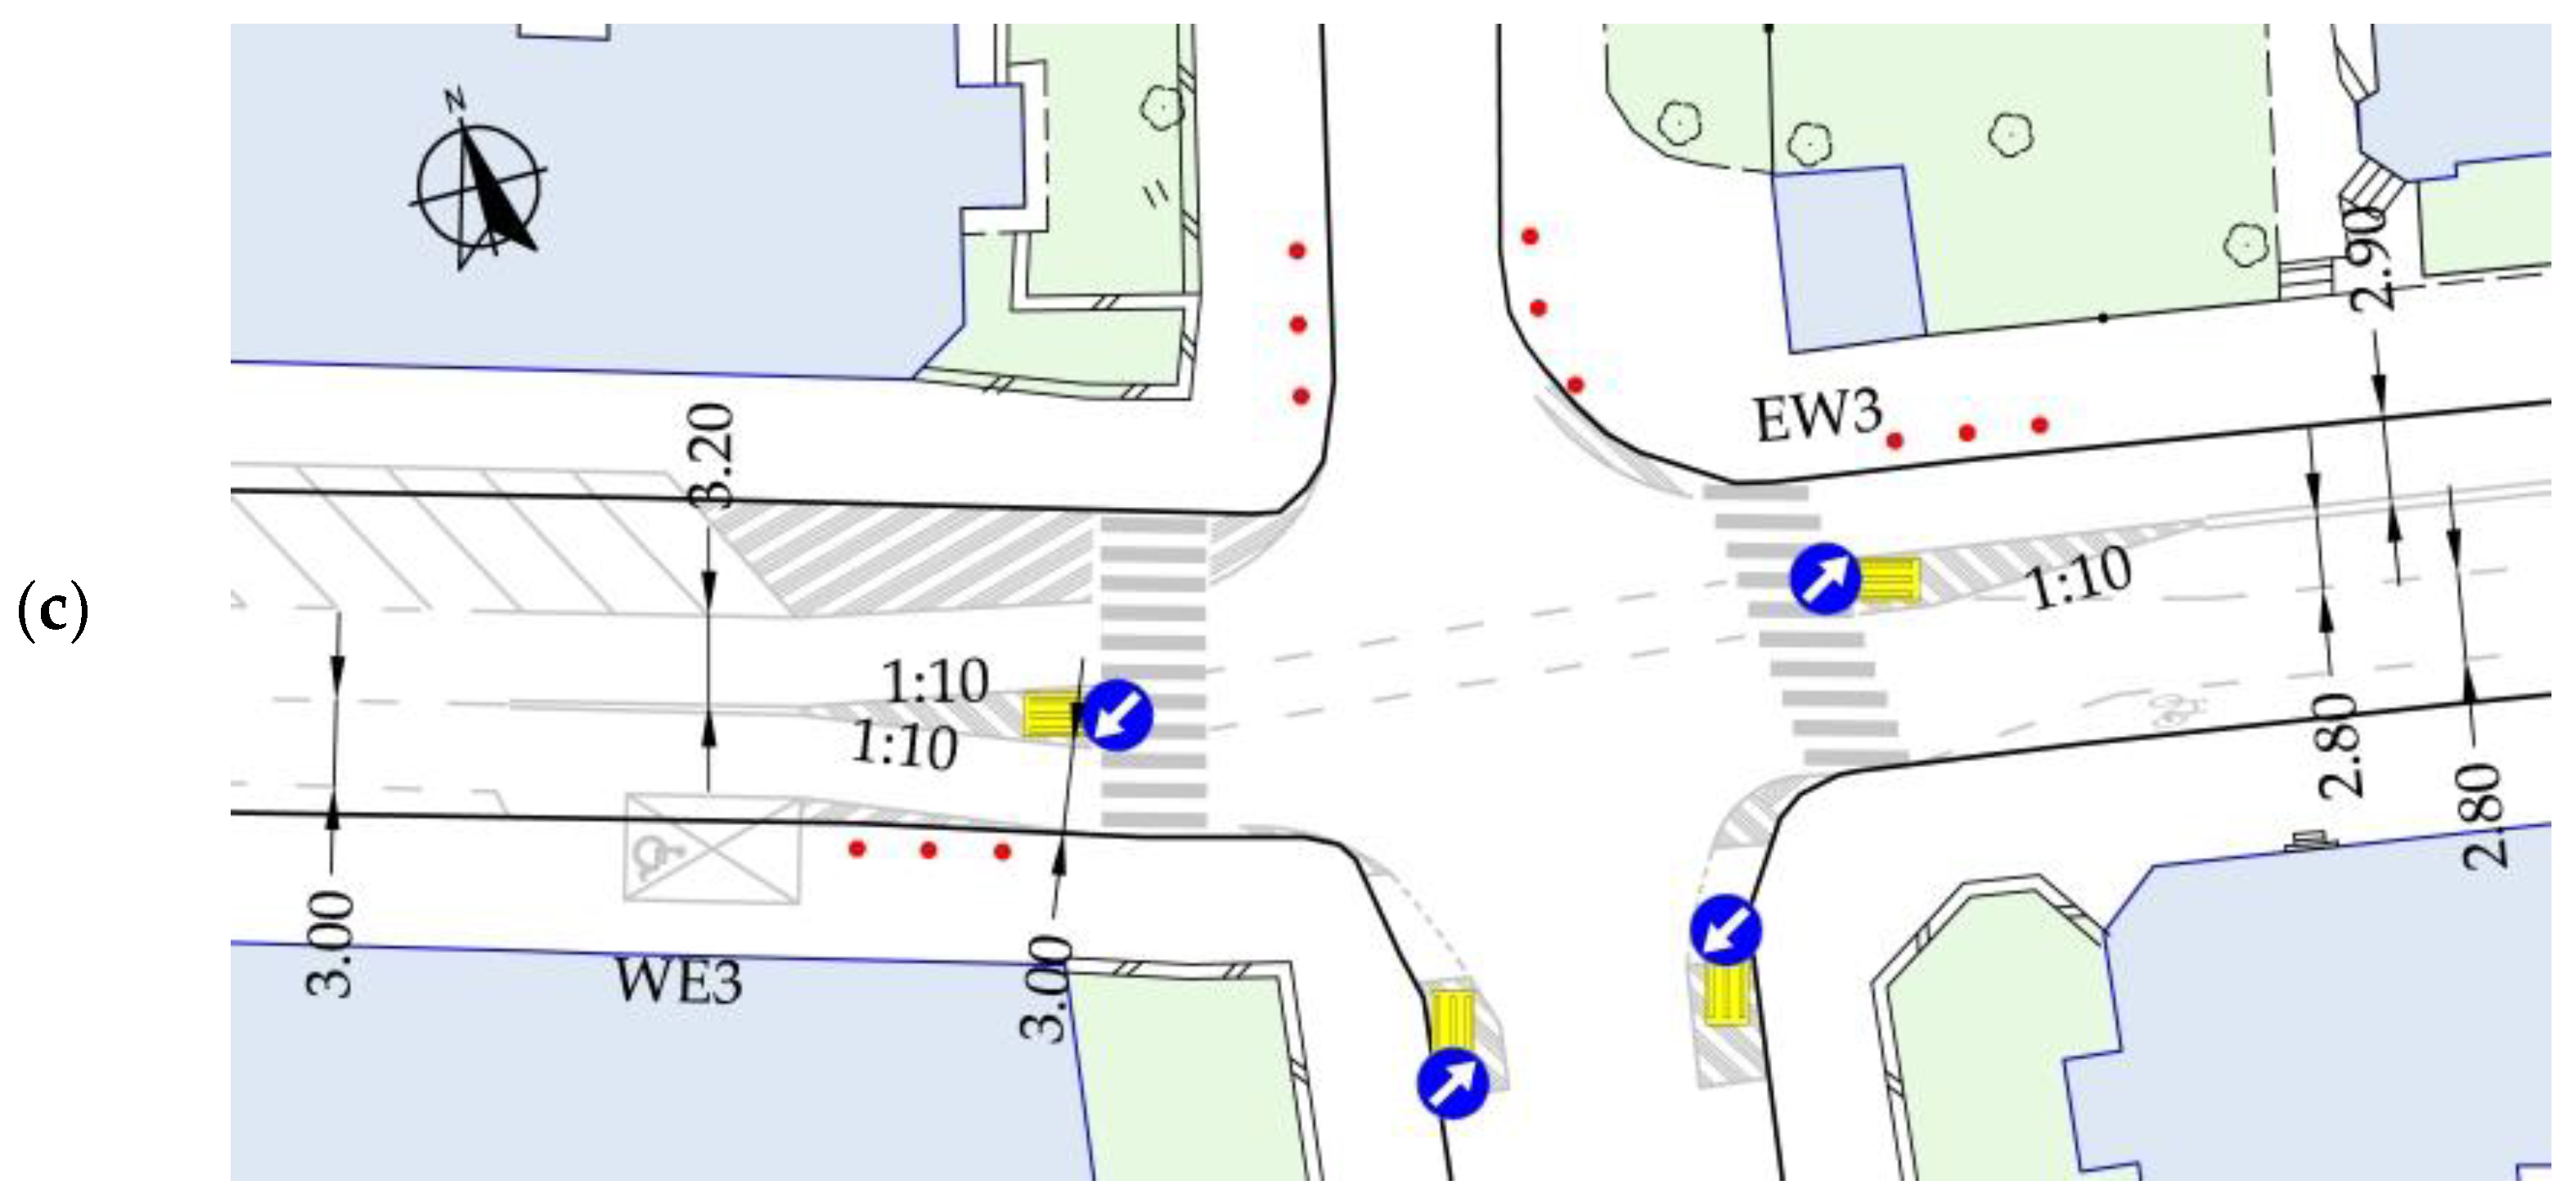
moderately effective (WE2, WE3, and EW2) with narrower free view width of “a”—small, a 1:5 or 1:10 painted taper, and change in parking configuration and different ways of targeting parking spaces, which in combination produce different geometry and visibility configurations offering the driver a reliable assessment of the road situation during approaching and passing the island and resulting in moderate speed reduction;
(c)
ineffective (EW2 and EW3) with “a+ free view, no change of parking configuration, no painted tapers, no horizontal deflection, and no sight restrictions for the driver approaching and passing the island, discouraging speed reduction.
As mentioned, the speed reduction analyses conducted in this study also considered, besides the 85th percentile speed, the relative speed reduction in percentages, calculated as a ratio between the 85th percentile approach speed and the block entry speed [29] and various other speed reduction indicators [31]. However, these parameters were assessed in relation to the free flow speed. Having in hand the two-day, 24-h survey data it was also possible to also analyse the effect of the geometrical features and TCMs in combination with hourly traffic volumes on the calculated approach speed parameters v85 and vav, estimated before refuge island. It was found that v85 and vav variations depended on the hourly traffic ranges from free-flow conditions to the maximum of 500 veh/h at 50 veh/h intervals. The underlying cause of the two-day continuous survey was to support the determination of which of the analysed six pedestrian refuge arrangements turns out to be the most effective in real traffic conditions (with 0–500 veh/h hourly traffic volumes) rather than in a free-flow situation.
Next, having in mind the speed change effect on noise, safety, and vehicle emissions, i.e., the factors intrinsically related to sustainable road construction, we compared the values of ∆v85 and ∆vav noted before the refuge islands with the block entry values of v85 and vav (Figure 14). A detailed analysis of the obtained hourly traffic volumes together with the adopted determinants on ∆v85 and ∆vav the island approach speed difference depended on the identified determinants and the hourly traffic volume on a majority of the analysed sections. Noteworthy, this relationship was found to vary depending on the island geometry and the specific TCMs and traffic volume compilation. Highly relevant in this respect were the free view width and visibility of side obstacles, pedestrians, and the road surface past the junction. Where the various determinants were confirmed (regarding the free view, visibility, painted taper angle, and change of parking configuration), as the hourly traffic intensity increased, ∆v85 and ∆vav were found to decrease on the approach to the island. This may be due to lower block entry speeds or higher speeds just before the refuge island. The lowest speed difference was obtained for EW1 where only free view of “a”—small and apparent carriageway narrowing past the junction was noted. Without a horizontal deflection or changed parking configuration, the section offers very good visibility on the approach to and past the pedestrian island, while the view of two travel lanes heading in the same direction past the junction and of the cantilevered traffic lights was found to have no slowing effect. WE2 is one exception in this analysis, in that it offered a good view of the constant geometry travel lane and the cars parked on the footpath parallel to the road past the island and past the junction, despite the free view “a”—small, a 1:5 painted taper, and a change of parking configuration. This being so, the obtained values of ∆v85 and ∆vav most probably depended on the hourly traffic volume only. In the case of WE2 and EW3, the growing hourly traffic volume gradually increased the difference between these two speed parameters. On EW3, the travel lane does not change its geometry before the island, and the change in the parking configuration past the island has no significant effect on the analysed speed differences before the island.
The above findings are apparently consistent with the findings of the simulator study by Akgol et al. and Aydin et al. [33,34]. The difference between these studies was in single lane narrowing of the two-lane carriageway at the pedestrian crossing, which is not the case in this study, where there are two travel lanes running in opposite directions in all cases. For economic reasons, the authors of [33,34] recommended a one-sided splitter island on the right-hand side of the travel lane before the refuge island, as is the case in the WE2 and EW2 sections analysed in this study. Comparing their recommendations and the results presented in Figure 13 and Figure 14, it can be concluded that this arrangement would not be effective for refuge islands located on junctions. The second, more expensive option recommended in [33,34] are two one-sided islands on either side of the refuge island, as in our study section WE1. The above findings are apparently consistent with recommendations for refuge islands located in junctions with horizontal deflection by three islands, resulting in a flattened U-deflected path of travel instead of a flattened “S” shape and a one-sided island on the right-hand side of the approach to the pedestrian refuge.
The findings of this study are also highly consistent with the findings presented in [28] despite different study areas and countries with different tempers and driving behaviours found there. In both cases, lane narrowing was found to be the most effective treatment at refuge islands, accompanied by horizontal deflection, additional one-sided splitter islands on both ends of the island, and painted tapers, that is the use of a few TCMs deployed within a short distance.

5. Conclusions

As the literature review showed, studies on refuge island treatments date back to the late 1990s. Nevertheless, international experiences show that the issue has not been studied completely as yet, and we still do not have definite design principles at hand. The speed-reducing effect of pedestrian refuges and, more importantly, improved safety of pedestrians have been demonstrated by the study results of many researchers. The available design guidelines focus on the island width and angle of the painted taper applied in front of the island. Less attention is paid to the conditions relevant to the visibility of pedestrians on the way to the refuge island, visibility of the nearby junction at the road surface level, visibility of side obstacles, specifically cars parked at a small distance past the island, and to the effect of hourly traffic volume on the degree of slowing on the way to the island. The relevance of these determinants has been demonstrated in this article. The speed analyses conducted as part of this study in the refuge site locations confirmed high relevance:
-
of free view
-
visibility of pedestrians, and,
-
refuge island surroundings.
Less relevant were:
-
change in the parking configuration, both on the way to and past the island, and,
-
taper angle.
Also highly relevant was the compilation of the above determinants, considered in combination with hourly traffic volumes.
Comparing the results of this study with the former study results we also found that the various speed parameters and ratios were so far compared in free-flow traffic conditions, thus ignoring the effect of the traffic volume. The relevance of traffic volume was demonstrated in this study, since the drivers tend to react differently when exposed to a higher number of stimuli present on a two-way road, as compared to the test track or simulator-based situations.
The determinants whose relevance has been proven in this article show a need for further analyses and studies to be conducted by other researchers to consider different drivers’ tempers, engineering experiences, and cutting-edge technologies applied in various island, lighting, and structural details. A complete set of design guidelines would also be desired that would consider, besides the island width and the island taper angle, also the design parameters of the junction ahead, visibility parameters, and townscape surrounding. Only when considered all together, these recommendations will ensure the safe design of pedestrian refuges and the associated speed management in downtown streets. Steadier speeds being a probable consequence, the desired reduction of noise and vehicle emissions around refuge islands may well be expected.

Author Contributions

Conceptualization, A.S.; methodology, A.S. and S.M.; software, A.S. and S.M.; validation, A.S. and S.M.; formal analysis, A.S. and S.M.; investigation, A.S. and S.M.; data curation, S.M.; writing—original draft preparation, A.S.; writing—review and editing, A.S. and S.M.; visualization, A.S. and S.M.; supervision, A.S. All authors have read and agreed to the published version of the manuscript.

Funding

This research received no external funding.

Institutional Review Board Statement

Not applicable.

Informed Consent Statement

Not applicable.

Data Availability Statement

The data presented in this study are available in the article.

Acknowledgments

The authors would like to thank Krzysztof Bujak of the City Office of Szczecin for providing information regarding the project: “Traffic organization design along 5 Lipca Street on the section from Bohaterów Warszawy Avenue to Szarych Szeregów Place”.

Conflicts of Interest

The authors declare no conflict of interest.

Appendix A

Study section parameters.
Figure A1. Geometrical features of the study sections: (a) WE1 and EW1; (b) WE2 and EW2; (c) WE3 and EW3. (All distances are in metres). Source: own work.
Sustainability 15 15265 g0a1aSustainability 15 15265 g0a1b

Appendix B

Figure A2. Hourly traffic volumes: (a) in the direction W→E; (b) in the direction E→W. Source: own work.
Sustainability 15 15265 g0a2

Appendix C

Figure A3. Example of SR4 traffic detector log (of the date: 26 May 2023). Source: own work.
Sustainability 15 15265 g0a3

References

  1. National Association of City Transportation Officials. Urban Street Design Guide; National Association of City Transportation Officials: Washington, DC, USA, 2013. [Google Scholar]
  2. Vejdirektoratet-Vejregeludvalget. Urban Traffic Areas—Part 7—Speed Reducers; Vejdirektoratet-Vejregeludvalget: Copenhagen, Denmark, 1991. [Google Scholar]
  3. Institute of Transportation Engineers. Traffic Calming Guidelines; Devon County Council Engineering & Planning Department: Devon, UK, 1992. [Google Scholar]
  4. East Ayrshire, Strathclyde Regional Council. Roads Development Guide; East Ayrshire, Strathclyde Regional Council: London, UK, 2010. [Google Scholar]
  5. Working Group Highway Design. Directives for the Design of Urban Roads RASt 06; Working Group Highway Design FGSV: Köln, Germany, 2006. [Google Scholar]
  6. Elvik, R. Area-wide urban traffic calming schemes: A meta-analysis of safety effects. Accid. Anal. Prev. 2001, 33, 327–336. [Google Scholar] [CrossRef] [PubMed]
  7. Jones, P.; Hervik, A. Restraining car traffic in European cities: An emerging role for road pricing. Transp. Res. Part A Policy Pract. 1992, 26, 133–145. [Google Scholar] [CrossRef]
  8. Mei, Z.Y.; Feng, C.; Kong, L.; Zhang, L.H.; Chen, J. Assessment of different parking pricing strategies: A simulation-based analysis. Sustainability 2020, 12, 2056. [Google Scholar] [CrossRef]
  9. Mingardo, G.; van Wee, B.; Rye, T. Urban parking policy in Europe: A conceptualization of past and possible future trends. Transp. Res. Part A Policy Pract. 2015, 74, 268–281. [Google Scholar] [CrossRef]
  10. VanHoose, K.; de Gante, A.R.; Bertolini, L.; Kinigadner, J.; Büttner, B. From temporary arrangements to permanent change: Assessing the transitional capacity of city street experiments. J. Urban Mobil. 2022, 2, 100015. [Google Scholar] [CrossRef]
  11. Jazcilevich, A.; Vázquez, M.J.M.; Ramírez, P.L.; Pérez, I.R. Economic-environmental analysis of traffic-calming devices. Transp. Res. Part D Transp. Environ. 2015, 36, 86–95. [Google Scholar] [CrossRef]
  12. Lee, G.; Joo, S.; Oh, C.; Choi, K. An evaluation framework for traffic calming measures in residential areas. Transp. Res. Part D Transp. Environ. 2013, 25, 68–76. [Google Scholar] [CrossRef]
  13. Bellefleur, O. Urban Traffic Calming and Air Quality: Effects and Implications for Practice; National Collaborating Centre for Healthy Public Policy: Québec, QC, Canada, 2012. [Google Scholar]
  14. Bellefleur, O.; Gagnon, F. Urban Traffic Calming and Health: A Literature Review; National Collaborating Centre for Healthy Public Policy: Montréal, QC, Canada, 2011. [Google Scholar]
  15. Daham, B.; Andrews, G.E.; Li, H.; Partridge, M.; Bell, M.C.; Tate, J. Quantifying the Effects of Traffic Calming on Emissions Using On-road Measurements (Report No. 2005-01-1620); SAE International: Warrendale, PA, USA, 2005; Available online: http://eprints.whiterose.ac.uk/2050/1/2005-01-1620SOrion_peedbump.pdf (accessed on 2 August 2023).
  16. Boulter, P.G.; Hickman, A.J.; Latham, S.; Layfield, R.; Davison, P.; Whiteman, P.P. The impact of traffic calming measures on vehicle exhaust emissions; Report 482; Transport Research Laboratory TRL: Wokingham, Berkshire, UK, 2001. [Google Scholar]
  17. Sun, M.; Sun, X.; Shan, D. Pedestrian crash analysis with latent class clustering method. Accid. Anal. Prev. 2019, 124, 50–57. [Google Scholar] [CrossRef]
  18. Guéguen, N.; Meineri, S.; Eyssartier, C. A pedestrian’s stare and drivers’ stopping behavior: A field experiment at the pedestrian crossing. Saf. Sci. 2015, 75, 87–89. [Google Scholar] [CrossRef]
  19. Balasubramanian, V.; Bhardwaj, R. Pedestrians’ perception and response towards vehicles during road-crossing at nighttime. Accid. Anal. Prev. 2018, 110, 128–135. [Google Scholar] [CrossRef]
  20. Li, Y.; Fan, W. Modelling severity of pedestrian-injury in pedestrian-vehicle crashes with latent class clustering and partial proportional odds model: A case study of North Carolina. Accid. Anal. Prev. 2019, 131, 284–296. [Google Scholar] [CrossRef] [PubMed]
  21. Sołowczuk, A.; Kacprzak, D. Identification of determinants of the speed-reducing effect of pedestrian refuges in villages located on a chosen regional road. Symmetry 2019, 11, 597. [Google Scholar] [CrossRef]
  22. Balant, M.; Lep, M. Comprehensive traffic calming as a key element of sustainable urban mobility plans-impacts of a neighbourhood redesign in Ljutomer. Sustainability 2020, 12, 8143. [Google Scholar] [CrossRef]
  23. Road and Transportation Research Association. Directives for the Design of Urban Roads; Road and Transportation Research Association: Köln, Germany, 2012. [Google Scholar]
  24. Zalewski, A.; Kempa, J. Traffic calming as a comprehensive solution improving traffic road safety. In IOP Conference Series: Materials Science and Engineering; IOP Publishing: New York, NY, USA, 2019; Volume 471, p. 062035. [Google Scholar] [CrossRef]
  25. Jamroz, K.; Gaca, S.; Michalski, L.; Kieć, M.; Budzyński, M.; Gumińska, L.; Kustra, W.; Mackun, T.; Oskarbska, I.; Rychlewska, J.; et al. Protection of Pedestrians. Guidelines for Pedestrian Traffic Organizers; National Road Safety Council: Gdańsk, Poland; Warsaw, Poland; Cracow, Poland, 2014. (In Polish) [Google Scholar]
  26. Rokade, S.; Kumar, R.; Rokade, K.; Dubey, S.; Vijayawargiya, V. Assessment of effectiveness of vertical deflection type traffic calming measures and development of speed prediction models in urban perspective. Int. J. Civ. Eng. Technol. 2017, 8, 1135–1146. Available online: https://iaeme.com/MasterAdmin/Journal_uploads/IJCIET/VOLUME_8_ISSUE_5/IJCIET_08_05_120.pdf (accessed on 23 July 2023).
  27. Mohammadipour, A.; Archilla, A.R.; Papacostas, C.S.; Alavi, S.H. Pedestrian (RPC) influence on speed reduction. In Proceedings of the Conference: Transportation Research Board (TRB) 91st Annual Meeting, Washington, DC, USA, 22–26 January 2012; Available online: https://www.researchgate.net/publication/273687736_Pedestrian_RPC_Influence_on_Speed_Reduction (accessed on 3 August 2023).
  28. Gonzalo-Orden, H.; Rojo, M.; Perez-Acebo, H.; Linares, A. Traffic calming measures and their effect on the variation of speed, Paper presented at the 12th Conference on Transport Engineering (CIT), Valencia 7–9 June, Spain. Transp. Res. Procedia 2016, 18, 349–356. [Google Scholar] [CrossRef]
  29. Distefano, N.; Leonardi, S. Evaluation of the benefits of traffic calming on vehicle speed reduction. Civ. Eng. Archit. 2019, 7, 200–214. [Google Scholar] [CrossRef]
  30. Distefano, N.; Leonardi, S. Effects of speed table, chicane and road narrowing on vehicle speeds in urban areas. In Proceedings of the VI International Symposium New Horizons 2017 of Transport and Comunications, Doboj, Serbia, 17–18 November 2017. [Google Scholar]
  31. Kruszyna, M.; Matczuk-Pisarek, M. The Effectiveness of Selected Devices to Reduce the Speed of Vehicles on Pedestrian Crossings. Sustainability 2021, 13, 9678. [Google Scholar] [CrossRef]
  32. Sołowczuk, A. Effect of Traffic Calming in a Downtown District of Szczecin, Poland. Energies 2021, 14, 5838. [Google Scholar] [CrossRef]
  33. Akgol, K.; Gunay, B.; Aydin, M.M. Geometric optimisation of chicanes using driving simulator trajectory data. Proc. Inst. Civ. Eng. Transp. 2022, 175, 238–248. [Google Scholar] [CrossRef]
  34. Aydin, M.M.; Akgöl, K.; Günay, B. The investigation of different chicane applications in traffic calming studies using driving symulator. J. Fac. Eng. Archit. Gazi Univ. 2019, 34, 1793–1805. [Google Scholar] [CrossRef]
  35. Hussain, Q.; Alhajyaseen, W.K.M.; Kharbeche, W.; Almallah, M. Safer pedestrian crossing facilities on low-speed roads: Comparison of innovative treatments. Accid. Anal. Prev. 2023, 180, 106908. [Google Scholar] [CrossRef] [PubMed]
  36. Sayer, I.A.; Parry, D.I. Speed Control Using Chicanes—A Trial at TRL; TRL Project Report PR 102; Transport Research Laboratory: Crowthorne, UK, 1994; Available online: https://trid.trb.org/view/425130 (accessed on 2 July 2023).
  37. Sayer, I.A.; Parry, D.I.; Barker, J.K. Traffic Calming—An Assessment of Selected On-Road Chicane Schemes; Transport Research Laboratory TRL Report 313; Transport Research Laboratory: Crowthorne, UK, 1998. [Google Scholar]
  38. Zhang, C.; Qin, S.; Yu, H.; Zheng, B.; Li, Z. A Review on Chicane Design based on Calming Theory. J. Eng. Sci. Technol. Rev. 2020, 13, 188–197. [Google Scholar] [CrossRef]
  39. Wirksamkeit Geschwindigkeitsdämpfender Maßnahmen Außerorts; Hessisches Landesamt für Straßen- und Verkehrswesen: Hessen, Germany, 1997. Available online: https://docplayer.org/57666796-Wirksamkeit-geschwindigkeitsdaempfender-massnahmen.html (accessed on 2 August 2020).
  40. Hunnel, T.; Mackie, A.; Wells, P. Traffic Calming Measures in Built-Up Areas. Literature Review; Unpublished Project Report PR/SE/622/02 Vägverket TR80 2002:15779; Swedish National Road Administration: Borlänge, Sweden, 2002. [Google Scholar]
  41. Juran, J.M.; Gryna, F.M. Juran’s Quality Control Handbook, 6th ed.; McGraw-Hill: New York, NY, USA, 2010. [Google Scholar]
  42. Stephens, K.S. Juran, Quality, and a Century of Improvement, 15 ed.; ASQ: Milwaukee, WI, USA, 2004. [Google Scholar]
  43. Feigenbaum, A.V. Quality Control: Principles, Practice, and Administration; McGraw Hill Book Company Inc.: New York, NY, USA, 1951. [Google Scholar]
  44. Deming, W.E. Out of the Crisis, 5th ed.; The MIT Press: Cambridge, UK, 2000. [Google Scholar]
  45. Ishikawa, K.; Loftus, J.H. Introduction to Quality Control, 3rd ed.; 3A Corporation: Tokyo, Japan, 1990. [Google Scholar]
  46. Ishikawa, K. Introduction to Quality Control; Taylor & Francis: Philadelphia, PA, USA, 1990. [Google Scholar]
  47. Ishikawa, K. What Is Total Quality Control? The Japanese Way; Prentice-Hall Direct: University Michigan: Michigan, MI, USA, 1985. [Google Scholar]
  48. Juran, J.M. The Non-Pareto Principle; Mea Culpa. In Juran on Quality by Design; Juran, J., Ed.; Free Press: New York, NY, USA, 1992; pp. 68–71. [Google Scholar]
  49. SAS/QC® 14.1. User’s Guide: The Pareto Procedure; SAS Institute Inc.: Cary, NC, USA, 2015. [Google Scholar]
  50. Iyer, R.G. The Art of Creating Pareto Analysis: A Complete End-to-End Guide to Understand Pareto Charts and Easily Create them in Excel; Advanced Innovation Group Pro Excellence: Birmingham, UK, 2021. [Google Scholar]
  51. Koch, R. The 80/20 Principle: The Secret to Achieving More with Less; Independently Published: Chicago, IL, USA, 2021. [Google Scholar]
  52. Mydlarz, A. 7 Sztuczek Najlepszych Audytorów Jakości; Sztuka Jakości Artur Mydlarz: Rzeszów, Poland, 2022. (In Polish) [Google Scholar]
  53. Mydlarz, A. Siedem Złotych Narzędzi Jakości. Praktyczny Poradnik Inżyniera; Sztuka Jakości Artur Mydlarz: Rzeszów, Poland, 2022. (In Polish) [Google Scholar]
  54. Sołowczuk, A. Metod TQM v zadačah ocenki tehničeskogo sostoâniâ dorog. Transp. Stroit. 2005, 7, 11–12. [Google Scholar]
  55. Sołowczuk, A. Naučnye osnowy ocenki tehničeskogo sostoâniâ dorog po potrebitel’skim svojstvam. Dorogi i Mosty 2005, 13, 165–175. [Google Scholar]
  56. Evans, S.R.; Norbacka, J.P.P. An Heuristic Method for Solving Time-Sensitive Routing Problems. J. Oper. Res. Soc. 1984, 35, 407–414. [Google Scholar] [CrossRef]
  57. Wang, Z.; Wang, Z. A novel two-phase heuristic method for vehicle routing problem with backhauls. Comput. Math. Appl. 2009, 57, 1923–1928. [Google Scholar] [CrossRef]
  58. Ichoua, S.; Gendreau, M.; Potvin, J.-Y. Vehicle dispatching with time-dependent travel Times. Eur. J. Oper. Res. 2003, 144, 379–396. [Google Scholar] [CrossRef]
  59. Malandraki, C.; Daskin, M.S. Time dependent vehicle routing problems: Formulations, properties and heuristic algorithms. Transp. Sci. 1992, 26, 185–200. [Google Scholar] [CrossRef]
  60. Hill, A.C.; Benton, W.C. Modelling intra-city time-dependent travel speeds for vehicle scheduling problems. J. Oper. Res. Soc. 1992, 43, 343–351. [Google Scholar] [CrossRef]
  61. Kim, J.-S.; Jeong, J. Development of the Dripping Speed Measurement System of Medical Liquid using Heuristic. J. Korean Inst. Intell. Syst. 2014, 24, 542–547. [Google Scholar] [CrossRef]
  62. Bujak, K. Traffic Organization Design Along 5 Lipca Street on the Section from Bohaterów Warszawy Avenue to Szarych Szeregów Place; City Office of Szczecin: Szczecin, Poland, 2015. (In Polish) [Google Scholar]
  63. Ustawa—Prawo o Ruchu Drogowym, Dziennik Ustaw z dnia 20 Czerwca 1997 Nr 98 poz. 602, z późn. zm. Available online: https://isap.sejm.gov.pl/isap.nsf/DocDetails.xsp?id=wdu19970980602 (accessed on 2 July 2023). (In Polish)
  64. Google Earth. Available online: https://earth.google.com (accessed on 2 July 2023).
  65. Accident and Collision Registration System SEWIK. Available online: https://sewik.pl/ (accessed on 2 July 2023).
  66. Vitronic. Speed Displays Traffic Detection, Radar, Detection, Software; Vitronic: Kędzierzyn Koźle, Poland, 2015. [Google Scholar]
  67. Sobczyńska, D. Art of Experimental Research, habilitation monograph. In Scientific Papers of the Philosophy and Logic; series No. 71; Scientific Publishing House UAM: Poznań, Poland, 1993. [Google Scholar]
  68. Roess, R.P.; Prassas, E.S.; McShane, W.R. Traffic Engineering, 4th ed.; Pearson Higher Education: London, UK, 2018. [Google Scholar]
  69. Taylor, J.R. An Introduction to Error Analysis, 6th ed.; Scientific Publishing House: Warszawa, Poland, 2022. [Google Scholar]
  70. Ziółkowski, R. Zachowania Kierowców Pojazdów w Otoczeniu Środków Uspokojenia Ruchu w Warunkach Miejskich. Ph.D. Dissertation, Politechnika Białostocka, Białystok, Poland, 2022. Available online: https://pb.edu.pl/oficyna-wydawnicza/wp-content/uploads/sites/4/2022/10/Zachowania-kierowcow-pojazdow-w-otoczeniu-srodkow-uspokojenia-ruchu-w-warunkach-miejskich.pdf (accessed on 2 August 2023). (In Polish).
  71. Daniel, B.D.; Nicholson, A.; Koorey, G. Investigating Speed Patterns and Estimating Speed on Traffic-Calmed Streets; IPENZ Transportation Group Conference, Auckland, 27 March 2011. Available online: https://www.researchgate.net/publication/267370096_INVESTIGATING_SPEED_PATTERNS_AND_ESTIMATING_SPEED_ON_TRAFFIC-CALMED_STREETS (accessed on 30 November 2022).
  72. Alavi, S.H. Analyzing Raised Crosswalks Dimensions Influence on Speed Reduction in Urban Streets. In Proceedings of the 3rd Urban Street Symposium, Seattle, WA, USA, 24–27 June 2007; Available online: https://www.researchgate.net/publication/273687736_Pedestrian_RPC_Influence_on_Speed_Reduction (accessed on 1 December 2015).
  73. Domenichini, L.; Branzi, V.; Meocci, M. Virtual testing of speed reduction schemes on urban collector roads. Accid. Anal. Prev. 2018, 110, 38–51. [Google Scholar] [CrossRef] [PubMed]
  74. Jorgensen, M.; Agerholm, N.; Lahrmann, H.; Araghi, B. Driving Speed on Throughfares in Minor. Towns in Denmark; Aalborg University: Aalborg Ost, Denmark, 2014; Available online: https://www.ictct.net/wp-content/uploads/26-Maribor-2013/26-Agerholm-Full-paper.pdf (accessed on 19 November 2015).
  75. Kang, B. Identifying street design elements associated with vehicle-to-pedestrian collision reduction at intersections in New York City. Accid. Anal. Prev. 2019, 122, 308–317. [Google Scholar] [CrossRef] [PubMed]
  76. Jamroz, K.; Gumińska, L.; Mackun, T.; Rychlewska, J. Widoczność na przejściach dla pieszych. Drogownictwo 2015, 4–5, 142–149. Available online: https://www.researchgate.net/publication/352121417_Widocznosc_na_przejsciach_dla_pieszych (accessed on 2 August 2023). (In Polish).
  77. Jamroz, K.; Kempa, J.; Rychlewska, J.; Mackun, T. Metoda wyznaczania obszaru dobrej widoczności na przejściach dla pieszych w Polsce. Transport Miejski i Regionalny 2015, 4, 10–21. Available online: http://yadda.icm.edu.pl/baztech/element/bwmeta1.element.baztech-42c6a790-a9b5-4ff0-9171-13d47b93c747 (accessed on 18 August 2023).
  78. Das Land Kärnten: Abteilung 7. Kompetenzzentrum Wirtschaftsrecht und Infrastruktur Richtlinie. Grundlagen für die Anordnung eines Schutzweges. 2013. Available online: https://docplayer.org/64254869-Richtlinie-grundlagen-fuer-die-anordnung-eines-schutzweges.html (accessed on 18 August 2023).
  79. Antoine, D.; Janssens, I.; Chevalier, N.; Dullaert, I.; Trussart, S.; Blanquet, D.; Delbart, E. Visibilité et Sécurité des abords d’écoles, Dirk DE SMET, Directeur général DGO1, Namur, Belgium. 2011. Available online: https://rue-avenir.ch/wp-content/uploads/files/resources/Securite-abords-ecoles-Wallonie.pdf (accessed on 18 August 2023).
  80. Liu, C.; Wang, W. Integrating Visibility, Parking Restriction, and Driver’s Field View for Enhancing Pedestrian Crossing Safety. Int. J. Transp. Sci. Technol. 2013, 2, 351–356. [Google Scholar] [CrossRef]
  81. KfV, Leitfaden für die Anlage von Schutzwegen und Sonstigen Fußgängerquerungsstellen, Kuratorium für Verkehrs, LF/Schutzweg/V02, Land Oberösterreich 2006. Available online: https://www.tirol.gv.at/fileadmin/themen/verkehr/service/downloads/lf_schutzweg_v02end.pdf (accessed on 2 August 2023).
  82. Høye, A.; Mosslemi, M. Fartsdempende Tiltak i Gangfelt—Eksempler og Erfaringer, TØI rapport 1033/2009, Transportøkonomisk Institutt, Oslo 2009. Available online: https://www.toi.no/getfile.php?mmfileid=16942 (accessed on 2 August 2023).
  83. Fressancourt, M. Une Limitation de la Vitesse Pour un Meilleur Partage de la Route…, AQTr 21 June 2011. Available online: https://aqtr.com/association/actualites/limitation-vitesse-meilleur-partage-route (accessed on 3 August 2023).
  84. How to Calculate Stopping Distances! Available online: https://www.drivingcrawley.co.uk/blog/how-to-calculate-stopping-distances (accessed on 3 August 2023).
  85. Stopping Distances and The Theory Test 2018. Available online: https://driving-test-success.myshopify.com/pages/stopping-distances-and-the-theory-test (accessed on 3 August 2023).
  86. What Is Stopping Distance? Available online: https://www.reddrivingschool.com/stopping-distances/ (accessed on 3 August 2023).
  87. Everything You Need to Know about Vehicle Stopping Distances. Available online: https://www.unicominsurance.com/insurance-news/everything-you-need-to-know-about-vehicle-stopping-distances (accessed on 3 August 2023).
Figure 1. Free view and path angle illustration: (a) “a”—small; (b) “a”—larger; (c) “a” +. Source: own work.
Sustainability 15 15265 g001
Figure 2. Comparison of v85 and vav values ahead of a refuge island or median island in different locations. Source: Own work based on data presented in: Gonzalo-Orden et al., 2016 [28], Germany, 1997 [39], Hunnel et al., 2002 [40], Sayer et al., 1998 [37], Sołowczuk & Kacprzak, 2019 [21].
Sustainability 15 15265 g002
Figure 3. Sequence of analyses conducted in this study. Source: own work.
Sustainability 15 15265 g003
Figure 4. Visualisation of the analysed two-way street before the 2014 alteration showing traffic directions. Source: own work on a satellite image background Google Earth [64]).
Sustainability 15 15265 g004
Figure 5. Visualisation—four study sections located between three junctions were selected for the analyses of this study, on which a total number of sixteen survey stations were set up: (a) three junctions and six pedestrian refuges; (b) four study sections and sixteen survey stations. Source: own work on a satellite image background Google Earth [64].
Sustainability 15 15265 g005
Figure 6. Study sections: (a) WE1 & EW1; (b) WE2 & EW2; (c) WE3 & EW3. Source: Photo A. Sołowczuk.
Sustainability 15 15265 g006aSustainability 15 15265 g006b
Figure 7. The seven basic tools of the heuristic method used for analysing the efficacy of speed reduction treatments before refuge islands. Source: own work.
Sustainability 15 15265 g007
Figure 8. 85th percentile speed distribution example: (a) EW1; (b) WE1; (c) EW2; (d) WE2; (e) EW3; (f) WE3. Source: own work.
Sustainability 15 15265 g008
Figure 9. Regression analysis examples for different survey station locations: (a) at a refuge island; (b) on the refuge island approach section. Source: own work.
Sustainability 15 15265 g009
Figure 10. Speed distribution along the analysed street: (a) 85th percentile speed in the direction W→E; (b) average speed in the direction W→E; (c) 85th percentile in the direction E→W; (d) average speed in the direction E→W. Source: own work.
Sustainability 15 15265 g010aSustainability 15 15265 g010b
Figure 11. Cause-and-effect diagram and identification of determinants: (a) windscreen view in the direction E→W; (b) identification of primary and secondary determinants; (c) windscreen view in the direction W→E. Source: own work.
Sustainability 15 15265 g011
Figure 12. Free view width and clear sight width ahead of and past the refuge island: (a) WE1 and EW1; (b) WE2 and EW2; (c) WE3 and EW3. Source: own work.
Sustainability 15 15265 g012
Figure 13. Pareto chart showing the variation of speed distribution parameters (v85 and vav) and the determinants adopted for the analysed sections: the sections are listed in the growing order of v85 just before the refuge island; and the test sections are listed in the order vav just before the refuge island. Source: own work.
Sustainability 15 15265 g013
Figure 14. Pareto Chart 2—showing the values of ∆v85 and ∆vav and the determinants adopted on the respective sections: sections listed in the order of ∆v85 values calculated as ∆v85 = v85 (entry) − v85 (before the refuge island); and sections listed in the order of ∆vav values calculated as ∆vav = vav (entry) − vav (before the refuge island). Source: own work.
Sustainability 15 15265 g014
Table 1. Input data and statistical analysis output for the analysed street. Source: Own research based on data presented in [65].
YearsTraffic Accidents in GeneralPedestrian Accidents
Before data: 1 January 2000–31 December 2015276
After data: 1 January 2016–31 May 202361
The Chi-square significance test χ2 was used to confirm or refute the efficacy of a given TCM and the resulting traffic safety improvement. Null hypothesis H0: χ2 = (n1 t2n2 t1)2/(t1 t2 (n1 + n2))1χα2; (no statistically significant difference exists). Alternative hypothesis H1: χ2 > χα2; (a statistically significant difference does exist).
The following inequation should be satisfied at the same time: n1/t1 > n2/t2.
Critical value χα2 = 3.84 at the significance level α = 0.05.
χ2 = 3.0 < 3.841.0 < 3.84
n1/t1 > n2/t21.7 > 0.80.38 > 0.13
Legend: n1—before-project road incidents/accidents, n2—after-project road incidents/accidents, t1—years before, t2—years after.
Table 2. Results of statistical tests to check whether speed data may be analysed as a single set. Source: own work.
No.Traffic Volume, veh/hTraffic Flow Directions
Before Measurement DataAfter Measurement Data
W→EE→WW→EE→WW→EE→WW→EE→W
Test K-S 1Median Test 2Test K–S 1Median Test 2
1N ≤ 50 & 50 < N ≤ 1009.812.4120.31392.414.315.62469.41544.9
250 < N ≤ 100 & 100 < N ≤ 15012.113.51737.1308.217.917.42344.73113.2
3100 < N ≤ 150 & 150 < N ≤ 20020.411.916,893.3189.616.920.91744.07370.2
4150 < N ≤ 200 & 200 < N ≤ 25024.67490.017.325.42735.216,035.3
5200 < N ≤ 250 & 250 < N ≤ 30019.623.84905.45532.8
6250 < N ≤ 300 & 300 < N ≤ 35024.219.326,238.02549.3
7300 < N ≤ 350 & 350 < N ≤ 40033.856,117.9
8350 < N ≤ 400 & 400 < N ≤ 45032.221,759.6
1 Two-sample Kolmogorov–Smirnov test λ: H0: F(vNi) = F(vNi+1) and H1: F(vNi) ≠ F(vNi+1), λα = 1,36, α = 0.05. 2 Median test: H0: F1(x) = F2(x) and H1: F1(x) ≠ F2(x), χα2 = 3.84, α = 0.05.
Table 3. Determinants found in the analysed sections and quantification measure scores. Source: own work.
DeterminantsScores Given to the Study Sections
WE1WE2WE3EW1EW2EW3
Free view10.5100.50
Side obstruction in the travel lane past the refuge island100.5000
Lack of visibility of a pedestrian on the right-hand side of the island100011
Lack of visibility of the road surface past the junction000.5000.5
Painted taper applied to the section110.5010
Left-hand curve in the junction000.5000
Parking configuration changed from diagonal to parallel010010
Parking configuration changed from parallel to diagonal100001
Apparent carriageway narrowing past the junction000.50.500
Total quantification measure scores:52.53.50.53.52.5
Disclaimer/Publisher’s Note: The statements, opinions and data contained in all publications are solely those of the individual author(s) and contributor(s) and not of MDPI and/or the editor(s). MDPI and/or the editor(s) disclaim responsibility for any injury to people or property resulting from any ideas, methods, instructions or products referred to in the content.

