1. Introduction
Speed management has become a major issue over the past century. For this reason, more and more often, horizontal and vertical traffic calming devices are installed (for example, speed humps, gateways, speed bumps, speed cushions, etc.). They force the drivers to maintain their speed level according to the type of road. However, traffic calming does not guarantee that speeds that comply with the imposed limits will be maintained. This has encouraged researchers to evaluate the effects of these devices and determine their effectiveness based on their size (height, length, gradient, and radius) and shape. Efficiency is evaluated by analyzing their effectiveness in speed reduction or accident rate reduction.
The first studies have been conducted since 1980 [
1,
2]. From that period on, the focus has been on the different devices from various points of view: efficacy studies, standards, guidelines, etc.
In the current literature review, devices with a vertical orientation were mainly analyzed, considering experimental and theoretical studies.
In the experimental studies, before-and-after analyses are carried out, in which the sites before and after the installation of the devices are compared in order to evaluate the variation in speed and traffic flows, thus determining the effectiveness of the installed measurement. Vertical traffic calming devices may have advantages and disadvantages (noise, vibrations, pollution); therefore, researchers [
3,
4,
5,
6,
7] have been trying to determine the geometric parameters, spacing, etc. that make them more effective.
Many studies have shown that, by applying these mitigation measures at sites, various types of road issues [
7,
8,
9], such as speed reduction [
10,
11,
12,
13], reduction of traffic volumes [
14], reduction of road accidents [
15,
16,
17], and safety concerns for pedestrians [
18] due to the lack of sidewalks or narrow streets, can be effectively tackled.
Depending on the type of device and its geometry [
19,
20,
21,
22,
23,
24], different speed reductions are generated [
25,
26,
27,
28,
29,
30], also due to the different area of influence in which the vehicle deceleration occurs [
31]. This suggests that, to obtain significant speed reductions, the devices could be installed in series [
17]. Therefore, in this way, a speed profile rather than a spot speed value can be evaluated [
32,
33,
34,
35,
36]. To obtain the desired speed reductions, it is necessary to correctly space the devices; in fact, for a shorter distance, lower speeds are expected since, between a bump or a hump and the next vertical traffic calming device, it would not be possible to reach high speeds [
4,
37,
38,
39,
40].
Another approach used to evaluate the issue of speed reduction due to traffic calming does not use experimentation but a theoretical approach that requires complex mathematical or soft computing tools. With these approaches, it is possible to develop multiple degrees-of-freedom models with the aim of evaluating kinematic quantities such as displacements, accelerations [
41,
42], or rotation of the vehicle [
43] and/or driver [
44].
Other, more elaborated models allow for the evaluation of the vibrations transmitted to the ground [
45,
46,
47] and their relationship with the road profile [
48,
49].
Sometimes, to calibrate the theoretical models, the results of the field campaigns are taken into consideration and then compared with those derived from ad hoc experimentations [
50,
51]; this allows to derive the empirical speeds [
52,
53] and the characteristics of the vertical traffic calming device and the road [
54,
55]; thus, by knowing only the layout of the devices, it is possible to somehow predict the speeds without going through experimental observations [
56,
57,
58,
59], in order to reduce deaths and serious injuries [
60].
However, interactions between the different road users seem to play a fundamental role in safety conditions, and studying driver and pedestrian behaviors is essential to designing measures to reduce the risk of crashes [
61]. In this paper, particular attention is given to raised pedestrian crossings (RPCs), which seem to have great efficiency in terms of speed reduction and safety for pedestrians compared to other traffic calming devices [
62]. However, according to Loprencipe et al. [
63], they require a high value of vertical acceleration to induce a crossing speed reduction. The aim, as well as the novelty aspect, is to study the behavior of drivers in close proximity to RPCs in order to take actions with the aim of increasing pedestrian safety and, in turn, fostering sustainable mobility.
However, summarizing these results, it appears that there is still a need to deepen the study, such as the vehicle’s and the road profile’s dynamic interactions, with the aim to better characterize the vibration level in time and frequency domains and to derive new design criteria based on vehicle mechanical proprieties, on the one hand, and on geometrical traffic calming layout, on the other.
To this purpose, a new insight comprising the development and calibration of numerical interaction models, helpful in analyzing and understanding real speed profile data collected through an experimental campaign, is presented and discussed in the following sections.
2. Methodology
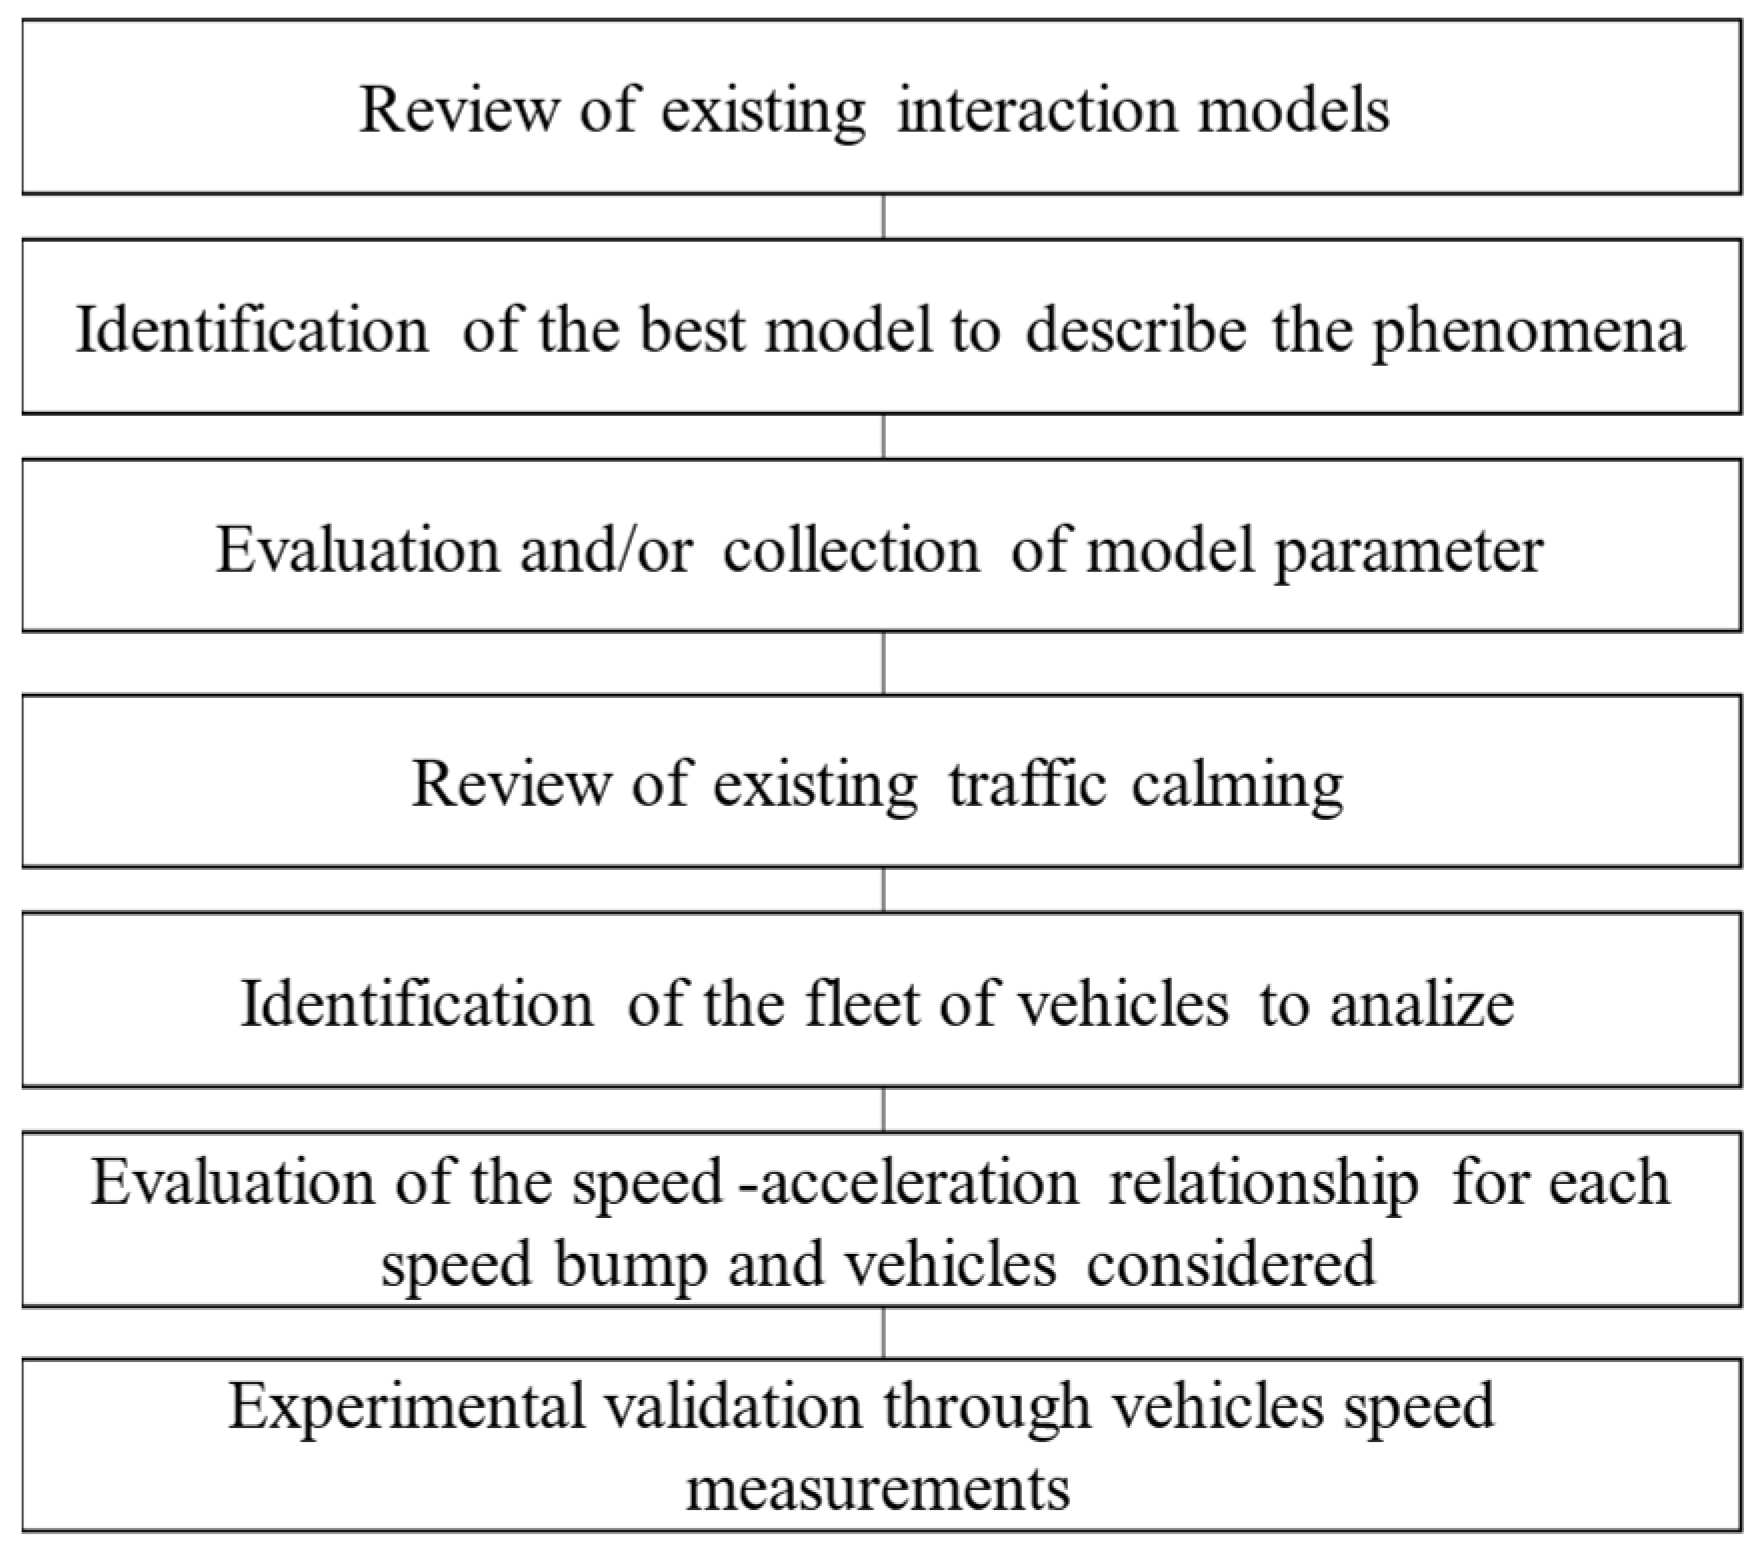
The method proposed is summarized as follows in the figure below (see
Figure 1). The next paragraphs will explain the main steps that need to be followed, as described in this schematic flow chart, to better understand the method behind and the peculiar aspects introduced in this work.
2.1. Vibrations’ Effect on Human Body
During motion in a vehicle, the body is subject to vibrations. Vibration is a mechanical movement around a fixed point propagated as a mechanical wave by means of a mechanical medium (such as vehicles and people).
Waves can be divided into:
deterministic, when future oscillations can be predicted from the knowledge of the previous waves;
stochastic, commonly called random waves, where only some significant statistical properties can be evaluated due to uncertainties on several factors affecting the vibration phenomenon.
Deterministic waves can be divided into periodic and nonperiodic; the former, in turn, are divided into simple harmonic or multi-harmonic waves, which have the characteristic of being able to be represented analytically in a closed form. The latter, the nonperiodic ones, on the other hand, can in turn be divided into transient waves or shocks.
In most cases, the waves to which the human body is exposed during work and leisure are stationary and nonstationary random waves [
64].
However, in the real world, it is difficult to encounter vibrations described by a simple harmonic wave, so more complex wave descriptions are required. These complex waves could be processed by superimposing multiple harmonic waves with different amplitudes, frequencies, and phases. This principle is the basis of the Fourier transform, in which, given as input a complex signal, the Fourier transform returns as output data a frequency response spectrum, which has frequency as an independent variable and amplitude as a dependent variable. It allows the writing of a time-dependent function in the frequency domain; to do this, it decomposes the function into the basis of exponential functions with a scalar product.
This Fourier transform can only be used for finite signals; in short, the signal must be summable, therefore the following equation must be considered:
Vibration can be synthetically described by means of three physical quantities: displacement, velocity, and acceleration.
The magnitude of the acceleration of a vibration can be synthetically expressed in terms of peak-to-peak acceleration (acceleration calculated as the difference between the amplitude of the positive peak and the amplitude of the lower peak) and in terms of peak acceleration (acceleration calculated by measuring just a peak). The acceleration measure used most often in engineering is the RMS (root mean square) value, which represents the standard deviation of a digital signal with a zero mean. This quantity can therefore be calculated as the square root of the mean of the squares of the acceleration values, that is, the square root of the square mean. For a simple sinusoidal signal, the peak-to-peak acceleration is equal to twice the amplitude, while the peak amplitude is equal to the amplitude itself, where the RMS value is equal to the amplitude divided by the square root of 2.
However, it has to be highlighted that the acceleration measurement values described so far do not take into account the duration, or rather, the exposure time. With the same peak-to-peak value, peak amplitude, or RMS, it is easy to understand that the response of the human body varies according to the exposure time during which the body is subjected to this vibration. More recent guidance seems to suggest alternative measures such as the vibration dose value, in which the vibration descriptor takes exposure time into account [
31].
2.2. Simulation Models
Vertical traffic calming devices cause a strong vertical acceleration in the transiting vehicle due to the excitation induced by travel on a localized road profile irregularity. This acceleration causes a strong disturbance for the driver, who is thus forced to reduce speed [
65,
66]. It is evident from the aforementioned scientific literature that in order to operate an effective and continuous control of the speed of the vehicles over a defined road section, it is necessary to establish in series a certain number of such devices according to a specific spacing. However, regardless of the spacing layout to be selected, the evaluation of the vibration level induced by a vertical traffic calming device is of paramount importance.
For this purpose, it is necessary to evaluate the vertical dynamic response of a typical vehicle traveling on a rough road surface.
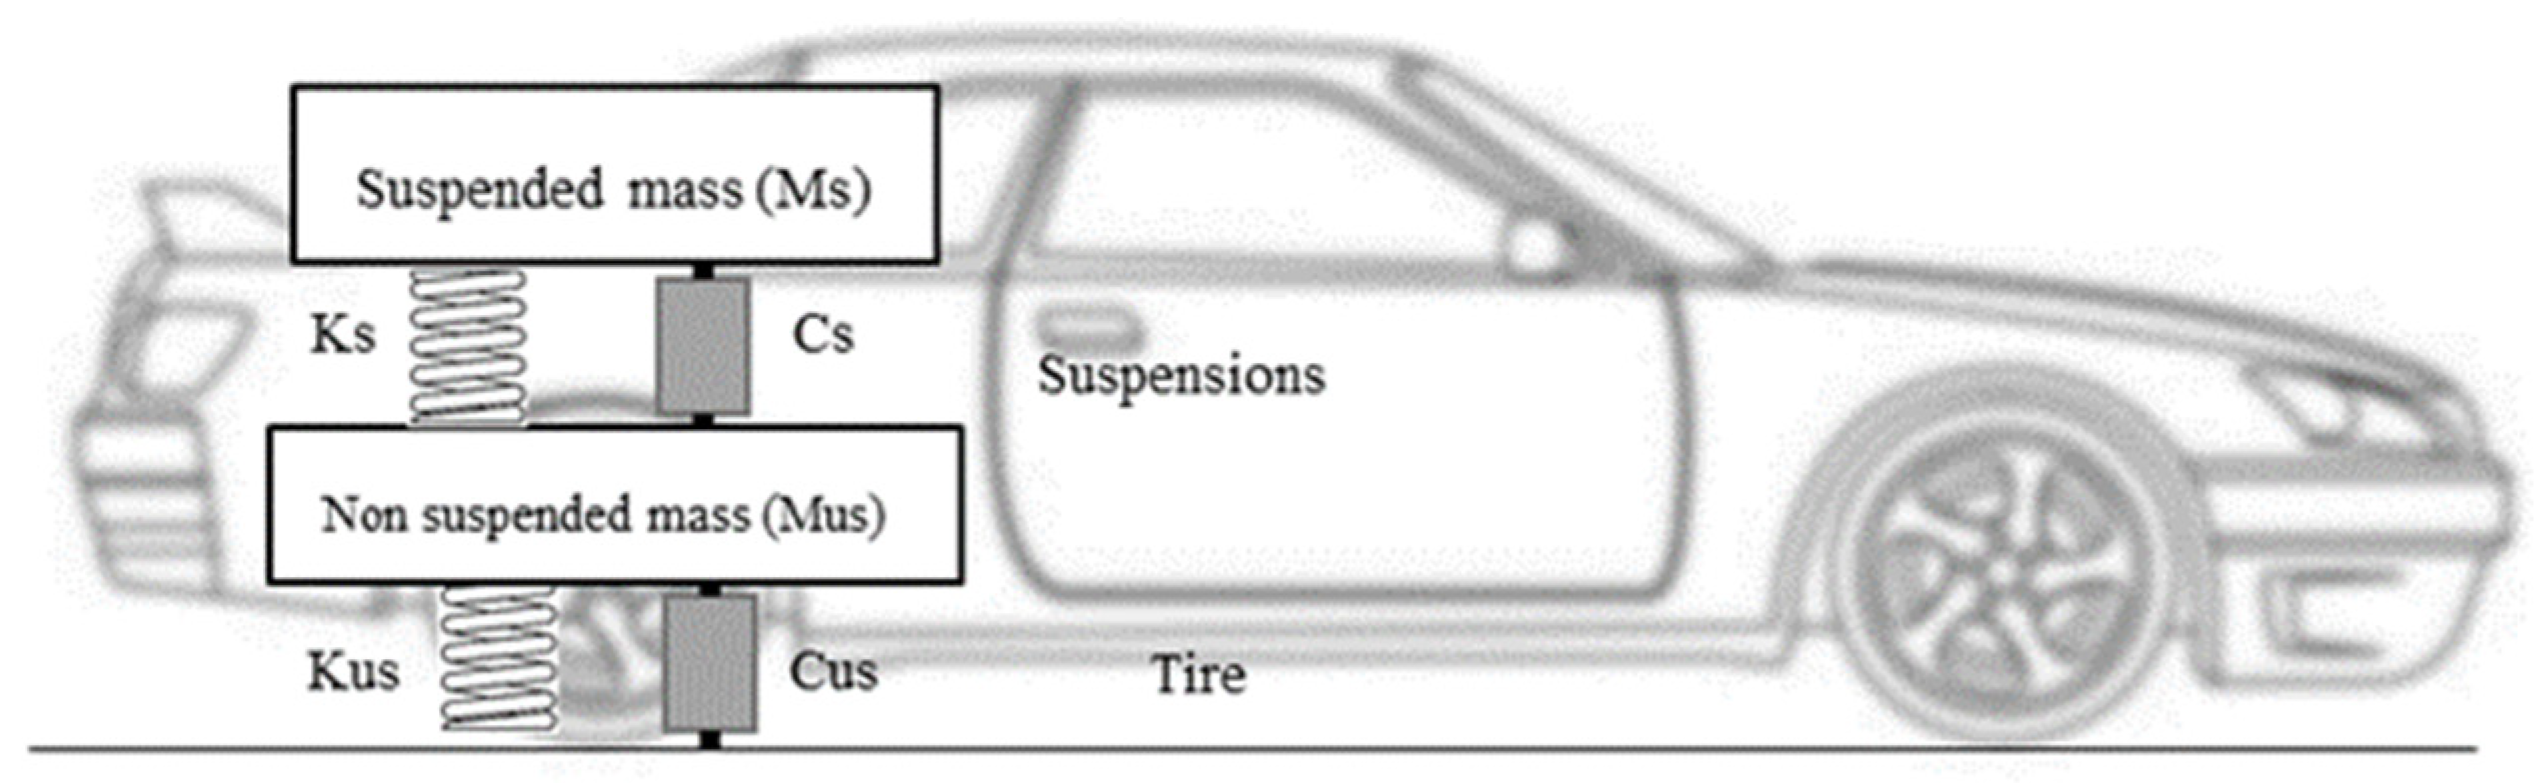
It has to be underlined that this approach is currently adopted in mechanical engineering in order to study vehicle dynamics. Vehicles can be represented as rigid bodies and/or point masses interconnected with springs and dashpots. The most used model is the “Quarter Car Model” (
Figure 2), a two-degree-of-freedom model where the sprung mass (one fourth of the suspended mass of the vehicle) is linked to the unsprung mass (that is, the half axle) with springs and dashpots assembled in parallel (describing car suspensions). The unsprung mass is also connected to the road profile with a spring coupled with a dashpot in order to simulate the tire’s vertical stiffness.
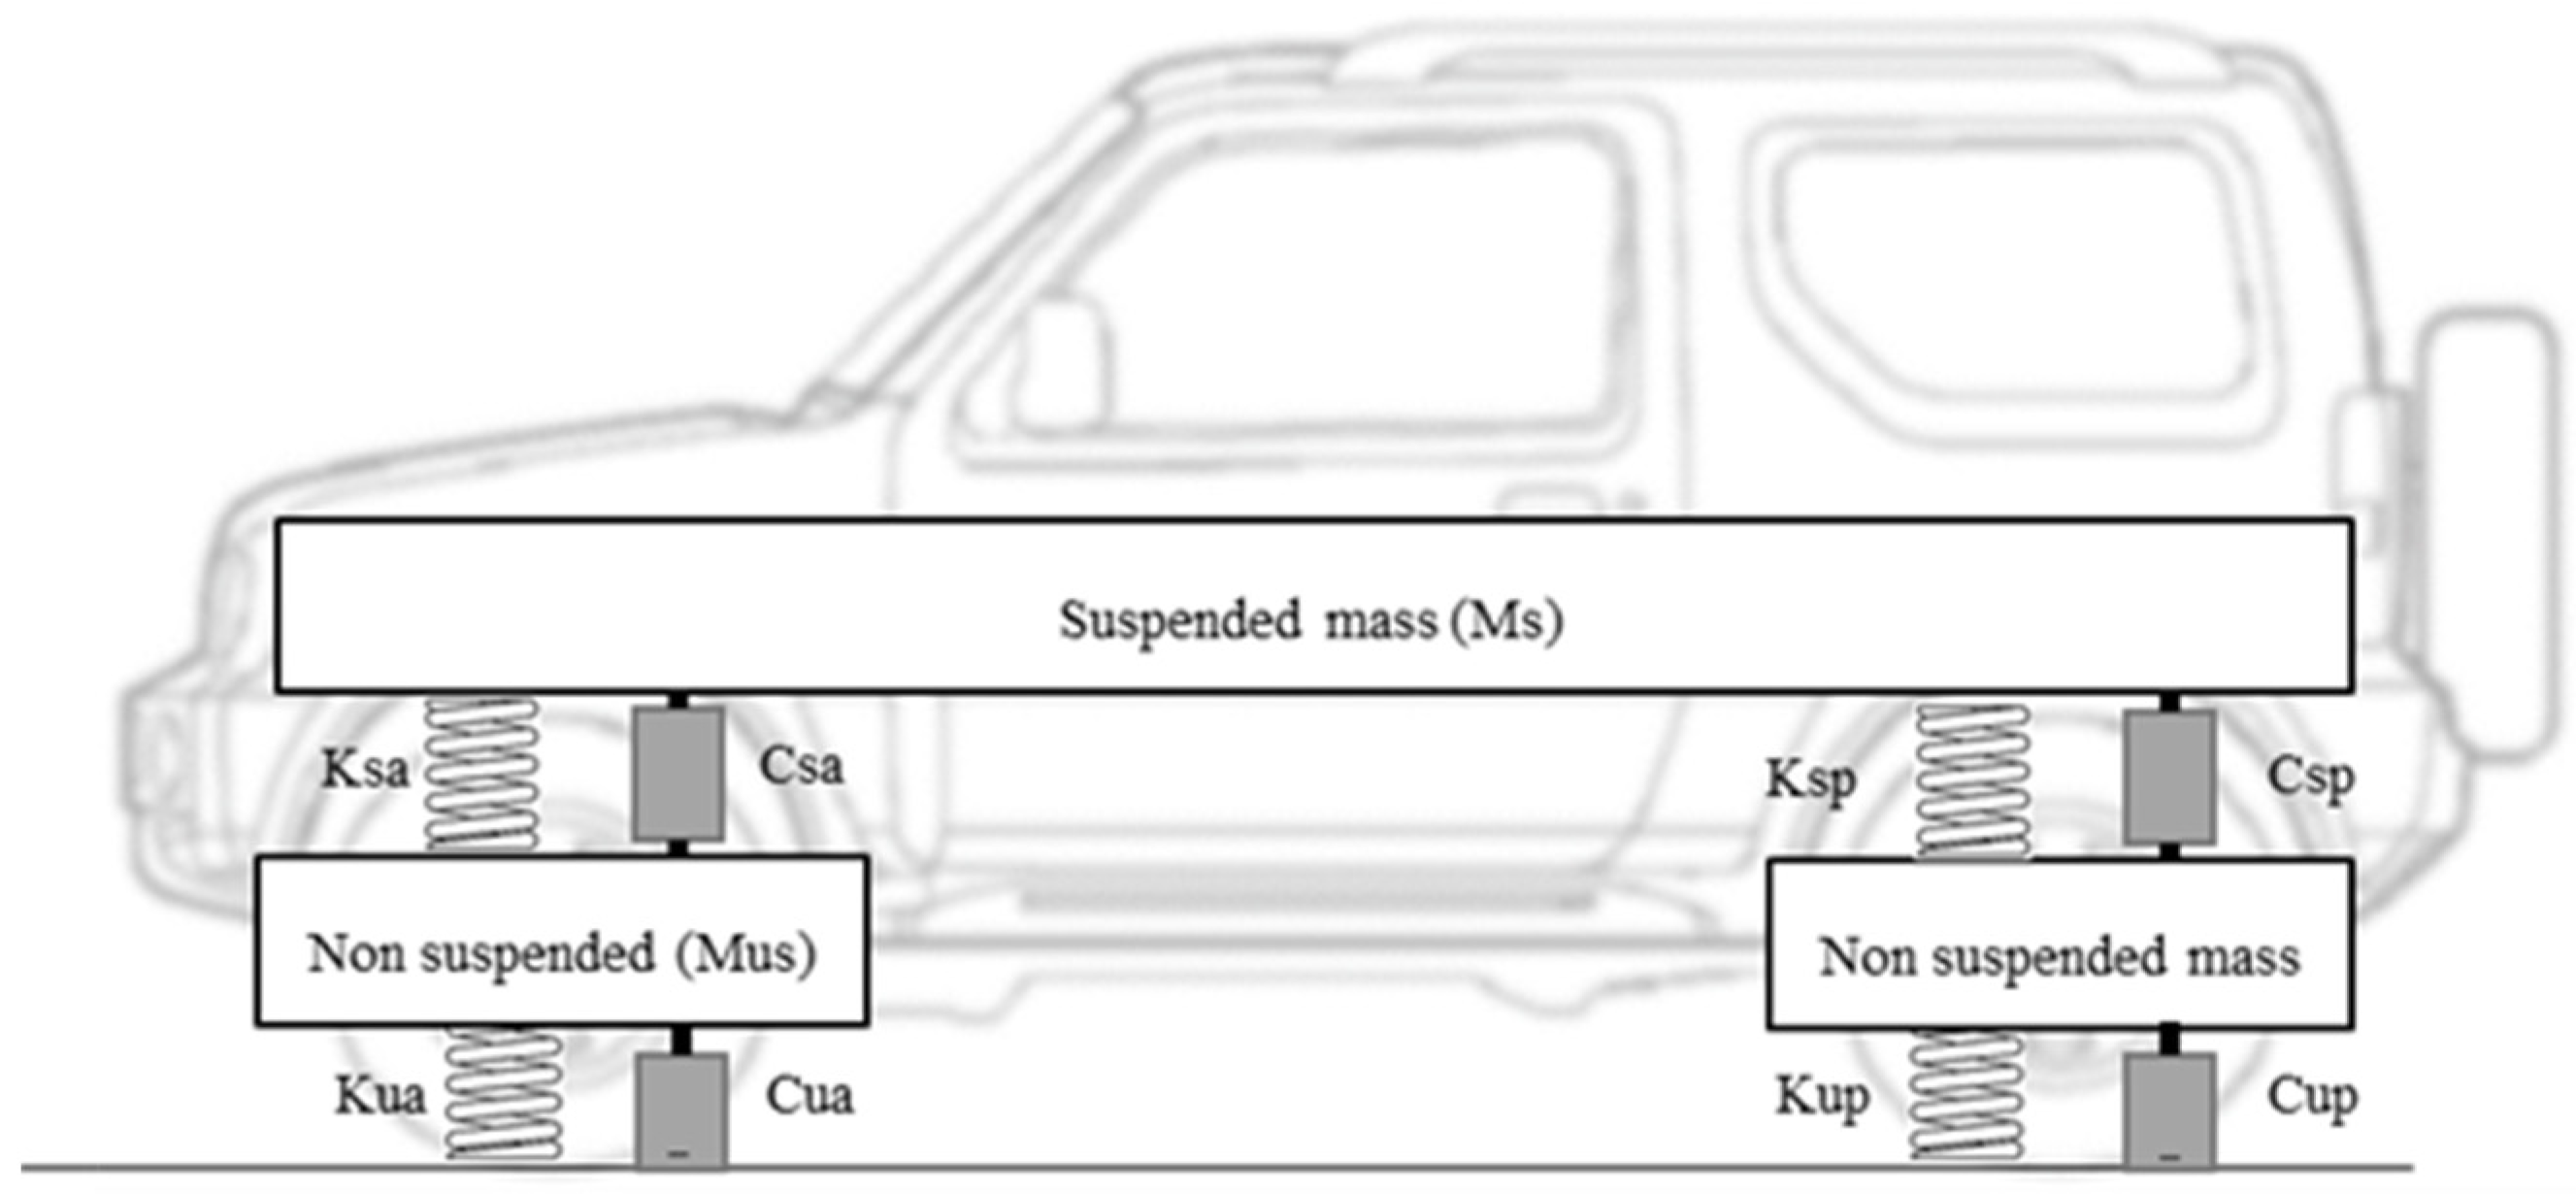
However, it has been observed that if the vertical response of a vehicle traveling on a vertical traffic calming device is concerned, it is not correct to describe this phenomenon with such models, so it appears more suitable to use a more detailed model, such as the “Half Car Model” (
Figure 3), a four-degree-of-freedom model in which both front and rear axles are represented. The reason why a “Half Car Model” is considered is related to the “wheel base filtering” problem: if a vehicle is moving with a certain speed on an irregular surface, vibrations are detected by the front axle and then, with a time lag related to vehicle speed and vehicle wheel base, by the rear axle. This phenomenon dramatically changes the way the vehicle is vertically excited when moving on a rough road surface and, for certain speed and wheel base values, could induce some unexpected resonant frequencies due to a change in the shape of the transfer function between the road excitation and the vertical load transmitted by the vehicle [
45].
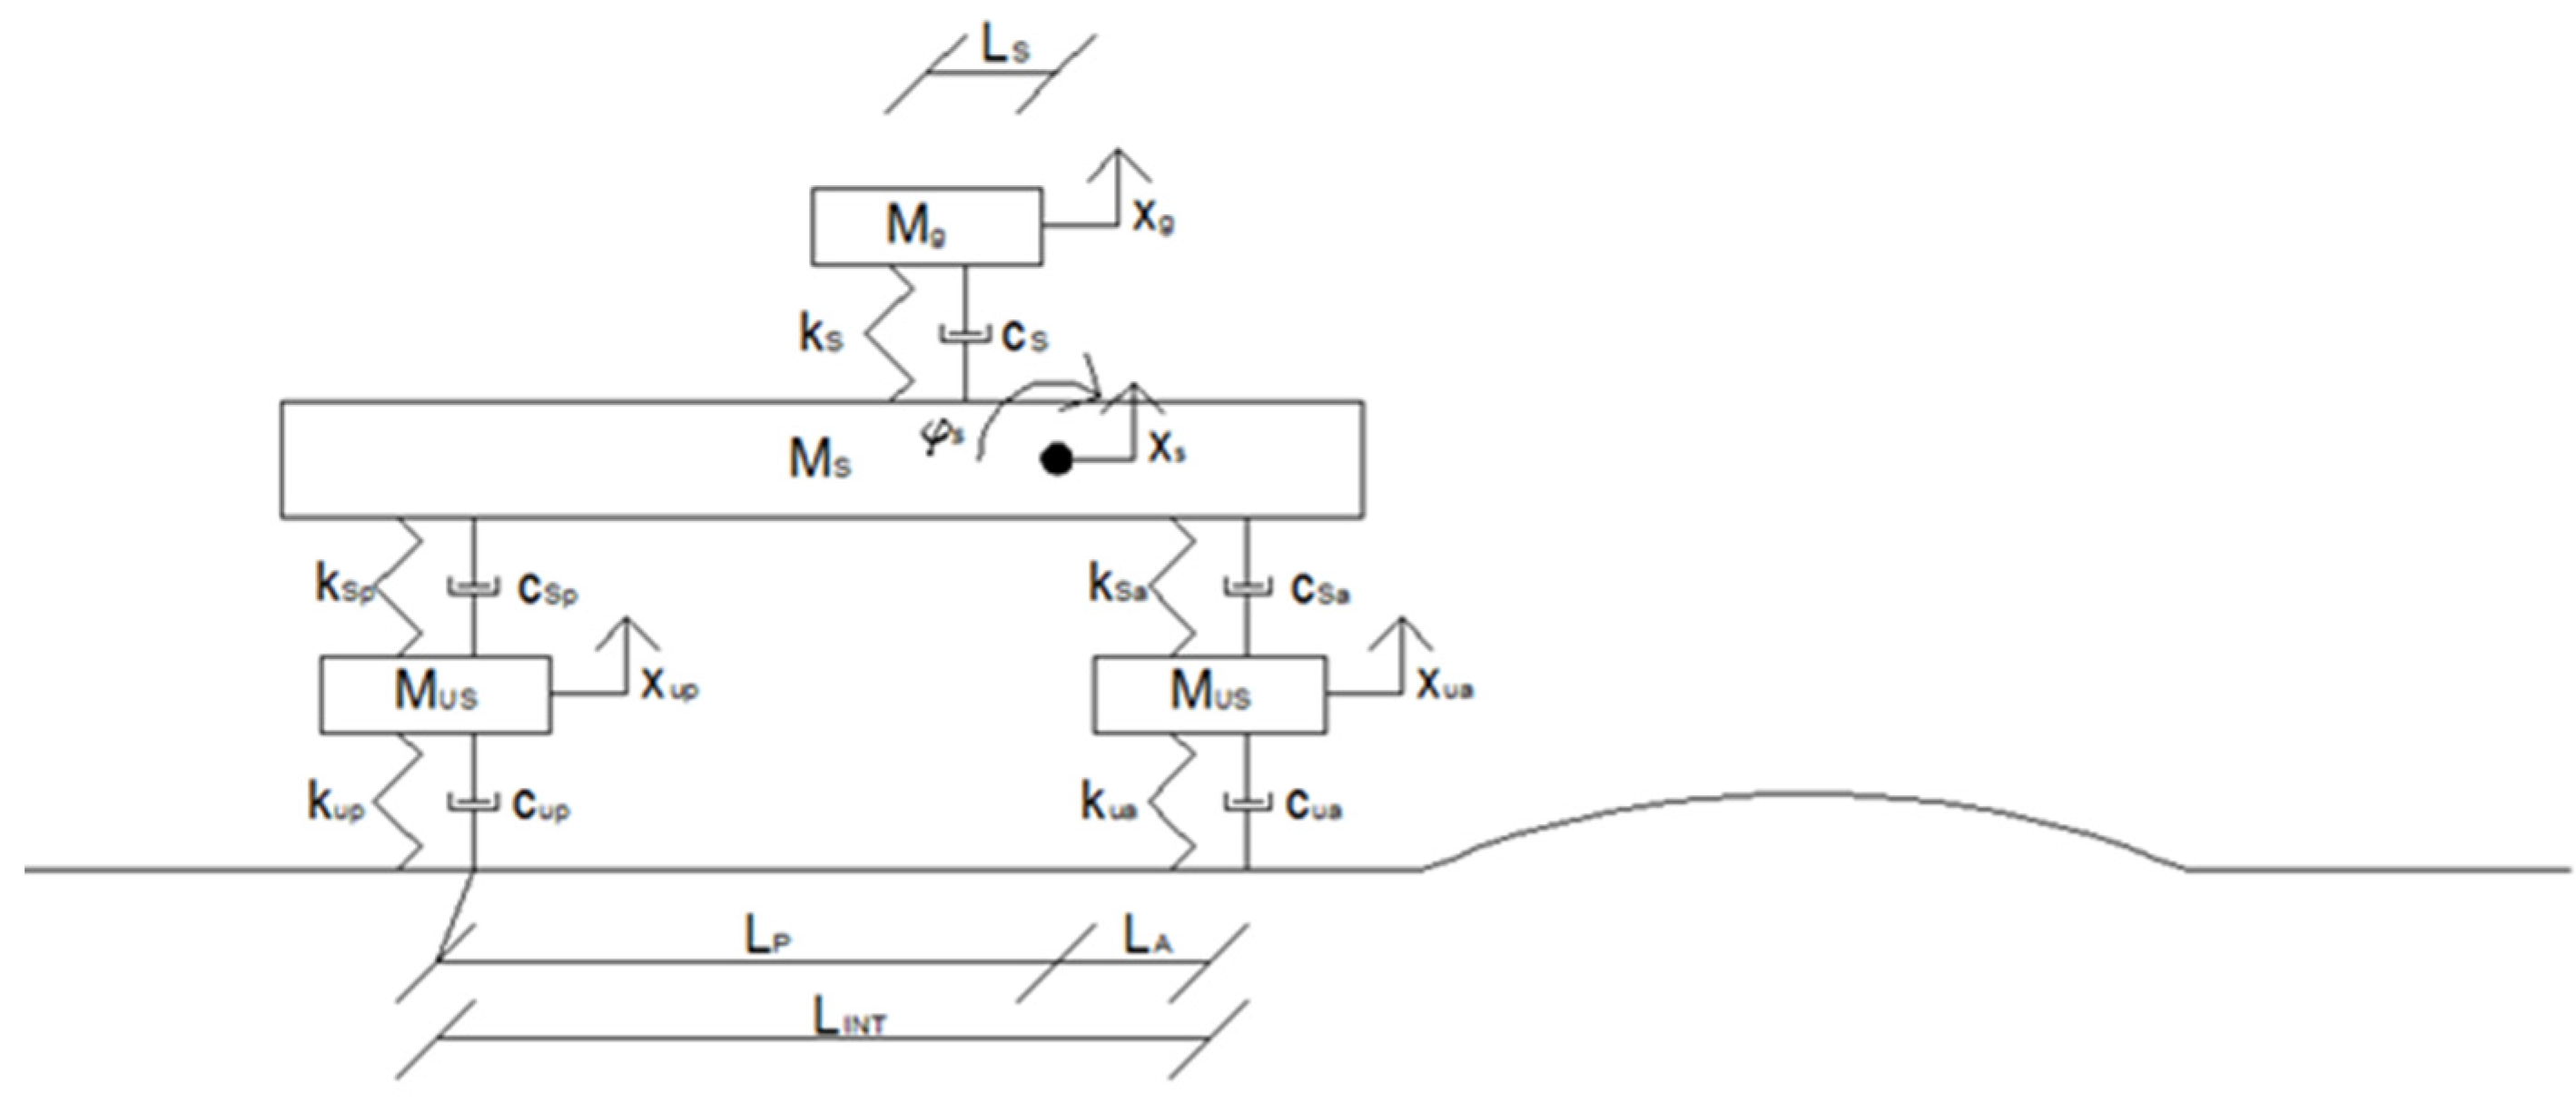
A further insight into riding comfort may consider the insertion of the driver, which, in turn, can be represented by a lumped mass system (
Figure 4). However, it is worth highlighting that, in this latter case, more information related to the inertial and mechanical properties of seat suspensions and the human body itself needs to be collected that is not easily available.
On these premises, it seemed more appropriate to consider a Half Car Model in evaluating vertical acceleration. Within this model, the vehicle chassis is considered a rigid body with its own mass and its own specific rotational inertia. The chassis is connected to both axles (rear and front) by means of springs coupled with dashpots describing the suspension system, whereas the axle (described by a point mass) is connected to the road surface by another spring–dashpot system accounting for tire mechanical properties.
On a computational point of view, for a specific vehicle model, the vehicle motion on an irregular surface can be easily described through a classical set of second-order linear differential equations:
where [
M] is the mass matrix containing the inertial properties of the vehicle, [
C] is the damping matrix containing the damping properties of the dashpots, [
K] is the stiffness matrix containing the stiffness properties of the springs,
X is the vector of displacements pertaining to each degree-of-freedom characterizing the model, and
F is the vector of the external forces acting on the vehicle (in this case the vertical excitation of the profile).
By making use of the complex notation to describe the displacement of each degree-of-freedom, the aforementioned set of differential equations can be transformed into an algebraic set of equations in the frequency domain that can be solved in order to derive the complex transfer functions (or frequency response function, FRF) between the road profile vertical excitation and the kinematic physical entities associated with the degree-of-freedom of the dynamic system itself (i.e., translational and rotational displacement and their first and second order derivatives).
Once all the relevant parameters (such as the road surface characteristics, the mechanical and inertial properties, and the speed of heavy vehicles) are known, time histories of the vertical displacement and of rotation sensed in the traveling vehicle are computed by convoluting the FRF of the vehicle model with the spectral representation of the vertical road profile and by performing an inverse Fourier transform with the aim of evaluating the time histories.
2.3. Input Data
By analyzing the accelerogram in the time domain, it may be necessary to evaluate the acceleration in the frequency domain by making a change of variables through the use of the DFT (fast discrete Fourier transform) in order to evaluate the weighted root mean square (RMS) of vertical acceleration according to the procedure based on the exposure threshold for human vibration reported in the frequency domain by ISO Standards [
67,
68,
69].
Once the most suitable vehicle model had been identified, the travel of four different types of vehicles, representative of the entire vehicle fleet that can be encountered in an urban environment, was simulated on several vertical traffic calming devices. The four macrocategories of vehicles can be summarized as follows:
Small cars are represented with the designation A;
Medium-sized cars are represented with the designation C;
Sedans are represented with the designation D;
Off-road/sport utility vehicles are represented with the designation E.
The main characteristics of the vehicles considered are shown in
Table 1. These quantities were collected and rearranged from the technical data sheets [
70].
2.4. Implementation of Speed Humps
The initial objective of this work is to evaluate, for a given profile shape and for a given vehicle, a relationship that links acceleration level sensed by the driver to actuated vehicle speed. It is intuitively possible to imagine that acceleration increases with increasing speed, the height of the hump, and decreasing vehicle characteristics. A careful analysis must therefore be carried out to understand how the input parameters can vary the acceleration intended as a disturbance index. In this study, a fleet of private vehicles (described above in
Table 1) representing the traffic spectrum was considered.
A total of 5 types of bumps have been implemented in the model, 4 of which are parabolic and 1 trapezoidal. Below are the geometric characteristics of each bump:
Parabolic speed hump (length 3.65 m; height 0.0635 m);
Parabolic speed hump (length 3.65 m; height 0.0762 m);
Parabolic speed hump (length 6.70 m; height 0.0762 m);
Parabolic speed hump (length 6.70 m; height 0.0889 m);
Trapezoidal speed hump (length 6.70 m; height 0.0762 m).
The analyses were conducted in a speed range between 0 km/h and 40 km/h, with a speed step of 5 km/h for each vehicle on each bump.
Thus, diagrams have been obtained in which acceleration is placed in terms of RMS.
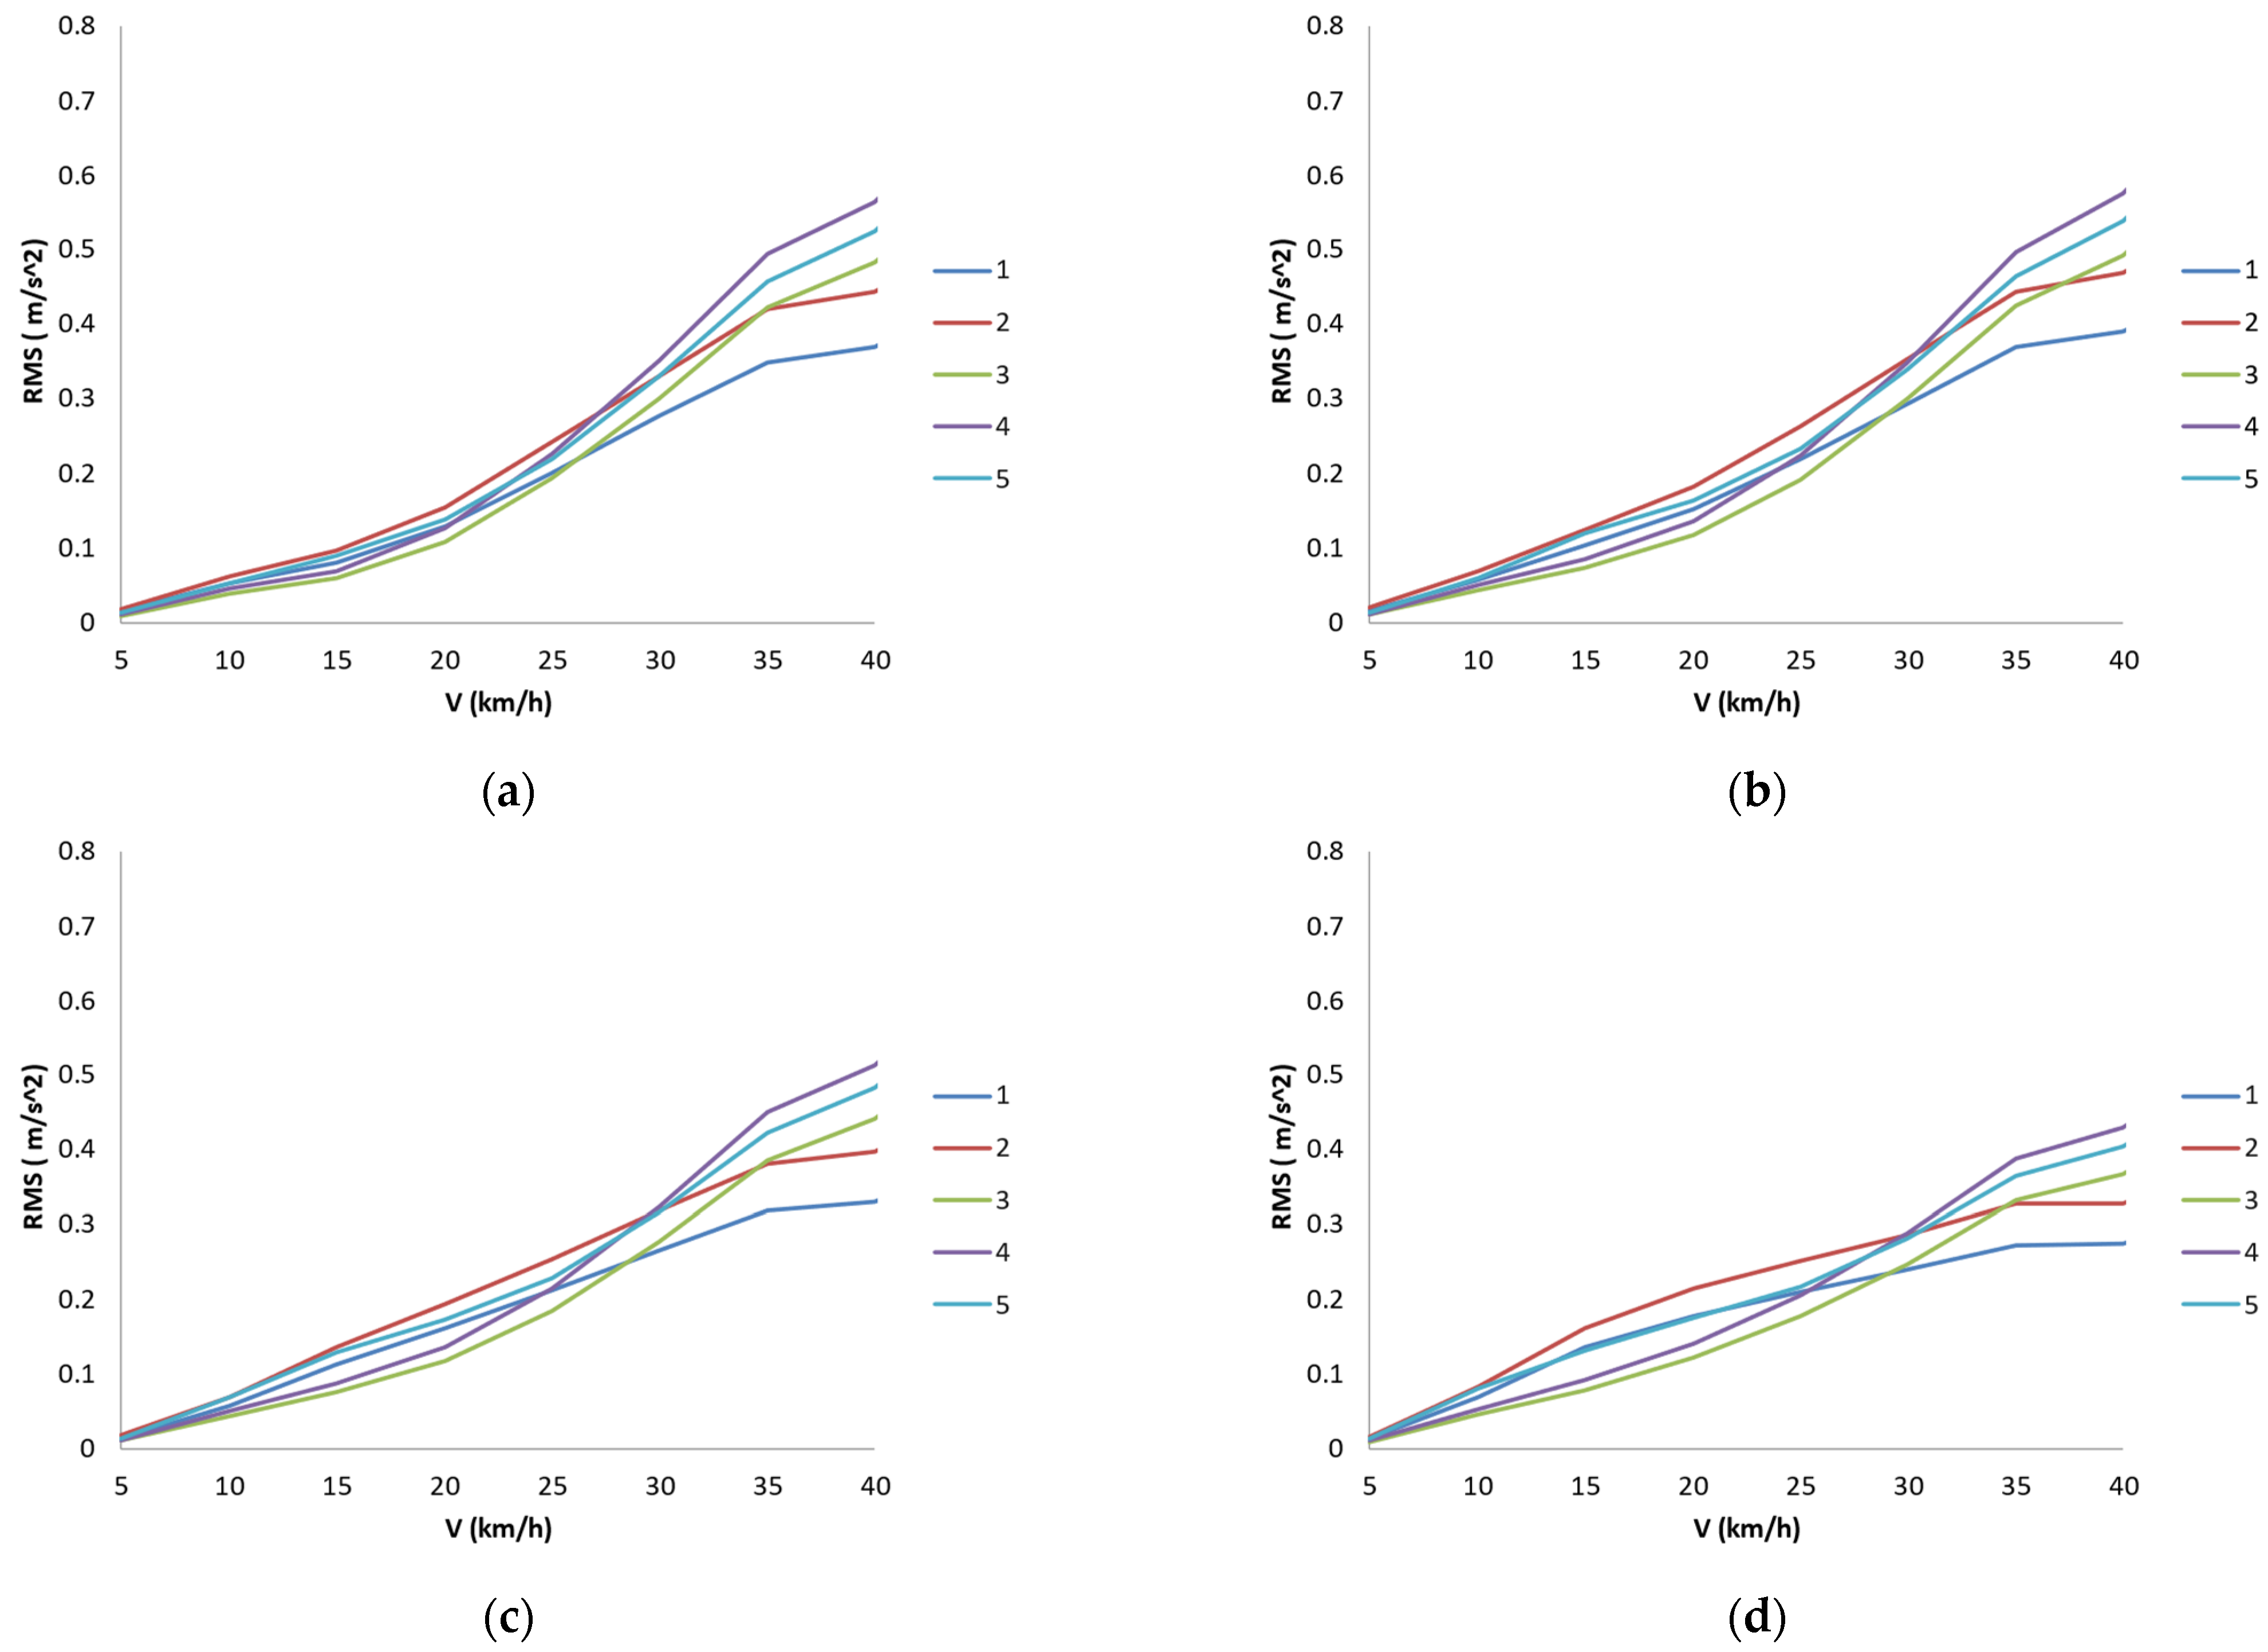
The results for each vehicle on each type of bump are shown below in graphical form (
Figure 5).
From the graphs, it is possible to deduce how the response in terms of RMS varies with the variation of the geometric characteristics of the device (height and length).
It should be noted that at the same speed, the device that causes greater acceleration for all vehicles, in terms of RMS, is the fourth device, with a length of 6.70 m and a height of 8.89 cm.
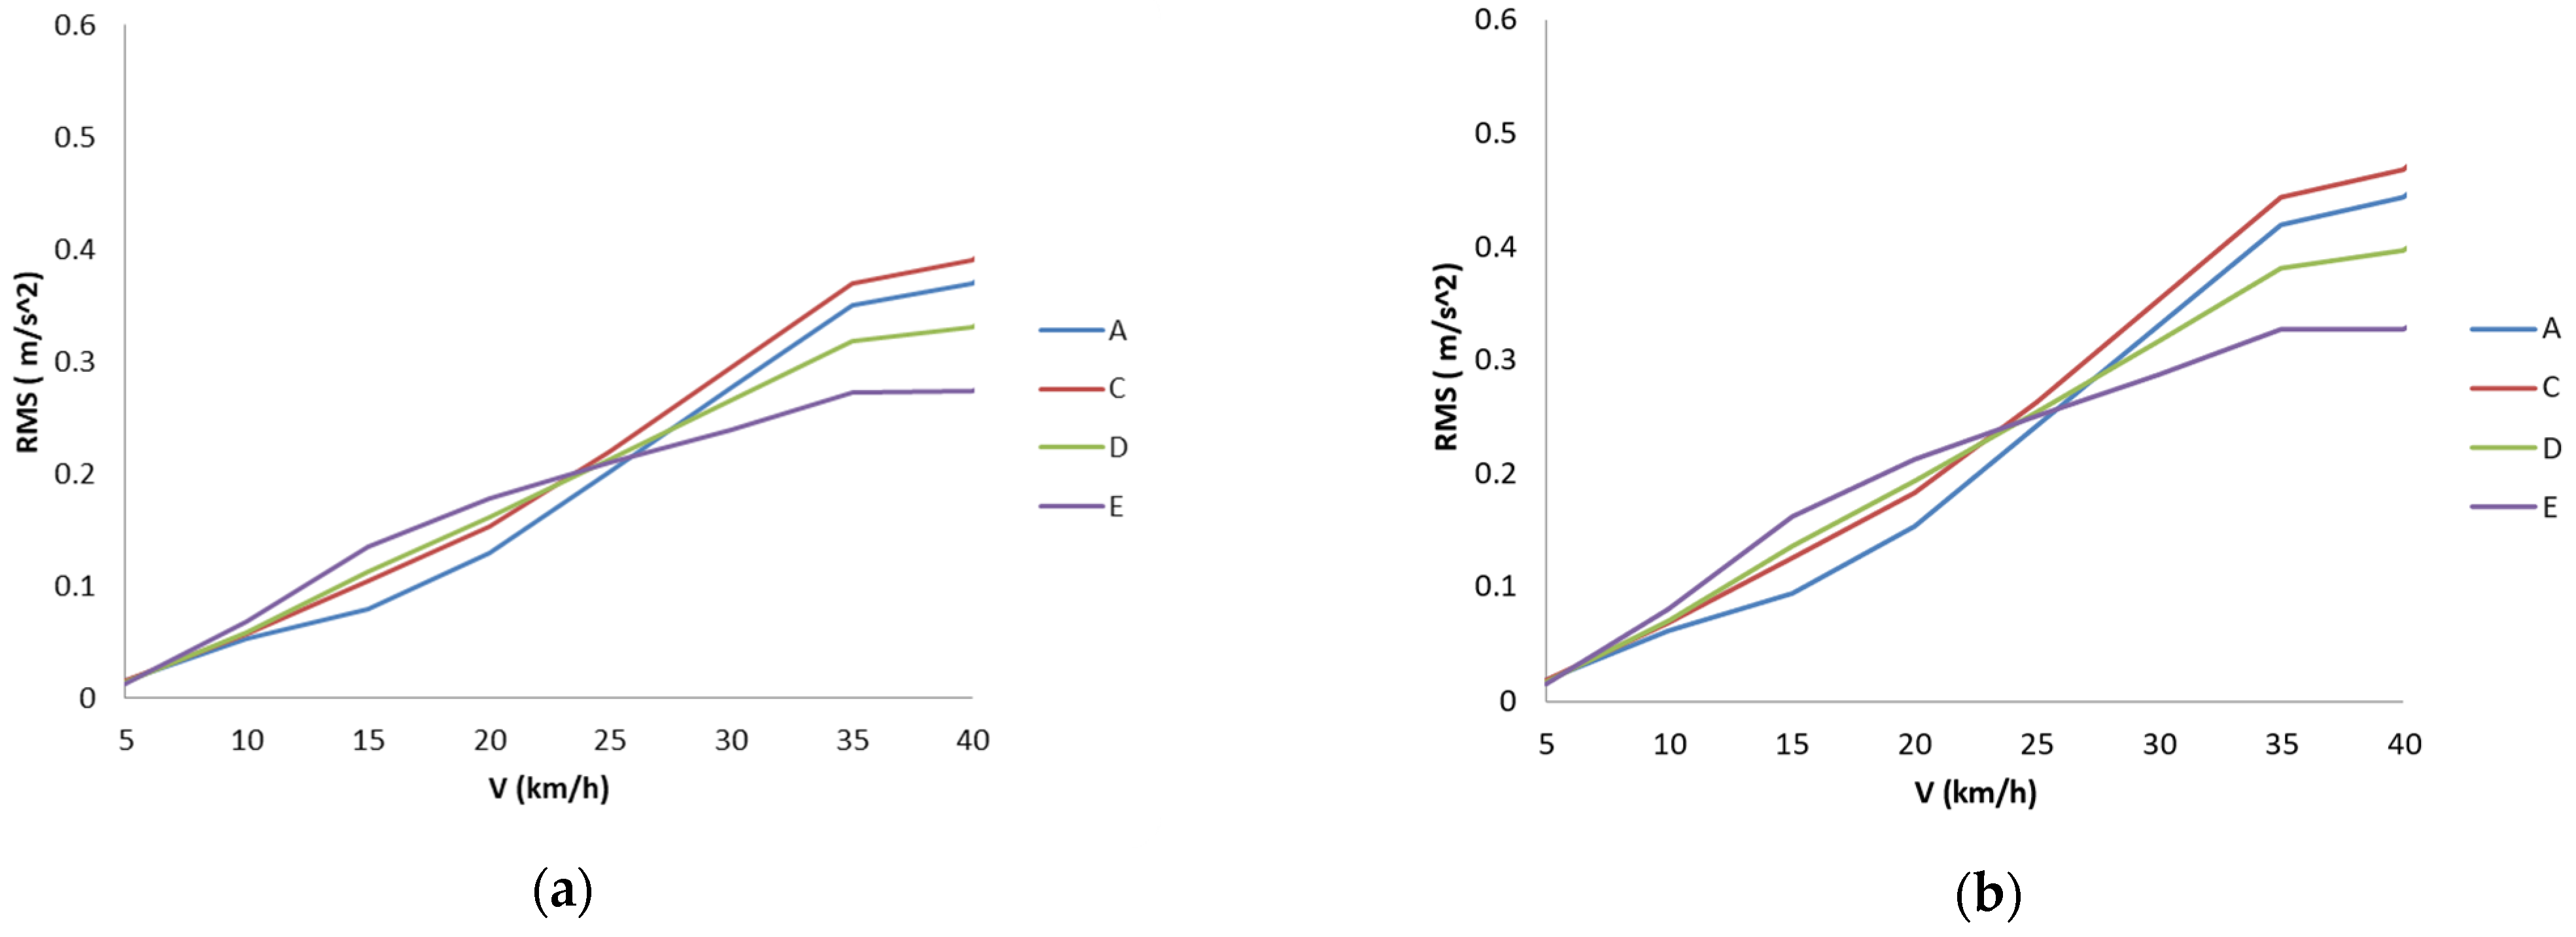
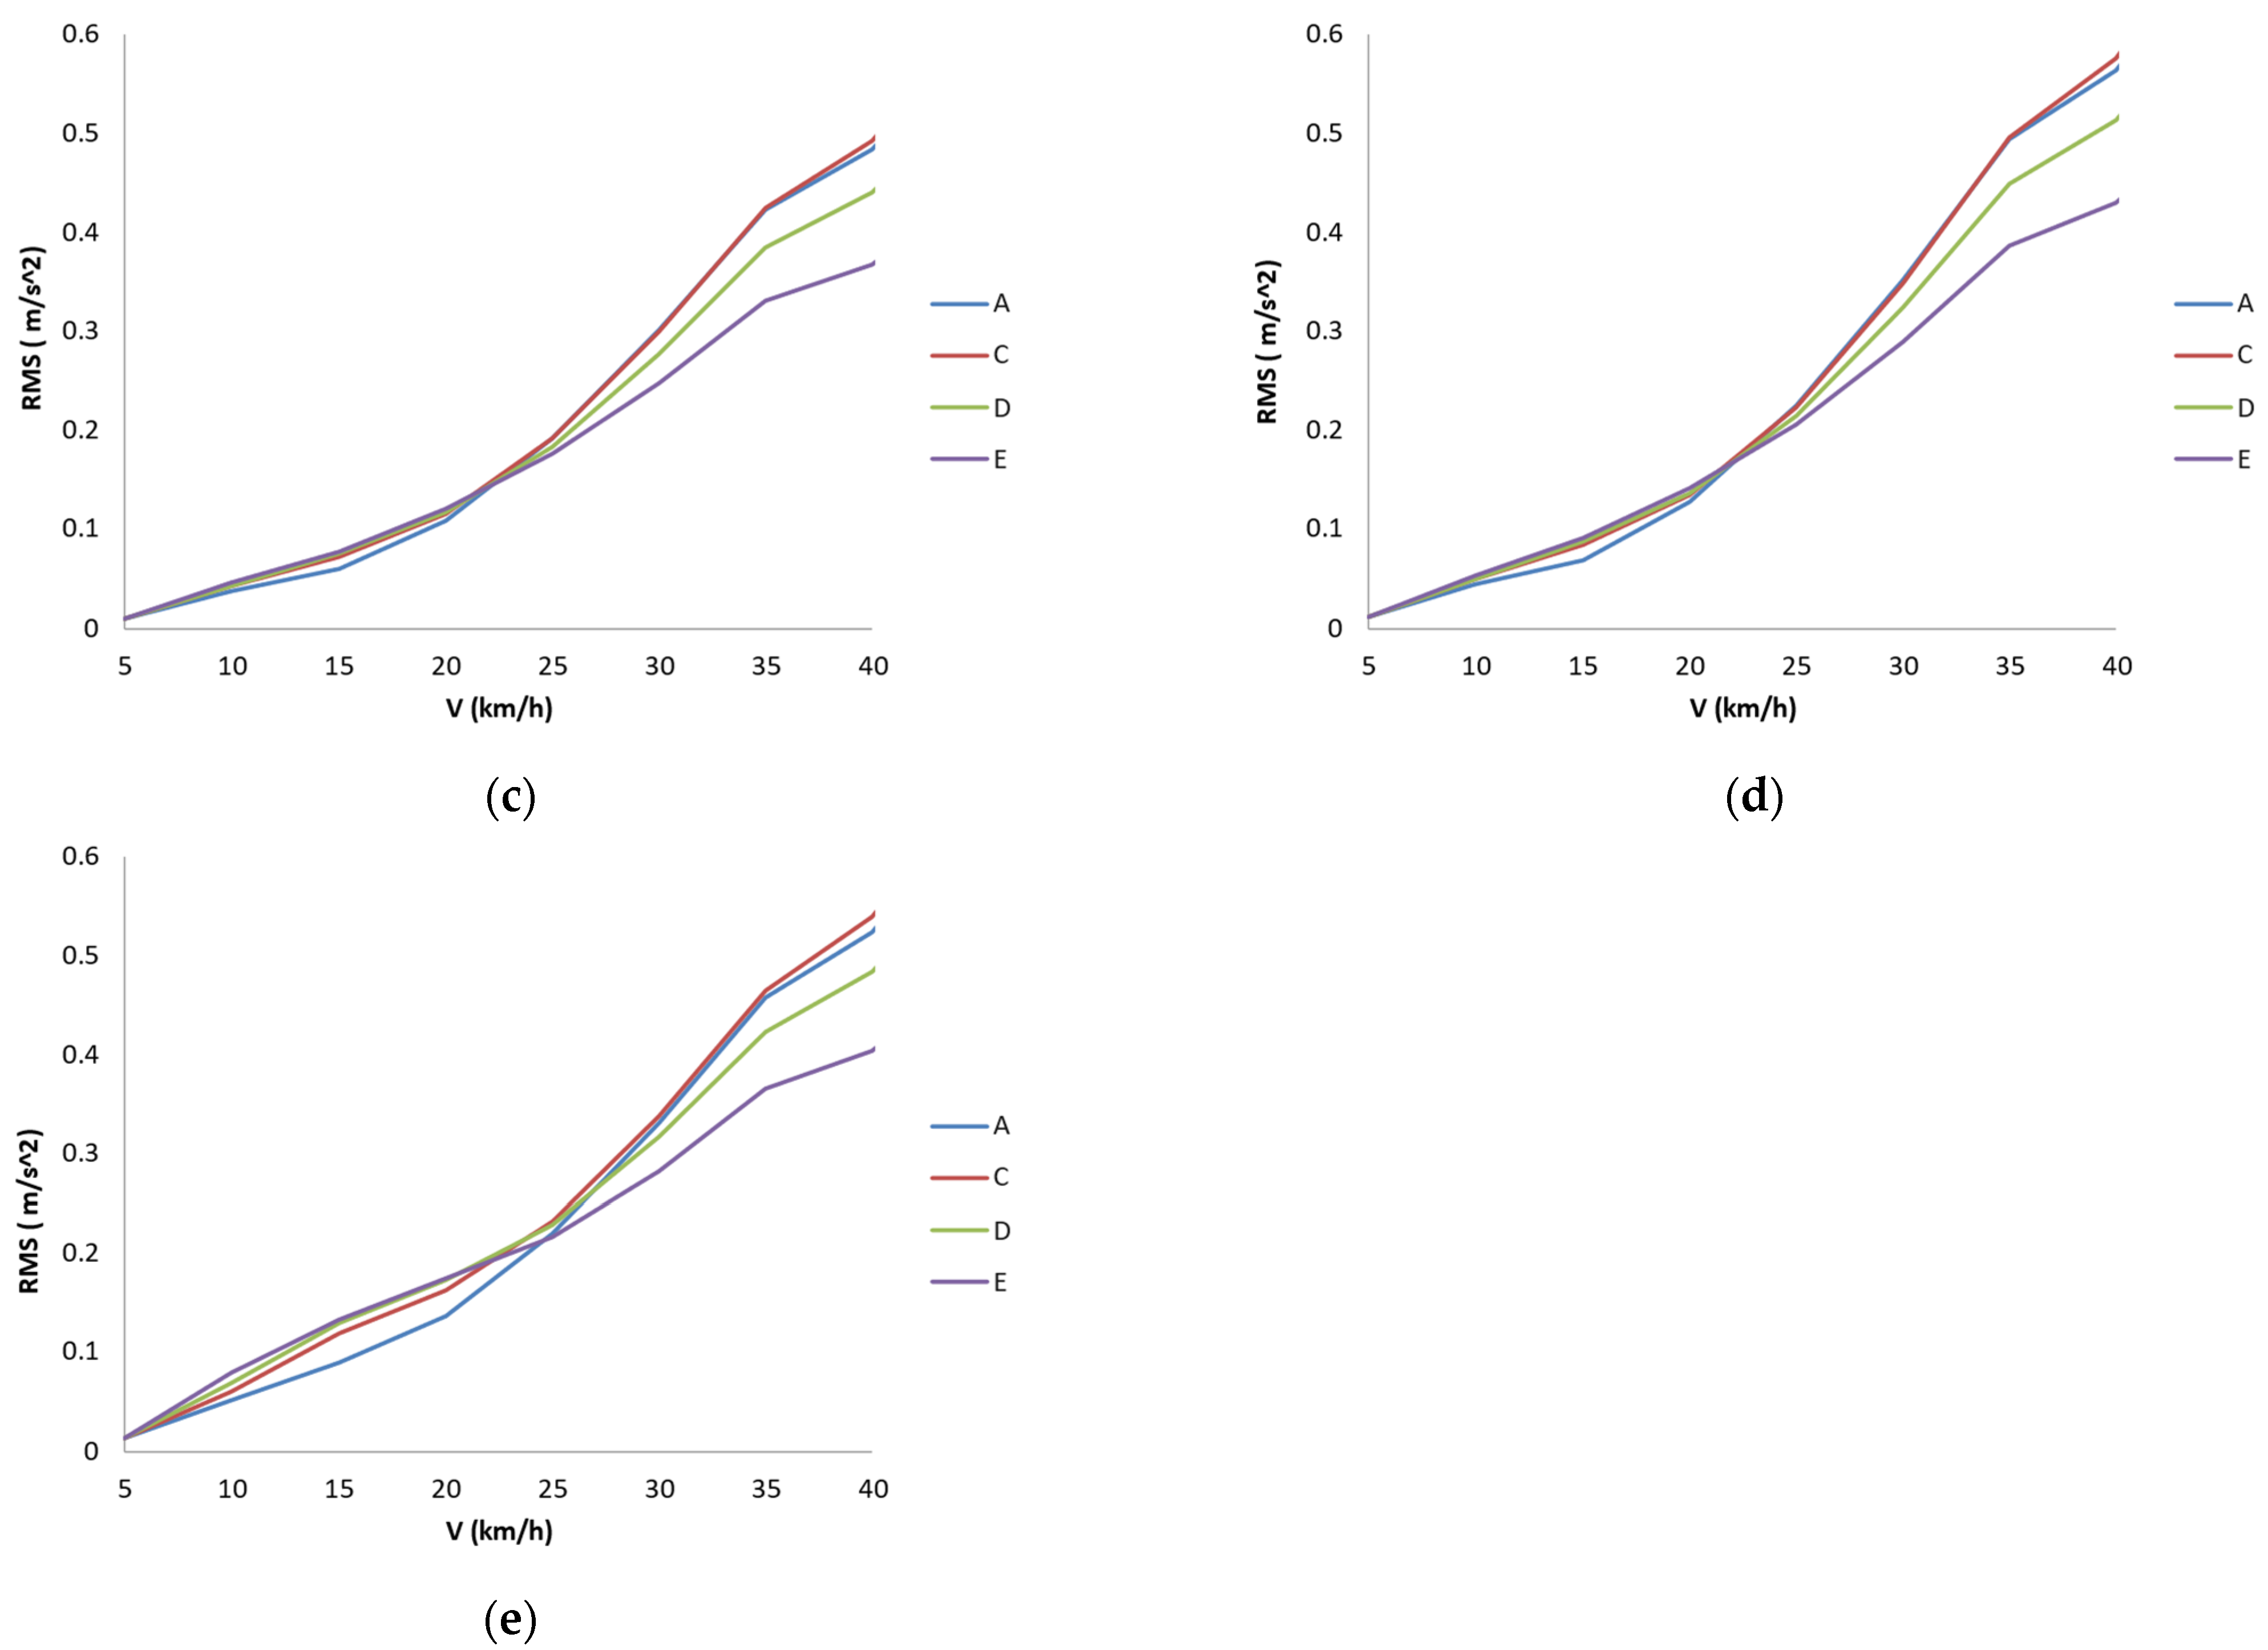
It can be similarly interesting to evaluate the acceleration level caused by the same vertical traffic calming device on different vehicles. To this purpose, RMS diagrams of vertical acceleration versus vehicle speed have been conveniently derived and reported in the following figures (see
Figure 6).
It can be observed from these latter diagrams that the vibration-induced disturbance is very similar for speed values ranging from 22 to 25 km/h, depending on the specific vertical traffic calming device traveled. For higher speed values, it can be seen that vehicles belonging to category E and category D receive less “vibrational stress” than vehicles belonging to category A and category C.
These results seem to provide some theoretical basis to investigate the possibility of highlighting different crossing speed behaviors according to the specific vehicle category traveling onto a defined vertical traffic calming device.
To this purpose, a preliminary experimental campaign, which is detailed in the following, has been carried out on a real vertical traffic calming device located in an urban environment.
3. Case Study
An application of this research has been developed within a city in Central Italy.
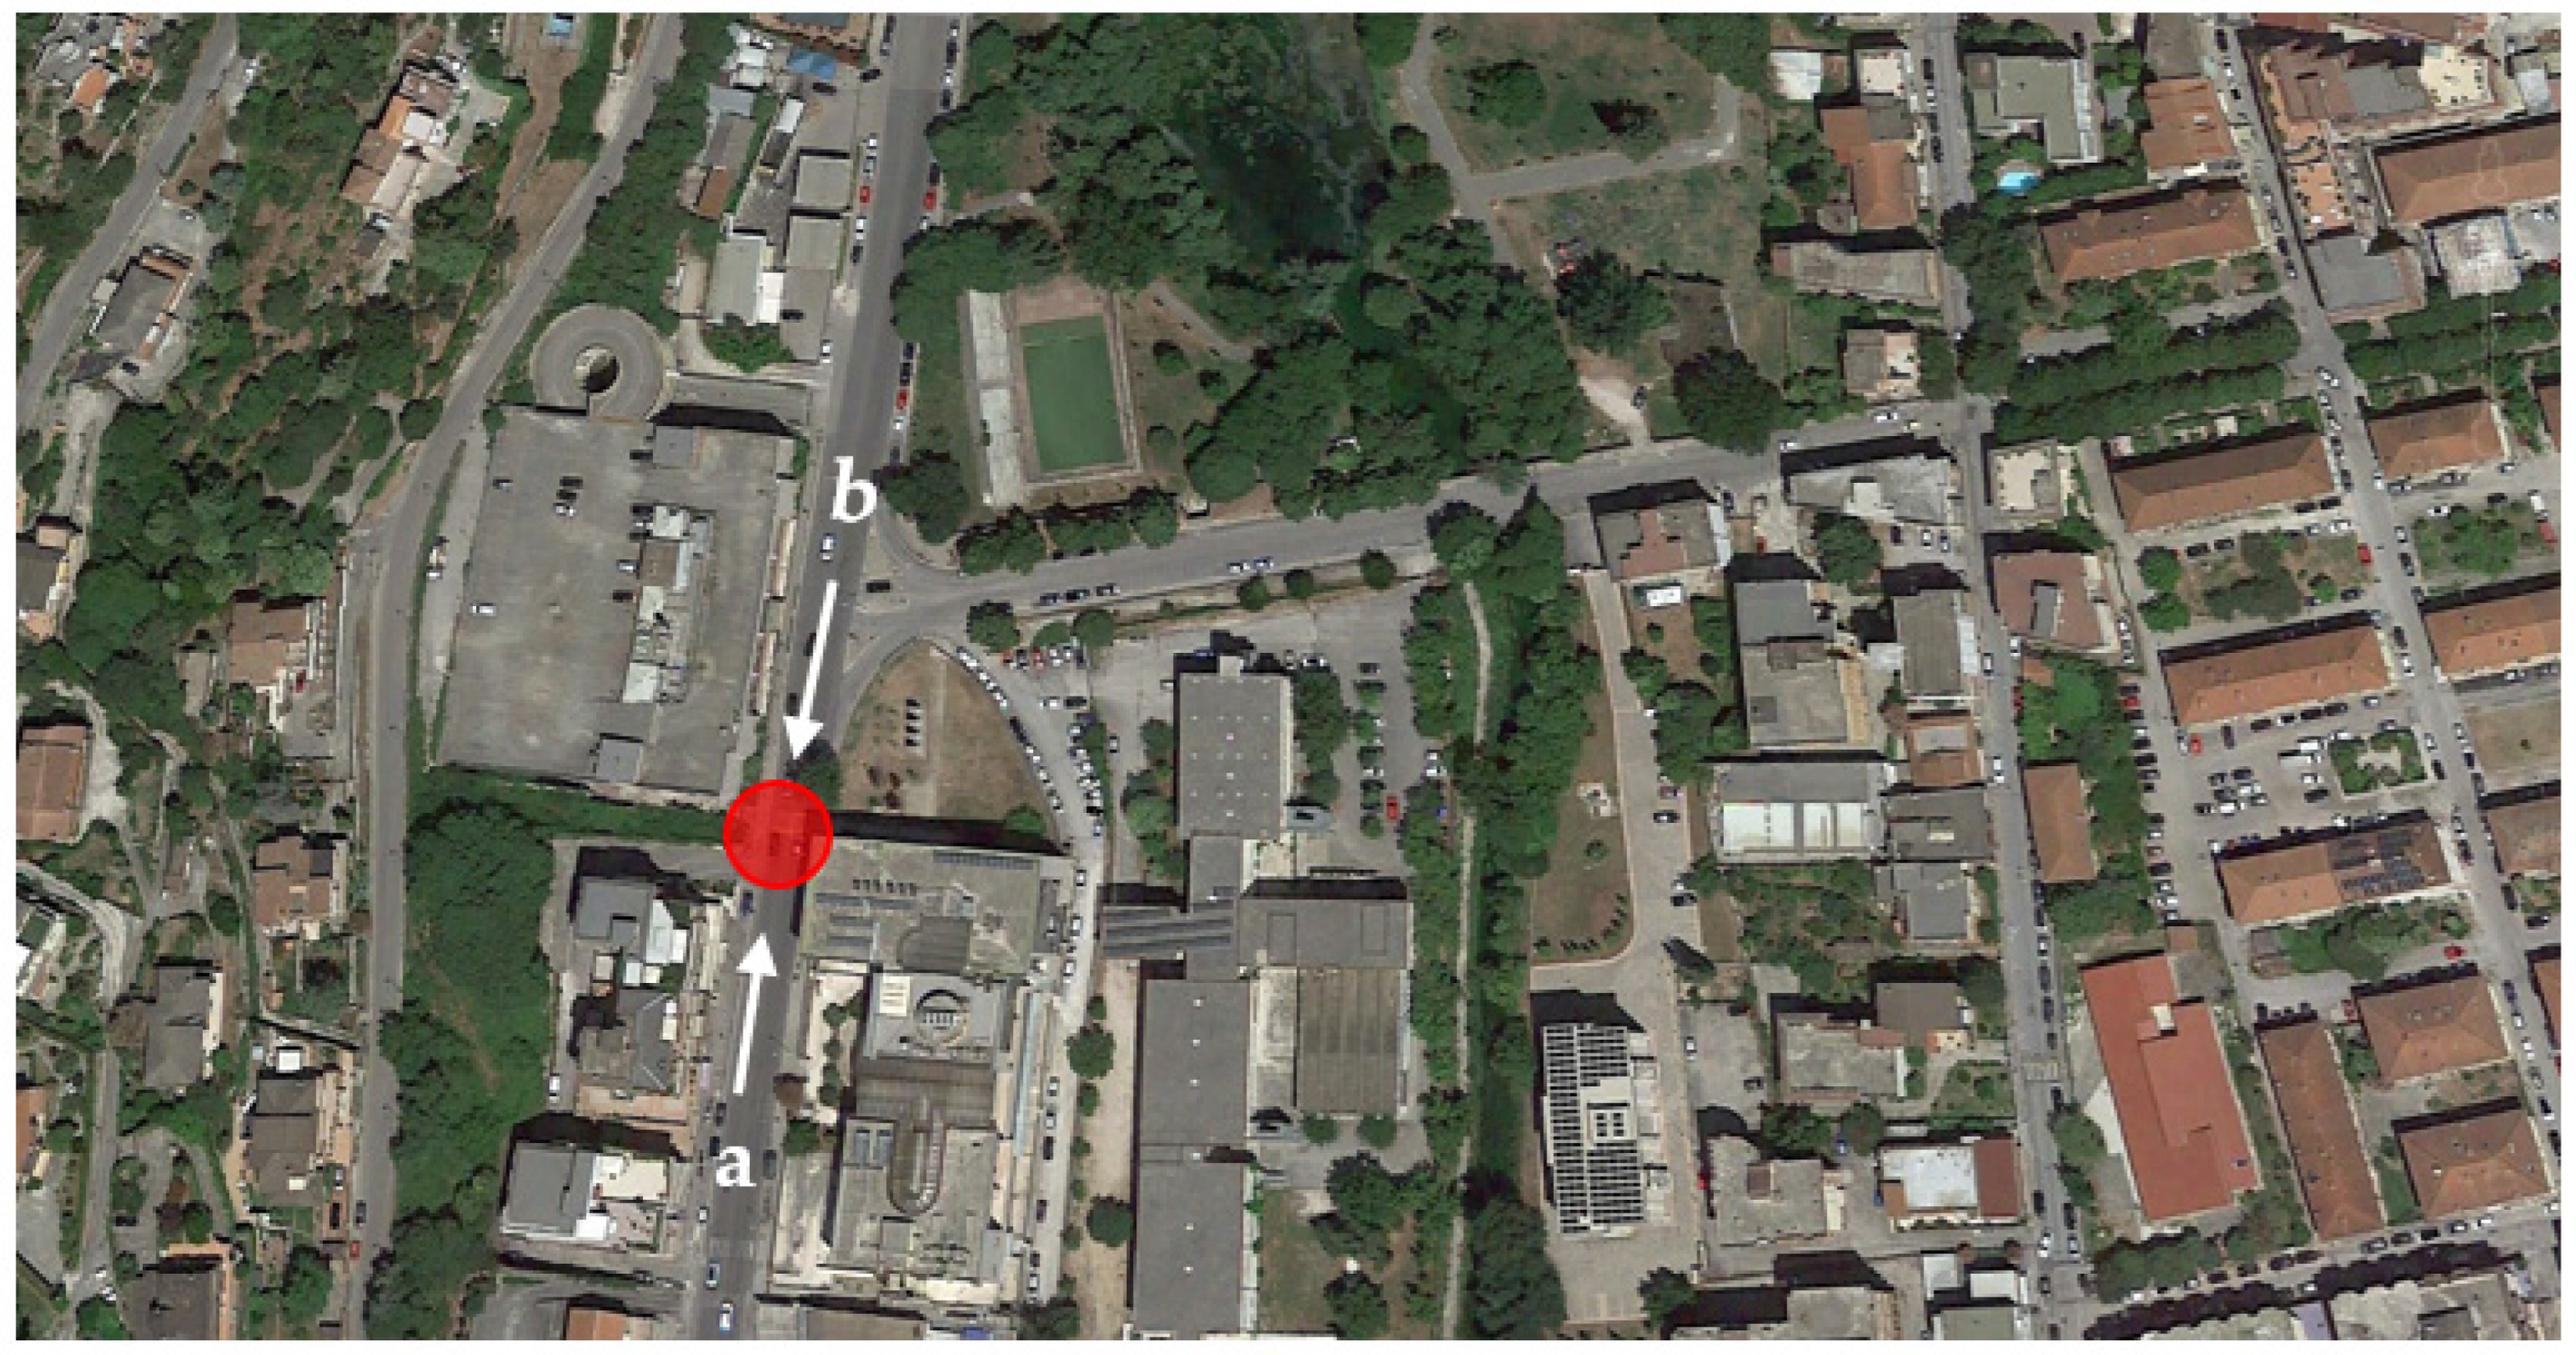
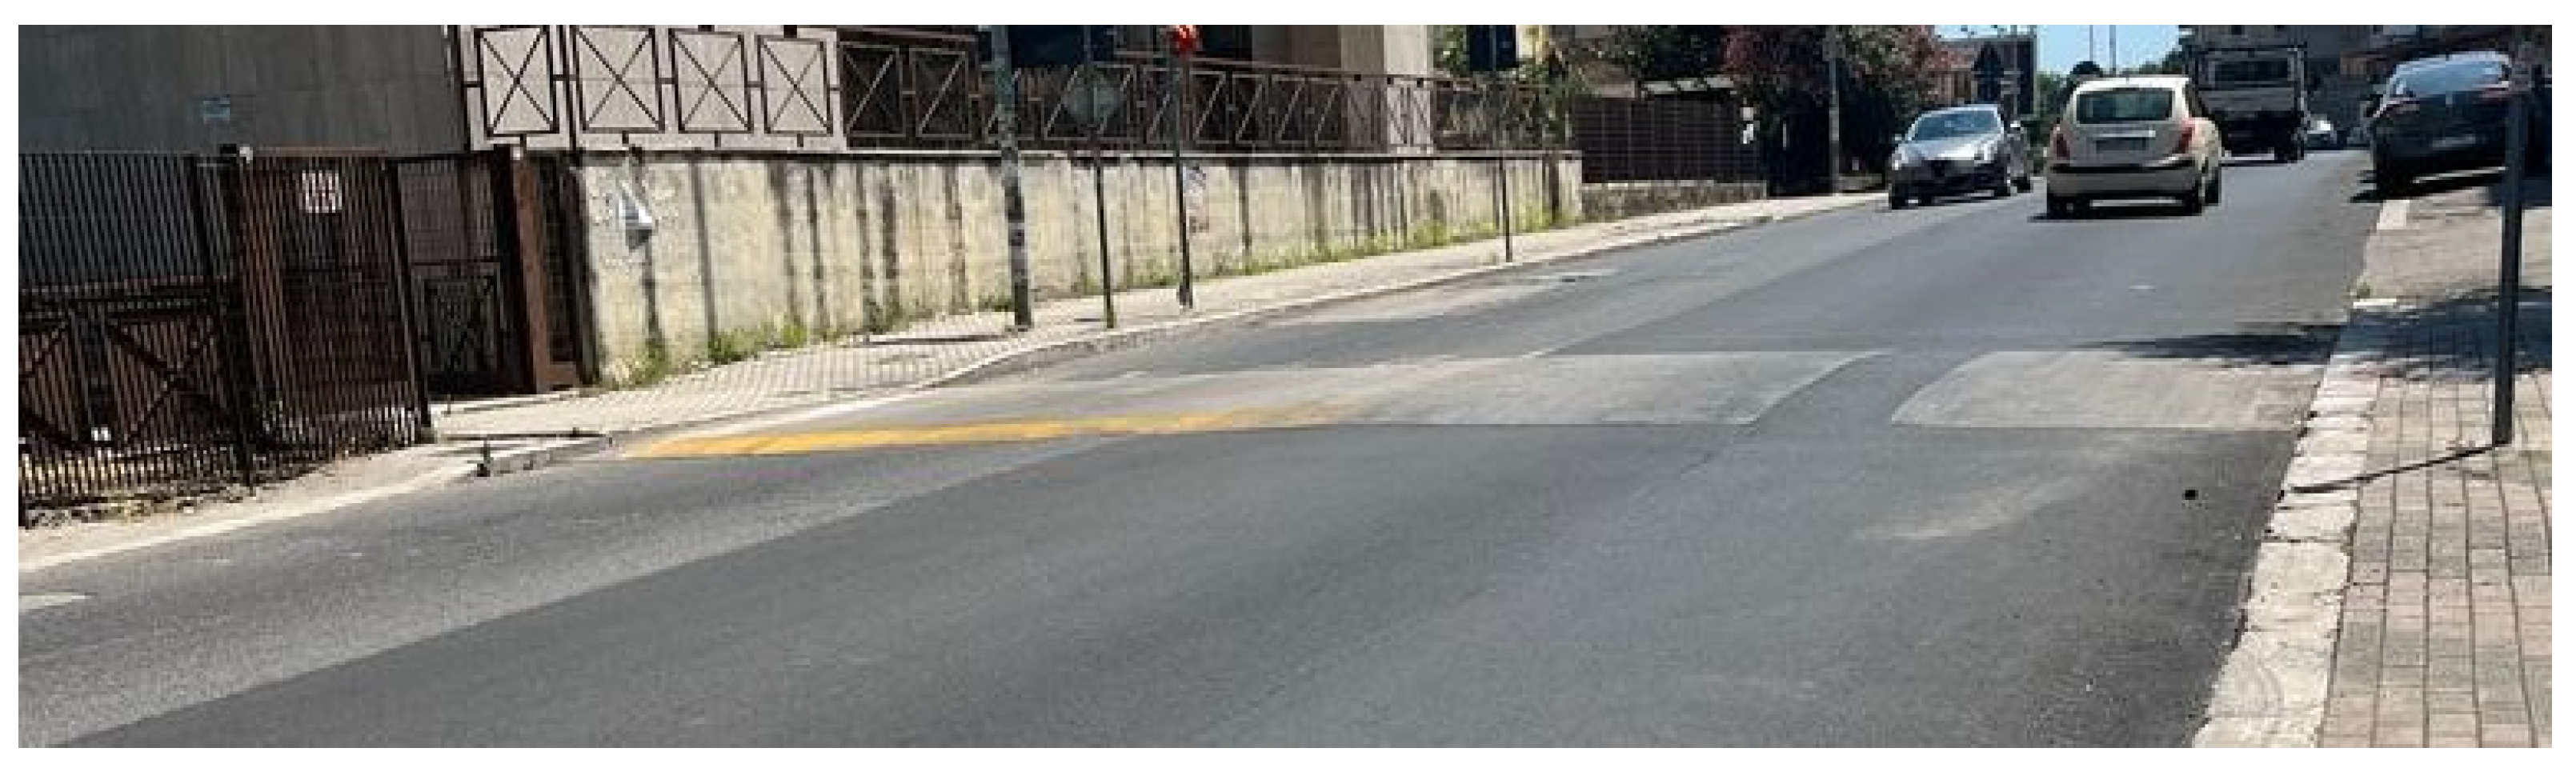
A raised pedestrian crossing (RPC) located close to a university facility was selected since it was easier to monitor. The vertical shape of the traffic calming device is trapezoidal, with an overall length of 3.75 m. The location of the investigated vertical traffic calming device is reported in
Figure 7, and in
Figure 8, a closer view of the RPC is shown.
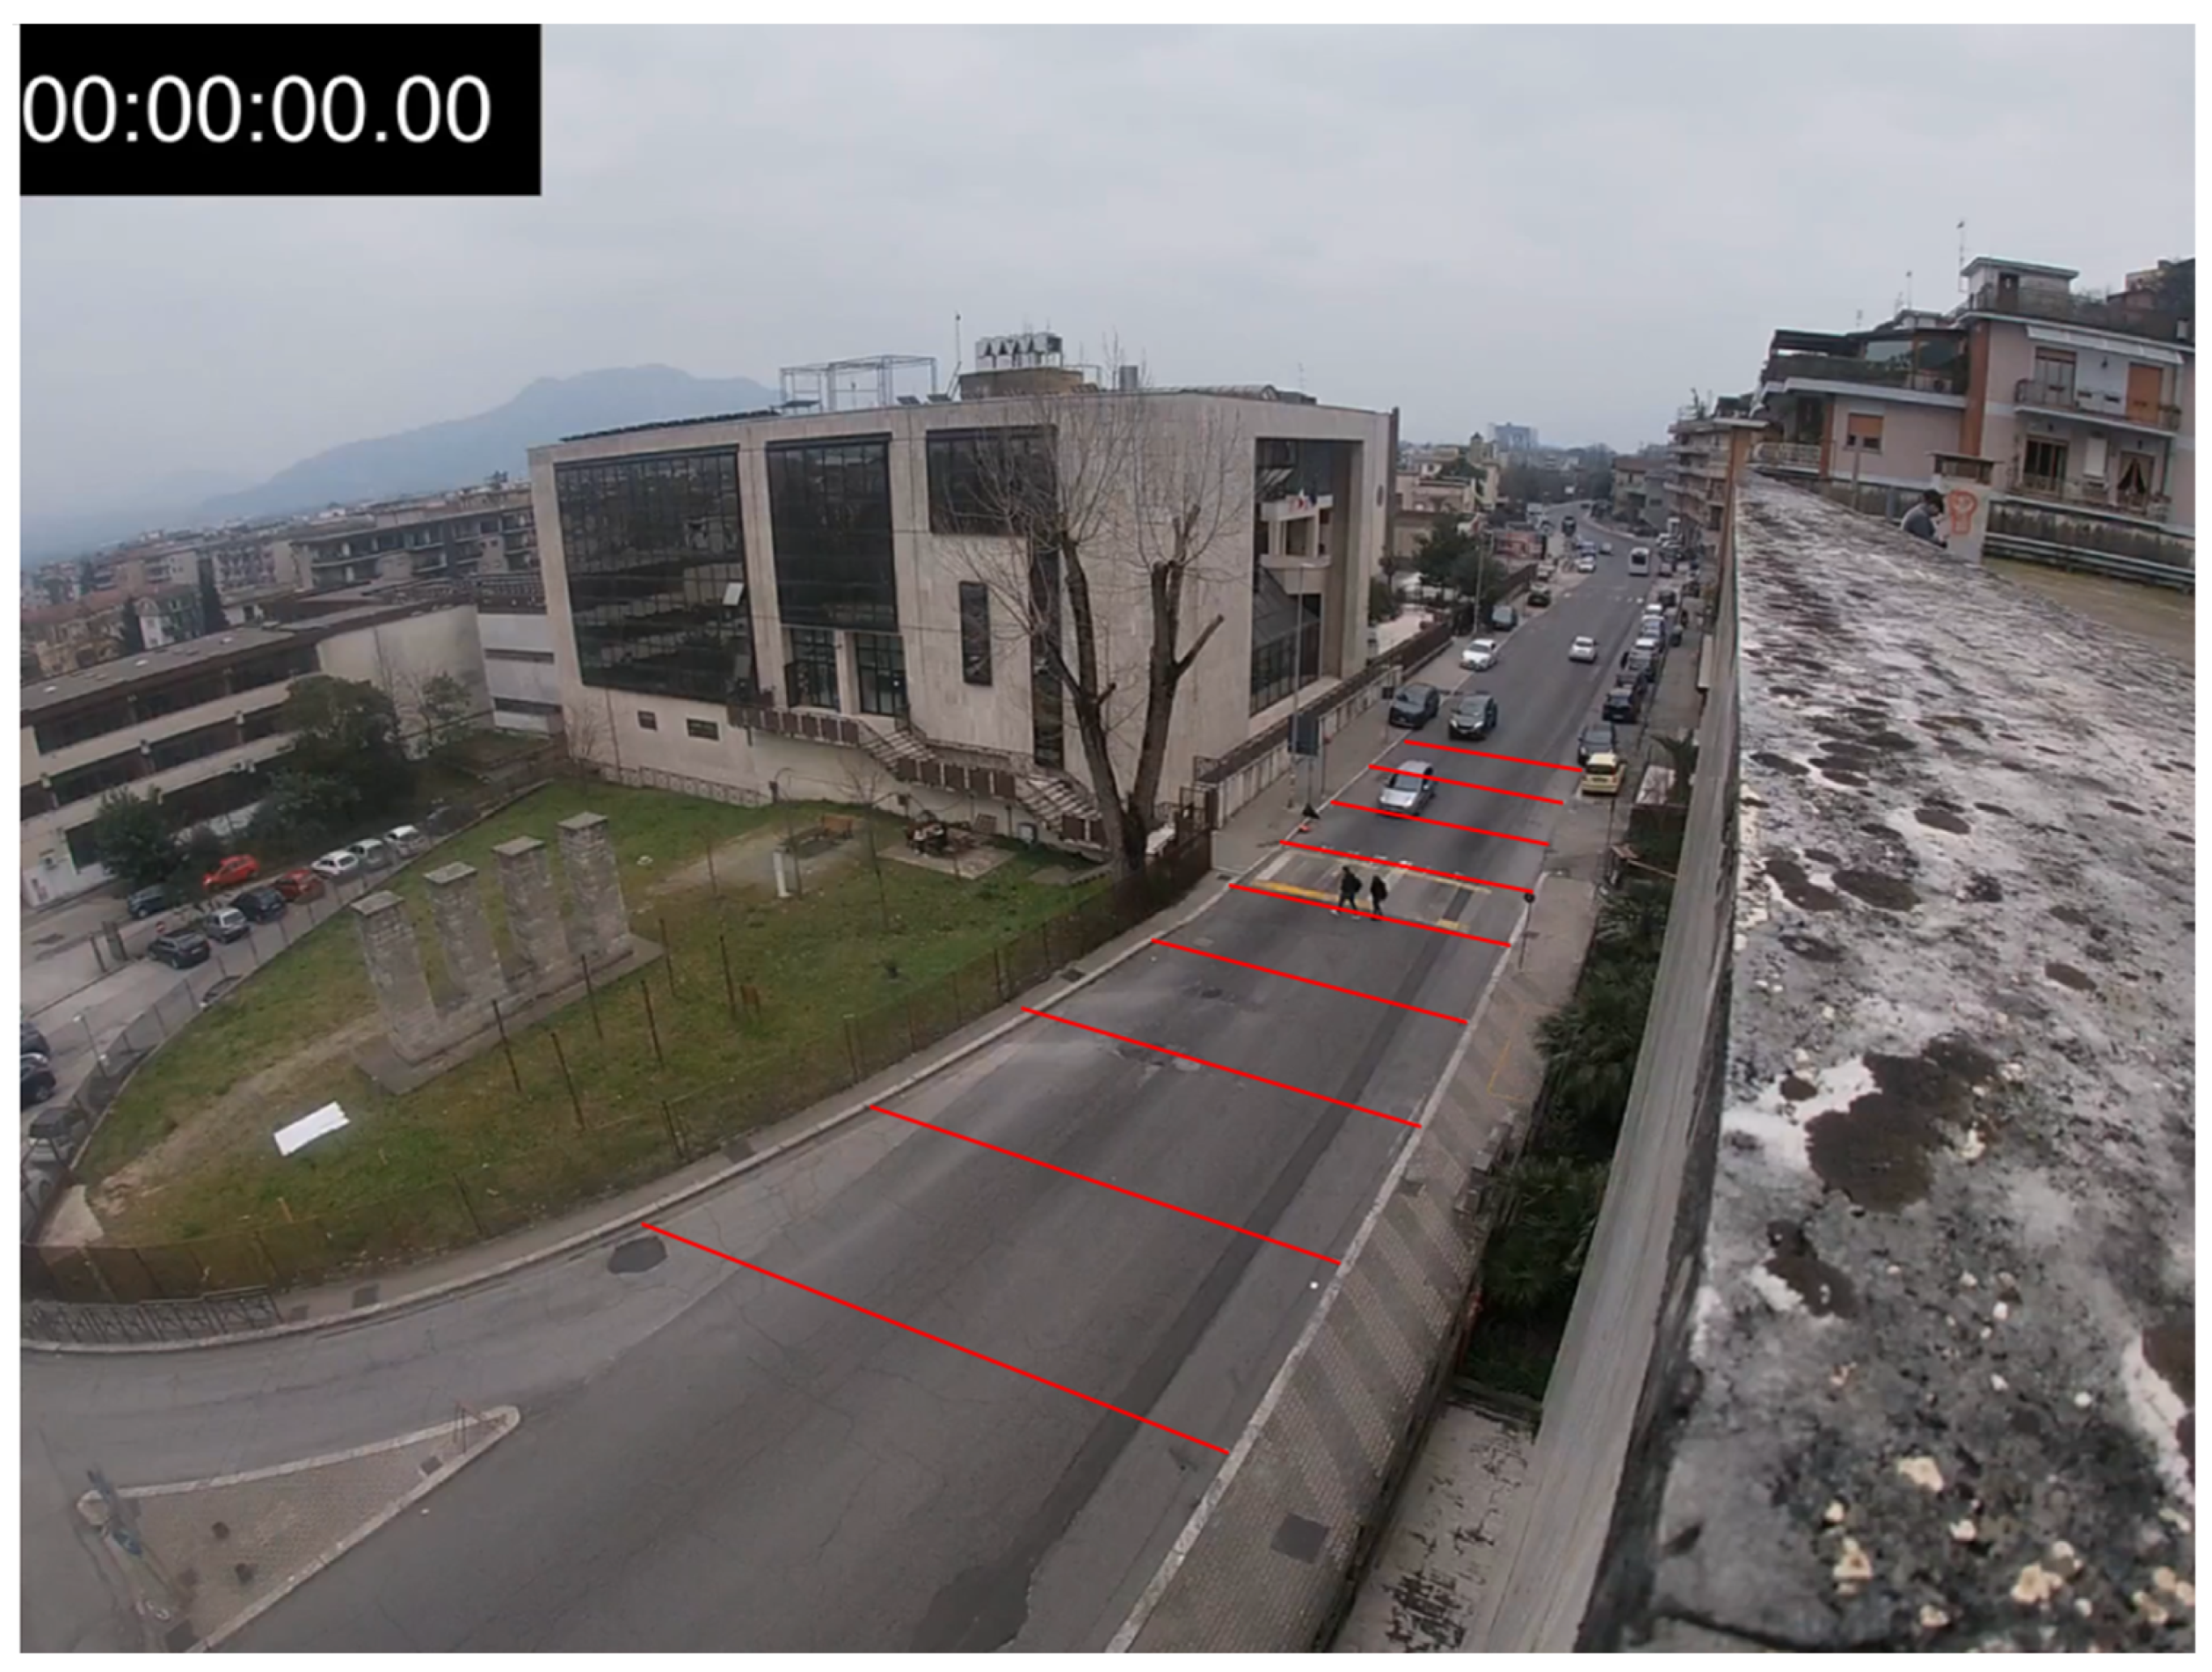
A digital camera located at an elevated point of view has been used to monitor vehicular traffic at different hours of the day and on different typical weekdays. In order to avoid errors caused by the experimental setting, the same camera placement and investigator were employed throughout the experimentation.
In order to derive consistent vehicle speed profiles, it was necessary to define several equally spaced fixed targets in the video frames (every 5 m) departing from the monitored RPC along the upstream and downstream directions (see
Figure 9).
It was therefore possible to measure spot speeds of vehicles belonging to monitored traffic flows in both directions of travel, defined in
Figure 7 with the letters “a” and “b”.
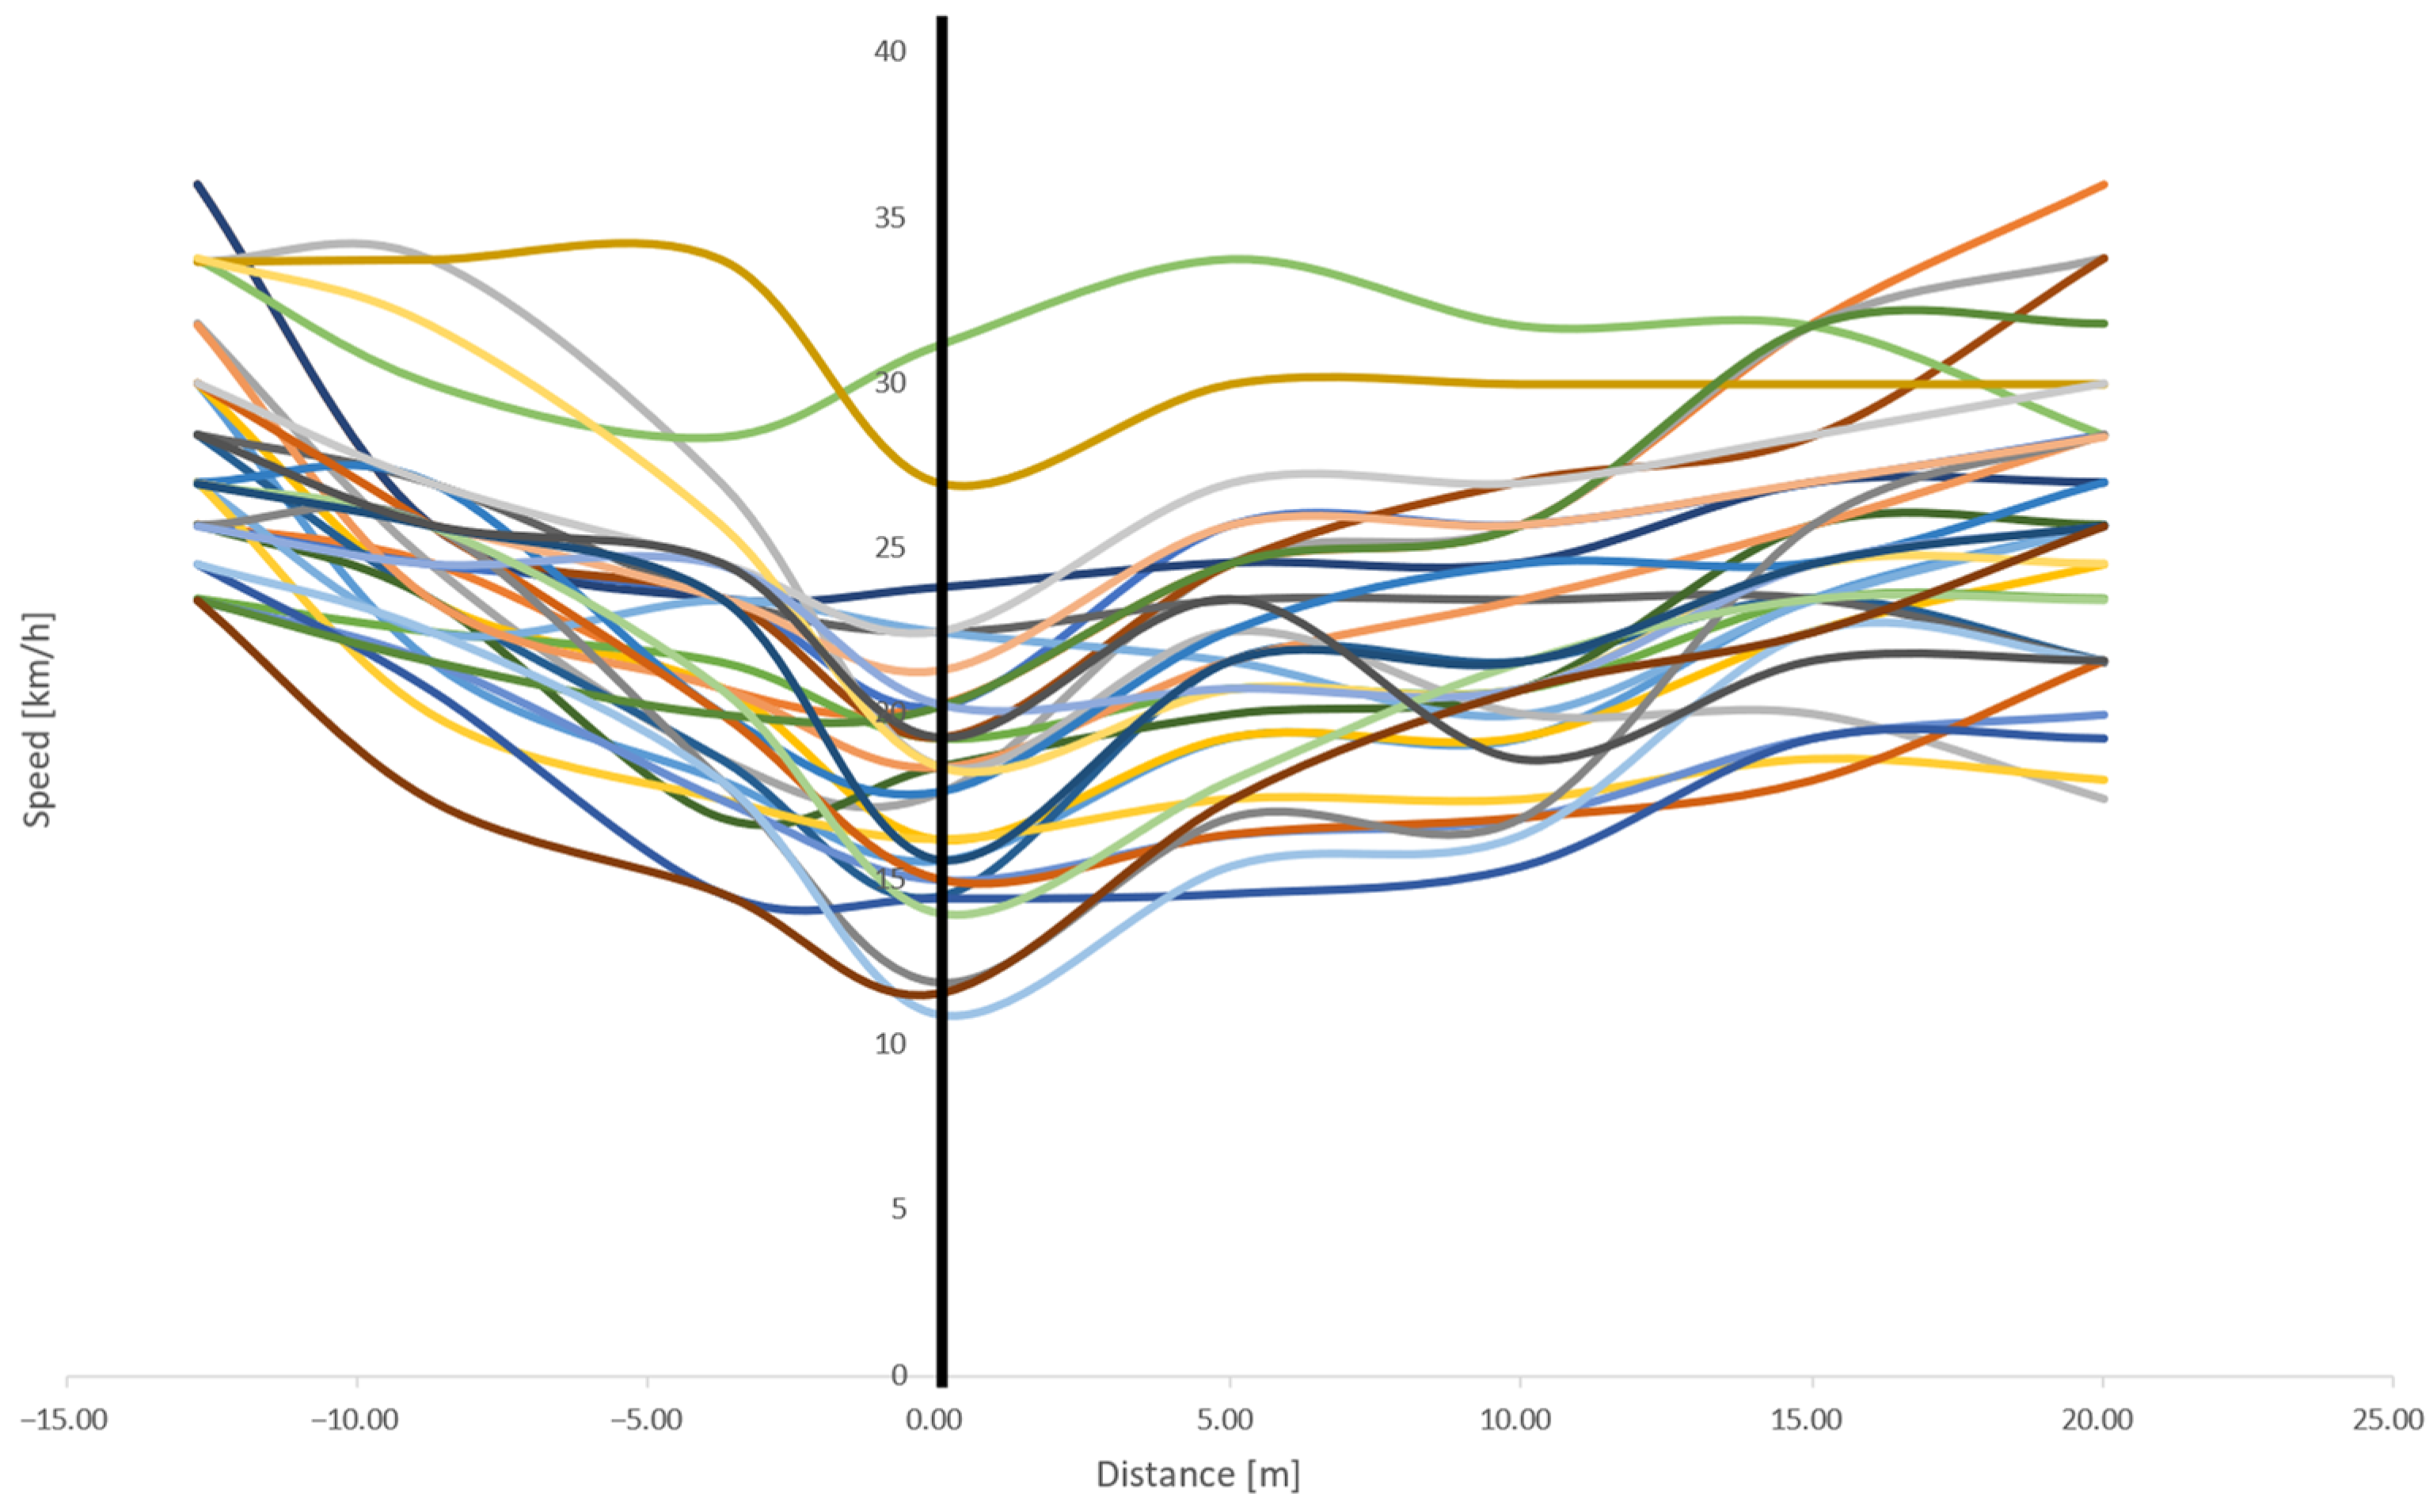
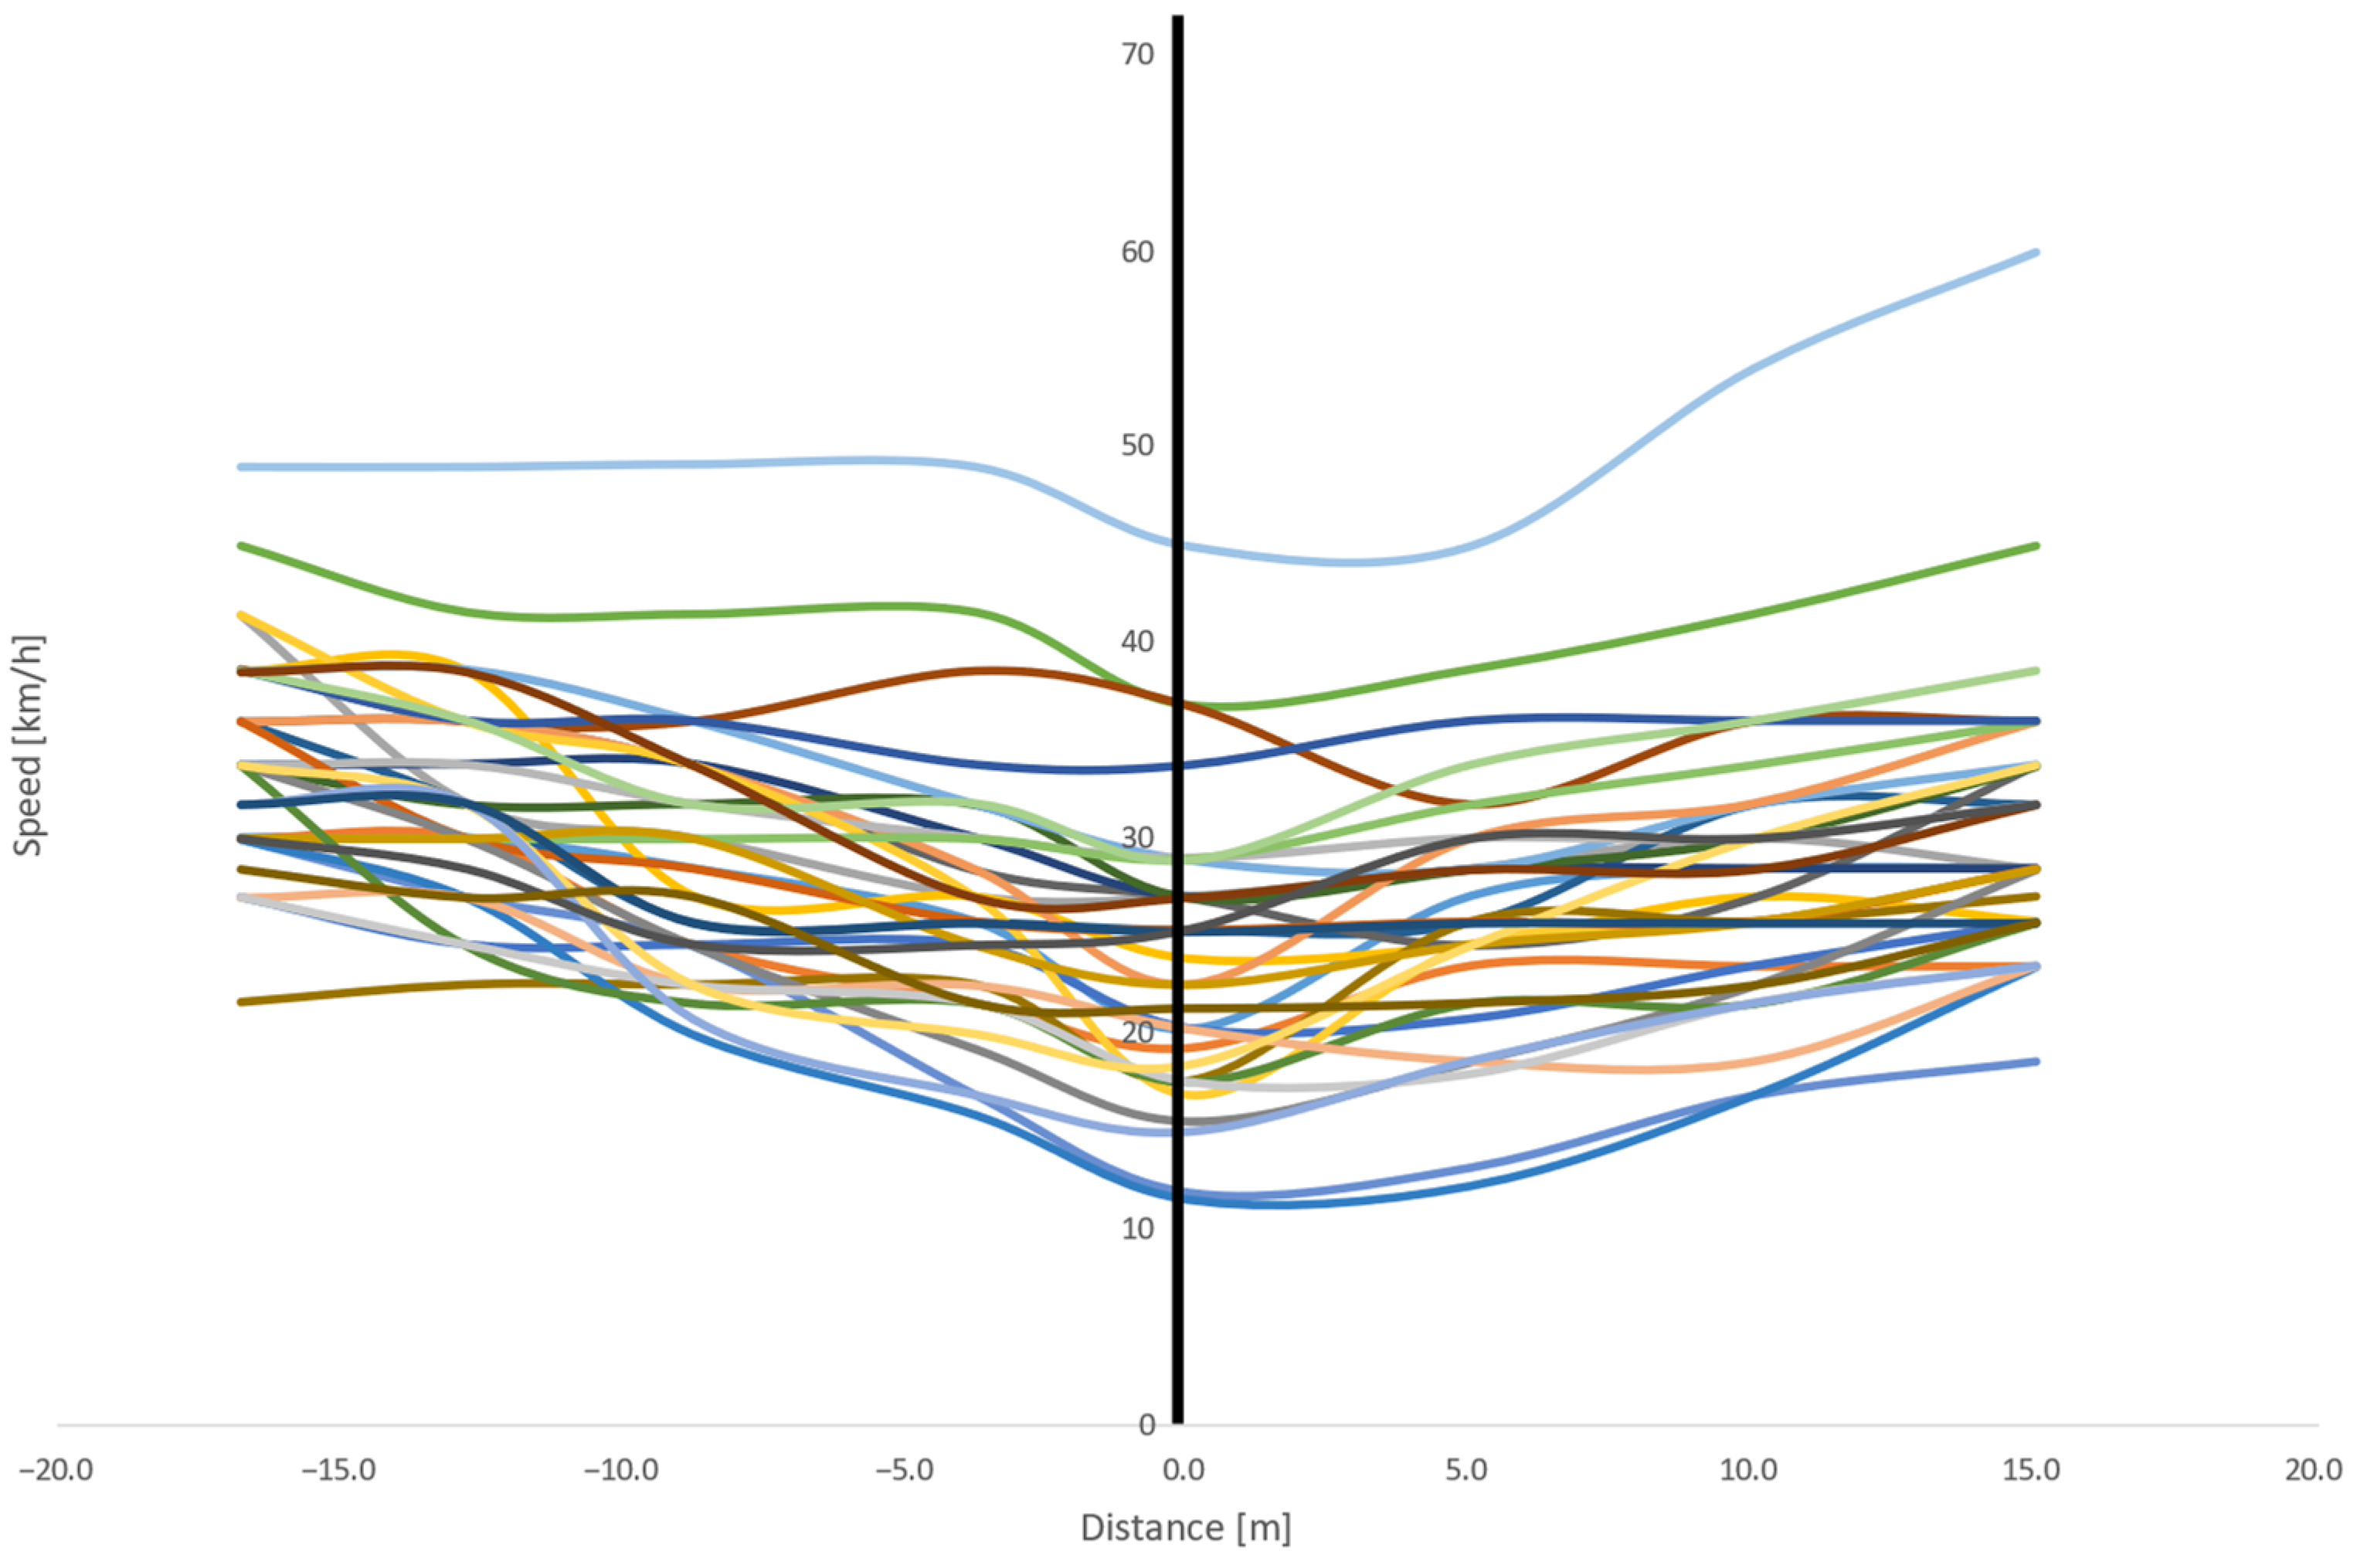
As far as significant speed profiles are concerned, only “isolated” vehicles were considered, i.e., only vehicles with headway higher than 15 s with respect to the preceding vehicle or that were not affected in their run by any side or frontal obstacle or pedestrian’s crossing. An overall amount of 252 and 229 speed profiles were collected and evaluated along the “a” and “b” directions, respectively, and speed values were manually derived from acquired videos.
A sample of such vehicle speed profiles derived from video recordings is conveniently depicted as follows (see
Figure 10 and
Figure 11).
4. Discussion
In accordance with what has been seen in the literature in the previous paragraphs, it appeared worth analyzing if and how the trend of the speed on the RPC varies according to different types of vehicles.
In order to highlight the significant difference between crossing speeds of different vehicle categories, a statistical ANOVA test has been carried out with the aim of determining whether groups differ from the others or not, i.e., whether the null hypothesis (H1) of the same speed crossing value should be rejected (if the likelihood of the observed data under the null hypotheses is low) or not. In other words, ANOVA makes it possible to estimate the probability of obtaining a difference between the values of the two averages at least as large as that observed in the sample when the null hypothesis is true. This probability is called the p-value.
If the p-value is low (p-value < alpha), it can be concluded that the observed difference between the averages of the groups is statistically significant, whereas when this probability is high, it can be concluded that the observed difference between the averages of the groups is not statistically significant. This situation occurs when the p-value is large (p-value > alpha).
It is essential to remember that as input data, the spot speeds recorded when they are traveling on the monitored RPC are used (dependent value) to assess how the average of them was different in order to reject or confirm the theoretical hypothesis that the different types of vehicles (independent value) produce different accelerations and vibrations at the passage of the bump and consequently also different crossing speeds.
The following
Table 2 reports the values of the
p-value (and also other relevant statistics) between the different vehicles.
As can be observed from the results reported in the aforementioned tables, the results of the tests do not clearly show the difference between the crossing speeds when traveling on the RPC between the various types of examined vehicles. In detail, along the “a” direction, the null hypothesis seems to hold, whereas in the opposite direction (“b”), it is more questionable.
This may be due to a limitation given by a preliminary, nonexhaustive data collection that should, in a second phase, be extended to confirm and/or refute the results thus obtained.
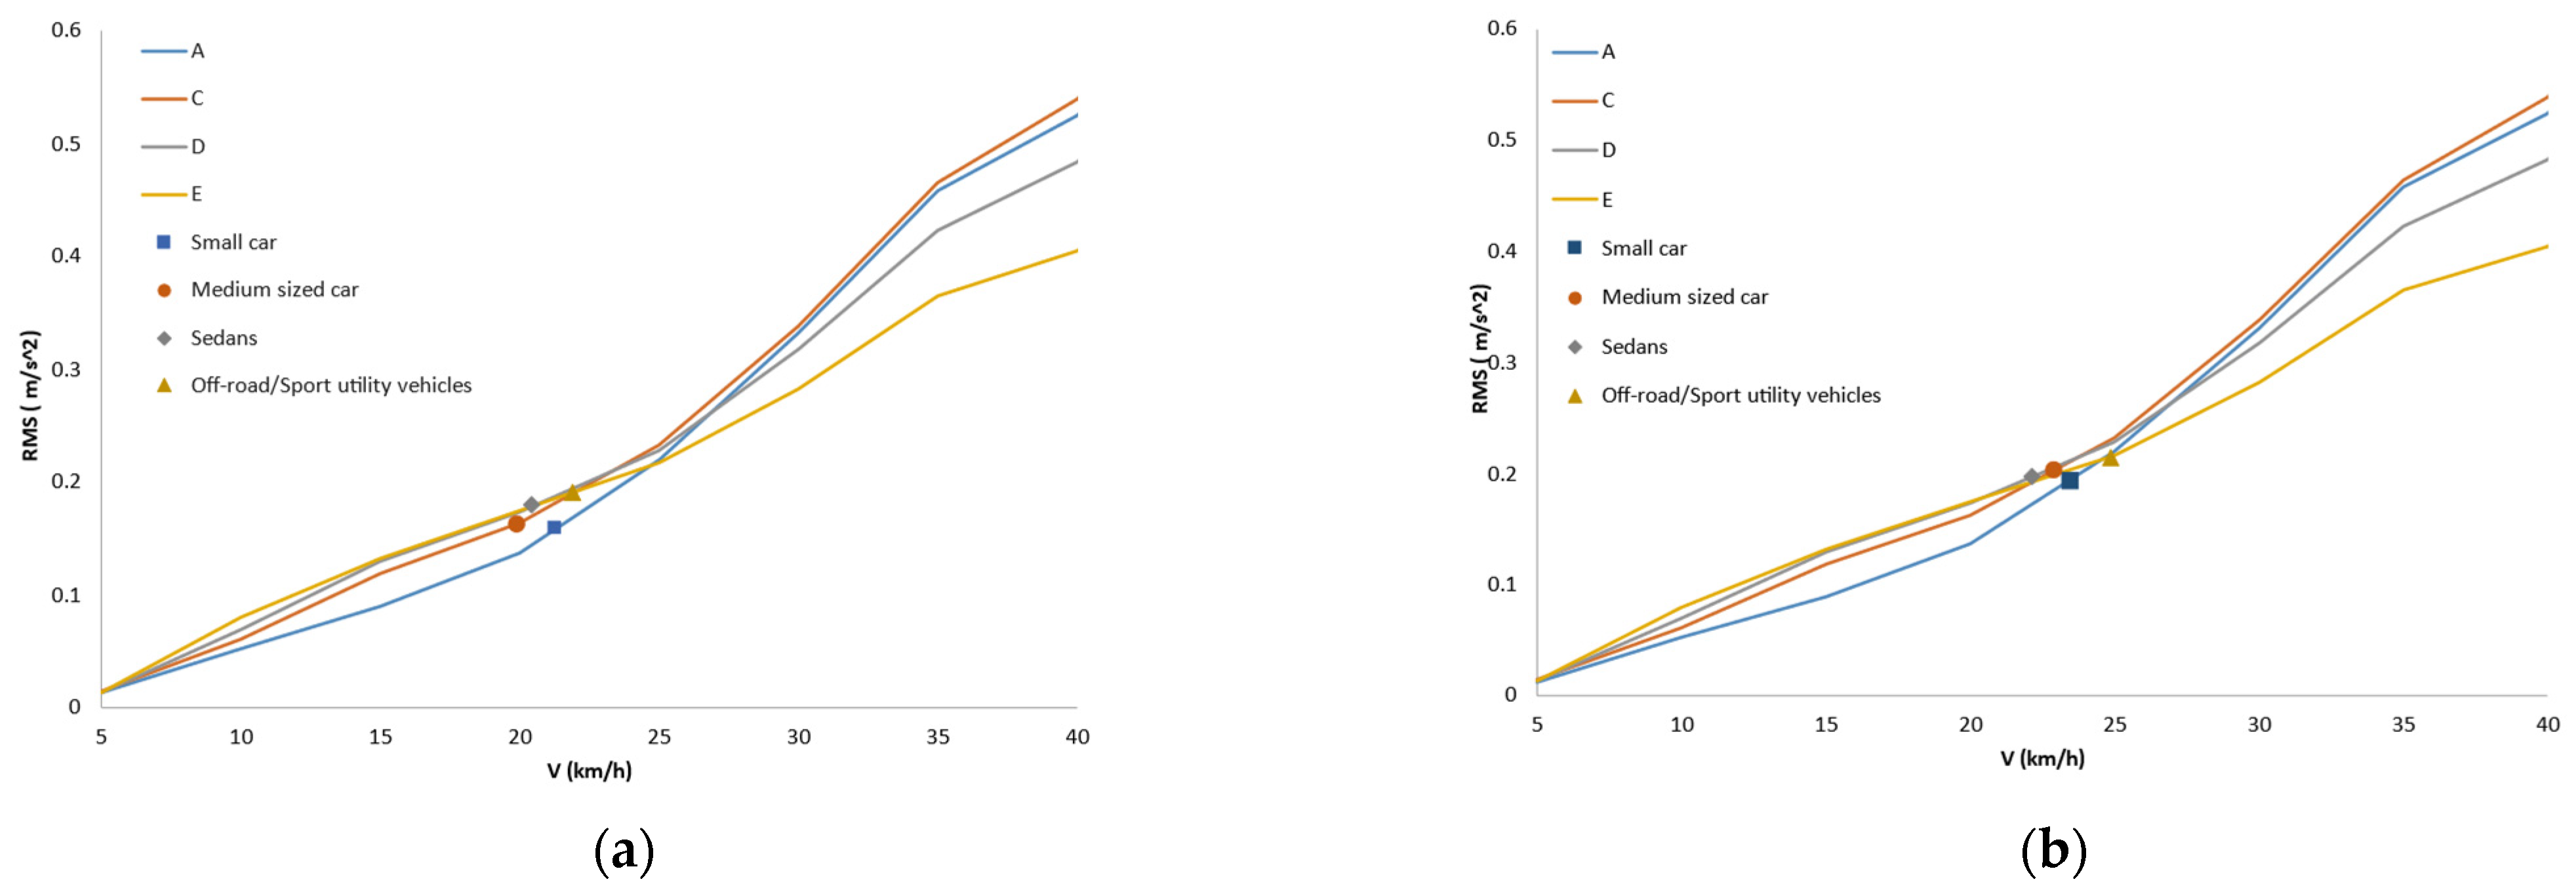
However, having obtained the average spot speed value on the examined RPC, it was possible to estimate the corresponding RMS parameter (see
Figure 12a,b) by making use of the RMS–Speed relationship derived for the most similar road hump type among those aforementioned examined (see
Figure 6).
The weighted RMS standard deviation for both directions has therefore been evaluated and reported in the following table (
Table 5):
From the values obtained from the standard deviation, it can be highlighted that although the dispersion of the estimated weighted RMS based on the average measured crossing vehicle speed is rather small, the weighted RMS may not be the optimal parameter to estimate the relationship between vibration levels sensed by vehicle occupants and actuated driver speed when traveling on the RPC. Nevertheless, it is worth noting that the lowest standard deviation is obtained along the direction (direction “b”), according to which previous statistical tests provided some evidence towards the rejection of the null hypothesis (similar crossing speeds).
However, the evaluation of perceived discomfort remains a very complex problem since several literature studies have shown that a very important factor in characterizing the effects of vibrations on the human body is their frequency. With the same amplitude of accelerations, the human body behaves differently since there is a different perception threshold depending on the frequency itself. This highlighted that stopping to evaluate only the acceleration as a function of time was reductive; for this reason, the acceleration was represented as a function of the frequencies, subsequently identifying a single parameter (the acceleration expressed in terms of weighted RMS).
Numerical simulations obtained taking into account different vehicle categories and different vertical traffic calming devices highlighted a range of vehicle speeds yielding a similar acceleration level. As a matter of fact, it is worth mentioning that in the literature, there are few works that evaluate the speeds according to the category of vehicle that crosses them, but according to this limited evidence, the crossing speeds on bumps seem to remain unchanged regardless of the type of vehicle [
35,
37].
According to these preliminary results, the null hypothesis of similar crossing speeds cannot be rejected or accepted, and therefore more data will need to be collected in the future from the same site and from different sites to validate or refute the developed theoretical approach. In addition, new vibration descriptors such as the vibration dose value, in which vibration level is also correlated with the duration of exposure as reported in the ISO 2631 standard [
67,
68,
69], are worth investigating.
5. Conclusions
Nowadays, with the increasing attention paid to social and environmental sustainability, there is a great demand both to reduce vehicles’ speeds and to achieve an acceptable level of safety in urban areas. With this aim in mind, vertical traffic calming devices seem to meet these two requirements. Great efforts are made by researchers all over the world to study the main interactions, which is why, in this paper, as an initial step to frame the topic, an in-depth analysis of the current scientific literature review is conducted. A side analysis of the literature review is also conducted on mathematical models that are able to better describe the phenomenon; based on these scientific evidences, a four-degree-of-freedom model (also known as the “Half Car Model”), considering the right compromise between simplicity in implementation and accuracy of outputs, is implemented. With this model, the weighted root mean square acceleration (RMS), associated with each vehicle category/traffic calming devices/crossing speed, is evaluated, since the aim of this paper is to understand the behavior of drivers in close proximity to traffic calming devices.
Attention was paid to vertical traffic calming devices (raised pedestrian crossings and speed tables) that exploit vertical acceleration; this causes discomfort in the driver, who tends to moderate the speed below a certain threshold to reduce the vibrational disturbance. A numerical relationship was then identified between vehicle crossing speed and vertical acceleration by using a four-degree-of-freedom lumped mass vehicle model to evaluate the dynamic interaction between the vehicle itself and the vertical traffic calming device.
The final goal was to define acceleration thresholds (that can be expressed in the time or frequency domain) beyond which the driver feels discomfort. Therefore, a complex numerical model able to simulate the vibration level sensed by vehicle occupants when traveling on a specific vertical traffic calming device was developed and calibrated.
In the following step, a deep dive into a real-life case study, in particular a raised pedestrian crossing (RPC), is presented in this paper. This vertical traffic calming device allows for reducing crash risks and speed and increasing pedestrian safety levels in crossing sections in urban contexts, and for this reason it is essential to study drivers’ behavior.
As shown from the limited literature on this specific topic, at speeds within the 22–25 km/h range, the induced accelerations seem not to vary with the type of vehicle and type of vertical traffic calming device [
35,
37]. To gain experimental evidence for such behavior, a real vertical traffic calming device (a raised pedestrian crossing) has been monitored, and vehicle speed profiles have been collected. Statistical ANOVA tests have been performed in order to highlight the differences in crossing spot speeds according to different vehicle categories, but preliminary results seem somehow contradictory, highlighting differences between the crossing speeds on the RPC only along one direction.
It is believed that this is due to the limited amount of experimental data collected so far. It is therefore planned to expand the experimental campaign in order to increase data collection at the aforementioned site and to extend the investigation to other vertical traffic calming devices other than the ones monitored.
In addition, it can be argued that weighted RMS may not be the most suitable vibration descriptor to capture the drivers’ behavior in terms of vibrational nuisance. As a matter of fact, another candidate descriptor could be the vibration dose value, in which the vibration level is also correlated with the duration of exposure as reported in the ISO 2631 standard [
67,
68,
69].
However, it has to be underlined that the developed theoretical approach, partially corroborated by experimental data, appears to be promising in developing and refining a true human vibration exposure threshold to be used for the design of new vertical traffic calming devices other than those currently proposed by national standards.
Based on the different dynamic responses due to different vehicle categories, it will also be possible to estimate, in advance and in a more precise and reliable way, the crossing vehicle speed distribution according to a specific vehicle fleet characterizing the site of intervention.
Author Contributions
Conceptualization, M.D., A.E. and D.S.; methodology, M.D., A.E. and D.S.; software, D.S., S.N. and G.C.; validation, D.S., S.N. and G.C.; formal analysis, D.S., S.N. and G.C.; investigation, D.S., S.N. and G.C.; resources, M.D. and V.N.; data curation, S.N. and G.C.; writing—original draft preparation, S.N. and G.C.; writing—review and editing, S.N. and G.C.; visualization, D.S., S.N. and G.C.; supervision, M.D. and V.N.; project administration, M.D.; funding acquisition, M.D. All authors have read and agreed to the published version of the manuscript.
Funding
This study was carried out within the MOST—Sustainable Mobility Center and received funding from the European Union Next-GenerationEU (PIANO NAZIONALE DI RIPRESA E RESILIENZA (PNRR)—MISSIONE 4 COMPONENTE 2, INVESTIMENTO 1.4—D.D. 1033 17/06/2022, CN00000023). The research leading to these results has also received funding from Project “Ecosistema dell’innovazione Rome Technopole” financed by the EU in the NextGenerationEU plan through MUR Decree n. 1051 23.06.2022—CUP H33C22000420001. This manuscript reflects only the authors’ views and opinions; neither the European Union nor the European Commission can be considered responsible for them.
Data Availability Statement
The data used in this study appear in the submitted article.
Acknowledgments
The help of Eng. Franco Renzullo and Eng. Gianluca Pilla in collecting and analyzing vehicle speed data is gratefully acknowledged.
Conflicts of Interest
The authors declare no conflict of interest. The funders had no role in the design of the study; in the collection, analysis, or interpretation of data; in the writing of the manuscript; or in the decision to publish the results.
References
- Waltz, F.; Hoefliger, M.; Fehlmann, W. Speed Limit Reduction from 60 to 50 km/h and Pedestrian Injuries. In Proceedings of the Twenty-Seventh Step Car Crash Conference; International Research Council on Biokinetics of Impacts (IRCOBI), Warrendale, PA, USA, 17–19 October 1983. [Google Scholar]
- Van Houten, R.; Van Huten, F. The Effects of a Specific Prompting Sign on Speed Reduction. Accid. Anal. Prev. 1987, 19, 115–117. [Google Scholar] [CrossRef] [PubMed]
- Johansson, C.; Rosader, P.; Leden, L. Distance between speed humps and pedestrian crossing does it matter. Accid. Anal. Prev. 2011, 43, 1846–1851. [Google Scholar] [CrossRef] [PubMed]
- García, A.; Torres, A.; Romero, M.; Moreno, A. Traffic Microsimulation Study to Evaluate the Effect of Type and Spacing of Traffic Calming Devices on Capacity. Procedia-Soc. Behav. Sci. 2011, 16, 270–281. [Google Scholar] [CrossRef]
- Yannis, G.; Kondyli, A.; Georgopoulou, X. Investigation of the impact of low cost traffic engineering measures on road safety in urban area. Int. J. Inj. Control Saf. Promot. 2014, 21, 181–189. [Google Scholar] [CrossRef]
- Jasiūnienė, V.; Pociūtė, G.; Vaitkus, A.; Ratkevičiūtė, K.; Pakalnis, A. Analysis and evaluation of trapezoidal speed humps and their impact on the driver. Balt. J. Road Bridge Eng. 2018, 13, 104–109. [Google Scholar] [CrossRef]
- County Surveyors’ Society. Village Speed Control Working Group; Final Report; Department for Transport: London, UK, 1994.
- County Surveyors’ Society. Traffic Calming in Practice; Landor Publishing: London, UK, 1994. [Google Scholar]
- Abate, D.; Dell-Acqua, G.; Lamberti, R.; Coraggio, G. Use of Traffic Calming Devices Along Major Roads thru Small Communities in Italy. In Proceedings of the 88th Annual Meeting of the Transportation Research Board TRB, Washington, DC, USA, 11–15 January 2009. [Google Scholar]
- Antić, B.; Pešić, D.; Vujanić, M.; Lipovac, K. The Influence of Speed Bumps Heights to the Decrease of the Vehicle Speed–Belgrade Experience. Saf. Sci. 2013, 57, 303–312. [Google Scholar] [CrossRef]
- Arnold, E.; Lantz, K. Evaluation of Best Practices in Traffic Operations and Safety: Phase I: Flashing LED Stop Sign and Optical Speed Bars; Final Report; Virginia Transportation Research Council: Charlottesville, VA, USA, 2007. [Google Scholar]
- Pau, M. Speed bumps may induce improper drivers’ behavior: Case study in Italy. J. Transp. Eng. 2002, 128, 472–478. [Google Scholar] [CrossRef]
- Wayne, D.C.; Naree, K.; Peter, T.; Martin, J.; Perrin, J. Effectiveness of traffic management in Salt Lake City, Utah. J. Safety Res. 2006, 37, 27–41. [Google Scholar]
- Herrstedt, L.; Kjemtrup, K.; Borges, P.; Andersen, P. An Improved Traffic Environment—A Catalogue of Ideas; Report 106; Road Data Laboratory, Road Standards Division, Road Directorate, Denmark Ministry of Transport: Roskilde, Denmark, 1993. [Google Scholar]
- Chen, L.; Chen, C.; Ewing, R.; McKnight, E.; Srinivasan, R.; Roe, M. Safety Countermeasures and Crash Reduction in New York City—Experience and Lesson Learned. Accid. Anal. Prev. 2013, 50, 312–322. [Google Scholar] [CrossRef]
- Forbes, G. Traffic Management in Rural Settlements; Final Report; Centre for the Assessment of Road Safety: Burlington, ON, Canada, 2006.
- van der Horst, A.R.A.; Thierry, M.C.; Vet, J.M.; Rahman, A.F. An evaluation of speed management measures in Bangladesh based upon alternative accident recording, speed measurements, and DOCTOR traffic conflict observations. Transp. Res. Part F Traffic Psychol. Behav. 2017, 46, 390–403. [Google Scholar] [CrossRef]
- Rahman, F.; Kojima, A.; Kubota, H. Investigation on North American Traffic Calming Devices Selection Practices. IATSS Res. 2009, 33, 105–119. [Google Scholar] [CrossRef]
- Kirkpatrick, S. Tentative Guidelines on the Provision of Speed Breakers for Control of Vehicular Speeds on Minor City; The Indian Roads Congress: New Delhi, India, 1996. [Google Scholar]
- Klyne, M. The effect of edge lining on vehicle speeds through roundabouts and mid-block blisters. Proc. Inst. Civ. Eng.-Munic. Eng. 1998, 127, 170–173. [Google Scholar] [CrossRef]
- Marek, J. Mid-block speed control: Chicanes and speed humps. ITE J. 1998, 68, 16. [Google Scholar]
- Parkhill, M.; Sooklall, R.; Bahar, G. Updated Guidelines for the Design and Application of Speed Humps; Annual Meeting and Exhibit: Pittsburgh, PA, USA, 2007. [Google Scholar]
- Traffic Engineering South Carolina Department of Transportation. Traffic Calming Guidelines…Reducing the Speed and Volume of Traffic to Acceptable Levels; Traffic Engineering South Carolina Department of Transportation: Columbia, SC, USA, 2006. [Google Scholar]
- Webster, D.; Layfield, R. Traffic Calming-Sinusoidal H and S Humps; TRL Report 377; Transport Research Laboratory: Wokingham, UK, 1998. [Google Scholar]
- Chadda, H.S.; Asce, M.; Cross, E. Speed (road) bumps: Issue and opinions. J. Transp. Eng. 1985, 111, 410–418. [Google Scholar] [CrossRef]
- Russell, E.; Godavarthy, R. Mitigating Crashes at High-Risk Rural Intersections with Two-Way Stop Control; Report No. K-TRAN: KSU-06-4; Bureau of Materials and Research, Kansas Department of Transportation: Topeka, KS, USA, 2010. [Google Scholar]
- Gifford, R. Road Humps Should Be Dug Up: The Case against Parliamentary Advisory Council for Transport Safety; Parliamentary Advisory Council on Transport Safety: London, UK, 2004. [Google Scholar]
- Moreno, A.; Garcia, A.; Romero, M. Speed table evaluation and speed modelling for low-volume crosstown roads. Transp. Res. Rec. 2011, 2203, 85–93. [Google Scholar] [CrossRef]
- Shauna, H.; Keith, K.; Gary, T.; Smith, D. Temporary Speed Hump Impact Evaluation; Final Report; Center For Transportation Research and Education: Ames, IA, USA, 2002. [Google Scholar]
- Smith, D.J.; Knapp, K.; Hallmark, S. Speed impacts of temporary speed humps in small Iowa cities. In Proceedings of the ITE 2002 Annual Meeting and Exhibit, Philadelphia, PA, USA, 4–7 August 2002. [Google Scholar]
- Basil, D. The Impacts of Neighbourhood Traffic Management. Ph.D. Thesis, University of Canterbury, Canterbury, UK, 2012. Available online: http://eprints.uthm.edu.my/2536/ (accessed on 26 July 2023).
- Gunwoo, L.; Shinhye, J.; Cheol, O.; Keechoo, C. An evaluation framework for traffic claming measures in residential areas. Transp. Res. Part D Transp. Environ. 2013, 25, 68–76. [Google Scholar]
- Heloisa, M.; Barbosa, M.R. A model of speed profiles for traffic calmed roads. Transp. Res. Part A Policy Pract. 2000, 34, 103–123. [Google Scholar]
- Johnson, L.; Nedzesky, A.J. A comparative study of speed humps, speed slots and speed cushions. In Proceedings of the ITE Annual Meeting and Exhibit, Lake Buena Vista, FL, USA, 1–4 August 2004. [Google Scholar]
- Namee, S.; Witchayangkoon, B. Crossroads vertical speed control devices: Suggestion from observation. Int. Trans. J. Eng. Manag. Appl. Sci. Technol. 2011, 2, 161–171. [Google Scholar]
- Sayer, I.; Parry, D. Speed Control Using Chicanes; Project Report 102; Transport Research Laboratory: Crowthorne, UK, 1994. [Google Scholar]
- Aya, K.; Hisashi, K. Effectiveness of speed humps ranged at different intervals considering roadside environment including vehicle speed, noise and vibration. J. East. Asia Soc. Transp. Stud. 2011, 9, 1913–1924. [Google Scholar]
- Brindle, R. Speed-based design of traffic calming schemes. In Proceedings of the 75th ITE Annual Metting and Exhibit, Melbourne, VIC, Australia, 7–10 August 2005. [Google Scholar]
- Distefano, N.; Leonardi, S. Evaluation of the Benefits of Traffic Calming on Vehicle Speed Reduction. Civ. Eng. Arch. 2019, 7, 200–214. [Google Scholar] [CrossRef]
- Siti, S.; Hamsa, A.K. A study on the effects of road humps in reducing speed along local roads in residential areas. Plan. Malays. 2016, XIV, 55–66. [Google Scholar]
- Al-Nassr, E.K. Dynamic consideration of speed control humps. Transp. Res. Part B Methodol. 1982, 16, 291–302. [Google Scholar]
- Bahram, H.; Masoud, S.; Mansour, N. Multiobjective shape optimization of speed humps. Struct. Multidiscip. Optim. 2007, 37, 203–214. [Google Scholar] [CrossRef]
- Hessling, J.; Zhu, P. Analysis of vehicle rotation during passage over speed control road humps. In Proceedings of the International Conference on Intelligent Computation Technology and Automation, Changsha, China, 20–22 October 2008. [Google Scholar]
- Khorshid, E.; Alfares, M. Model refinement and experimental evaluation for optimal design of speed humps. Int. J. Veh. Syst. Model. Test. 2007, 2, 80–99. [Google Scholar] [CrossRef]
- D’Apuzzo, M. Some remarks on the prediction of road traffic induced ground-borne vibrations. In Proceedings of the 4th International SIIV Congress, Palermo, Italy, 12–14 September 2007. [Google Scholar]
- Mhanna, M.; Sadek, M.; Shahrour, I. Prediction and mitigation of traffic induced ground vibrations in an urban zone. WIT Trans. 2011, 116, 701–711. [Google Scholar]
- Toplak, S.; Sever, D.; Ivanič, A.; Mohorić, M.; Lubej, S. Effect of traffic calming measures on ground-borne vibrations in residential areas—The Slovenian experiences. In Proceedings of the 7th AAAA Congress on Sound and Vibration, Ljubljana, Slovenia, 22–23 September 2016. [Google Scholar]
- Krylov, V. Traffic calming and associated ground vibrations. Proc.-Inst. Acoust. 1998, 20, 41–48. [Google Scholar]
- Oke, S.; Salauz, T.; Adeyefaj, O.; Akanbi, O.; Oyawale, F. Mathematical Modelling of the Road Bumps Using Laplace Transformation. Int. J. Sci. Technol. 2007, 2, 129–141. [Google Scholar]
- Fwa, T.F.; Liaw, C.Y. Rational approach for geometric design of speed-control road humps. Transp. Res. Rec. 1992, 1356, 66–72. [Google Scholar]
- Hassen, D.; Miladi, M.; Slim Abbes, M.; Caglar Baslamisli, S.; Chaari, F.; Haddar, M. Road profile estimation using the dynamic responses of the full vehicle model. Appl. Acoust. 2019, 147, 87–99. [Google Scholar] [CrossRef]
- Barbosa, H.M. Impacts of Traffic Calming Measures on Speeds on Urban Roads. Ph.D. Thesis, University of Leeds, Leeds, UK, 1995. [Google Scholar]
- Vlahogianni, E. Some empirical relations between travel speed, traffic volume and traffic composition in urban arterials. Transportation 2006, 31, 110–119. [Google Scholar] [CrossRef]
- Pau, M.; Angius, S. Do speed bumps really decrease traffic speed? An Italian experience. Accid. Anal. Prev. 2001, 33, 585–597. [Google Scholar] [CrossRef]
- Riviera, P.; Bassani, M.; Dalmazzo, D. Field investigation on the effects on operating speed caused by trapezoidal humps. In Proceedings of the 90th TRB Annual Meeting, Washington, DC, USA, 15 November 2010. [Google Scholar]
- Amirarsalan, M.; Ali, A. Optimization of speed hump profiles based on vehicle dynamic performance modelling. J. Transp. Eng. 2014, 140, 04014035. [Google Scholar]
- Moreno, A.T.; García, A. Use of Speed Profile as Surrogate Measure: Effect of Traffic Calming Devices on Crosstown Road Safety Performance. Accid. Anal. Prev. 2013, 61, 23–32. [Google Scholar] [CrossRef]
- Philip, A.; Weber, P. Toward a north American geometric design standard for speed humps. ITE J. 1998, 70, 30–39. [Google Scholar]
- Sahoo, P. Geometric design of speed control humps in Bhubaneswar City. Int. J. Civ. Eng. Technol. 2009, 1, 70–73. [Google Scholar] [CrossRef]
- Babak, M.; Zohn, R.; Muennig, P. The impact of urban speed reduction programmes on health system cost and utilities. Inj. Prev. 2018, 24, 262–266. [Google Scholar]
- Loprencipe, G.; Moretti, L.; Pantuso, A.; Banfi, E. Raised Pedestrian Crossings: Analysis of Their Characteristics on a Road Network and Geometric Sizing Proposal. Appl. Sci. 2019, 9, 2844. [Google Scholar] [CrossRef]
- Kruszyna, M.; Matczuk-Pisarek, M. The Effectiveness of Selected Devices to Reduce the Speed of Vehicles on Pedestrian Crossings. Sustainability 2021, 13, 9678. [Google Scholar] [CrossRef]
- Orsini, F.; Batista, M.; Friedrich, B.; Gastaldi, M.; Rossi, R. Before-after safety analysis of a shared space implementation. Case Stud. Transp. Policy 2023, 13, 101021. [Google Scholar] [CrossRef]
- Newland, D.E. An Introduction to Random Vibrations, Spectral & Wavelet Analysis, 3rd ed.; Dover Civil and Mechanical Engineering, Dover Publications Inc.: Mineola, NY, USA, 2005; pp. 1–477. [Google Scholar]
- Wong, J.Y. Theory of Ground Vehicles; John Wiley & Sons, Inc.: Hoboken, NJ, USA, 2022; pp. 1–560. [Google Scholar] [CrossRef]
- Cebon, D. Handbook of Vehicle-Road Interaction; Taylor & Francis, Ed.; CRC Press: Boca Raton, FL, USA, 2000; pp. 1–616. ISBN 9026515545. [Google Scholar]
- ISO 2631-1:1985; Evaluation of Human Exposure to Whole-Body Vibration—Part 1. International Organization for Standardization: Geneva, Switzerland, 1985.
- ISO 2631-3:1985; Evaluation of Human Exposure to Whole-Body Vibration—Part 3. International Organization for Standardization: Geneva, Switzerland, 1985.
- ISO 2631-2:1989; Evaluation of Human Exposure to Whole-Body Vibration—Part 2. International Organization for Standardization: Geneva, Switzerland, 1989.
- Dixon, J. Tires, Suspension, and Handling; SAE International: Warrendale, PA, USA, 1996. [Google Scholar]
Figure 1.
Description of the methodology proposed.
Figure 1.
Description of the methodology proposed.
Figure 2.
2 degree-of-freedom (2 dof) vehicle model (quarter car).
Figure 2.
2 degree-of-freedom (2 dof) vehicle model (quarter car).
Figure 3.
4 degree-of-freedom (4 dof) vehicle model (half car).
Figure 3.
4 degree-of-freedom (4 dof) vehicle model (half car).
Figure 4.
5 degree-of-freedom (5 dof) vehicle model (half car plus driver insertion).
Figure 4.
5 degree-of-freedom (5 dof) vehicle model (half car plus driver insertion).
Figure 5.
(a) Acceleration in terms of RMS on several speed humps (1 to 5) as a function of speed for the vehicle category A; (b) for the vehicle category C; (c) for the vehicle category D; and (d) for the vehicle category E.
Figure 5.
(a) Acceleration in terms of RMS on several speed humps (1 to 5) as a function of speed for the vehicle category A; (b) for the vehicle category C; (c) for the vehicle category D; and (d) for the vehicle category E.
Figure 6.
(a) Acceleration in terms of RMS on different classes of vehicles (A to E) caused by the speed hump 1; (b) by the speed hump 2; (c) by the speed hump 3; (d) by the speed hump 4; and (e) by the speed hump 5.
Figure 6.
(a) Acceleration in terms of RMS on different classes of vehicles (A to E) caused by the speed hump 1; (b) by the speed hump 2; (c) by the speed hump 3; (d) by the speed hump 4; and (e) by the speed hump 5.
Figure 7.
Areal view and location of the monitored raised pedestrian crossing (RPC) with the indication of the directions “a” in entrance to the city of Cassino and “b” in exit from the city of Cassino.
Figure 7.
Areal view and location of the monitored raised pedestrian crossing (RPC) with the indication of the directions “a” in entrance to the city of Cassino and “b” in exit from the city of Cassino.
Figure 8.
Closer view of the investigated RPC.
Figure 8.
Closer view of the investigated RPC.
Figure 9.
Postprocessing video editing to derive speed profiles (red lines represents spaced fixed targets in the video frames every 5 m).
Figure 9.
Postprocessing video editing to derive speed profiles (red lines represents spaced fixed targets in the video frames every 5 m).
Figure 10.
Speed profiles, represented in several colors in the graph, of a typical working daytime slot in the forward direction “a”. Zero distance identifies the RPC location.
Figure 10.
Speed profiles, represented in several colors in the graph, of a typical working daytime slot in the forward direction “a”. Zero distance identifies the RPC location.
Figure 11.
Speed profiles, represented in several colors in the graph, of a typical working daytime slot in the forward direction “b”. Zero distance identifies the RPC location.
Figure 11.
Speed profiles, represented in several colors in the graph, of a typical working daytime slot in the forward direction “b”. Zero distance identifies the RPC location.
Figure 12.
(a) Acceleration level in terms of weighted RMS as a function of average crossing speed (trapezoidal speed hump 5) measured for the specific vehicle category along the “a” direction; (b) Acceleration level in terms of weighted RMS as a function of average crossing speed (trapezoidal speed hump 5) measured for the specific vehicle category along the “b” direction.
Table 1.
Main characteristics of the vehicles considered in this analysis.
Table 1.
Main characteristics of the vehicles considered in this analysis.
| Vehicle | A | C | D | E |
|---|
| Elastic stiffness of the front suspension (N/m) | 12,400 | 12,800 | 12,950 | 13,400 |
| Elastic stiffness of the rear suspension (N/m) | 10,600 | 13,800 | 14,720 | 17,000 |
| Linear coefficient of kinematic viscosity of the front suspension (N/m) | 1550 | 1600 | 1618 | 1675 |
| Linear coefficient of kinematic viscosity of the rear suspension (N/m) | 1325 | 1725 | 1840 | 2125 |
| Suspended mass (kg) | 893 | 963 | 1220 | 1700 |
| Front unsprung mass (kg) | 80 | 92 | 105 | 115 |
| Rear unsprung mass (kg) | 72 | 120 | 110 | 130 |
| Elastic stiffness of the front tire (N/m) | 165,000 | 170,000 | 180,000 | 200,000 |
| Elastic stiffness of the rear tire (N/m) | 150,000 | 150,000 | 170,000 | 200,000 |
| Moment of inertia | 1018.76 | 1284 | 2313.21 | 3264 |
| Wheel base length (m) | 2.35 | 2.47 | 2.69 | 2.85 |
| Total length (m) | 3.70 | 4.0 | 4.77 | 4.80 |
| Tire imprint length (m) | 0.12 | 0.14 | 0.16 | 0.2 |
| Length of the distance between the center of gravity of the car and the driver (m) | 1 | 1.2 | 1.3 | 1.6 |
Table 2.
ANOVA of the main statistics for directions “a” and “b”, respectively.
Table 2.
ANOVA of the main statistics for directions “a” and “b”, respectively.
| | F | p | Fcrit |
|---|
| Direction “a” | 0.671 | 0.570 | 2.641 |
| Direction “b” | 1.785 | 0.151 | 2.645 |
Table 3.
Estimated weighted RMS values of direction “a” based on vehicle average speed.
Table 3.
Estimated weighted RMS values of direction “a” based on vehicle average speed.
| Type of Vehicles | Small Car | Medium-Sized Car | Sedans | Off-Road/Sport Utility Vehicles |
|---|
| RMS [m/s2] | 0.159 | 0.161 | 0.179 | 0.190 |
| V [km/h] | 21.27 | 19.93 | 20.43 | 21.89 |
Table 4.
Estimated weighted RMS values of direction “b” based on vehicle average speed.
Table 4.
Estimated weighted RMS values of direction “b” based on vehicle average speed.
| Type of Vehicles | Small Car | Medium-Sized Car | Sedans | Off-Road/Sport Utility Vehicles |
|---|
| RMS [m/s2] | 0.193 | 0.203 | 0.198 | 0.215 |
| V [km/h] | 23.48 | 22.93 | 22.14 | 24.85 |
Table 5.
Standard deviation of RMS in directions “a” and “b”.
Table 5.
Standard deviation of RMS in directions “a” and “b”.
| | Standard Deviation |
|---|
| Direction “a” | 0.0863 |
| Direction “b” | 0.0466 |
| Disclaimer/Publisher’s Note: The statements, opinions and data contained in all publications are solely those of the individual author(s) and contributor(s) and not of MDPI and/or the editor(s). MDPI and/or the editor(s) disclaim responsibility for any injury to people or property resulting from any ideas, methods, instructions or products referred to in the content. |
© 2023 by the authors. Licensee MDPI, Basel, Switzerland. This article is an open access article distributed under the terms and conditions of the Creative Commons Attribution (CC BY) license (https://creativecommons.org/licenses/by/4.0/).

 ,
, 


