Article

Evolution Characteristics and Main Influencing Factors of Carbon Dioxide Emissions in Chinese Cities from 2005 to 2020

1
College of Hydraulic and Architectural Engineering, Tarim University, Alaer 843300, China
2
Institute of Urban and Rural Planning Theories and Technologies, Zhejiang University, Hangzhou 310058, China
3
Guangzhou Urban Planning & Design Survey Research Institute, Guangzhou 511466, China
*
Authors to whom correspondence should be addressed.
These authors contributed equally to this work.
Sustainability 2023, 15(20), 14849; https://doi.org/10.3390/su152014849
Submission received: 14 September 2023 / Revised: 5 October 2023 / Accepted: 12 October 2023 / Published: 13 October 2023
(This article belongs to the Special Issue Carbon Emission Mitigation: Drivers and Barriers)

Abstract

:
Based on the carbon emission database of the China Urban Greenhouse Gas Working Group, this paper analyzed the spatiotemporal evolution characteristics and main influencing factors of urban carbon dioxide emissions in China using ArcGIS spatial analysis and SPSS statistical analysis methods, in order to provide a reference for the formulation of the national “double-carbon” strategy and the construction of low-carbon urbanization. The results showed that (1) the urban carbon dioxide emissions in China exhibit a “point-line-area” spreading spatial grid. Carbon dioxide emissions form a planar emission pattern surrounded by the Beijing–Tianjin–Hebei urban agglomeration, Yangtze River Delta urban agglomeration, and Central Plains urban agglomeration. A high per capita and high-intensity emission belt from Xinjiang to Inner Mongolia has been formed. (2) The proportion of industrial emissions continues to decrease, and the range of high industrial emissions has gradually crossed the “Hu Huan-yong Line”, spreading from eastern China to the whole country. The emissions from transportation, the service industry, and households have become new growth points, and high-value emissions from households have also shown a nationwide spreading trend. (3) The main factors influencing the spatial distribution of carbon dioxide emissions are urbanization, the economy, industry, investment, and household energy consumption.

1. Introduction

Responding to climate change is one of the most important issues globally at present. Recent 50-year studies have shown that greenhouse gases, mainly carbon dioxide, emitted by human activities, are the main causes of global climate change. Global carbon dioxide emissions have increased by 40% from 2000 to 2020. With the continuous development of globalization, urbanization, and industrialization, China’s GDP has soared from 9.9 trillion to 100.9 trillion, an increase of 10.2 times, with an annual growth rate of 13%. The urbanization rate has increased from 36.09% to 63.89%. Rapid urbanization and economic growth have always been accompanied by increased energy consumption. The energy, industry, transport, construction, agriculture, and land-use sectors consume the most energy, resulting in high greenhouse gas emissions [1]. Around 2007, China became the world’s largest carbon dioxide emitter, with carbon dioxide emissions in 2020 reaching 9.894 billion tons, which is 23% of global emissions [2]. In response to the global mission of low-carbon sustainable development, the Chinese government put forward the dual-carbon development goal of “reaching carbon peak by 2030 and carbon neutrality by 2060” in the government report of 2021 [3]. At the seventy-fifth session of the United Nations General Assembly, China clearly promised to achieve carbon neutrality in total carbon dioxide emissions by 2060. To achieve the dual-carbon goal, it will be necessary to master the spatial distribution characteristics of CO2 emissions in Chinese cities. Based on this, this paper reveals the distribution characteristics of CO2 emissions in Chinese cities, the impact mechanism of urbanization on CO2 emissions, and their regional differences. It will be helpful for cities with different regions and different urbanization levels to formulate differentiated carbon control paths, which will be of great practical significance for China to achieve carbon neutrality by 2060 [4].
In the early stage, due to limitations in carbon dioxide emissions data, the main idea behind the spatial exploration of carbon dioxide emissions from macro- to meso–micro-scale conversion was to decompose and indirectly calculate the total carbon emissions from top to bottom [5]. As early as 1983, Rotty measured the distribution of carbon dioxide emissions in the geopolitical context and determined a simple spatial distribution of carbon emissions in different countries [6]. Marland used UN fuel-use data to indirectly calculate the spatial distribution of carbon dioxide in various regions according to the population density of states and provinces in Canada and the United States [7]. As the main factor related to carbon dioxide emissions, the population density distribution can be used to calculate their spatial distribution, which has explanatory power. However, there is a gap in the total energy consumption caused by differences in people’s consumption capacity and consumption habits. For this reason, it is not convincing to calculate the distribution of carbon dioxide based on the population density distribution [8]. These two scholars undertook pioneering research on the spatial quantification of carbon dioxide emissions and carbon dioxide measurement, which provided a new perspective for subsequent researchers.
In addition to the research field of carbon dioxide measurement, carbon emission research has also considered the fields of industry, influencing factors, and emission reduction countermeasures [9,10]. The research on carbon emissions by industry has mainly focused on industry, agriculture, transportation, and household consumption. Industry consumes the most energy, and its carbon emissions are 2.5 to 5 times that of the agriculture and service industries [11]. Agriculture produces carbon emissions in the production process, but most of the carbon is absorbed and reused by crops in the growth process. Therefore, carbon emissions and carbon absorption in agriculture have become a focus of research [12]. The transport sector is also being highlighted, mainly because of the rapid growth in energy consumption and carbon emissions occurring in this area [13]. The overall energy consumption growth rate of China’s transportation industry is higher than that of society as a whole, and it is also one of the industries with the fastest growth rate of energy consumption. Compared with developed countries, the low carbon level of China’s transportation industry has much room for improvement [14]. Finally, the energy consumption of residents in developed countries also accounts for a large proportion of total emissions and can be considered a new growth point [15]. For example, Australia is home to only 0.3 per cent of the world’s population yet emits 1.5 per cent of the world’s greenhouse gases [16]. U.S. household consumption accounts for 41% of CO2 emissions [17]. Based on the rapid change in CO2 emissions in the above industries, scholars have found that economic growth, population increase, industrial structure optimization, energy structure and efficiency, international trade, and foreign investment have a profound impact on the rapid growth of total carbon emissions [18,19]. For different regions, different industries, and different factors, scholars have also put forward corresponding carbon emission reduction measures, mainly via the low-carbon development of the legal system, the development of clean energy, low-carbon development technology, and low-carbon development policies and financial support, to reduce carbon emissions [20,21].
Due to limitations in the availability of spatial data on CO2 emissions, research on the spatiotemporal characteristics of CO2 emissions in China has mostly taken provinces, cities, counties, and other administrative divisions as the research objects [22,23]. From the provincial perspective, scholars have mainly revealed the total amount and temporal evolution characteristics of CO2 emissions at the provincial level in China [24]. They have also explored the impact of land use, agricultural production, and other production activities on carbon emissions [25]. Some scholars have also studied the spatial distribution characteristics of provincial carbon dioxide emissions from the perspective of fossil energy consumption [26]. On the other hand, there have been few studies taking the national city region as the basic unit. Some scholars have used EDGAR data to analyze the spatiotemporal dynamic characteristics and differences in carbon emissions in Guangdong province [27]. Some scholars have also revealed the spatial distribution characteristics of carbon emissions in 14 prefecture-level cities in Hunan Province from the perspective of the energy consumption of industrial enterprises above a designated size [28]. The spatiotemporal dynamic patterns of total CO2 emissions and per capita carbon emissions in Hunan Province were discussed [29]. At the county level, the distribution characteristics of CO2 emissions in each county in China were estimated from the perspectives of night lighting data and energy consumption, and a comparative study was carried out at the provincial, municipal, and county levels [30]. However, the carbon emission calculation model was still obtained based on provincial carbon emission data experiments, and the calculation accuracy needs to be further improved [31]. There are many research results on the carbon emission characteristics of single provincial-, municipal-, and county-level cities. This research has mainly focused on the Yangtze River Delta, Beijing–Tianjin–Hebei, and the central regions, etc., and has analyzed the regional carbon emission characteristics, formulating corresponding carbon reduction and control strategies in consideration of the specific geographical location and development level of each city [32,33].
To sum up, the basic units for the study of urban CO2 emissions in China are provinces, cities, and counties [34]. Most national studies have focused on the provincial level, and few studies have considered the spatiotemporal dynamic characteristics of carbon dioxide emissions at the city level [35]. As one of the main carbon dioxide emitters in China, the research on the carbon emission characteristics of municipal cities is of great significance to the formulation of a carbon control strategy in China [36,37]. In addition, most studies have independently discussed the influencing factors of carbon dioxide emissions from the perspectives of population, economy, industry, and energy, and there are fewer research results on the comprehensive analysis of influencing factors of carbon dioxide emissions from the perspective of urbanization [38,39]. China has carried out the 200-year urbanization process of Western countries in just a few decades, and urbanization construction has become an important incentive for carbon dioxide emissions [40,41]. This paper has revealed the characteristics and pattern of carbon dioxide emissions at the city scale and clarified the impact of urbanization on carbon emissions at the municipal level. It will provide a basis for carbon reduction decision-making for the new urban development strategy under the guidance of the “dual-carbon” strategic goal. Based on this, this paper firstly combined the carbon emission database of the China City Greenhouse Gas Working Group (CCG), before using ArcGIS 10.2 spatial analysis to explore the spatial evolution characteristics of CO2 emissions in Chinese cities. Secondly, the SPSS regression analysis method and geo-detector method were used to measure the impact of urban development and construction on total CO2 emissions in China. This study aimed to provide a reference for carbon dioxide reduction and carbon control in Chinese cities.
This study has significant implications for carbon dioxide control. Firstly, we analyzed the spatial dynamic evolution characteristics of China’s CO2 emissions. This paper summarizes the variation law of carbon dioxide emissions in large countries and provides a reference for other developing countries to respond to the problem of excessive carbon dioxide emissions. Secondly, considering the actual situation of carbon dioxide emissions in China, this paper analyzed the main influencing factors of carbon dioxide emissions. We found that changes in urban built-up areas, population, economy, industry, and other factors are closely related to carbon dioxide emissions. China will be able to formulate policies and strategies adapted to local conditions, according to carbon dioxide emission trends and the main influencing factors, to alleviate the problem of excessive carbon dioxide emissions.

2. Methods and Materials

2.1. Research Methods

  • Measurement indicators of the carbon dioxide emission level
The measurement index of the carbon dioxide emission level includes total emissions, per capita emissions, and emission intensity [42,43]. The total carbon dioxide emissions value is the total carbon dioxide emissions of the city in a certain period of time [44]. Per capita emissions are a city’s total carbon dioxide emissions divided by its population [45]. Emission intensity refers to the amount of CO2 emissions generated per unit of total GDP [46]. Carbon intensity is also often used to reflect the low carbon production efficiency of a region; the lower the CO2 emissions per unit of total GDP in a city, the higher the energy efficiency of the city.
2.
Kernel Density
The kernel density was used to calculate the density of CO2 emissions in the surrounding cities of each grid cell [47,48]. Urban carbon dioxide emissions point element data were used to calculate the national urban carbon dioxide emissions density distribution. The results were then plotted as a continuous kernel density surface to quantitatively express the spatial distribution characteristics of the total CO2 emissions in Chinese cities. The higher the nuclear density of the total carbon dioxide emissions, the higher the degree of agglomeration, and vice versa. The nuclear density [48] was calculated as:
λ ^ r P = n = 1 m 3 π r 4 1 P P n 2 m 2 2
where P is the point where the density is measured. λ ^ r P is the density around the calculation point. P is the center of the circle, r as the radius. P n is the position of the nth emission point falling within the circular range.
3.
Standard Deviation Ellipse
The standard deviation ellipse is often used to analyze the spatial distribution direction of a set of data [49]. In order to describe the changing track of carbon dioxide emissions, this study calculates the ellipse azimuth, center of gravity, area, and major and minor axes of carbon dioxide emissions in Chinese cities, and analyzes the evolution trend, dispersion, and direction trend of carbon dioxide emissions through ellipse data changes [50]. The azimuth angle of the ellipse can be used to analyze the change in the direction of carbon dioxide emissions. The center of the ellipse represents the center of carbon dioxide emissions. The area of the ellipse can represent the concentration of carbon dioxide emissions. The minor and major axes of the ellipse can represent the direction of the increase and decrease in carbon dioxide emissions. The formulas [50,51,52] are as follows:
X = i = 1 m w i × x i i = 1 m w i , Y = i = 1 m w i × y i i = 1 m y i
In the formula, the coordinates of element i are x i and y i , the weight of element i is w i , the center of gravity coordinates of the normalized ellipse are X and Y, and the total number of elements is m.
S D E x = i = 1 m x i x ~ m , S D E y = i = 1 m y i y ~ m
S = x S D E x 2 + y S D E y 2
In the formula, x ~ is the arithmetic mean centers of x i ; y ~ is the arithmetic mean centers of y n . The major axis of the normalized ellipse is S D E x . The minor axis of the normalized ellipse is S D E y . S is the area of the standard deviation ellipse.
tan θ = i = 1 m x k ~ 2 i = 1 m y k ~ 2 + i = 1 m x k ~ 2 i = 1 m y k ~ 2 2 + 4 i = 1 m x k ~ y k ~ 2 2 i = 1 m x k ~ , y k ~ ,
σ x = 2 i = 1 m x k ~ cos θ y k ~ sin θ 2 m ,   σ y = 2 i = 1 m x k ~ sin θ + y k ~ cos θ 2 m
In the formula, the azimuth of the ellipse is θ; x k ~ is the difference between x i and y i ; the difference between x ~ and y ~ is y k ~ . The standard deviation of the x-axis is σ x ; the standard deviation of the y-axis is σ y .
4.
Multiple Linear Regression Model
To further explore the internal factors affecting the distribution of urban carbon dioxide emissions in China, we selected relevant explanatory variables from the aspects of urban population, economy, industry, energy, investment, and built-up area [16,18,20,21,30,32]. Correlation analysis and multiple linear regression analysis were used in the SPSS19.0 software. Potential factors that could influence the change in urban carbon dioxide emissions were screened out from the statistical yearbook of urban construction in China. A multiple linear regression model (Table 1) was constructed for the spatial distribution of CO2 emissions in China, and the relevant influencing variables, such as the urban built-up area, population distribution, industrial layout, economic level, energy consumption, and investment level, were added. Then, we tested the fitness and robustness of the model after controlling the related factors and used a multiple linear regression model to discuss the evolution path and influence degree of the dynamic evolution distribution of CO2 emissions. This will provide a basis for carbon dioxide reduction and low-carbon development policy formulation in different regions. This study referred to the sensitivity analysis by P Yapıcıoğlu and other scholars to validate the developed model [51], and constructed a multiple linear regression model expression:
Y q = α q + k = 1 m β q k X q k
where Y q is the carbon dioxide emissions of q cities. The constant term is α. β is the coefficient of each influencing variable. X is the chosen explanatory variable [52].

2.2. Data Collection

The main data included urban carbon dioxide emissions and urban development and construction data. CO2 emission data for Chinese cities were downloaded from the website of China City Greenhouse Gas Working Group (CCG) (http://www.cityghg.com/), accessed on 1 May 2023 [53]. The China City Greenhouse Gas Working Group (CCG) is a research and cooperation platform on urban greenhouse gases which was initiated and organized by the Climate Change and Environmental Policy Research Center of the Environmental Planning Institute of the Ministry of Ecology and Environment, established in June 2017. The China Urban Greenhouse Gas Working Group is committed to building a long time series, full-caliber, and full-coverage greenhouse gas emission dataset for Chinese cities [54]. Developing an accurate inventory of carbon dioxide emissions to provide an accurate dataset will support realizing the “double-carbon” strategy. CCG members will collect, collate, and analyze data on the level of urban CO2 emission activities at the enterprise, industry, sector, and city levels, and combine them with China’s high spatial resolution emissions grid data (CHRED 3.0) to establish a Chinese urban CO2 emissions dataset. The dataset will mainly cover the total carbon dioxide emissions of Chinese cities in 2005, 2010, 2015, and 2020, as well as the total carbon dioxide emissions of Chinese cities in the fields of industry, service industry, agriculture, urban life, transportation, and energy. To ensure that the research data are adjusted with the adjustment of administrative divisions, this study was based on the adjustment data of urban administrative divisions in the Administrative Division of the People’s Republic of China, and the carbon dioxide emission data of each city were fused and proofread. The data were sorted out according to the urban administrative divisions in 2020, so as to conduct a cross-year comparative study of carbon dioxide emissions among cities. Another type of data collection comes from the 2020 China Urban Statistical Yearbook [55]. They mainly include statistical data on China’s urban industry, population, GDP, built-up area, etc.

3. Spatial Distribution Characteristics of Carbon Dioxide Emissions in Chinese Cities

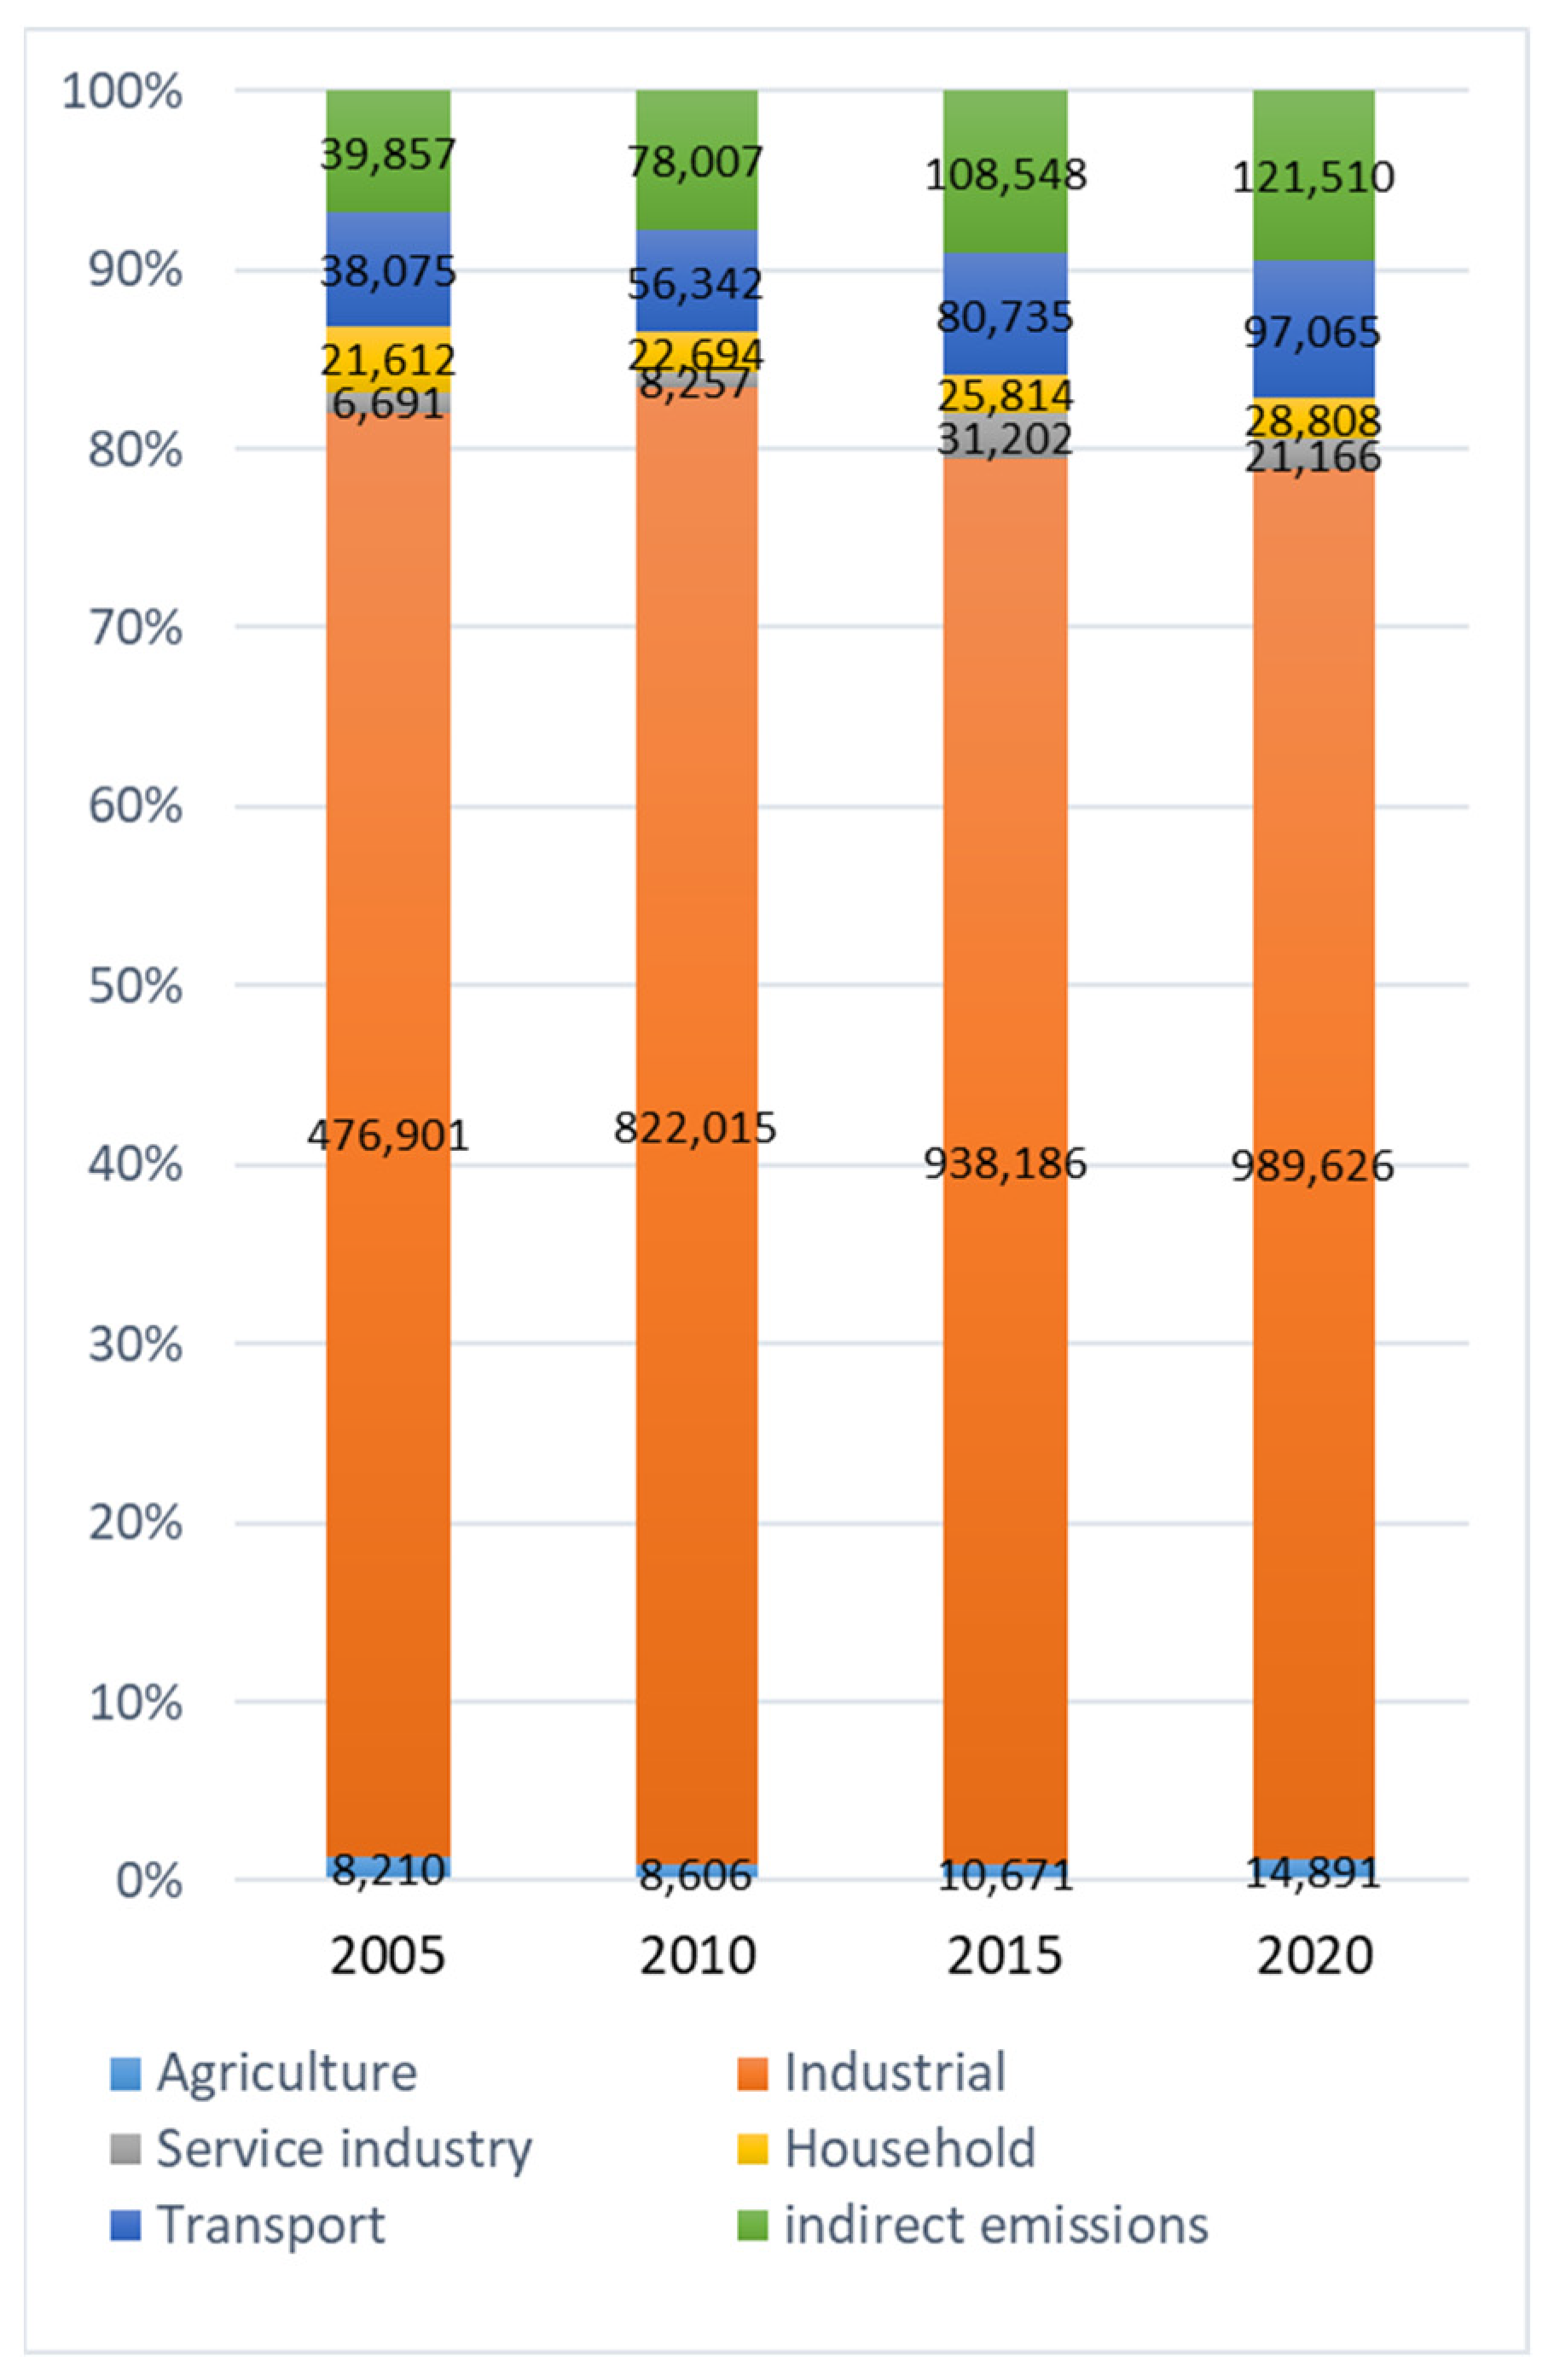
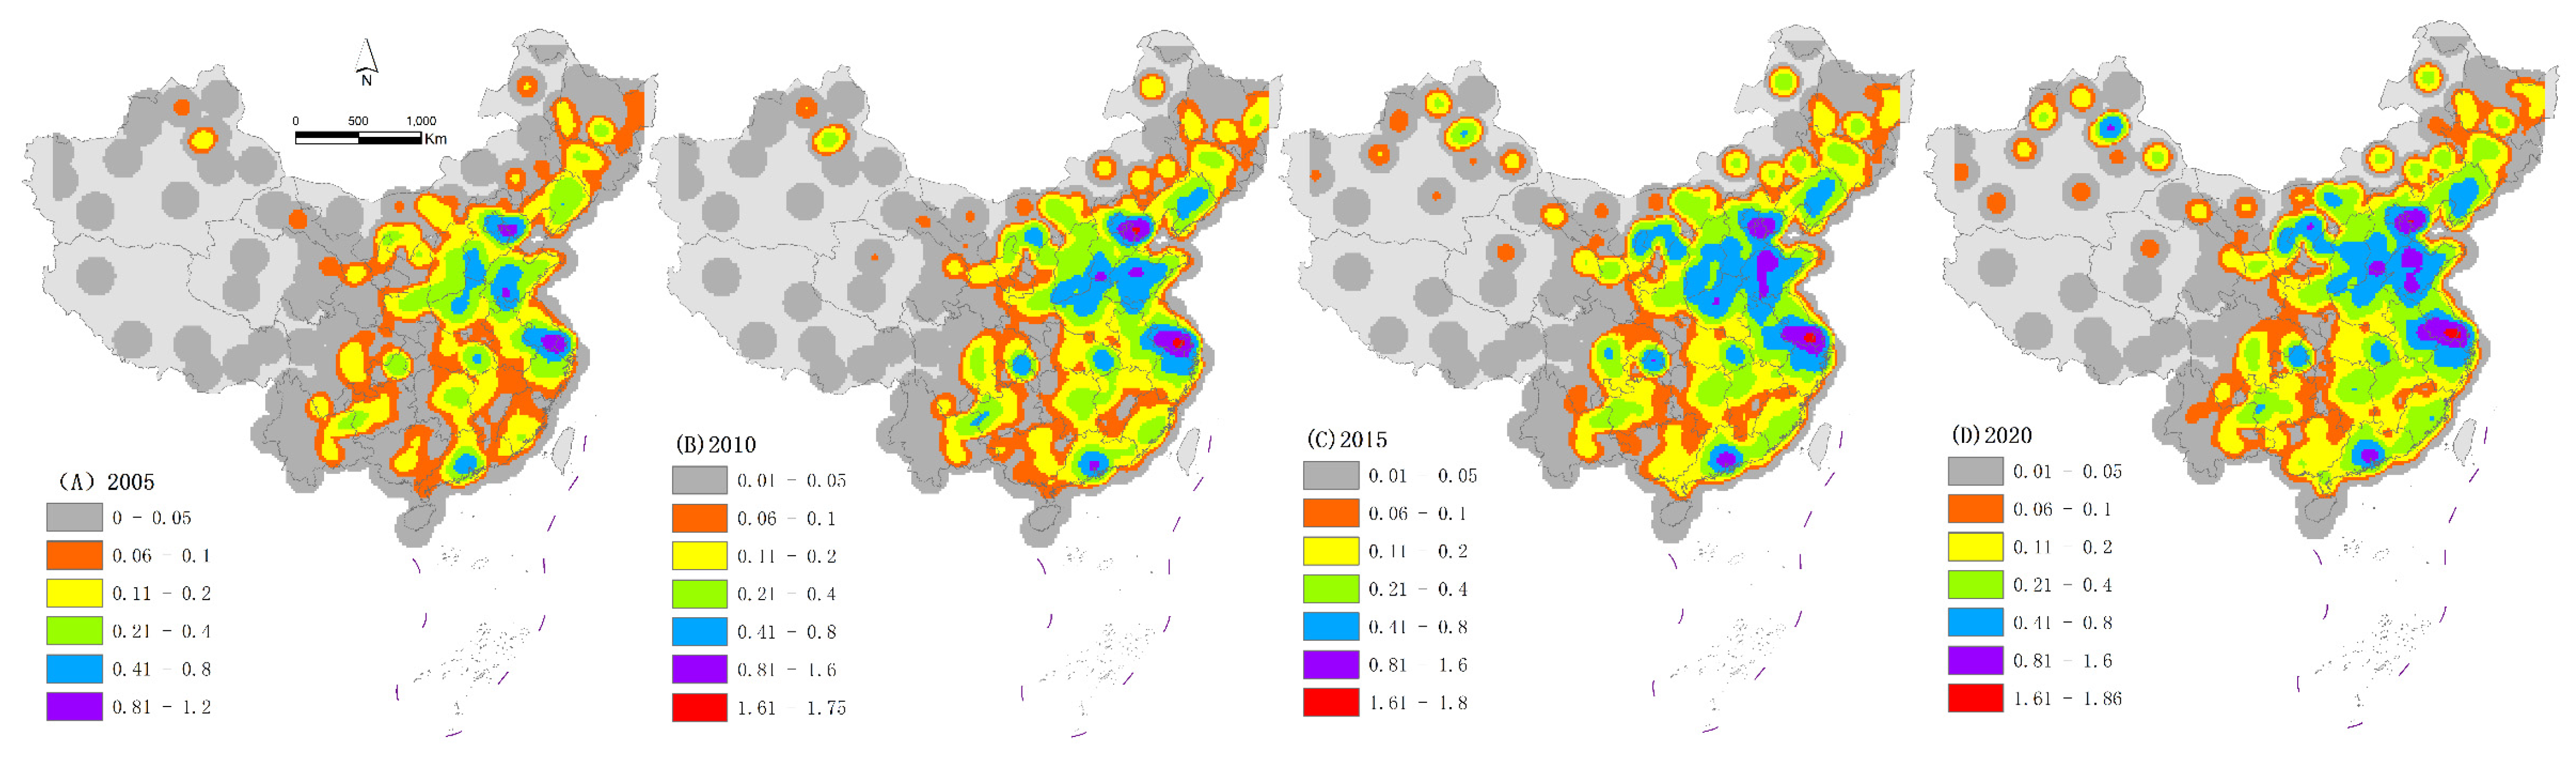
3.1. Spatial Distribution Characteristics of Total Emissions

As the economy is developing rapidly, China’s carbon dioxide emissions are also increasing. In 2005, China’s total carbon dioxide emissions were about 5.913 billion tons, and by 2007, China had become the world’s largest carbon dioxide emitter. Total carbon dioxide emissions in 2020 had doubled to 12.731 billion tons (Figure 1). Carbon dioxide emissions in China are mainly from agriculture, industry, the service industry, residents’ lives, transportation, and indirect emissions. From 2005 to 2020, industry nearly doubled its total emissions. However, its share of annual emissions is shrinking year by year, which shows that China’s energy-saving and emission reduction policies in recent years have achieved positive results. Emissions from the transportation sector increased by 2.5 times over the same period, and its share of total emissions has continued to grow. With the rise in car ownership in China in recent years, the transportation industry may become a new growth point for carbon dioxide emissions in the future. The energy-conservation and emission reduction policies of the transportation industry need to be further strengthened, and low-carbon travel policies also need to be established. Emissions from services also increased by a factor of 3.2 over this time, although the share of total emissions did not increase significantly. With the continuous growth of the national economy, the consumption level of residents is increasing. The service sector has huge room for growth in carbon dioxide emissions and will be an important carbon reduction industry in the coming decades. Finally, indirect emissions have become a major source of new CO2 emissions. To meet carbon reduction targets, more cities are buying electricity from other cities, which leads to the indirect emission of carbon dioxide in those other cities. This off-site carbon emission behavior also requires strengthened control; otherwise, it will increase the carbon emission burden of energy-exporting cities. Compared with other industries, agricultural carbon dioxide emissions growth has been small, within a relatively stable range.
The total carbon dioxide emissions in China’s cities show an increasing trend of “point-line-area”, and the spatial evolution patterns of point agglomeration, linear extension, and plane enclosure. The total emissions show a spatial growth pattern of “high-speed growth of core cities, continuous growth of peripheral cities, and low-speed growth of general cities” (Figure 2). In 2005, high-emission cities were mainly concentrated in provincial capitals. With the passage of time, the core density value of provincial capital city emissions has continued to increase, crossing the new policy boundary and forming a new core density center. The core city gradually leads to an increase in emissions in peripheral cities, and the emissions from peripheral cities also increase with the growth of core cities. Since 2010, the emissions from peripheral cities have continued to grow, gradually connecting the surrounding cities and rapidly expanding to major cities across the country. The spatial evolution pattern of “Beijing-Jinan-Shanghai” and “Jinan-Zhengzhou” has been preliminarily formed. As the process of industrialization and urbanization in the country matures, the core cities ease the industry to the surrounding cities, eliminate the secondary industry, and introduce the tertiary industry. The surrounding cities develop secondary industries, resulting in the rapid growth of carbon dioxide emissions in the surrounding cities. In 2020, a planar emission pattern surrounded by the Beijing–Tianjin–Hebei urban agglomeration, Yangtze River Delta urban agglomeration, and Central Plains urban agglomeration was formed. It also formed a planar pattern headed by the Pearl River Delta urban agglomeration and the Chengdu–Chongqing urban agglomeration.

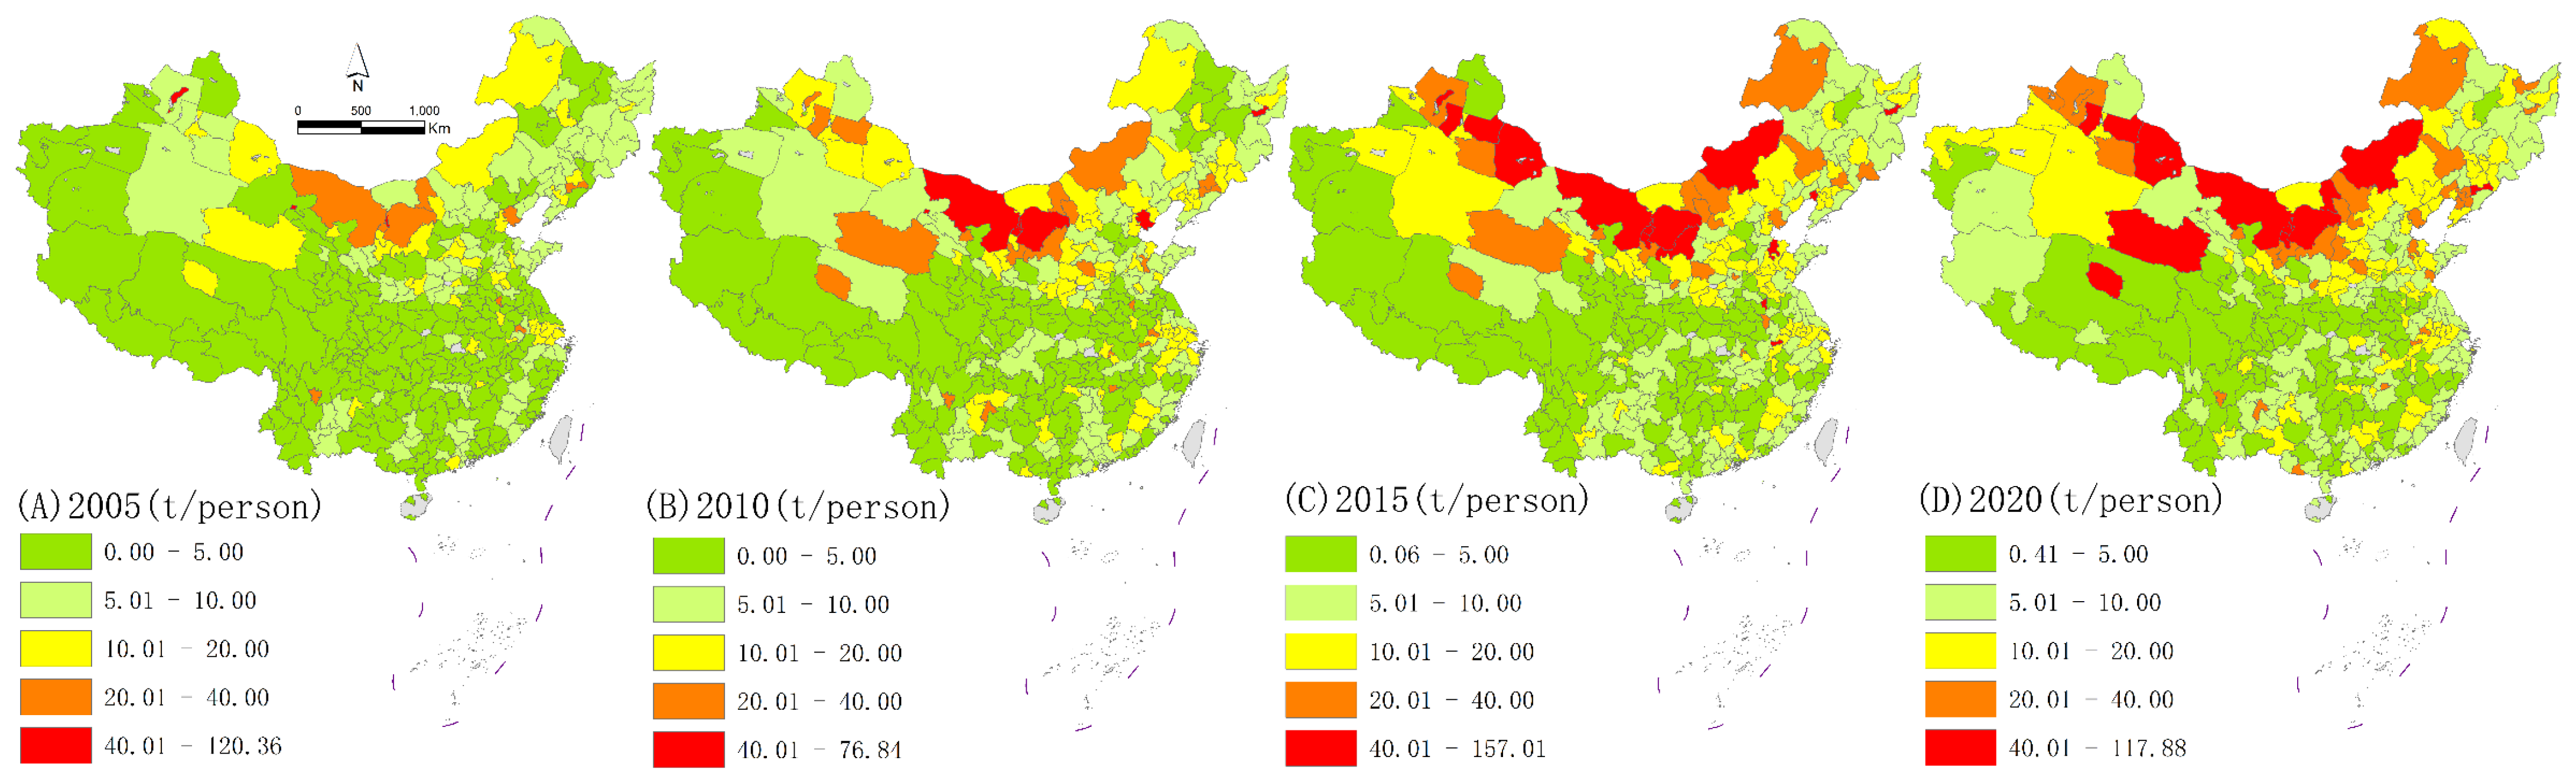
3.2. Spatial Distribution Characteristics of per Capita Emissions

Carbon dioxide is the most important anthropogenic greenhouse gas, and the spatial distribution characteristics of per capita emissions are also important. We selected the ratio of total urban carbon dioxide emissions to the total resident population as a quantitative indicator of per capita emissions (Figure 3). In 2005, the national per capita emissions were 5.3 tons, and in 2020, the national per capita emissions were 9.07 tons, with an obvious overall increase. Per capita emissions have formed a stable high-value cluster along the northern border. Provinces such as Inner Mongolia and Xinjiang have been hardest hit by per capita emissions. The provinces with the most obvious increase in per capita emissions include Xinjiang and Inner Mongolia, and the carbon reduction efforts of Xinjiang, Inner Mongolia, Ningxia, and Qinghai provinces need to be strengthened. The per capita carbon emissions of most cities in the Central Plains and Northeast China have also increased significantly. The central and western regions show low-value agglomeration, and the per capita emission growth there has been relatively slow. However, the per capita emissions have formed an obvious zonal growth trend along the middle and lower reaches of the Yangtze River, and the carbon reduction measures of the cities in the middle and lower reaches of the Yangtze River need to be strengthened.

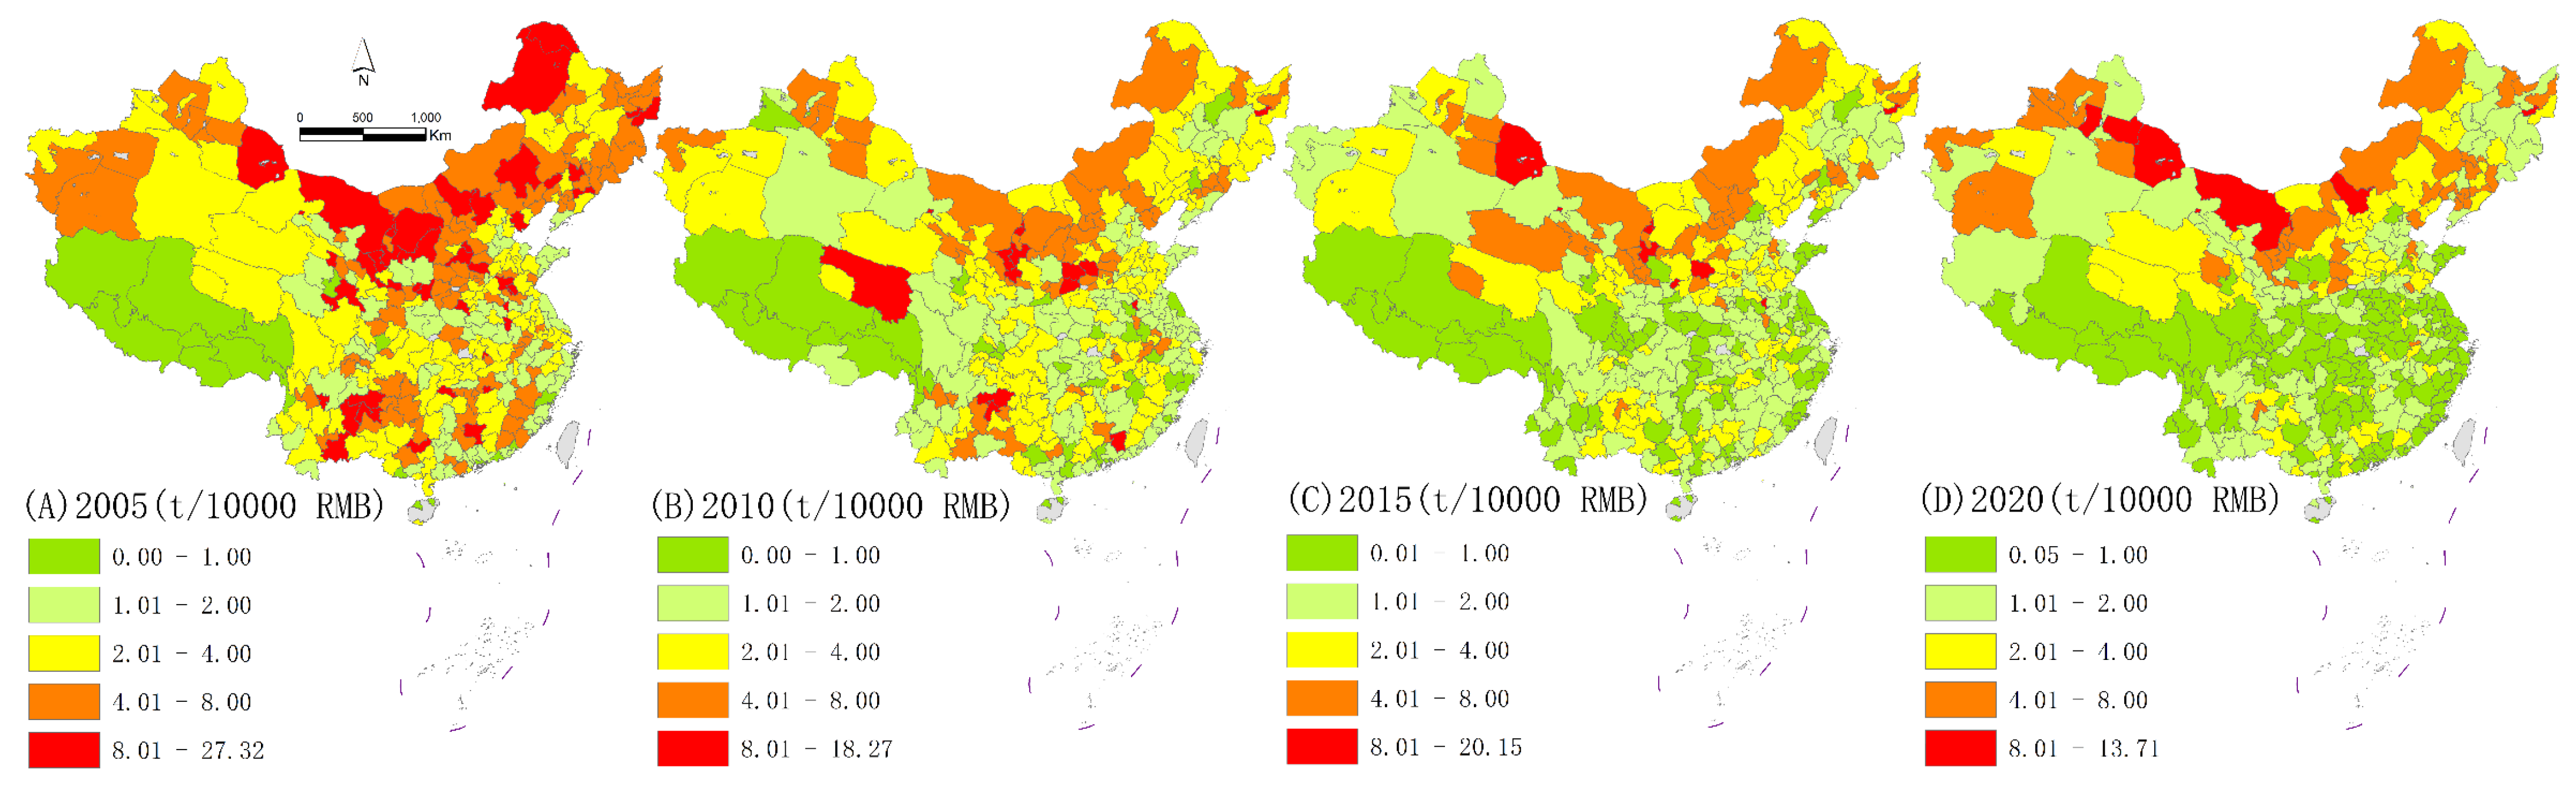
3.3. Spatial Distribution Characteristics of Emission Intensity

Carbon intensity is the amount of CO2 emitted per unit of GDP. In 2005, every 10,000 yuan of GDP generated in the country emitted 3.4 tons of carbon dioxide. In 2010, every 10,000 yuan of GDP generated in the country emitted 2.2 tons of carbon dioxide. In 2015, for every 10,000 yuan of GDP created, the country emitted 1.56 tons of carbon dioxide. The carbon dioxide emission intensity in 2020 was 1.45, which was 57.35% lower than that in 2005. Since 2009, China has developed a carbon intensity reduction plan to reduce CO2 emissions by reducing the number of cars and the size of coal-fired power plants. The overall carbon emission intensity has since decreased significantly. China has also fulfilled its emission reduction target commitment to the Kyoto Protocol, and the carbon dioxide emission per unit of GDP (CO2 intensity) in 2020 was reduced by 40~45% compared with 2005. Most cities in China have formed a low-carbon development model, and the number of cities with a high carbon emission intensity decreased significantly from 2005 to 2020. The number of cities with a carbon intensity above 4 decreased from 143 to 47, distributed in a band along the northern border (Figure 4). This also showed that some cities in Xinjiang and Inner Mongolia have not reduced their carbon dioxide emissions per unit of GDP while developing their economies. The low-carbon development model of cities in these regions needs to be further strengthened.

3.4. Emission Trend Analysis

It is not difficult to find that the changes in CO2 emissions from industry, transportation, and residential life have been the largest. To further explore the impact path and trends of industry, transportation, and residential life for carbon dioxide emissions from 2005 to 2020, we used the standard deviation ellipse tool of GIS 10.2 software to calculate and draw the dynamic track of carbon dioxide emissions, so as to depict the dynamic trend of the spatial difference distribution of CO2 emissions in Chinese cities.
Firstly, the center of gravity of industrial CO2 emissions from 2005 to 2020 moved from Suzhou City, Anhui Province, to the east of Henan Province, and finally, to Zhengzhou City, Hebei Province (Figure 5). The industrial carbon dioxide emission center shows a trend of expanding westward and gradually crossing the “Hu Huan-yong Line”. The intensity of industrial carbon dioxide emissions in central, northern, and northwestern China has been increasing. The changing trend of the ellipse corner shows the trend of northeast–southwest as a whole. Around 2005, industrial carbon dioxide emissions were mainly concentrated in East China. From 2005 to 2010, national strategies such as the development of the western region, and the industrial carbon dioxide emissions of the Chengdu–Chongqing urban agglomeration and the Central Plains urban agglomeration increased significantly, while the elliptical angle clearly moves toward the southwest direction. From 2005 to 2010, the overall industrial carbon dioxide emissions in China increased rapidly, and the growth in the western and northern regions was stronger than that in the eastern and southern regions, resulting in significant growth in the major and minor axes of the ellipse. The axial length of the X-axis increased the most, showing that the industrial carbon dioxide emissions had a significant diffusion phenomenon in the X-axis direction. In addition, the length of the Y-axis has also been increasing slowly, with the main growth direction to the northwest, indicating that the industrial carbon dioxide emissions in the northwest direction have increased significantly, while the growth in the southeast direction has been weaker. In the future, the industrial carbon dioxide emissions from Xinjiang, Qinghai, Ningxia, and Inner Mongolia in the northwest of China will continue to increase. The elliptical coverage of the Central Plains urban agglomeration and the western urban agglomeration also shows a growing trend. These local governments need to strengthen industrial carbon reduction in these areas.
Secondly, the center of gravity of CO2 emissions from transportation showed a trend of moving westward firstly and then southward, and the major axis and minor axis of the ellipse showed a significant contraction trend. With the promotion and application of new energy vehicles in China in recent years, the market share of new energy vehicles in core cities in China has increased significantly. This has led to a large-scale contraction in transportation carbon dioxide emissions. However, the main reason for the reduction in CO2 emissions from transport is that it consumes a lot of electricity. If the electricity comes from clean energy, this is bound to reduce the carbon dioxide emissions from transportation. If the electricity comes from thermal power generation, transportation electricity is equivalent to indirect emissions, and there is also a risk of indirectly increasing carbon dioxide emissions.
Finally, the center of gravity of household carbon dioxide emissions showed a southward shift. With the obvious increase in the national economic income, the consumption level of residents has also continued to grow, along with the popularity of various types of intelligent electrical equipment. The CO2 emissions from households have increased, with the long axis and short axis of the ellipse showing an increasing trend, the Y-axis showing an obvious increasing trend to the south, and the coverage area increasing year by year. In the future, the carbon dioxide generated by households will continue to increase and may become a new growth point of carbon dioxide emissions. Local governments need to formulate corresponding carbon reduction policies for household appliances to prevent excessive growth of household carbon dioxide emissions.

4. Influencing Factors of Carbon Dioxide Emissions

Since 2020, China has had the goal of achieving carbon neutrality by 2060. Achieving the “two-carbon” goal will require analysis of the main factors affecting the spatial distribution of carbon dioxide emissions [56]. Different cities are affected by factors such as the urban population, economy, industry, and construction scale in different ways, leading to different distribution characteristics of carbon dioxide emissions. Many scholars have discussed the logic of the spatial distribution of carbon dioxide emissions based on these factors [57]. Changes in carbon dioxide emissions are generally caused by more than one influencing factor, and there has been little comprehensive analysis of the population, economy, industry, and energy consumption. Based on this, we used the statistical analysis function of SPSS19.0 software and comprehensive statistics of the urban population, economy, industry, and built-up area related to carbon dioxide emissions, and constructed an explanatory model for the uneven distribution of carbon dioxide emissions. Firstly, we used SPSS to analyze the factors that may affect CO2 emissions and select the variables that are significantly related to the distribution of carbon dioxide emissions. Secondly, we adopted the forced entry (enter) model to carry out multiple linear regression analysis on the eligible influencing factors, and gradually eliminated the influencing variables with insignificant correlations and weak collinearity, such as the urban administrative area and urban residents’ consumption level. Finally, we obtained the primary variables with significant correlations and high fitness (Table 2).
The absolute values of the regression model’s T-values were all greater than 1.96, which indicated that the related variables had a significant influence on the regression models. The collinearity VIF values of all the related variables were below 7.5, proving that there was no collinearity between the variables. In addition, the Sig. values of all the variables were also less than 0.05, which again showed that the explanatory variables had a significant impact on the regression model. The Sig. value of the regression model was found to be 0.000a through a variance test, indicating that the regression model had statistical significance. The R2 values of the regression models were all greater than 0.5, which further indicated that the regression model had a high fitting degree, good robustness, and high quality. The histogram of the residuals of the regression model was also normally distributed (Figure 6), again demonstrating the strong statistical significance of the regression model. The results explain the main reasons for the different distribution of carbon dioxide emissions in Chinese cities. The explanatory model is:
Y = −1061.164 + 4.648X1 + 5.923X2 + 0.043X3 − 0.003X4 − 0.002X5 − 2.085X6 + 5.458X7 + 0.109X8,
where X1 represents the area of urban construction land (square kilometers). X2 represents the average annual population of the city. X3 represents the per capita GDP of the city (yuan). X4 represents the number of employed personnel in the secondary industry of the city at the end of the year. X5 represents the number of employed personnel in the tertiary industry of the city at the end of the year. X6 represents the residential sales area of the whole city (10,000 square meters). X7 represents the number of foreign-invested enterprises in the city. X8 represents the number of employment units in the electricity, heat, gas, and water production and supply industries at the end of the year.
The regression model showed that the urban construction area, population size, economic level, foreign investment, residential energy consumption, and urban carbon dioxide emissions were significantly positively correlated. The urban population size had the most significant impact on carbon dioxide emissions. An increase of 10,000 people in a city will lead to an increase of 5.923 tons of carbon dioxide. Appropriate control of the population size in cities will help cities to control carbon dioxide emissions. Urban foreign investment also has a significant impact on carbon dioxide emissions. Adding a foreign-funded enterprise to a city will cause the city’s carbon dioxide emissions to increase by 5.458 tons. Foreign-invested Chinese enterprises are mainly concentrated in areas with high carbon dioxide emissions. Thus, reducing dependence on foreign investment can help to reduce CO2 emissions. Secondly, the urban construction land area also has a significant impact on urban carbon dioxide emissions. An increase of 1 square kilometer in urban construction area leads to an increase of 4.648 tons of carbon dioxide. Appropriate reduction of the urban construction land area and intensive, economical, and efficient use of urban land will also contribute to low-carbon urban development. The urban economy and the scale of urban energy supply also had a positive impact on carbon dioxide emissions. In addition, the employment of urban units in the secondary and tertiary industries at the end of the year was negatively correlated with CO2 emissions. The coefficient of explanatory variables showed that the decrease in urban secondary and tertiary industry employment led to an increase in urban carbon dioxide emissions. Simple optimization and upgrading of industry cannot achieve the goal of carbon reduction. As operations are optimized, it will also increase CO2 emissions as increased operations consume more energy. Simple layoffs and equipment automation are not the best strategies for carbon reduction in the secondary and tertiary industries. Finally, a city’s residential sales area and urban carbon dioxide emissions have a significantly negative correlation. The more residential sales, the lower the city’s CO2 emissions. The residential sales area is also closely related to the urban environment; the fewer urban greenhouse gases, the better the urban living environment, and the greater the residential sales area. The two complement each other.

5. Discussion

5.1. Urban Industry and CO2 Emissions

When a country embarks on industrialization, the leading industries will change from primary industry to secondary industry, which consumes a lot of fossil energy in daily production. In the past 20 years, China has continuously promoted urbanization, which has brought about 20 years of prosperity and development of real estate. The boom in the construction industry has promoted the development of industries such as steel and cement, so the construction industry has exacerbated carbon dioxide emissions both directly and indirectly. This has led to a large increase in carbon dioxide emissions as the secondary industry has become dominant. After national industrialization and the accumulation of social wealth, the center of gravity of the market economy shifts from a secondary industry to a technology-intensive and knowledge-intensive tertiary industry. This mainly includes the financial service industry, electronic information industry, and traditional service industry. These industries all have low energy consumption and low emissions. Moreover, the electronic information industry and financial service industry are high-tech and high-value-added industries, and their carbon dioxide emissions are insignificant compared with traditional heavy industry. When China’s industrial structure completes the change from being energy-intensive heavy-industry-based to service-oriented transformation, and from material production to knowledge production and services, the inflection point of China’s carbon dioxide emission will also be reached.

5.2. Urbanization and CO2 Emissions

The improvement in the urbanization level is often accompanied by a continuous improvement in the industrialization level. Under the superposition of urbanization and industrialization, industrial agglomeration and population agglomeration deepen the dependence on energy, leading to higher emissions of carbon dioxide and more serious industrial pollution. With the migration of the rural population to cities, changes have taken place in the population size of cities, consumption concepts, and lifestyles of people moving from rural areas to cities, leading to higher requirements for material resources, increasing the demand for resources and energy consumption and waste, and producing a large amount of pollution. Urbanization will inevitably promote the rapid development of the construction industry, and this article has discussed the impact of the urban construction area on carbon dioxide emissions. The construction industry contributes to carbon dioxide emissions, both directly and indirectly. The improvement in the urbanization level is the inevitable result of social development. Scholars have begun to pay increasing attention to the impact of urbanization on carbon dioxide emissions, but there is no consensus on whether urbanization promotes or reduces carbon emissions. Therefore, urbanization is one of the key factors in system design.

5.3. Foreign Direct Investment and Carbon Dioxide Emissions

The expansion of foreign direct investment consumes a large amount of energy, such as coal, oil, etc., especially pollution-intensive industries, which directly consume a large amount of energy and contribute to high carbon emissions. In addition, to attract more foreign capital inflow and achieve rapid local economic development, China often relaxes environmental control standards without strict environmental review, accelerating the development and utilization of natural resources. Therefore, high-energy-consumption and high-pollution industries are transferred from capital export countries into capital inflow countries. Moreover, competition among developing countries to attract more FDI often results in adopting lower environmental control standards than other countries. In this way, FDI further exacerbates environmental pollution in the host country.

5.4. Household Energy Consumption and Carbon Dioxide Emissions

China is rich in a large amount of coal mines and has a significant shortage of oil and natural gas. Therefore, China’s energy consumption structure is mainly coal, and it is also one of the few countries in the world that uses coal as its main energy source. Among the three traditional fossil energy sources, natural gas, coal, and oil, coal is the most inefficient and has a high carbon dioxide emission factor. Coal produces about 1.5 times as much carbon emissions as oil and 2.2 times as much as natural gas for the same amount of energy, so the carbon dioxide produced by the large-scale use of coal as the main energy source is much higher than that of other energy sources, such as oil and natural gas. Moreover, Chinese residents use coal unreasonably and excessively in production processes, resulting in insufficient coal combustion and low production efficiency, and therefore more carbon dioxide emissions. To realize the low carbonization of economic development, we must increase the proportion of renewable energy generation, and reduce the energy use intensity and carbon emission intensity of enterprises. In the short-term, reducing the use of inferior coal and improving the use of clean coal technology will be effective ways to improve coal utilization efficiency. In the long run, optimizing the energy mix and reducing the proportion of fossil fuels used will be key to reducing carbon dioxide emissions.
Urbanization, industry, investment, the economy, and household energy consumption are the main factors impacting the spatial distribution of carbon dioxide emissions in Chinese cities. The relationship can change when any one of the influencing factors changes, bringing about an increase or decrease in carbon dioxide emissions. According to the influencing factors of the regression model, each city could formulate a carbon reduction strategy according to local conditions.

6. Conclusions and Suggestions

6.1. Conclusions

Since the Industrial Revolution, global warming, caused by the continuous rise in the global carbon dioxide concentration, has attracted increasing attention from the international community [58]. As the largest emitter of carbon dioxide in the world, China has been facing enormous pressure to reduce carbon dioxide emissions [59]. As industrialization matures and progresses, industrial carbon dioxide will continue to decrease. However, the improvement in living standards has led to the consumption of residents gradually becoming the key area of carbon dioxide emissions. Promoting low-carbon consumption by residents will also become important for carbon dioxide emission reduction. Based on the carbon emission database of the China Urban Greenhouse Gas Working Group, we used GIS spatial analysis and SPSS multiple regression analysis to explore the spatial distribution characteristics of CO2 emissions in Chinese cities and constructed a multiple regression model to explain the evolution characteristics of urban CO2 emissions in China. The main conclusions are as follows:
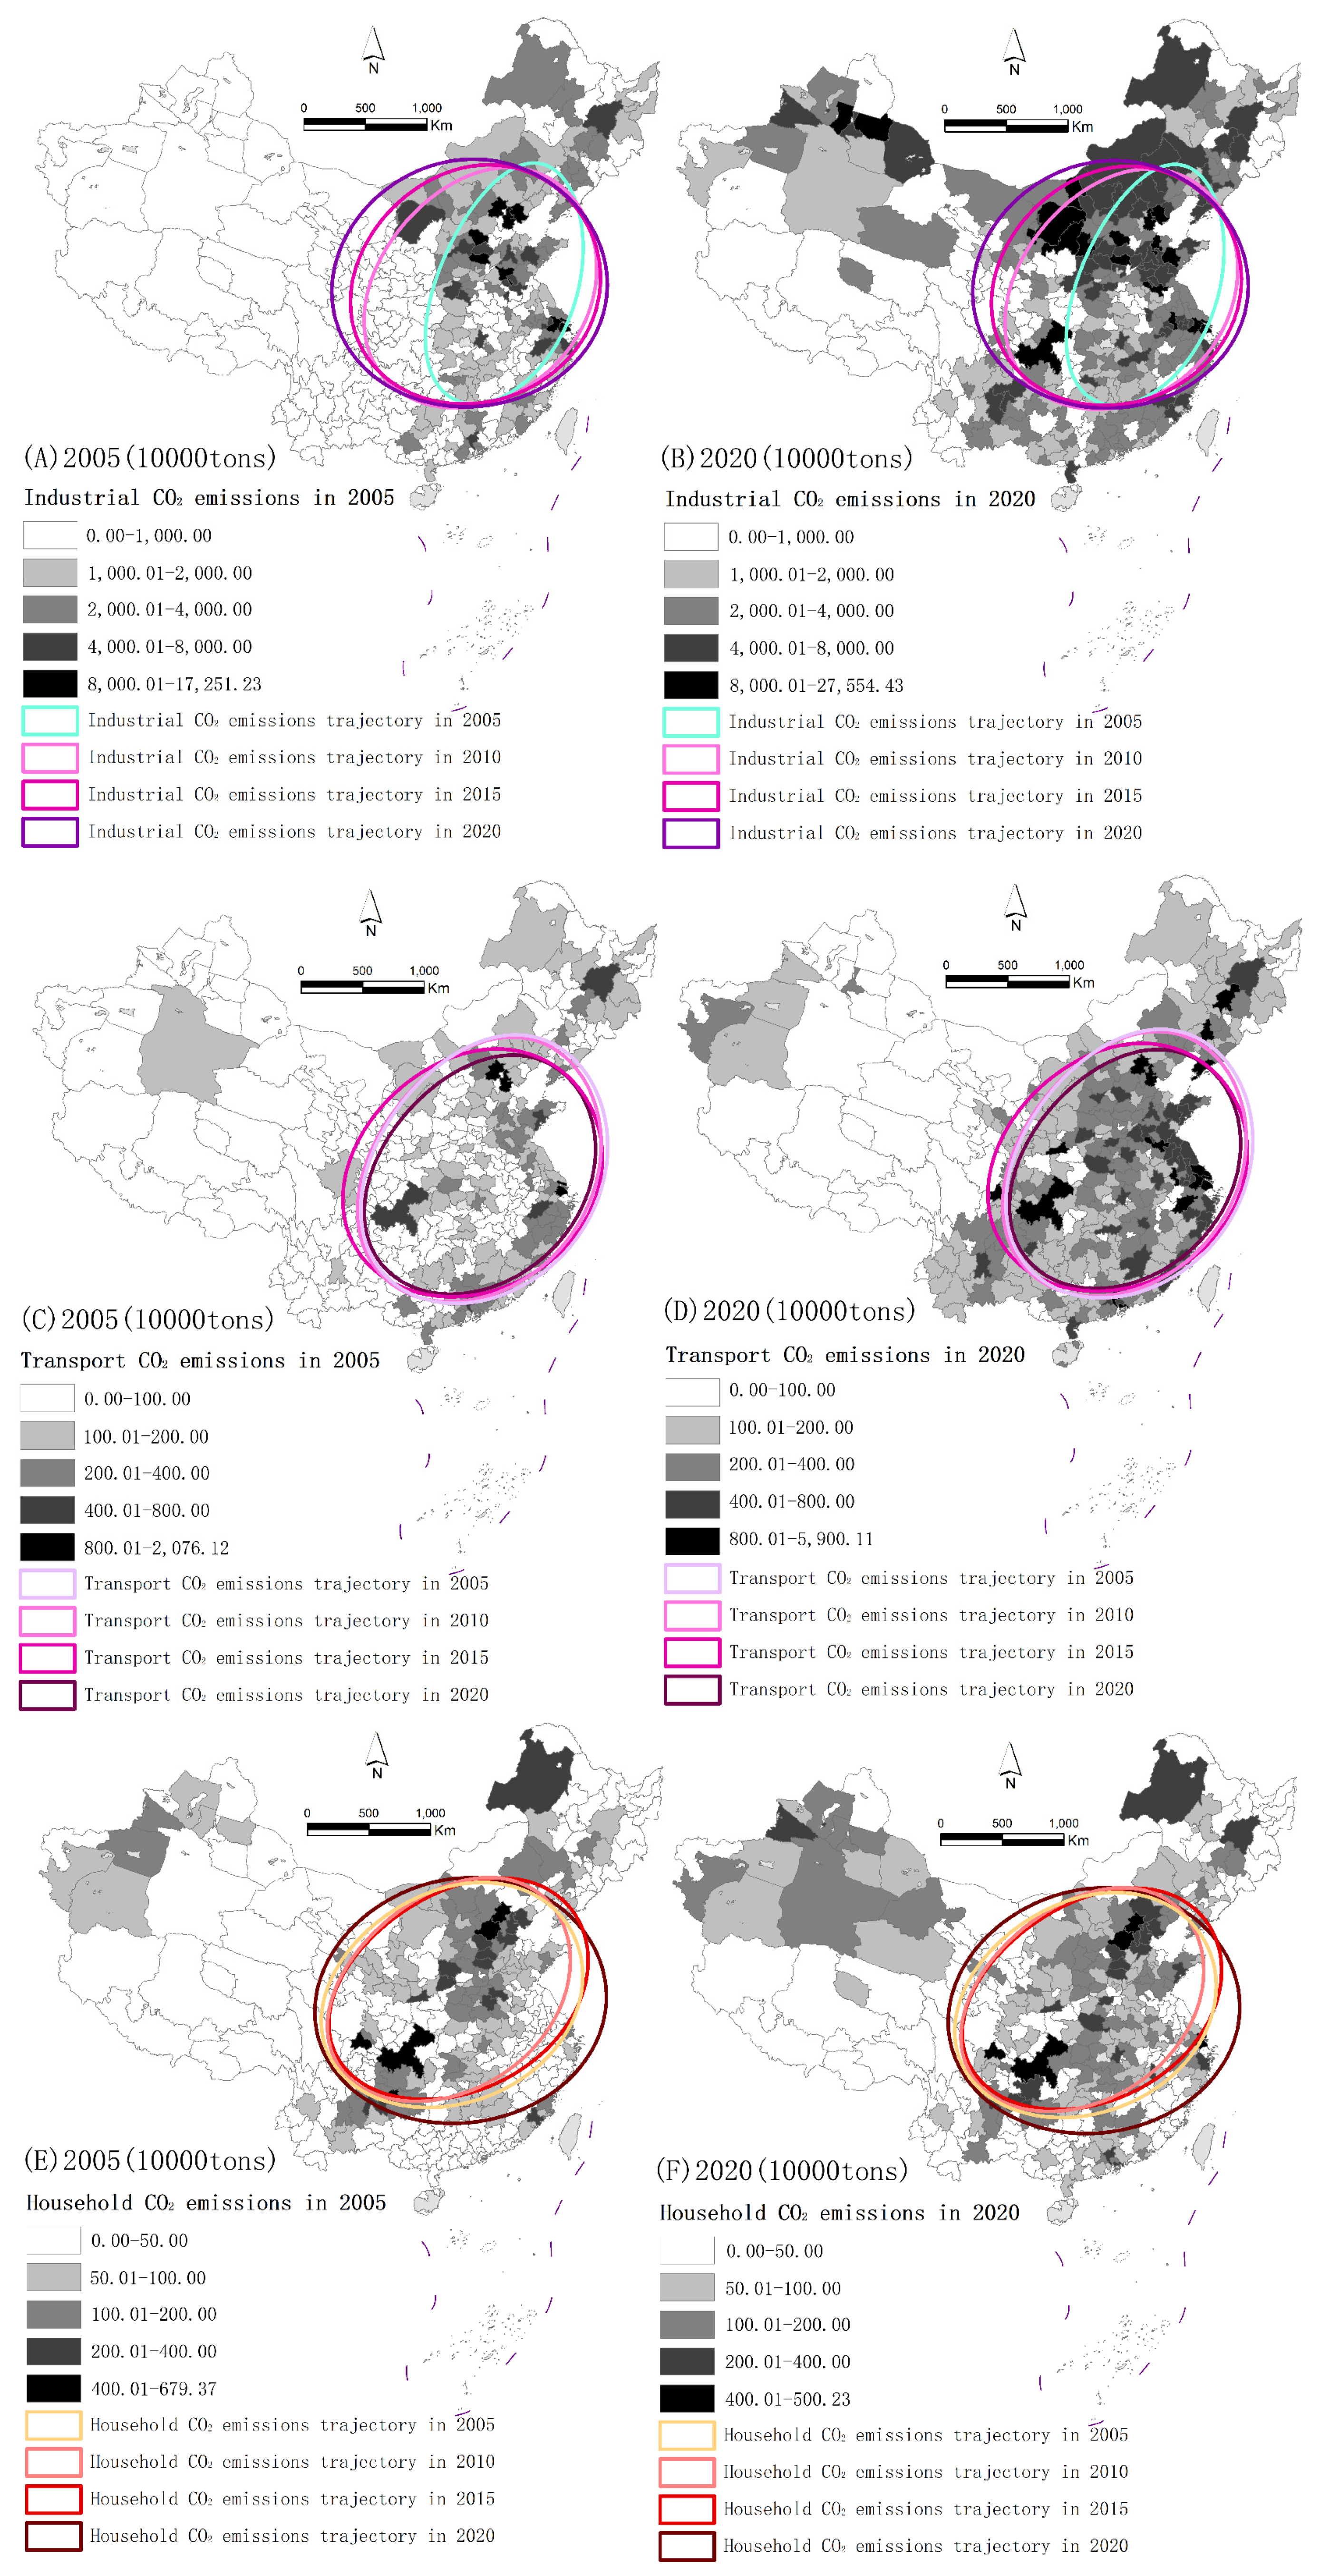
  • The urban CO2 emissions in China show a “point-line-area” spatial pattern. In the early stage, the provincial capital city was the core point of agglomeration, gradually forming a linear extension to the surrounding cities. After 2015, carbon dioxide emissions formed a planar emission pattern surrounded by the Beijing–Tianjin–Hebei urban agglomeration, Yangtze River Delta urban agglomeration, and Central Plains urban agglomeration.
  • A high per capita and high-intensity emission belt from Xinjiang to Inner Mongolia has been formed. In terms of total emissions, the proportion of industrial emissions continues to decrease, and the range of high industrial emissions has gradually crossed the “Hu Huan-yong Line” and spread from eastern China to the whole country. The emissions from transportation, the service industry, and households have become new growth points, and the high-value emissions from households also show a trend of spreading nationwide. China’s carbon dioxide emissions are growing fast, deep, and large in scale.
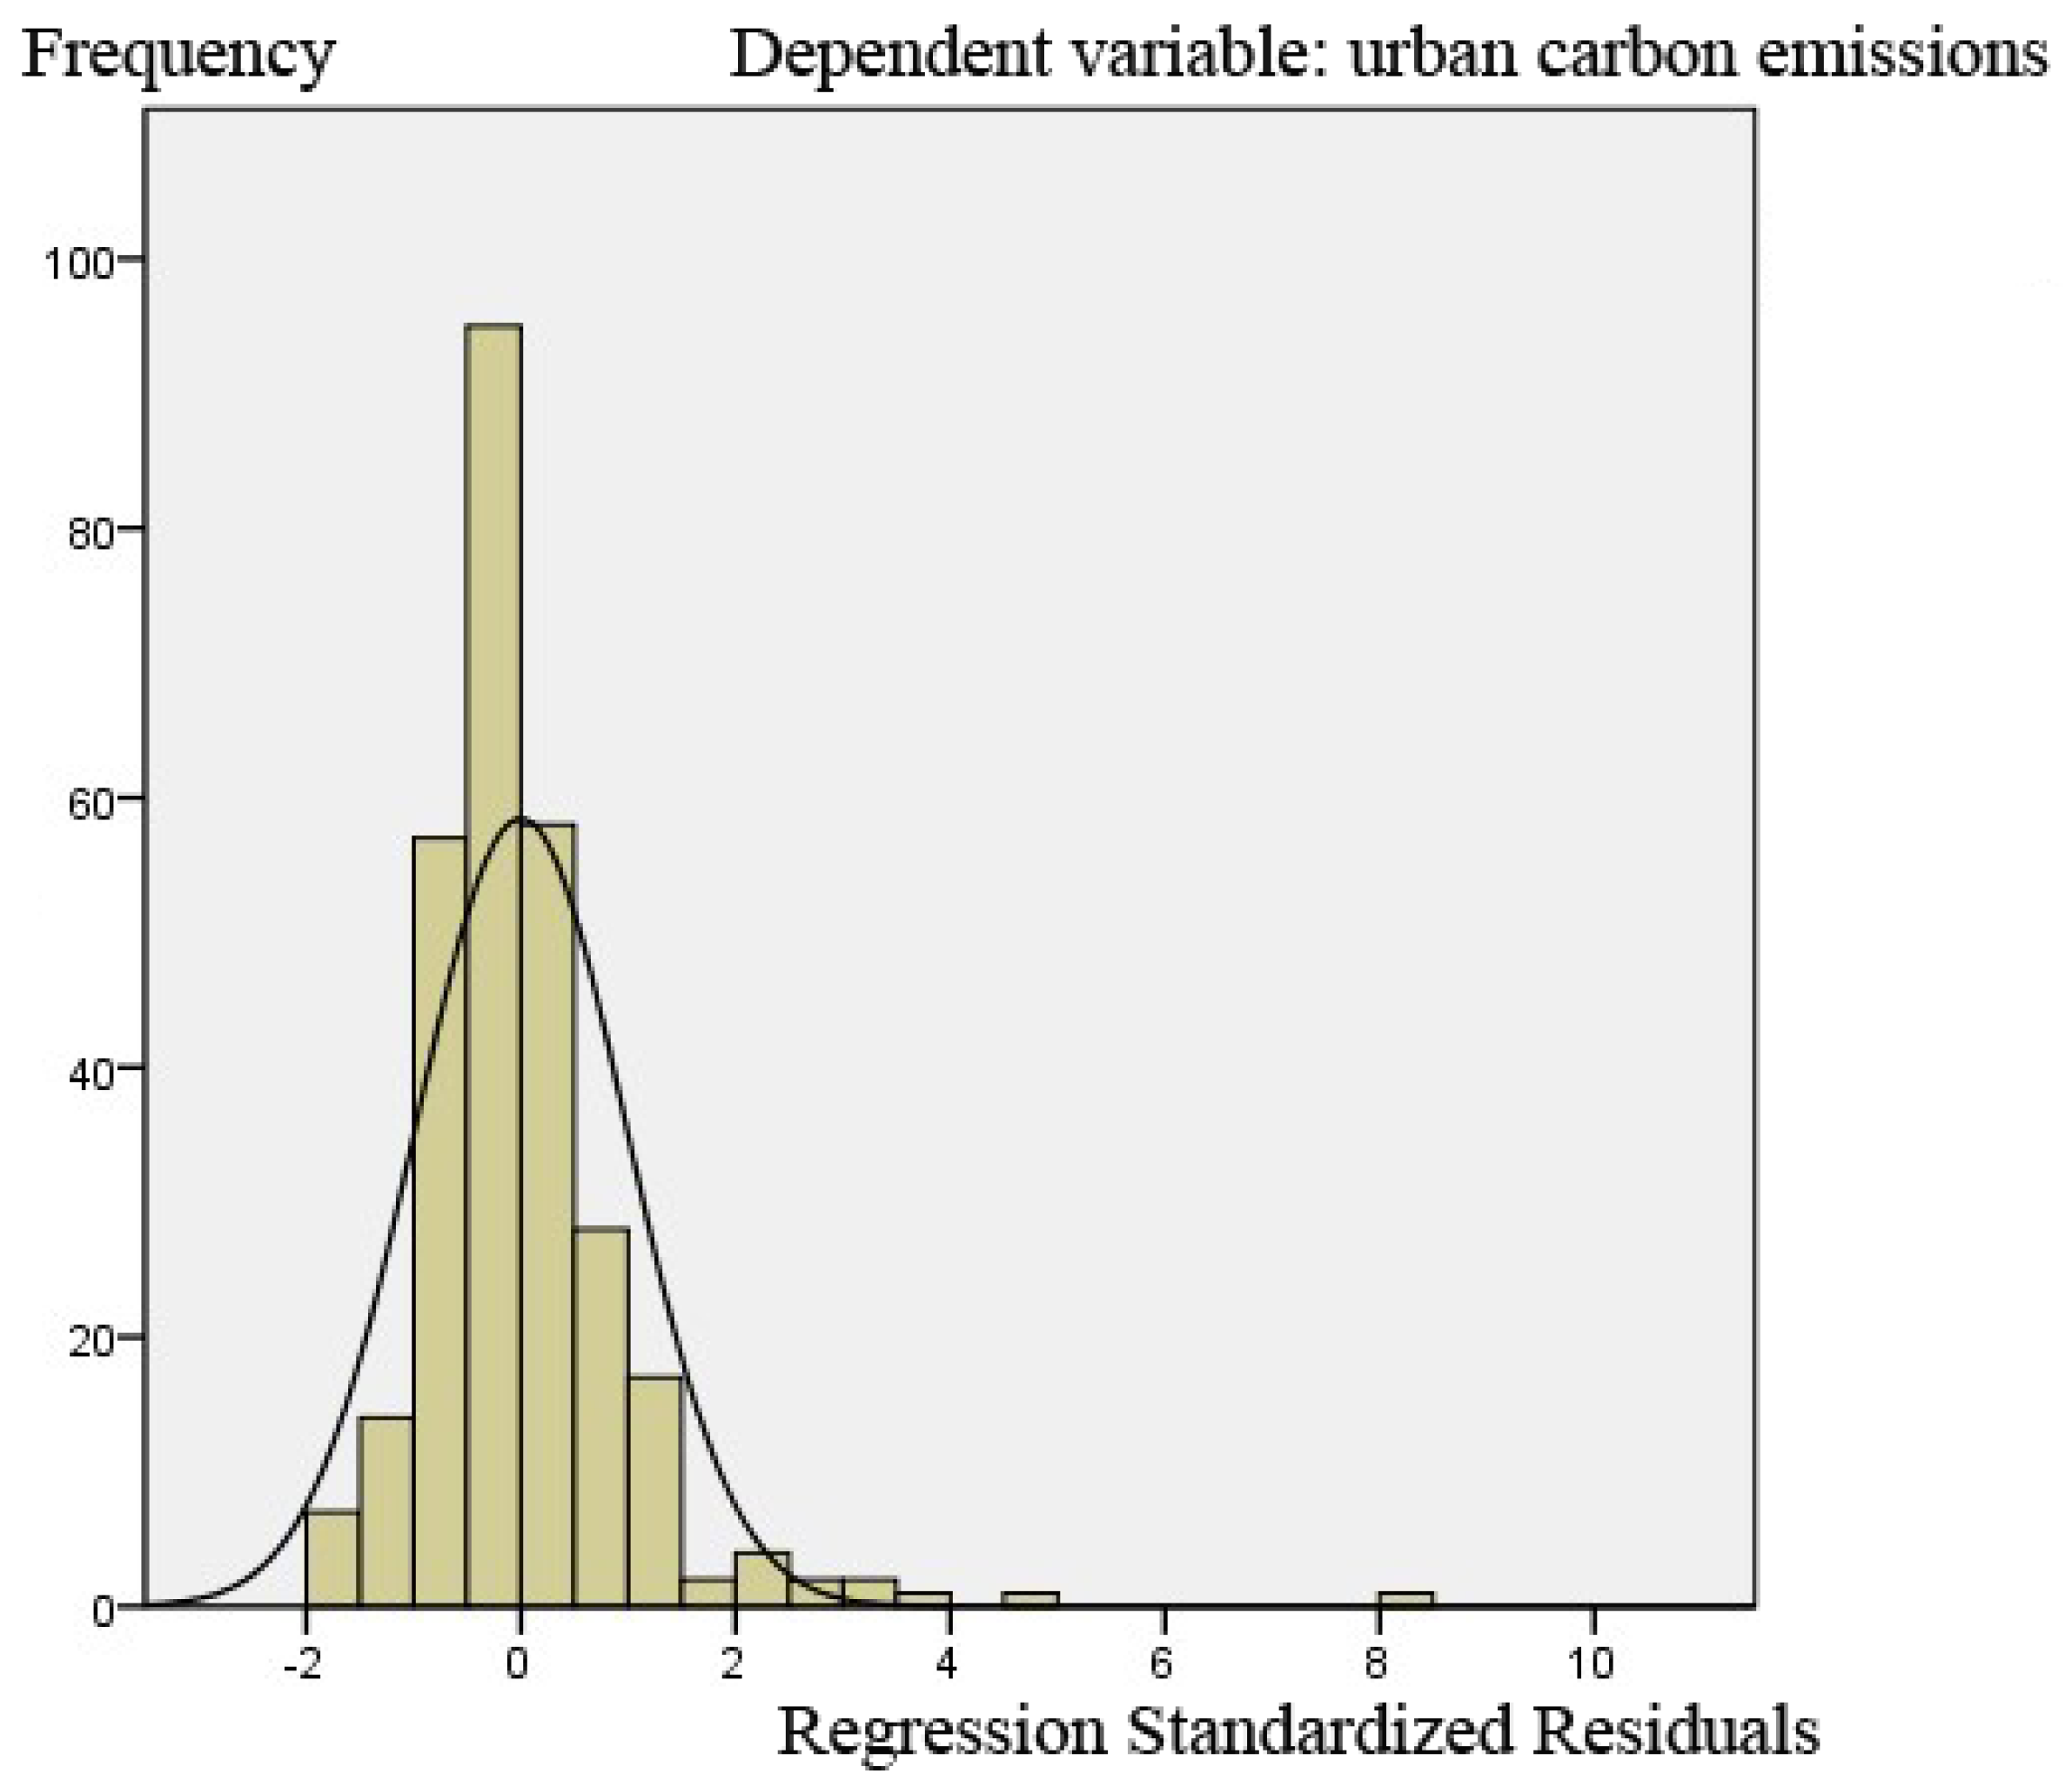
  • The spatial distribution of carbon dioxide emissions is significantly correlated with the factors of urbanization, the economy, industry, investment, and household energy consumption. The regression coefficients of the related variables may be either positive or negative, indicating that different factors promote or inhibit the spatial distribution of urban carbon dioxide emissions. According to the regression model, local governments should formulate policies to regulate carbon dioxide emissions according to local conditions and complete their regional carbon dioxide reduction development strategy.

6.2. Suggestions

Increasing the pace of carbon dioxide emission reduction in Chinese cities is an important task in the post-Xinguan pneumonia epidemic period [60]. The rapid growth of urban carbon dioxide emissions will lead to environmental problems such as increased climate change, ocean acidification, melting glaciers, and loss of biodiversity [61]. The uncertainty of the spatial dynamic law of urban carbon dioxide emissions can lead to errors in regional carbon dioxide emission reduction policy formulation [62]. Based on this, we propose the following differentiated carbon control suggestions:
Xinjiang, Inner Mongolia, Qinghai, Ningxia, and other provinces are the main governance areas in the western region, and these regions have high total emissions, per capita emissions, and carbon intensity. These regions are in the stage of rapid urbanization, and they should avoid the disorderly spread of high-carbon industries such as oil, coal, and natural gas. Local governments should formulate industrial development plans to optimize the industrial structure and energy efficiency. In the process of high-speed urbanization, the breakthrough of clean energy utilization and carbon dioxide control technology is important. Hubei, Henan, Shanxi, and other provinces are the key governance areas in the central region. These regions are also China’s energy and raw material industrial bases and need to strengthen breakthroughs in low-carbon processing technologies for energy and raw materials. Local governments should formulate policies and systems for carbon emission incentives and penalties to encourage enterprises to improve their energy and raw material processing techniques. The eastern region needs to focus on controlling indirect emissions caused by traffic energy consumption. Governments need to develop carbon-neutral subsidies and provide financial assistance to energy-supplying cities to help such areas ease the pressure on carbon reduction funds. Finally, with the improvement in residents’ living standards, a significant increase in residents’ carbon emissions has become a national phenomenon. All regions should consciously advocate a low-carbon life, strengthen energy-saving awareness education, and reduce the energy consumption of household appliances to achieve the overall goal of low-carbon development.
The energy sector needs to significantly reduce the overall use of fossil fuels, use low-emission energy sources, shift to alternative energy carriers, and improve energy efficiency and conservation. Reducing emissions in the industrial sector will require coordinated action across the value chain, including demand management, energy and material efficiency, recycled material flows, and emission-reducing technologies and transformational changes in production processes. The adoption of new energy sources, such as electricity and hydrogen fuel, will push industry to achieve net zero emissions of greenhouse gases. Cities and urban areas can significantly reduce emissions by reducing energy consumption, investing in the electrification of transport alongside low-emission energy, and harnessing nature to enhance carbon absorption and storage. For the buildings sector, good design and effective carbon reduction interventions will help buildings adapt to the future climate, achieve zero emissions, and contribute to sustainable development goals. In transport, electric vehicles powered by low-emission electricity offer the greatest decarburization potential for land transport. Sustainable biofuels can provide additional carbon reduction benefits for land transport. Sustainable biofuels and low-emission hydrogen and derivatives can also support the mitigation of CO2 emissions from sea, air, and heavy road transport. Finally, the sustainable implementation of carbon reduction programs in agriculture, forestry, and other land-use industries can lead to large-scale emission reductions and enhanced greenhouse gas removal.
Finally, this study only analyzed the spatial evolution characteristics and influencing factors of carbon dioxide emissions in China. There are still shortcomings in analyzing the influencing factors. This study did not consider the impact of geographical environmental factors such as the urban terrain, altitude, and vegetation on carbon emissions, which will be a new direction for future carbon emission research.

Author Contributions

H.H. conceived and designed the study; X.Z. performed the experiments and analyzed the data; Y.T. and Z.C. reviewed and edited the manuscript. All authors have read and agreed to the published version of the manuscript.

Funding

This work was supported by the National Social Science Fund of China (no. 23BSH066).

Institutional Review Board Statement

Not applicable.

Informed Consent Statement

Not applicable.

Data Availability Statement

Not applicable.

Conflicts of Interest

The authors declare no conflict of interest.

References

  1. Yapıcıoğlu, P.; Irfan Yeşilnacar, M. Economic performance index assessment of an industrial wastewater treatment plant in terms of the European Green Deal: Effect of greenhouse gas emissions. J. Water Clim. Change 2022, 13, 3100–3118. [Google Scholar] [CrossRef]
  2. Guan, Y.; Shan, Y.; Huang, Q.; Chen, H.; Wang, D.; Hubacek, K. Assessment to China’s recent emission pattern shifts. Earth’s Future 2021, 9, e2021EF002241. [Google Scholar] [CrossRef]
  3. Sun, L.L.; Cui, H.J.; Ge, Q.S. Will China achieve its 2060 carbon neutral commitment from the provincial perspective? Adv. Clim. Change Res. 2022, 13, 169–178. [Google Scholar] [CrossRef]
  4. Xin, L.; Sun, H.; Xia, X. Spatial–temporal differentiation and dynamic spatial convergence of inclusive low-carbon development: Evidence from China. Environ. Sci. Pollut. Res. 2023, 30, 5197–5215. [Google Scholar] [CrossRef]
  5. Xu, L.; Du, H.; Zhang, X. Driving forces of carbon dioxide emissions in China’s cities: An empirical analysis based on the geodetector method. J. Clean. Prod. 2021, 287, 125169. [Google Scholar] [CrossRef]
  6. Rotty, R.M. Distribution of and changes in industrial carbon-dioxide production. J. Geophys. Res.-Ocean. 1983, 88, 1301–1308. [Google Scholar] [CrossRef]
  7. Marland, G.; Rotty, R.M.; Treat, N.L. CO2 from fossil fuel burning: Global distribution of emissions. Tellus B Chem. Phys. Meteorol. 1985, 37, 243–258. [Google Scholar] [CrossRef]
  8. Selden, T.M.; Song, D. Environmental quality and development: Is there a Kuznets curve for air pollution emissions? J. Environ. Econ. Manag. 1994, 27, 147–162. [Google Scholar] [CrossRef]
  9. Li, J.; Li, S. Energy investment, economic growth and carbon emissions in China—Empirical analysis based on spatial Durbin model. Energy Policy 2020, 140, 111425. [Google Scholar] [CrossRef]
  10. Xing, H.; Spence, S.; Chen, H. A comprehensive review on countermeasures for CO2 emissions from ships. Renew. Sustain. Energy Rev. 2020, 134, 110222. [Google Scholar] [CrossRef]
  11. Abdelaziz, E.A.; Saidur, R.; Mekhilef, S. A review on energy saving strategies in industrial sector. Renew. Sustain. Energy Rev. 2011, 15, 150–168. [Google Scholar] [CrossRef]
  12. Aguilera, E.; Reyes-Palomo, C.; Díaz-Gaona, C.; Sanz-Cobena, A.; Smith, P.; García-Laureano, R.; Rodríguez-Estévez, V. Greenhouse gas emissions from Mediterranean agriculture: Evidence of unbalanced research efforts and knowledge gaps. Glob. Environ. Change 2021, 69, 102319. [Google Scholar] [CrossRef]
  13. Kamakate, F.; Schipper, L. Trends in truck freight energy use and carbon emissions in selected OECD countries from 1973 to 2005. Energy Policy 2009, 37, 3743–3751. [Google Scholar] [CrossRef]
  14. Wang, N.; Chang, Y.C. The evolution of low-carbon development strategies in China. Energy 2014, 68, 61–70. [Google Scholar] [CrossRef]
  15. Nejat, P.; Jomehzadeh, F.; Taheri, M.M.; Gohari, M.; Majid, M.Z.A. A global review of energy consumption, CO2 emissions and policy in the residential sector (with an overview of the top ten CO2 emitting countries). Renew. Sustain. Energy Rev. 2015, 43, 843–862. [Google Scholar] [CrossRef]
  16. Fowke, R.; Prasad, D.K. Sustainable development, cities and local government: Dilemmas and definitions. Aust. Plan. 1996, 33, 61–66. [Google Scholar] [CrossRef]
  17. Bin, S.; Dowlatabadi, H. Consumer lifestyle approach to US energy use and the related CO2 emissions. Energy Policy 2005, 33, 197–208. [Google Scholar] [CrossRef]
  18. Ren, S.; Yuan, B.; Ma, X.; Chen, X. International trade, FDI (foreign direct investment) and embodied CO2 emissions: A case study of Chinas industrial sectors. China Econ. Rev. 2014, 28, 123–134. [Google Scholar] [CrossRef]
  19. Salahuddin, M.; Alam, K.; Ozturk, I.; Sohag, K. The effects of electricity consumption, economic growth, financial development and foreign direct investment on CO2 emissions in Kuwait. Renew. Sustain. Energy Rev. 2018, 81, 2002–2010. [Google Scholar] [CrossRef]
  20. Wu, X.; Tian, Z.; Guo, J. A review of the theoretical research and practical progress of carbon neutrality. Sustain. Oper. Comput. 2022, 3, 54–66. [Google Scholar] [CrossRef]
  21. Wang, J.; Jiang, Q.; Dong, X.; Dong, K. Decoupling and decomposition analysis of investments and CO2 emissions in information and communication technology sector. Appl. Energy 2021, 302, 117618. [Google Scholar] [CrossRef]
  22. Zhao, J.; Chen, Y.; Ji, G.; Wang, Z. Residential carbon dioxide emissions at the urban scale for county-level cities in China: A comparative study of nighttime light data. J. Clean. Prod. 2018, 180, 198–209. [Google Scholar] [CrossRef]
  23. Shi, B.; Li, N.; Gao, Q.; Li, G. Market incentives, carbon quota allocation and carbon emission reduction: Evidence from China’s carbon trading pilot policy. J. Environ. Manag. 2022, 319, 115650. [Google Scholar] [CrossRef]
  24. Cai, A.; Zheng, S.; Cai, L.; Yang, H.; Comite, U. How does green technology innovation affect carbon emissions? A spatial econometric analysis of China’s provincial panel data. Front. Environ. Sci. 2021, 9, 813811. [Google Scholar] [CrossRef]
  25. Wang, B.; Sun, Y.; Wang, Z. Agglomeration effect of CO2 emissions and emissions reduction effect of technology: A spatial econometric perspective based on China’s province-level data. J. Clean. Prod. 2018, 204, 96–106. [Google Scholar] [CrossRef]
  26. Lu, H.; Liu, G. Spatial effects of carbon dioxide emissions from residential energy consumption: A county-level study using enhanced nocturnal lighting. Appl. Energy 2014, 131, 297–306. [Google Scholar] [CrossRef]
  27. Deller, D.; Stubenrath, M.; Weber, C. A survey on the use of the Internet for investor relations in the USA, the UK and Germany. Eur. Account. Rev. 1999, 8, 351–364. [Google Scholar] [CrossRef]
  28. Zhang, Y.; Pan, J.; Zhang, Y.; Xu, J. Spatial-temporal characteristics and decoupling effects of China’s carbon footprint based on multi-source data. J. Geogr. Sci. 2021, 31, 327–349. [Google Scholar] [CrossRef]
  29. Chen, H.; Yi, J.; Chen, A.; Peng, D.; Yang, J. Green technology innovation and CO2 emission in China: Evidence from a spatial-temporal analysis and a nonlinear spatial durbin model. Energy Policy 2023, 172, 113338. [Google Scholar] [CrossRef]
  30. Chen, J.; Gao, M.; Cheng, S.; Liu, X.; Hou, W.; Song, M.; Li, D.; Fan, W. China’s city-level carbon emissions during 1992–2017 based on the inter-calibration of nighttime light data. Sci. Rep. 2021, 11, 3323. [Google Scholar] [CrossRef] [PubMed]
  31. Chen, J.; Gao, M.; Cheng, S.; Hou, W.; Song, M.; Liu, X.; Liu, Y.; Shan, Y. County-level CO2 emissions and sequestration in China during 1997–2017. Sci. Data 2020, 7, 391. [Google Scholar] [CrossRef] [PubMed]
  32. Zhen, J.; Guan, P.; Yang, R.; Zhai, M. Transport matrix of PM2.5 in Beijing-Tianjin-Hebei and Yangtze River Delta regions: Assessing the contributions from emission reduction and meteorological conditions. Atmos. Environ. 2023, 304, 119775. [Google Scholar] [CrossRef]
  33. Wang, Z.; Yang, L. Delinking indicators on regional industry development and carbon emissions: Beijing–Tianjin–Hebei economic band case. Ecol. Indic. 2015, 48, 41–48. [Google Scholar] [CrossRef]
  34. Liu, Q.; Song, J.; Dai, T.; Shi, A.; Xu, J.; Wang, E. Spatio-temporal dynamic evolution of carbon emission intensity and the effectiveness of carbon emission reduction at county level based on nighttime light data. J. Clean. Prod. 2022, 362, 132301. [Google Scholar] [CrossRef]
  35. Huang, B.; Meng, L. Convergence of per capita carbon dioxide emissions in urban China: A spatio-temporal perspective. Appl. Geogr. 2013, 40, 21–29. [Google Scholar] [CrossRef]
  36. Shen, L.; Wu, Y.; Lou, Y.; Zeng, D.; Shuai, C.; Song, X. What drives the carbon emission in the Chinese cities?—A case of pilot low carbon city of Beijing. J. Clean. Prod. 2018, 174, 343–354. [Google Scholar] [CrossRef]
  37. Qin, H.; Huang, Q.; Zhang, Z.; Lu, Y.; Li, M.; Xu, L.; Chen, Z. Carbon dioxide emission driving factors analysis and policy implications of Chinese cities: Combining geographically weighted regression with two-step cluster. Sci. Total Environ. 2019, 684, 413–424. [Google Scholar] [CrossRef]
  38. Mardani, A.; Streimikiene, D.; Cavallaro, F.; Loganathan, N.; Khoshnoudi, M. Carbon dioxide (CO2) emissions and economic growth: A systematic review of two decades of research from 1995 to 2017. Sci. Total Environ. 2019, 649, 31–49. [Google Scholar] [CrossRef]
  39. Ouyang, X.; Lin, B. An analysis of the driving forces of energy-related carbon dioxide emissions in China’s industrial sector. Renew. Sustain. Energy Rev. 2015, 45, 838–849. [Google Scholar] [CrossRef]
  40. Sun, W.; Huang, C. How does urbanization affect carbon emission efficiency? Evidence from China. J. Clean. Prod. 2020, 272, 122828. [Google Scholar] [CrossRef]
  41. Ouyang, X.; Lin, B. Carbon dioxide (CO2) emissions during urbanization: A comparative study between China and Japan. J. Clean. Prod. 2017, 143, 356–368. [Google Scholar] [CrossRef]
  42. Duro, J.A.; Padilla, E. International inequalities in per capita CO2 emissions: A decomposition methodology by Kaya factors. Energy Econ. 2006, 28, 170–187. [Google Scholar] [CrossRef]
  43. Zhou, X.; Zhang, J.; Li, J. Industrial structural transformation and carbon dioxide emissions in China. Energy Policy 2013, 57, 43–51. [Google Scholar] [CrossRef]
  44. Zhang, N.; Yu, K.; Chen, Z. How does urbanization affect carbon dioxide emissions? A cross-country panel data analysis. Energy Policy 2017, 107, 678–687. [Google Scholar] [CrossRef]
  45. Glaeser, E.L.; Kahn, M.E. The greenness of cities: Carbon dioxide emissions and urban development. J. Urban Econ. 2010, 67, 404–418. [Google Scholar] [CrossRef]
  46. Andreoni, V.; Galmarini, S. Decoupling economic growth from carbon dioxide emissions: A decomposition analysis of Italian energy consumption. Energy 2012, 44, 682–691. [Google Scholar] [CrossRef]
  47. Yang, E.G.; Kort, E.A.; Wu, D.; Lin, J.C.; Oda, T.; Ye, X.; Lauvaux, T. Using space-based observations and Lagrangian modeling to evaluate urban carbon dioxide emissions in the Middle East. J. Geophys. Res. Atmos. 2020, 125, e2019JD031922. [Google Scholar] [CrossRef]
  48. Shi, W.; Sha, Z.; Qiao, F.; Tang, W.; Luo, C.; Zheng, Y.; Wang, C.; Ge, J. Study on the Temporal and Spatial Evolution of China’s Carbon Dioxide Emissions and Its Emission Reduction Path. Energies 2023, 16, 829. [Google Scholar] [CrossRef]
  49. Wang, B.; Shi, W.; Miao, Z. Confidence analysis of standard deviational ellipse and its extension into higher dimensional Euclidean space. PLoS ONE 2015, 10, e0118537. [Google Scholar] [CrossRef]
  50. Chen, L.; Xu, L.; Cai, Y.; Yang, Z. Spatiotemporal patterns of industrial carbon emissions at the city level. Resour. Conserv. Recycl. 2021, 169, 105499. [Google Scholar] [CrossRef]
  51. Yapıcıoğlu, P.; Yeşilnacar, M.İ. Investigating energy costs for a wastewater treatment plant in a meat processing industry regarding water-energy nexus. Environ. Sci. Pollut. Res. 2022, 29, 1301–1313. [Google Scholar] [CrossRef] [PubMed]
  52. Zhang, X.; Han, H.; Tang, Y.; Chen, Z. Spatial Distribution Characteristics and Driving Factors of Tourism Resources in China. Land 2023, 12, 1029. [Google Scholar] [CrossRef]
  53. Sun, L.; Liu, W.; Li, Z.; Cai, B.; Fujii, M.; Luo, X.; Chen, W.; Geng, Y.; Fujita, T.; Le, Y. Spatial and structural characteristics of CO2 emissions in East Asian megacities and its indication for low-carbon city development. Appl. Energy 2021, 284, 116400. [Google Scholar] [CrossRef]
  54. Dong, Y.; Jin, G.; Deng, X. Dynamic interactive effects of urban land-use efficiency, industrial transformation, and carbon emissions. J. Clean. Prod. 2020, 270, 122547. [Google Scholar] [CrossRef]
  55. Li, Z.; Luan, W.; Zhang, Z.; Su, M. Relationship between urban construction land expansion and population/economic growth in Liaoning Province, China. Land Use Policy 2020, 99, 105022. [Google Scholar] [CrossRef]
  56. Wei, Y.-M.; Chen, K.; Kang, J.-N.; Chen, W.; Wang, X.-Y.; Zhang, X. Policy and management of carbon peaking and carbon neutrality: A literature review. Engineering 2022, 14, 52–63. [Google Scholar] [CrossRef]
  57. Zhang, A.; Deng, R. Spatial-temporal evolution and influencing factors of net carbon sink efficiency in Chinese cities under the background of carbon neutrality. J. Clean. Prod. 2022, 365, 132547. [Google Scholar] [CrossRef]
  58. Baldocchi, D.; Valentini, R.; Running, S.; Oechel, W.; Dahlman, R. Strategies for measuring and modelling carbon dioxide and water vapour fluxes over terrestrial ecosystems. Glob. Change Biol. 1996, 2, 159–168. [Google Scholar] [CrossRef]
  59. Zhang, Y.; Yuan, Z.; Margni, M.; Bulle, C.; Hua, H.; Jiang, S.; Liu, X. Intensive carbon dioxide emission of coal chemical industry in China. Appl. Energy 2019, 236, 540–550. [Google Scholar] [CrossRef]
  60. Zhang, S.; Wu, Y.; Liu, H.; Huang, R.; Un, P.; Zhou, Y.; Fu, L.; Hao, J. Real-world fuel consumption and CO2 (carbon dioxide) emissions by driving conditions for light-duty passenger vehicles in China. Energy 2014, 69, 247–257. [Google Scholar] [CrossRef]
  61. Hoegh-Guldberg, O.; Mumby, P.J.; Hooten, A.J.; Steneck, R.S.; Greenfield, P.; Gomez, E.; Harvell, C.D.; Sale, P.F.; Edwards, A.J.; Caldeira, K.; et al. Coral reefs under rapid climate change and ocean acidification. Science 2007, 318, 1737–1742. [Google Scholar] [CrossRef] [PubMed]
  62. Oda, T.; Bun, R.; Kinakh, V.; Topylko, P.; Halushchak, M.; Marland, G.; Lauvaux, T.; Jonas, M.; Maksyutov, S.; Nahorski, Z.; et al. Errors and uncertainties in a gridded carbon dioxide emissions inventory. Mitig. Adapt. Strateg. Glob. Change 2019, 24, 1007–1050. [Google Scholar] [CrossRef]
Figure 1. Composition of carbon dioxide emissions from various industries in China from 2005 to 2020.
Sustainability 15 14849 g001
Figure 2. Nuclear density distribution of total carbon dioxide emissions in (A) 2005, (B) 2010, (C) 2015, and (D) 2020.
Sustainability 15 14849 g002
Figure 3. Spatial distribution of per capita carbon dioxide emissions in (A) 2005, (B) 2010, (C) 2015, and (D) 2020.
Sustainability 15 14849 g003
Figure 4. Distribution of the carbon emission intensity in (A) 2005, (B) 2010, (C) 2015, and (D) 2020.
Sustainability 15 14849 g004
Figure 5. Distribution of carbon dioxide emission trends in various industries in China from 2005 to 2020.
Sustainability 15 14849 g005
Figure 6. Standardized residual histogram.
Sustainability 15 14849 g006
Table 1. Assumption of basic parameters affecting variables.
Influence Factor HypothesisIndex SelectionSymbolUnitAverageStandard Deviation
Urban CO2 emissionsY10,000 tons4035.723859.377
UrbanizationUrban construction land area/km2 (X1)X1km2149.02212.422
Average annual population of the city/104 people (X2)X2104 people436.54329.712
Urban economicPer capita GDP of the city/yuan (X3)X3Yuan60,679.4935,109.878
Urban industrialEmployed personnel in the secondary industry of the city at the end of the year (X4)X4 263,534.17373,060.163
Employed personnel in the tertiary industry of the city at the end of the year (X5)X5 316,588.21591,375.155
Urban residentialUrban residential sales area/km2 (X6)X610,000 m2465.34538.152
Foreign investmentForeign-invested enterprises in the city (X7)X7 82.03265.532
Household energy consumptionEmployment of units in the electricity, heat, gas, and water production and supply industries at the end of the year (X8)X8 10,010.2411,942.134
Table 2. Multiple linear regression analysis of carbon dioxide emissions and influencing variables.
ModelClassification of IndicatorsVariableBTSig.VIF
Model 1:
(Dependent variable: urban CO2 emissions)
(constant)−1061.164−2.2340.026
UrbanizationUrban construction land area/km2 (X1)4.6482.9560.0034.395
Average annual population of the city/104 people (X2)5.9237.0180.0003.051
Urban economicPer capita GDP of the city/yuan (X3)0.0436.5530.0002.108
Urban industrialEmployed personnel in the secondary industry of the city at the end of the year (X4)−0.003−2.9550.0034.487
Employed personnel in the tertiary industry of the city at the end of the year (X5)−0.002−3.6930.0004.431
Urban residentialUrban residential sales area/10000 m2 (X6)−2.085−3.8740.0003.304
Foreign investmentForeign-invested enterprises in the city (X7)5.4586.0490.0002.262
Household energy consumptionEmployment of units in the electricity, heat, gas, and water production and supply industries at the end of the year (X8)0.1095.1490.0002.507
Disclaimer/Publisher’s Note: The statements, opinions and data contained in all publications are solely those of the individual author(s) and contributor(s) and not of MDPI and/or the editor(s). MDPI and/or the editor(s) disclaim responsibility for any injury to people or property resulting from any ideas, methods, instructions or products referred to in the content.

