Article

Life Cycle Carbon Dioxide Emissions and Sensitivity Analysis of Elevators

1
School of Mechanical and Electrical Engineering, Guilin University of Electronic Technology, Guilin 541004, China
2
College of Energy Engineering and Building Environment, Guilin University of Aerospace Technology, Guilin 541004, China
3
KONE CHINA, 88 Middle Gucheng Rd Kunshan, Kunshan 215300, China
4
Guangxi Special Equipment Inspection and Research Institute, Nanning 541004, China
*
Authors to whom correspondence should be addressed.
Sustainability 2023, 15(17), 13133; https://doi.org/10.3390/su151713133
Submission received: 27 June 2023 / Revised: 26 August 2023 / Accepted: 28 August 2023 / Published: 31 August 2023
(This article belongs to the Special Issue Carbon Emission Mitigation: Drivers and Barriers)

Abstract

:
With the intensification of climate warming, the carbon dioxide emissions from high-energy-consuming elevators have attracted increasing societal attention. The assessment of carbon dioxide emissions, particularly the boundaries and strategies of carbon dioxide emissions accounting, lacks systematic research. However, an efficient evaluation of elevator carbon dioxide emissions is beneficial for improving elevator energy utilization. A carbon dioxide emissions accounting method and inventory analysis of a life cycle for an elevator is proposed to measure the carbon dioxide emissions from production to disposal. In addition, a new assessment indicator, namely, annual carbon dioxide emissions per ton·kilometer, is proposed to evaluate the carbon dioxide emissions for different types of elevators. The lifetime carbon dioxide emissions of the elevator and its sensitivity to influencing factors were assessed. The results indicate that the carbon dioxide emissions in the four stages of manufacturing, installation, operation and maintenance, and demolition and scraping contributed 41.31%, 0.92%, 57.32% and 0.44%, respectively. The annual carbon dioxide emissions of the elevator were about 27.18 kgCO2/t·km. The four primary factors affecting CO2 emissions were electricity consumption, printed circuit boards, low-alloy steel and chrome steel in descending order. Their probability distribution characteristics all obeyed triangular or uniform distributions. The median of their 95% confidence intervals was about 73,800. Their coefficients of variation were all below 2.1%. The effective strategies for energy conservation and carbon reduction were suggested by the life cycle impactor assessment. They also provide guidance for sustainable elevators.

1. Introduction

The rapid development of industrialization has raised a host of sustainability-related challenges, including the looming global energy shortages, escalating environmental degradation and the looming specter of climate change. In this context, it is crucial to address carbon emissions and energy consumption, especially in industries that contribute significantly to these issues, such as the construction sector. The global CO2 emissions from the construction industry in 2009 accounted for 23% of the total. CO2 emissions increased by 40% from 2000 to 2019 [1]. The Asia–Pacific region leads the world in CO2 emissions, contributing 52% of the national emissions in 2020, with China generating 59% of the emissions in the region [2]. In 2019, buildings emitted 2.11 billion tons of carbon emissions during operation, making up 21.9% of all carbon emissions and 42.8% of all carbon emissions from buildings [2]. Clearly, it is imperative for the construction industry to reduce its energy consumption and carbon emissions in order to advance peak carbon, firmly realize the core goal of carbon neutrality and promote the sustainable development of society.
In the building sector, carbon emissions include heating, air conditioning, lighting, electrical appliances, cooking, domestic water supply and elevators. Reducing carbon emissions is consistent with sustainability goals to mitigate climate change and achieve carbon neutrality. The elevator is a standard electrical appliance in modern buildings and a significant energy consumer of these buildings. It is one of the three primary high-energy-consuming pieces of special equipment. The energy consumption of elevators is 2% to 10% of these building’s total energy consumption [3]. However, in high-rise buildings, it accounts for 17–25% of the total energy consumption [4]. During peak hours, elevators can contribute up to 40% of the building’s electricity demand [5]. With the rapid development of urbanization, the number of elevators is gradually increasing. In 2021, there are 8,447,000 elevators in China [6]. The energy consumption of elevators is directly linked to sustainable development goals, as reducing their energy consumption contributes to the overall energy efficiency of buildings and supports the transition to more sustainable urban environments. Carbon dioxide emissions throughout their life cycle accompany elevators. Therefore, the life cycle carbon dioxide emissions of the elevators require extensive investigation. The carbon dioxide emissions of elevators significantly impact the achievement of carbon peaking and carbon neutrality goals.
The carbon emissions of an elevator can be evaluated using life cycle assessment (LCA) from “cradle to grave”. In other words, from raw materials acquisition, processing, manufacturing, transportation and use to the end of the elevator [7]. LCA considers the entire life cycle of the elevators, which is consistent with the holistic and integrated approach to sustainability. There has been less research on carbon emissions from elevators, but a great deal of research has been done on carbon emissions in the building sector [8,9,10]. The European Council for Standardization developed a life carbon accounting framework for buildings based on their life cycle, which includes a mechanism for calculating product recycling and a wide range of environmental indicators [11]. According to the process analysis of the carbon emissions, the accounting methods of the life cycle in buildings can be divided based on the temporal and spatial dimensions [12,13], direct and indirect carbon emissions [14], and carbon flow from various types of energy sources [15]. Although operational energy consumption makes up the major proportion of total carbon emissions, the implied carbon emissions from building materials will rise with the development of ultra-low energy buildings [16]. Atmaca measured the carbon footprint of residential buildings in Turkey and discovered that implied carbon emissions made up about 20% of the total [17]. Furthermore, implied energy intensity (EEI) and primary energy usage intensity (EUI) can be used to evaluate the life cycle carbon performance [18,19,20]. For instance, the greenhouse gas emissions of wood-frame and conventional buildings are analyzed by implied energy throughout their life cycle [21]. As an energy-intensive piece of equipment in buildings, the carbon emissions of buildings can be greatly reduced in the carbon emissions of elevators. LCA can also be used to evaluate the life cycle carbon emissions of an elevator since there are significant stages of the carbon emissions from both the elevators and the building. Furthermore, the LCA of an elevator can also refer to the assessment method for a building, such as the direct carbon emissions and the implied carbon emissions from materials in the time and space dimensions.
The reduction in the carbon emissions of the elevators is addressed to reduce the environmental impact of greenhouse gases. A green and low-carbon elevator can be achieved by optimizing the production process of elevator parts and components, reducing energy consumption [22], optimizing operation and management [23], and other multi-pronged approaches [24]. The annual energy consumption of an elevator greatly determines its carbon dioxide emissions each year; in other words, the CO2 emissions of an elevator can be reduced by lowering elevator energy consumption. Therefore, it is indispensable to improve the energy efficiency of elevators to greatly reduce the energy consumption of elevators and lower carbon dioxide emissions, especially the elevators in high-rise buildings and super-high-rise buildings [25]. Elevators powered by AC variable voltage variable frequency (VVVF) motors consume up to 50% less energy than elevators powered by non-AC-VVVF motors [26]. The energy consumption of elevators can also be reduced by using renewable energy, reducing standby energy consumption and implementing unmanned machine rooms. Further, some robust optimization scheduling strategies for elevator groups can also reduce their energy consumption [27], such as the annual energy consumption of elevators in similar-height buildings increasing with the number of annual trips. An effective algorithm was even developed to minimize the energy of vertical elevators during rush hour while controlling the number of passengers in an elevator during the COVID-19 period [28]. An elevator simulator was designed to investigate the relationship between the scheduling model and the level of energy consumption during operation. The results of the study showed that as the number of elevators increased and service quality improved, the energy consumption of elevators decreased [29]. The carbon emissions assessment of energy-efficient elevators was predicated on the assumption that the energy consumption of elevators can be accurately measured. There are currently five methods for determining the energy consumption of the elevator: the calculation by first principles [30], the calculation by using empirical formulas and reference values [31], measurement [32,33], the hybrid method by using measured values and previous formulas [25,34,35], and modeling and simulation [36]. Each method has its own set of limitations. However, the German Association of Engineers (VDI) 4707-1:2009 and the International Organization for Standardization (ISO) 25745-2:2015, on the other hand, recommend the hybrid method for calculating the energy consumption of elevators [7,37]. As a result, the hybrid method was used to compute the energy consumption of the elevator in this study.
Despite the advantages of the LCA, the life cycle inventory analysis (LCIA) of the elevator is derived from the total amount of resources and energy consumed at various stages of the life cycle, which is prone to a lot of uncertainties during the collection [38,39]. For example, product design, use methods, and service life in time and space can all result in variability [40]. Particularly, those brought on by operational scenarios and implicit carbon can result in environmental impact assessments from life cycle carbon dioxide emissions that are not entirely reliable. The ISO 14040:2006 standard [41] recommends introducing various sources to the system in order to assess the uncertainty. Probability density distribution functions are frequently used for quantitative statistical uncertainty analysis [42]. For instance, lifetime data is handled via a normal probability density function [43]. Considering the uncertainty in the parameters of the probabilistic approach, ISO 15686-8 proposes the introduction of distributions to factors of the factor method [44]. Sensitivity analyses, which are based on the premise of carefully specifying the range of uncertainty or the selection of a distribution function, test the reliability of model assumptions and data for evaluating outcomes [45]. Lu investigated the environmental impacts of the entire structural framework of a residential apartment based on the life cycle theory, which performs a local sensitivity analysis of the multi-influence factors (variations between −10% and +10%) and an environmental performance analysis with uncertainty based on a Monte Carlo simulation [46]. The sensitivity analysis was undertaken by introducing a 20% increase in the dominant distinguished parameters to measure the environmental and economic assessment results of the life cycle CO2 [47]. At present, the data analysis of the carbon emission assessment results primarily focuses on local sensitivity analysis, while global sensitivity analysis is less commonly applied in this field.
The environmental impact of elevators was primarily evaluated in terms of energy consumption in the aforementioned research. Few studies have addressed the carbon dioxide emissions of elevators. However, it is a fundamental evaluation indicator for the environmental impact assessment since it is a greenhouse gas. Therefore, CO2 emissions are regarded as the environmental impact assessment index of high-energy elevators. In this study, the accounting scope of the elevators was well defined by constructing an LCA framework. An accounting inventory of the life cycle of an elevator was analyzed to measure the carbon dioxide emissions from production to disposal. Most importantly, a new assessment indicator, namely, annual carbon dioxide emissions per ton·kilometer, is proposed to evaluate the carbon dioxide emissions for different types of elevators. The carbon dioxide emissions in the four stages of manufacturing, installation, operational and maintenance, and demolition and scraping contributed 41.31%, 0.92%, 57.32% and 0.44%, respectively. In addition, the primary impact factors of the elevator were confirmed via the sensitivity of LCA. The coefficients of variation of their probability distribution were all below 2.1%. A series of effective measures were provided to reduce energy and carbon emissions of elevators using the life cycle impact assessment (LCIA). Therefore, the LCIA can provide a robust data source for assessing the environmental impact of the elevator.

2. Goal and Scope Definition

2.1. Elevator System Goal

The primary purpose of this study was to quantify the environmental impact of carbon emissions in elevator systems and to provide a certain theoretical basis for carbon emissions research in the green elevator industry. It also proposed corresponding energy-saving and sustainable strategies for different life stages and guides enterprises in elevator product design, raw material selection, manufacturing, transportation, and use at the same time in order to achieve better emissions reduction effects and sustainable elevators.

2.2. Functional Unit of Elevator System

It is important to pay attention to different types or sizes of elevators. The carbon emissions of an elevator are positively correlated with its size. In other words, the larger the elevator, the more material and energy will be consumed in the manufacturing process. Conversely, the smaller the elevator size and the more energy-efficient the configuration, the smaller the carbon footprint during manufacture and use. If the life cycle of an elevator is considered, the operation and use processes occupy the largest share of time. That is to say, the total amount of carbon emissions increases with the service life of the elevator. Therefore, it is not consistent and comparable to only measure the total carbon emissions of various elevators over their life cycles. The functional unit was defined as annual carbon dioxide emissions systems per ton·kilometer (kgCO2/t·km) to realize the comparison of the carbon emissions between different elevators on the same benchmark in the study. At the same time, the functionalization of carbon emissions provides a quantitative basis for the sustainable application of elevators.

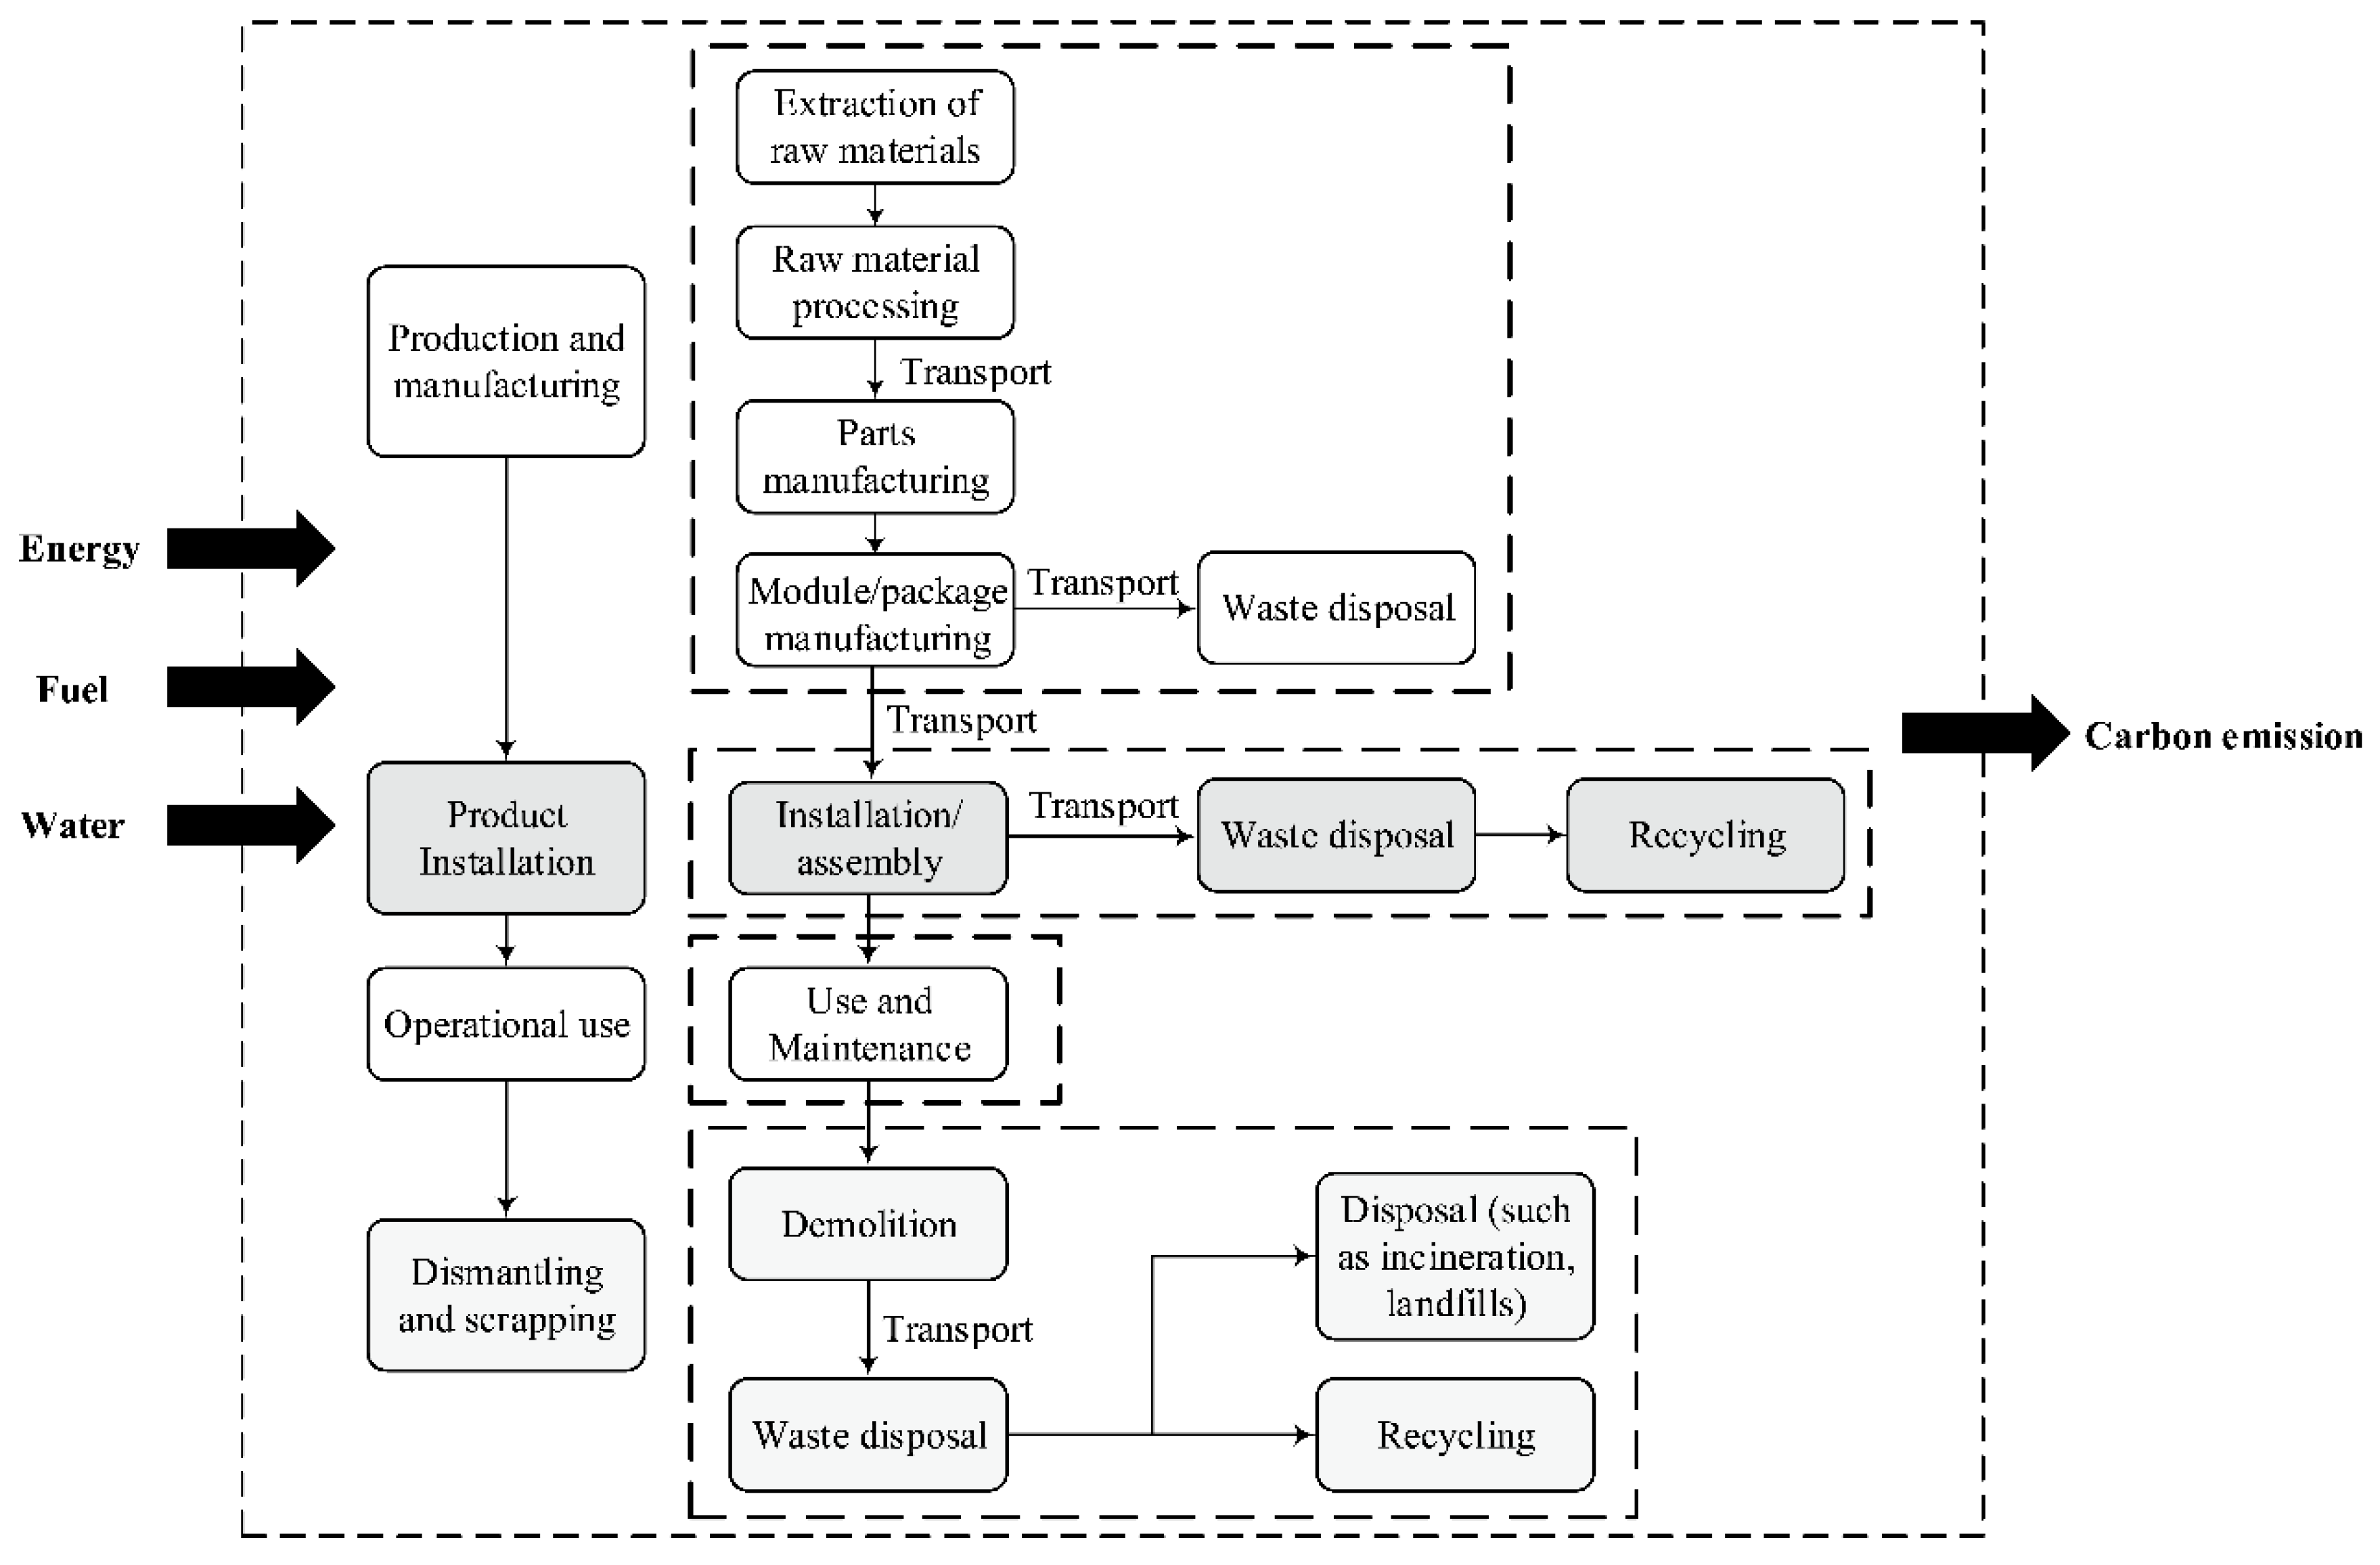
2.3. Elevator System Boundary

Provision 3.1 of ISO 14044:2006 and ISO 14040:2006 states a life cycle is the consecutive and interlinked stages of a product system from raw material acquisition or generation from natural resources to final disposal [41,48]. It not only provides the definition of the carbon dioxide emission boundaries but also the carbon dioxide emissions accounting scheme of the elevator. The scientific definition of the boundaries is essential to ensuring that the LCIA is reliable. The primary function of the elevators is to transport passengers or cargo from different floors of a high-rise building to the destination floor set by the user. The elevator mainly consists of a traction system, guidance system, car, door system, weight compensation system, electric dragging system, electronic control system and safety protection system. Elevators are regarded as a system whose carbon emissions boundaries should consider the inputs and output in each stage. Manufacturing, installation, operation and maintenance, and dismantling and scrapping are the four stages that make up the life cycle of an elevator. The CO2 emissions of elevators are primarily examined according to the four stages of the life cycle in the study. The life cycle of the carbon emissions calculation for the elevator was 25 years in this study.
Figure 1 depicts the carbon dioxide emissions framework of an elevator at different stages. The acquisition of the raw materials, production, processing, and transport of the necessary parts all generate CO2 emissions in the production and manufacturing stages. It was not ignored that carbon dioxide emissions are produced by the low-alloy steel and chrome steel used in elevator parts. Then, the processing of raw materials involves the use of energy, fuel and water, all of which generate carbon dioxide emissions. In addition, carbon dioxide emissions must also be taken into account with regard to the packaging, transportation and waste recycling of elevator parts. Since the use of various raw materials and the energy consumed in the processing and manufacturing of the elevator account for a relatively large portion of the carbon emissions, this study mainly considered the use of raw materials, energy consumption during processing and manufacturing, and the disposal of waste as the three main sources of carbon emissions during this stage.
The carbon dioxide emissions of the product installation are shown in the second stage of Figure 1. It is essential to estimate the carbon dioxide emissions from the transportation of elevator parts before the installation phase. The waste of materials and electrical energy is mostly considered during the elevator equipment assembly. The carbon dioxide emissions from recycling and waste disposal should also be calculated. Waste disposal also refers to the carbon dioxide emissions from transport. Therefore, the carbon dioxide emissions from both transportation parts need to be calculated in the installation phase.
The carbon dioxide emissions of the elevator operation are shown in the third stage of Figure 1. There are primarily two sources of carbon dioxide emissions during this stage. First, energy is consumed by various equipment operations. The carbon dioxide emissions caused by electricity consumption need to be considered. Second, elevator equipment may wear out or deteriorate with operating time, resulting in carbon dioxide emissions caused by replacing parts.
The dismantling and scrapping stage is the last stage in the life cycle of an elevator, as shown in the fourth stage of Figure 1. Considering the environmental impact of waste parts and resources, parts removed from elevators, such as steel, controllers and electronics, can be recycled to lessen environmental pollution and promote resource recycling. A strong foundation for lowering carbon dioxide emissions and developing green elevators has been established with the construction of a carbon accounting framework for the life cycle.

3. Methodology

The carbon dioxide emissions are calculated using three methods: the sampling or direct measurements, the input–output method and the emissions factors [49]. Typically, a field monitoring system or sample collection is used to quantify carbon dioxide emissions through sampling or direct measurement. It is more expensive and generally applicable to the operation stage or specific production processes, but not to the life cycle. The input–output method based on the material balance involves calculating carbon dioxide emissions transforming carbon-containing substances in production, trade and transportation. When the primary technical data, such as the composition and consumption quota of raw materials, auxiliary materials and fuels, are fully grasped throughout the product life cycle, the input–output method applies to the carbon dioxide emission calculation [41]. However, it is difficult to obtain all technical data accurately, resulting in an inaccurate carbon dioxide emissions assessment. The U.S. Environmental Protection Agency (EPA) and the Intergovernmental Panel on Climate Change (IPCC) have both recommended emissions factors. Currently, it is widely used for LCA. Its core concept is that carbon dioxide emissions are computed by multiplying the activity data and the emissions factor with the carbon dioxide emission inventory [50,51]. This approach is used to compute the carbon dioxide emissions of an elevator because it is straightforward to grasp and has a sophisticated accounting system, with a database of activity data and emissions factors. According to this method and the Ecoinvent 3.4 carbon emissions factor database, the carbon accounting framework discussed in the preceding section serves to define the carbon footprint of the elevator, and the carbon dioxide emissions model of the elevator was established as follows:
C = C s c + C c a + C y s + C c b
where C is the total carbon dioxide emissions of the life cycle of the elevator and Csc, Cca, Cys and Ccb are the carbon dioxide emissions generated in the manufacturing, installation, operation and maintenance, and dismantling and scrapping stages, respectively.
The carbon dioxide emissions of an elevator are directly correlated with its size. In other words, the larger the elevator size, the greater the materials and energy consumed in manufacturing. Conversely, the smaller the elevator size and the more energy-efficient the configuration, the lower the carbon dioxide emissions during manufacturing and use. When the life cycle of the elevator is considered, the operational process occupies the largest share of time. The carbon dioxide emissions increase with the age of the equipment. Therefore, the environmental impacts of various elevators cannot be compared using their total carbon dioxide emissions alone. In this study, the functional unit was defined as kgCO2/t·km to enable a similar parameters comparison between different products using the same benchmark. It provides a data reference standard for quantifying green elevators and sustainable elevator applications. The annual carbon dioxide emissions of elevator systems per ton·kilometer were determined as follows:
E = C S r c × x × n d × d o p 1000 × Y × Q
where E represents the annual carbon dioxide emission per ton and kilometer of an elevator, C is the total carbon dioxide emissions during the life cycle of the elevator, Src is the height traveled by the elevator, x is the percentage (%) of the average running distance of the elevator, Q is the rated load percentage, nd is the number of runs per day, dop is the total number of days the elevator runs in a year and Y is the service life of the elevator.

3.1. Carbon Dioxide Emissions Model for Each Stage

It is challenging to directly calculate the total carbon dioxide emissions of an elevator. It can be determined by independently calculating the carbon dioxide emissions of the elevator for each stage, including raw material acquisition, processing, manufacture, transportation and use up until the end of the elevator’s life cycle. In this study, the total carbon dioxide emissions of the elevator system were calculated using the following four components: (1) carbon dioxide emissions from production and manufacturing, (2) carbon dioxide emissions from the installation stage, (3) carbon dioxide emissions from operation and maintenance, and (4) carbon dioxide emissions from dismantling and scrapping.

3.1.1. Production and Manufacturing Stage

The activity data of elevators should be consistent with the relevant data of the elevator, which mostly refers to energy consumption, resource usage and other aspects throughout the manufacturing stage. The carbon dioxide emissions in the manufacturing stage mainly come from raw materials of the elevator parts, manufacturing parts and waste disposal, which was calculated based on the following equation from the IPCC:
C s c = i = 1 n ( M m i × E F m i ) + i = 1 n ( M e i × E F e i ) + i = 1 n ( M s i × E F s i )
where Mmi is the total amount of type i material required in the elevator processing, EFmi is the carbon dioxide emission factor of type i material, Mei is the total amount of type i energy consumed during production, EFei is the carbon dioxide emission factor of type i energy consumed in the elevator, Msi is the total amount of type i waste and EFsi is the carbon dioxide emission factor of type i waste.

3.1.2. Product Installation Stage

Since the uncertainty of the origin of elevator raw materials, this section mainly considers the carbon dioxide emissions emitted during the transportation of the elevator components. The elevator components were divided into ten elevator modules for transportation in order to facilitate unified installation management. These modules included a mechanical module, guiding device, shaft equipment, hanger and safety system, pit, carriage, electrical system, signal system, elevator hall door and door operating system. The carbon dioxide emissions of the transportation were computed using the following equation:
C y s = i = 1 n j = 1 n ( M t i × D t i j × E F t i j )
where Mti represents the total mass of the elevator module I, Dtij represents the transportation distance of the elevator module i in the transportation mode j and EFtij is the carbon dioxide emission factor of the elevator module i in the corresponding transport mode j.
The carbon dioxide emissions from waste recycling were counted negatively in all carbon dioxide emissions at the installation stage. The carbon dioxide emissions in the process were calculated using
C a z = i = 1 n ( M b i × E F b i ) + i = 1 n ( M e i × E F e i ) + i = 1 n ( M s i × E F s i )
where Mbi is the total amount of material i required for packaging during the transportation of the elevator, EFbi is the carbon dioxide emission factor of material i required for packaging and transportation of the elevator, Mei is the total amount of energy i consumed during the installation of the elevator, EFei is the carbon dioxide emission factor of energy i during the installation of the elevator, Msi is the total amount of waste i generated after installation of the elevator and EFsi is the carbon dioxide emission factor of waste i generated after the installation of the elevator.
The carbon dioxide emissions of elevators in the installation phase mainly come from the transportation of elevator parts and packaging, the installation materials and the energy consumption, which was calculated using the following equation:
C c a = C y s + C a z
where Cys is the carbon dioxide emissions generated in the transportation process and Caz is the carbon dioxide emissions generated in the elevator installation process.

3.1.3. Operational and Maintenance Stage

Since the carbon dioxide emissions for the elevator mostly come from electricity consumption, the focus was on the carbon dioxide emissions from the electric energy in this process. The carbon dioxide emissions were calculated as follows:
C s y = M e × EF e × Y
where Me is the total amount of electric energy, EFe is the carbon dioxide emission factor of electric energy and Y is the service life of the elevator.
The primary contributors to the carbon dioxide emissions from maintaining elevator components are the raw materials and energy consumption in the fabrication, delivery of replacement parts and waste disposal.
The carbon dioxide emissions are primarily from maintaining the elevator in regular operation to satisfy essential functions in the operation and maintenance stage. The renovation of the elevator might require 20~30 years. The carbon dioxide emissions of the elevator were calculated based on a service life of 25 years. Elevator components require regular maintenance, inspection and replacement, particularly the replacement of ropes, which need to be updated every 8 years. The carbon dioxide emissions computing formula for this stage is shown as follows:
C y s = C s y + C w h
where Csy is the total operation carbon dioxide emissions from elevator operation and Cwh is the total carbon dioxide emissions from elevator maintenance.

3.1.4. Demolition and Scrapping Stage

According to the previous analysis of the carbon sources in the demolition and scrapping stage, the formula was as follows:
C c b = M e × E F e + i = 1 n j = 1 n ( M t i × D t i j × E F t i j ) + i = 1 n ( M s i × E F s i )
where Me is the electricity consumption in the dismantling process, EFe is the carbon dioxide emission factor corresponding to the electricity consumption, Mti is the total mass of type i waste transportation, Dtij is the transport distance of type i waste in transport mode j and EFtij is the carbon dioxide emission factor corresponding to the transport of type i waste in transport mode j.

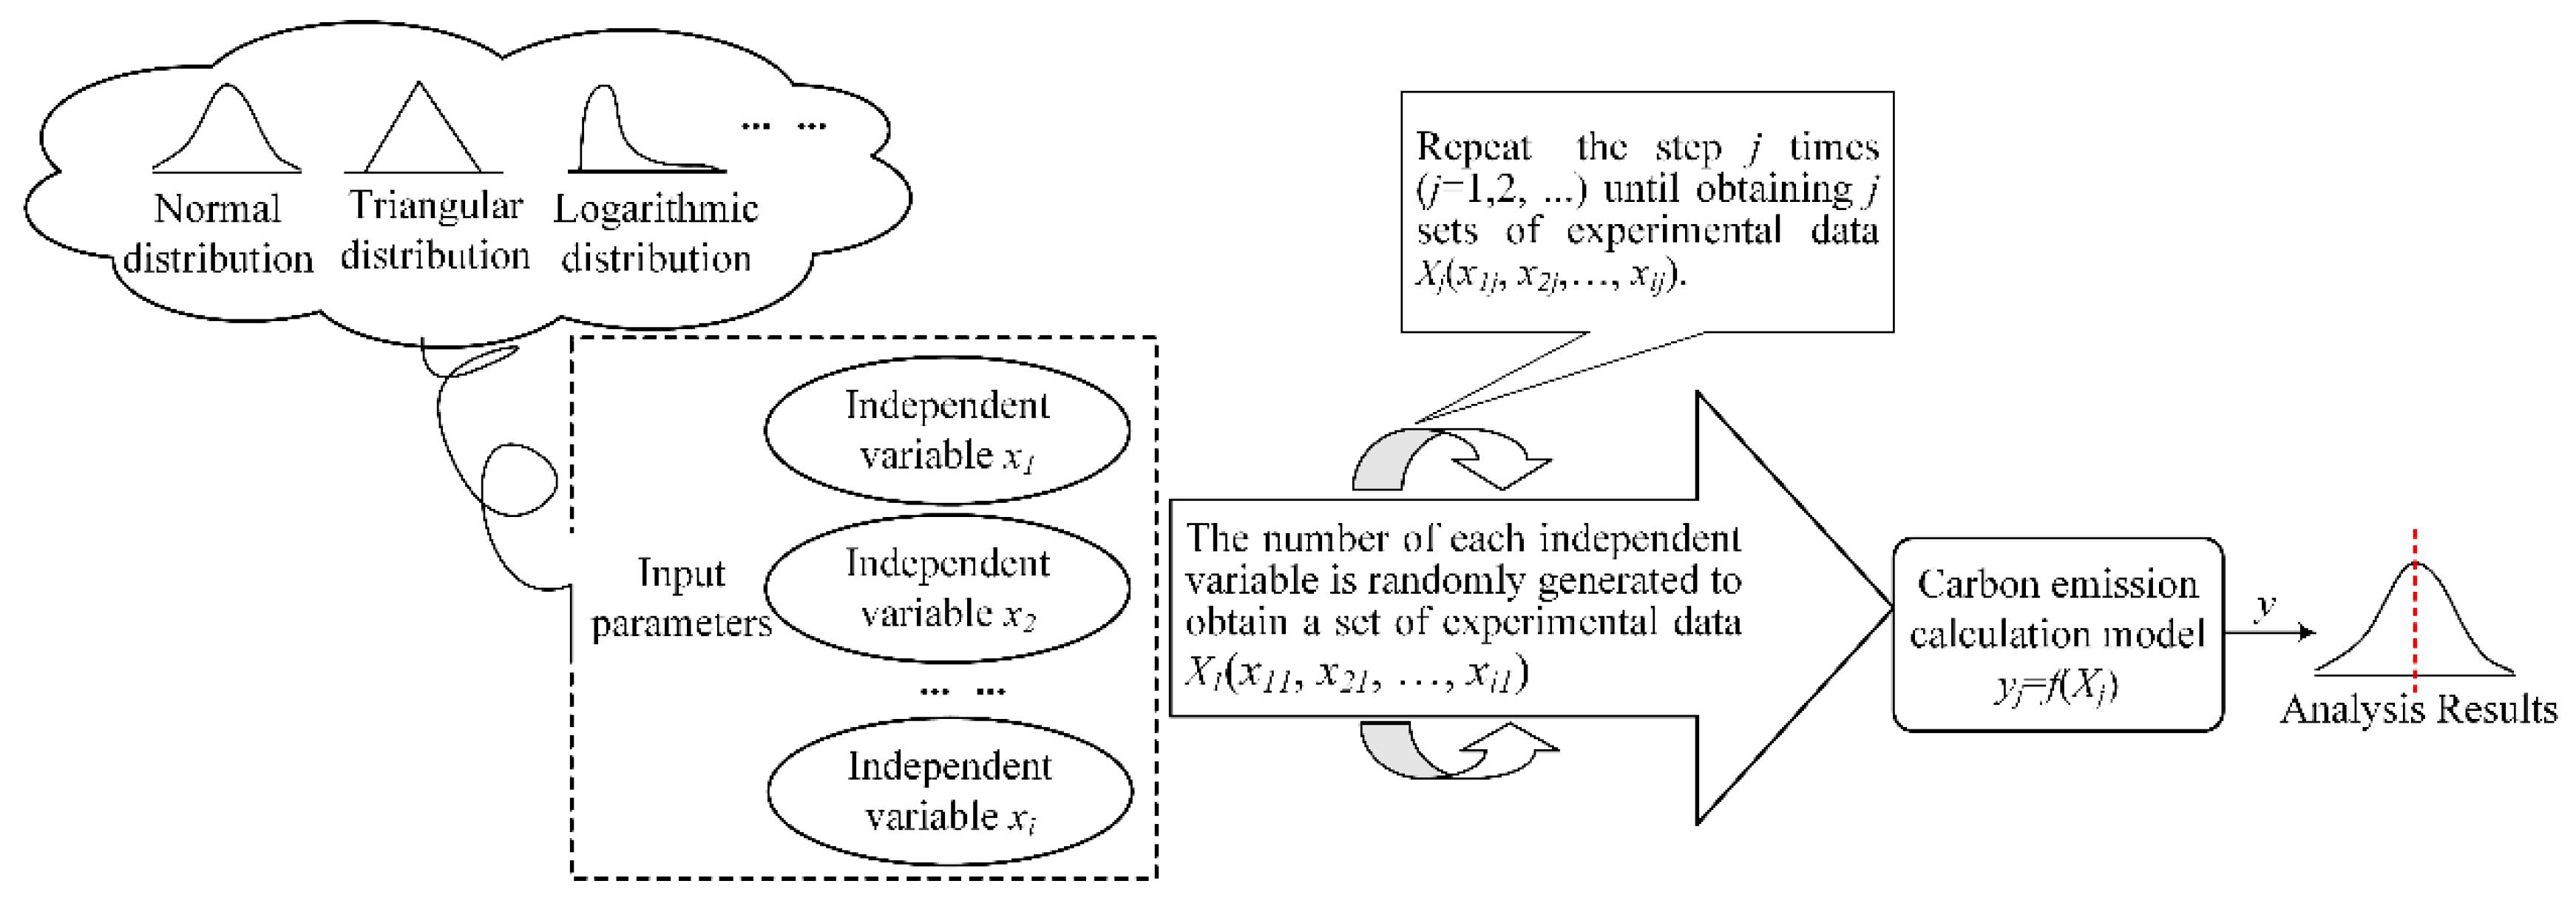
3.2. Sensitivity Analysis

Sensitivity analysis is a methodology for analyzing uncertainty, namely, it studies the quantitative effects of a specific change in relevant factors on a key indicator or a group of critical indicators. The two types of sensitivity analysis are generally global sensitivity analysis (GSA) and local sensitivity analysis (LSA). The former investigates the sensitivity of the entire parameter space within a predefined range of feasible parameters. It can be performed through various methods, such as stepwise regression analysis, mutual information analysis, classification tree analysis and the meta-modeling method [52]. The latter is an objective function for reference that fixes some parameters and studies how conventional methods perturb each parameter. The full description of the GSA increases the risk of over-parameterization, which may pose significant limitations in computational power and parameter uncertainty [45]. LSA has the advantage of simplicity and fewer computation requirements. Therefore, an LSA was used to analyze the effects of changes in various inputs on the total life cycle CO2 emissions of an elevator in this study. The main idea is to change only one factor at a time and keep other factors constant so that the degree of change of the influencing factor on the outcome variable can be analyzed. The model was assumed to be expressed as y = f(x1, x2, …, xn) (x is an influential factor) and was calculated as follows [43]:
s = y ( x 1 , , x i + x i , x n ) y ( x 1 , , x i , x n ) y ( x 1 , , x i , x n ) x i x i
where xi is the ith influential factor and Δxi is the change value of the ith influential factor.
When the input variables are changed individually, the sensitivity is defined as the change value in the output relative to the original scenario. The original values of each influencing factor were floated separately by ±10% and ±20%, and the other parameters were constant. The total carbon dioxide emissions of the elevator were recalculated to analyze the sensitivity magnitude of the crucial variables. The sensitivity parameters were determined by ranking the sensitivity values of the carbon dioxide emissions. The Monte Carlo simulation method was used to analyze how critical the uncertainty of important sensitivity parameters affects the credibility of evaluation results [53]. The explicit steps were as follows:
(1) The computation model for the life cycle carbon dioxide emissions was established using the Crystal Ball software, v. 11.1.2.4.
(2) The independent variables xi were assumed to be the characterization factors, and statistical analysis and sensitivity analysis were used to determine the main input parameters of the Monte Carlo analysis model.
(3) The probability distribution function of each independent variable xi, such as the normal distribution and triangular distribution, was determined based on empirical and survey data.
(4) A separate number for each independent variable was generated successively by the computer to form a set of experimental data X1(x11, x21, …, xi1) in accordance with the provided probability distribution function. This process was repeated j times (j = 1, 2, …) to obtain j sets of experimental data Xj(x1j, x2j, …, xij).
(5) The generated experimental data of each group Xj(x1j, x2j, …, xij) was substituted into the calculation model of the life cycle carbon dioxide emissions, which recorded the total carbon dioxide emissions yj from each calculation.
(6) A statistical analysis of the total carbon dioxide emissions y(y1, y2, …, yj) was performed to obtain the probability distribution. There were similar statistical characteristics of the total CO2 emissions between both the simulation and the actual situation. Figure 2 depicts the Monte Carlo simulation method.

4. Life Cycle Inventory Analysis

This section gives the results of an analysis of the carbon dioxide emission performance of the traction elevator with energy-saving feedback mechanism manufactured by T Elevator Company, which is one of the top ten firms worldwide.
The carbon dioxide emissions of the life cycle for the traction elevator are calculated by the above model. The technical parameters of the traction elevator are shown in Appendix A. The elevator was used in the Kunshan area of Jiangsu Province, China. According to the standard ISO 25745 Part 2 [54], it can be known that the number of elevator operations is 300 times a day based on the application category of the elevator. The percentage of average running distance and the percentage of the rated load of elevators are 49% and 4.5%, respectively. The service life of the elevator is 25 years.
The data acquisition of each stage of the elevator followed the manufacturer’s information, design documents, and site research in order to ensure data quality requirements. Furthermore, the data selection followed the international standards ISO 14040:2006 [41] and ISO 14044:2006 [48] and the Chinese national standard GB/T24041-2000 [55], which meets the actual situation in China.

4.1. Production and Manufacturing Stage

4.1.1. Production Stage

Raw material data was sourced from the suppliers and manufacturers, which was obtained through design documentation. The bulk of the raw materials were transported to the manufacturing facilities in nearby cities, which had a lower carbon footprint and consumption. As a result, this was not taken into consideration in this study. The quantities of various raw materials were obtained from design documents and actual investigation. The carbon emission factors for the raw materials of the elevator in the first stages were obtained from the Ecoinvent 3.4 carbon emissions factor database [56]. The carbon dioxide emission factors and quantity of the raw materials are shown in Table 1.

4.1.2. Manufacturing Stage

The carbon dioxide emissions were analyzed using the inputs and outputs of Figure 1 in the manufacturing stage. In addition to the raw materials, the inputs included electricity consumption, transportation and carbon dioxide emissions from auxiliary materials in this process. The carbon dioxide emissions of raw materials were calculated in the production stage. Besides the auxiliary materials, such as lubricating oil and welding, other auxiliary materials were used in low volumes and numbers, and thus, their carbon emissions were not considered for this stage. The activity level information was used for the estimation of the carbon dioxide emissions from auxiliary materials and electricity consumption. The data for the level of activities in this stage were obtained from the actual statistics of the factory. Their carbon emission factors were obtained from the Ecoinvent 3.4 carbon emission factor database. The carbon dioxide emissions on the output side of the manufacturing stage mostly came from the disposal of waste. However, the carbon dioxide emissions generated during the recycling process of copper, iron and aluminum needed to be subtracted. Therefore, the quantity of the recyclable material is shown as a negative value. The specific quantity is shown in Appendix B.

4.2. Installation Stage

The CO2 emissions of the installation stage derive from the consumption of packaging materials, transportation of components and waste generated after completion of the installation. The carbon dioxide emission factors and quantity of packaging materials in the installation stage stem from plywood, cardboard, plastic and so on. Each component/module of the elevator needs to be transported to a designated distribution center for final uniform distribution. The carbon dioxide emissions factor of electricity consumption was 0.5839 kgCO2/(kW·h). The carbon dioxide emissions factor for transportation by a freight truck with a 32-ton rated load was 0.0904 kgCO2/(t·km). Their carbon emission factors were obtained from the Ecoinvent 3.4 carbon emission factor database. The horizontal activity data, such as the transport weight and range of the elevator modules, were obtained from the designated distribution center to the installation site, the Refer datas to Appendix C. The level activity data for average power consumption was 45 kW·h using the electricity meter in the installation stage. As the distance of material transportation is unpredictable, it is challenging to compute the carbon dioxide emissions. In addition, its carbon dioxide emissions have little impact on the environment. Therefore, the carbon dioxide emissions were not considered. Most discarded packaging material was incinerated. Since among the packaging material, only steel is recycled, the quantity of steel was also expressed by the negative value. In other words, CO2 emissions from recycled steel should be subtracted. The quantity, carbon dioxide emission factors and treatment methods of packaging waste are shown in Table 2.

4.3. Operational and Maintenance Stage

The operation energy consumption of the elevator was calculated using the hybrid method, which was monitored on-site using the FLUKE-1735 power recorder. The annual energy consumption was calculated using the standard (ISO) 25745-2:2015 [54]. The operating energy consumption included the energy consumed by both the reference route and the short route. To determine the operating energy consumption of the reference route, it must be tested at least 10 times. The total measured energy was then divided by the number of cycles to obtain an average value for one cycle on the reference route. The short-route energy consumption could be directly measured. The total energy of the measured short route was divided by the number of cycles to obtain the short route energy consumption. The energy consumption of the elevator was considered under no-load conditions. As the length of the traction wire rope on both sides (car side and counterweight side) changed during lifting and lowering movements, it had some influence on the elevator load. Therefore, it was necessary to correct the operation consumption of the elevator using a correction coefficient. The correction coefficient was 0.6 or 0.7. Annual energy consumption was 2867.12 KW·h after the correction. The carbon dioxide emission factor of electric energy was still 0.5839 kgCO2/KW·h according to the Ecoinvent 3.4 carbon emissions factor database.
The traction wire rope must be maintained every six months and replaced with new ones every eight years. Therefore, the carbon emissions during maintenance primarily derive from the energy consumption of the replacement ropes. The carbon emissions of the maintenance stage were calculated in the same manner as those of the manufacturing and installation stage. For the carbon dioxide emissions factor of replacement, one can refer to the above study. The total carbon dioxide emissions were 450.46 kgCO2.

4.4. Demolition and Scrapping Stage

Since the end-of-life data for elevators is not readily available, the uncertainty parameters involved in the carbon dioxide emissions calculation were assumed as follows:
  • Assume the distance of waste transportation to the waste treatment plant was 200 km;
  • A total of 90% of the materials used in the products can be recycled.
According to the actual investigation, the level activity data of electricity consumption of dismantling equipment was about 45 kW·h. The carbon dioxide emissions were 26.28 kgCO2. The transportation of abandoned elevators and the replacement of rope were also included in the calculation of carbon dioxide emissions during disposal.
The total weight of the elevator and the rope were 7927.3 kg and 150 kg, respectively. The carbon dioxide emissions factor of transportation was consistent with what was previously stated. The quantity of waste and recyclable waste was obtained from the statistical data of the field survey and the survey document of the KONE company. Table 3 displays the inputs for the carbon dioxide emission calculation of waste treatment. The quantity of the material that was recycled is shown as a negative quantity at the manufacturing stage. As above, the quantity of the material that was recycled is shown by the negative quantity at the end of the life cycle.

5. Life Cycle Carbon Dioxide Emissions Assessment

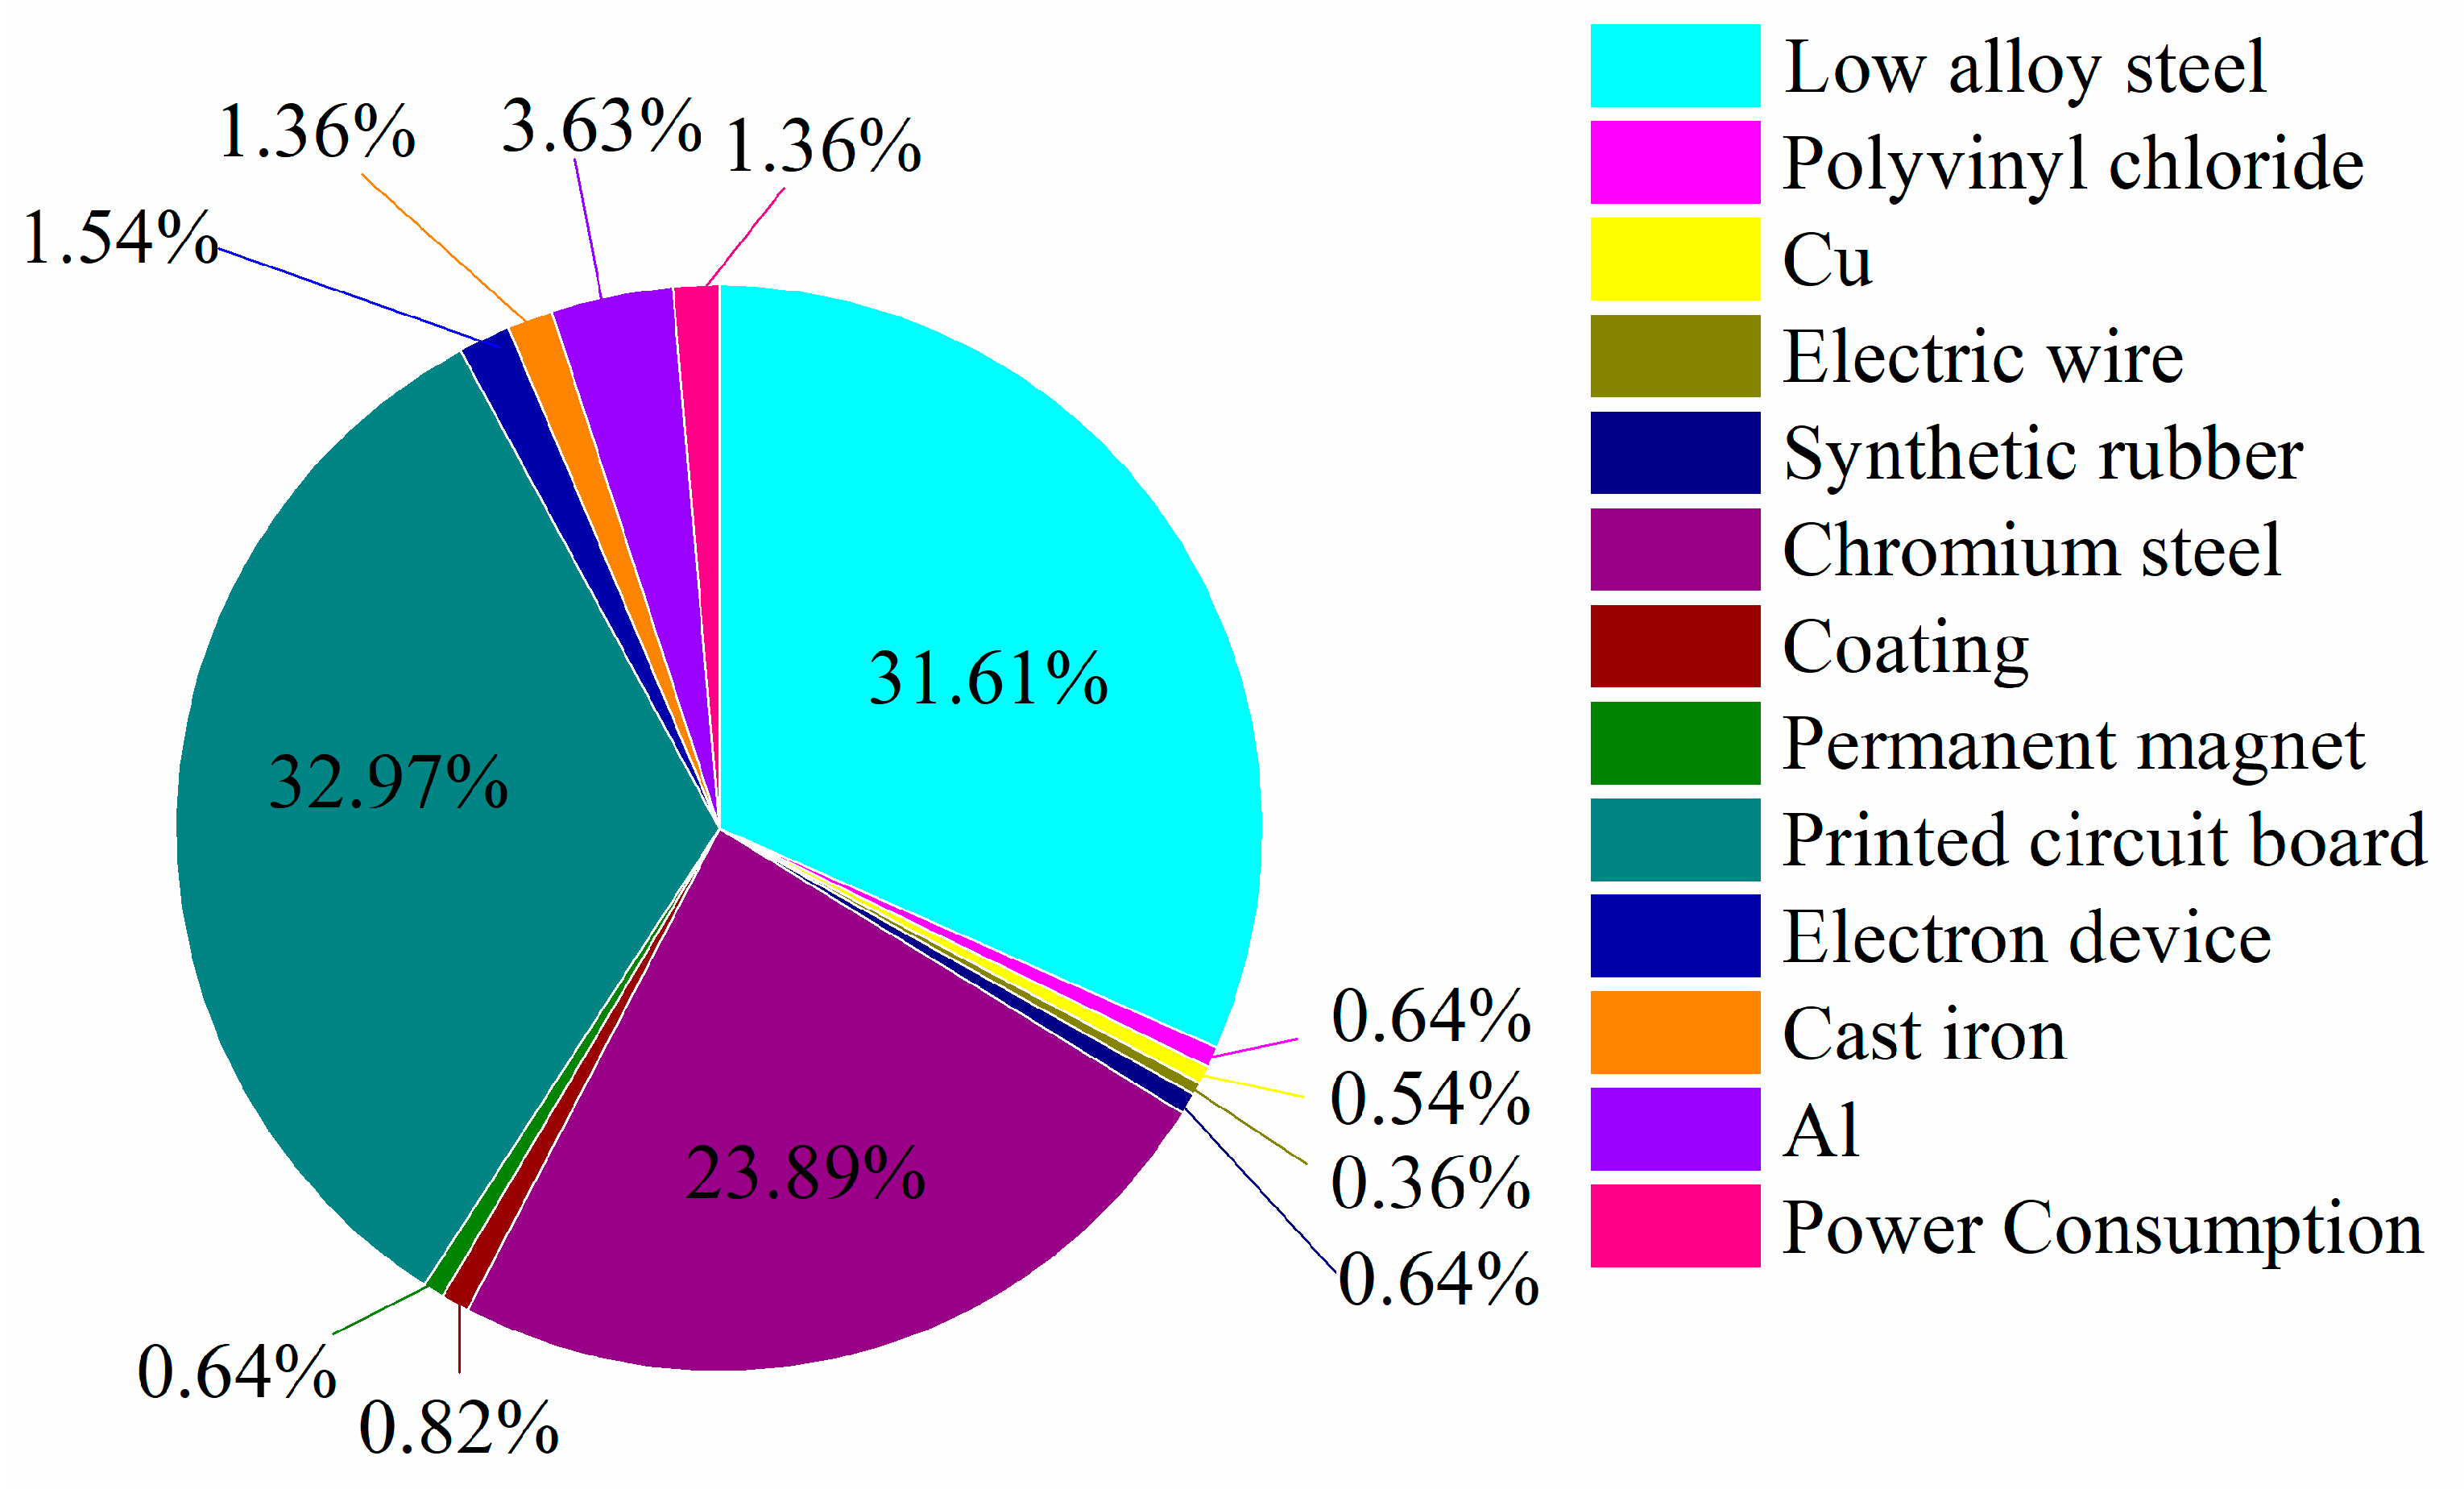
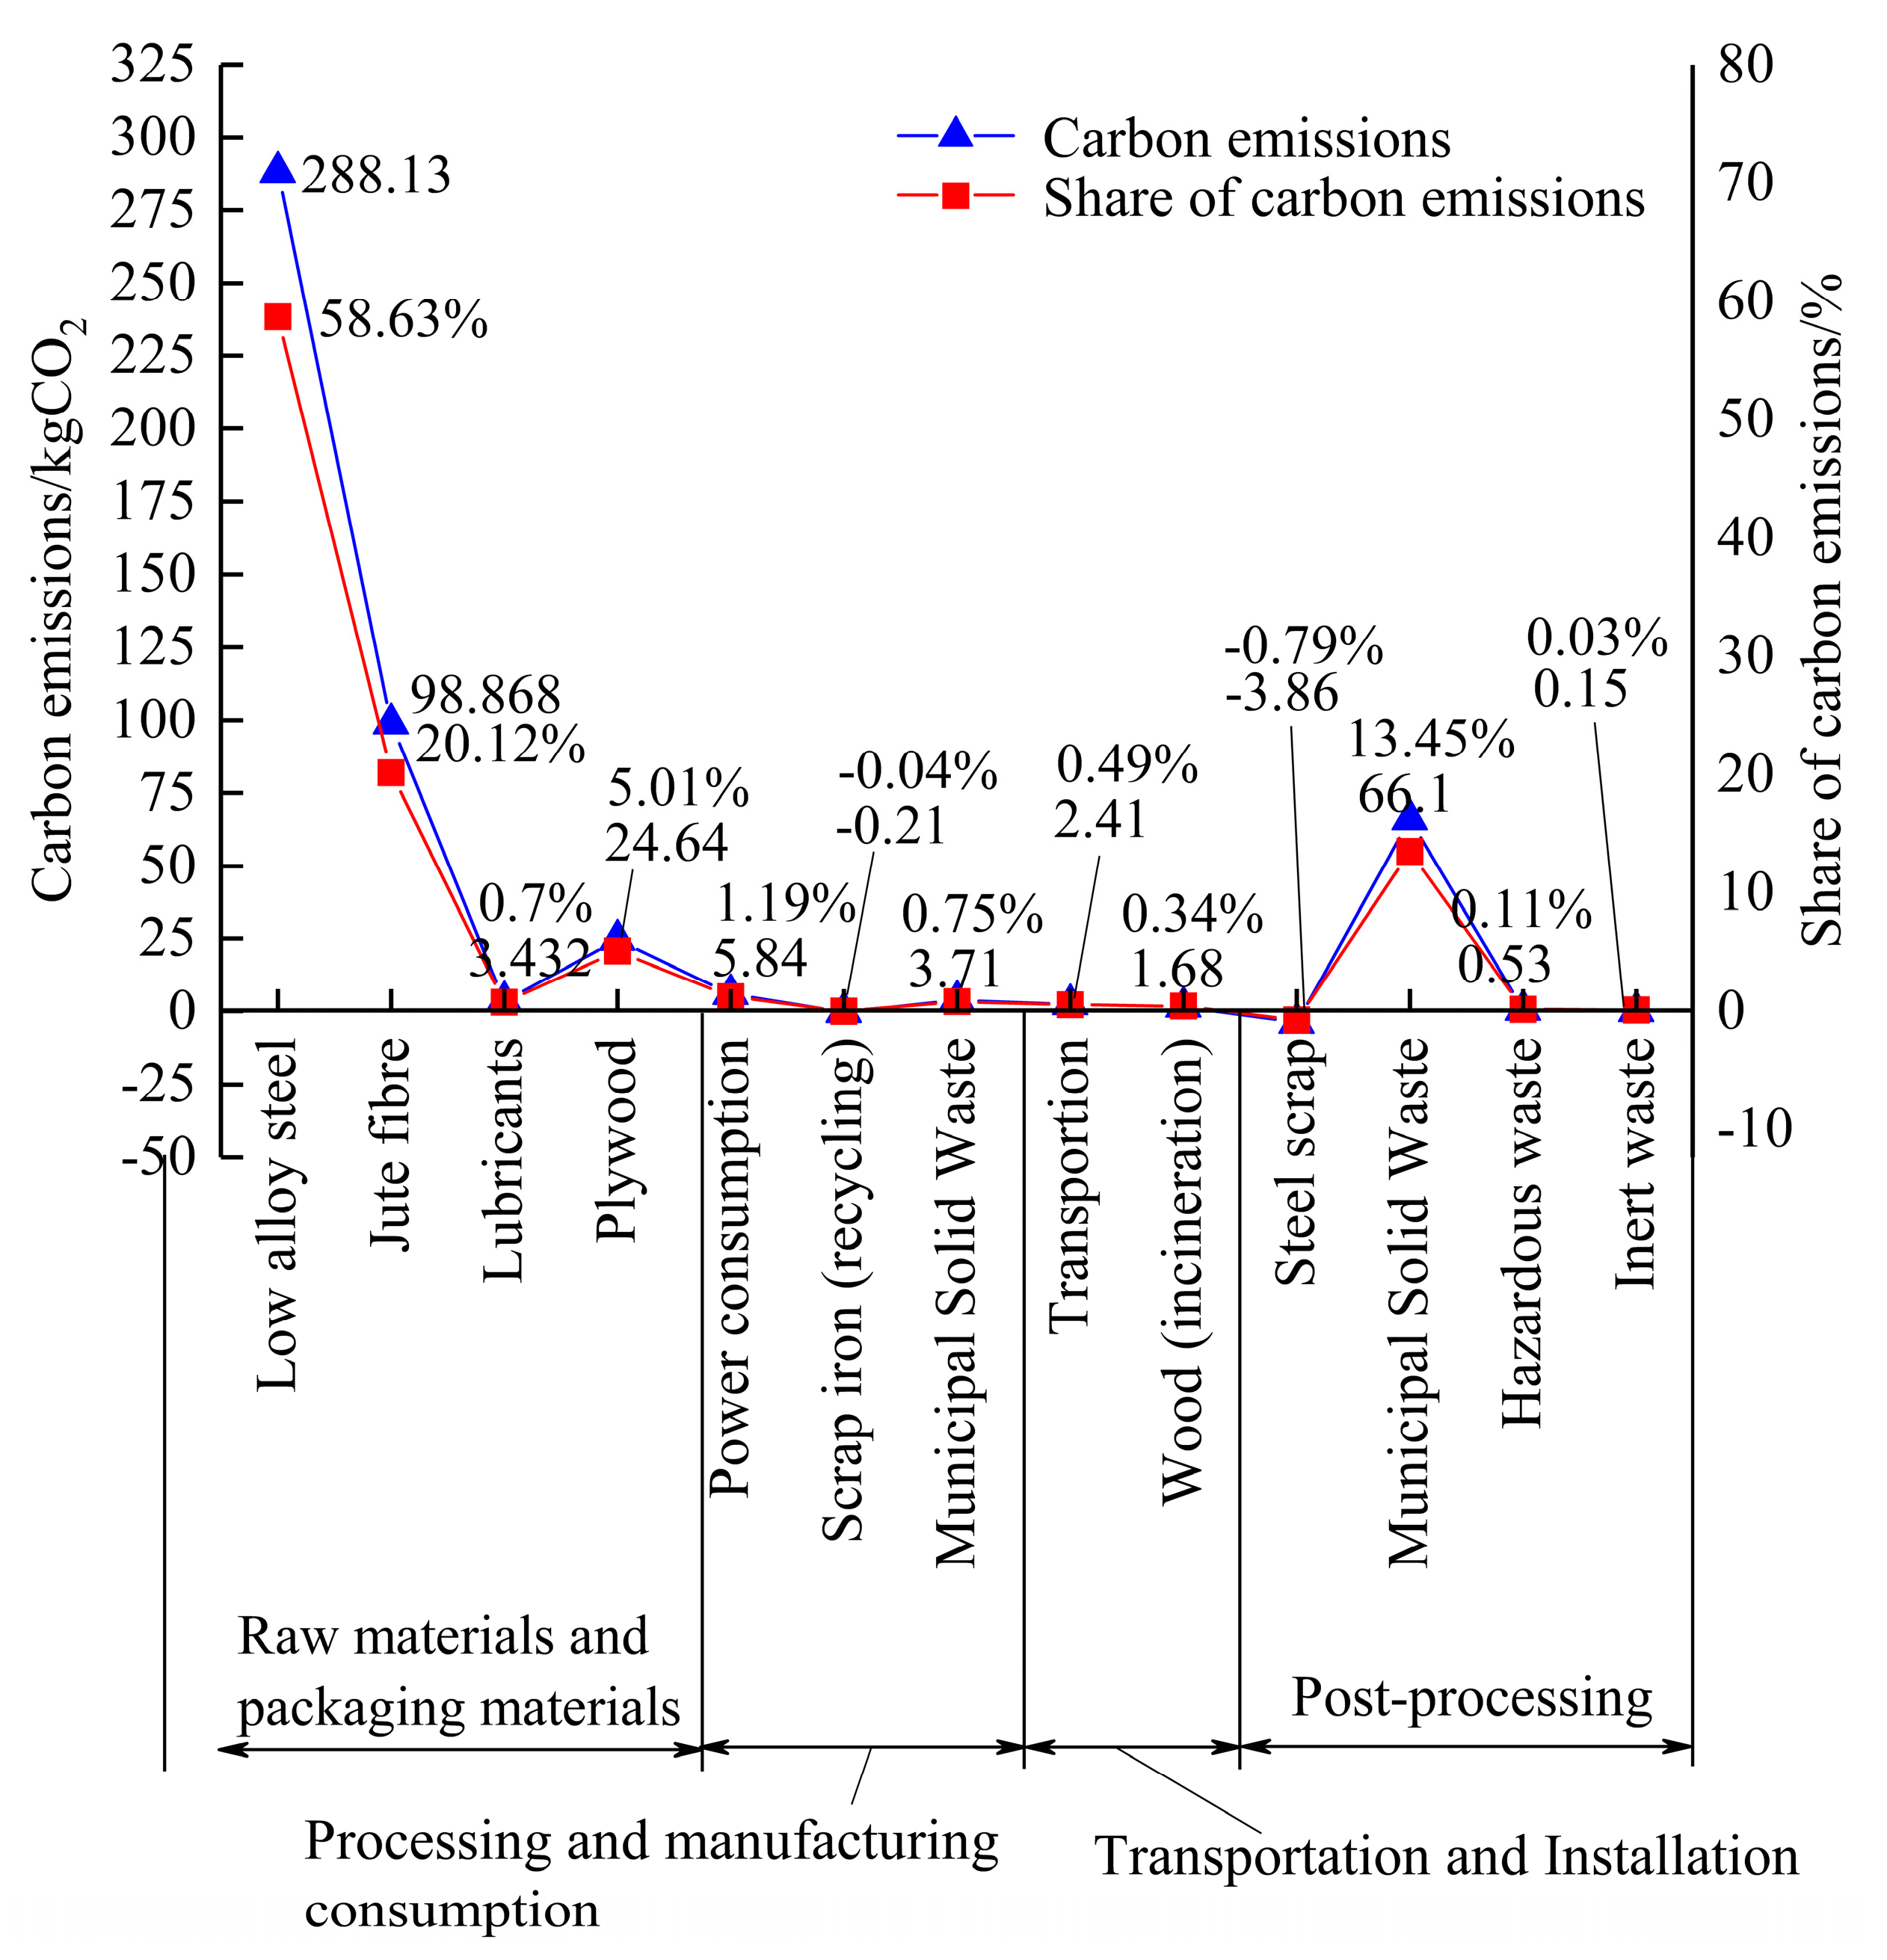
5.1. Carbon Dioxide Emissions Composition in the Manufacturing Stage

Figure 3 displays the percentage of carbon dioxide emissions during the production process. It shows that the total carbon dioxide emissions of the printed circuit board and low-alloy steel were greater than 64% of the carbon footprint of all consumables. The sum of carbon dioxide emissions from three types of consumables, namely, printed circuit boards, low-alloy steel and chromium steel, reached 88.45%, while the carbon dioxide emissions from consumables, such as aluminum and electricity consumption, only accounted for 3.6% and 1.34% of carbon dioxide emissions, respectively, during this stage. After conversion to the functional unit, the carbon emissions of low alloy steel, chromium steel and printed circuit boards were 3.48 kgCO2/t·km, 2.63 kgCO2/t·km and 3.63 kgCO2/t·km, respectively. Therefore, the carbon dioxide emissions during this stage focused on these three raw materials.

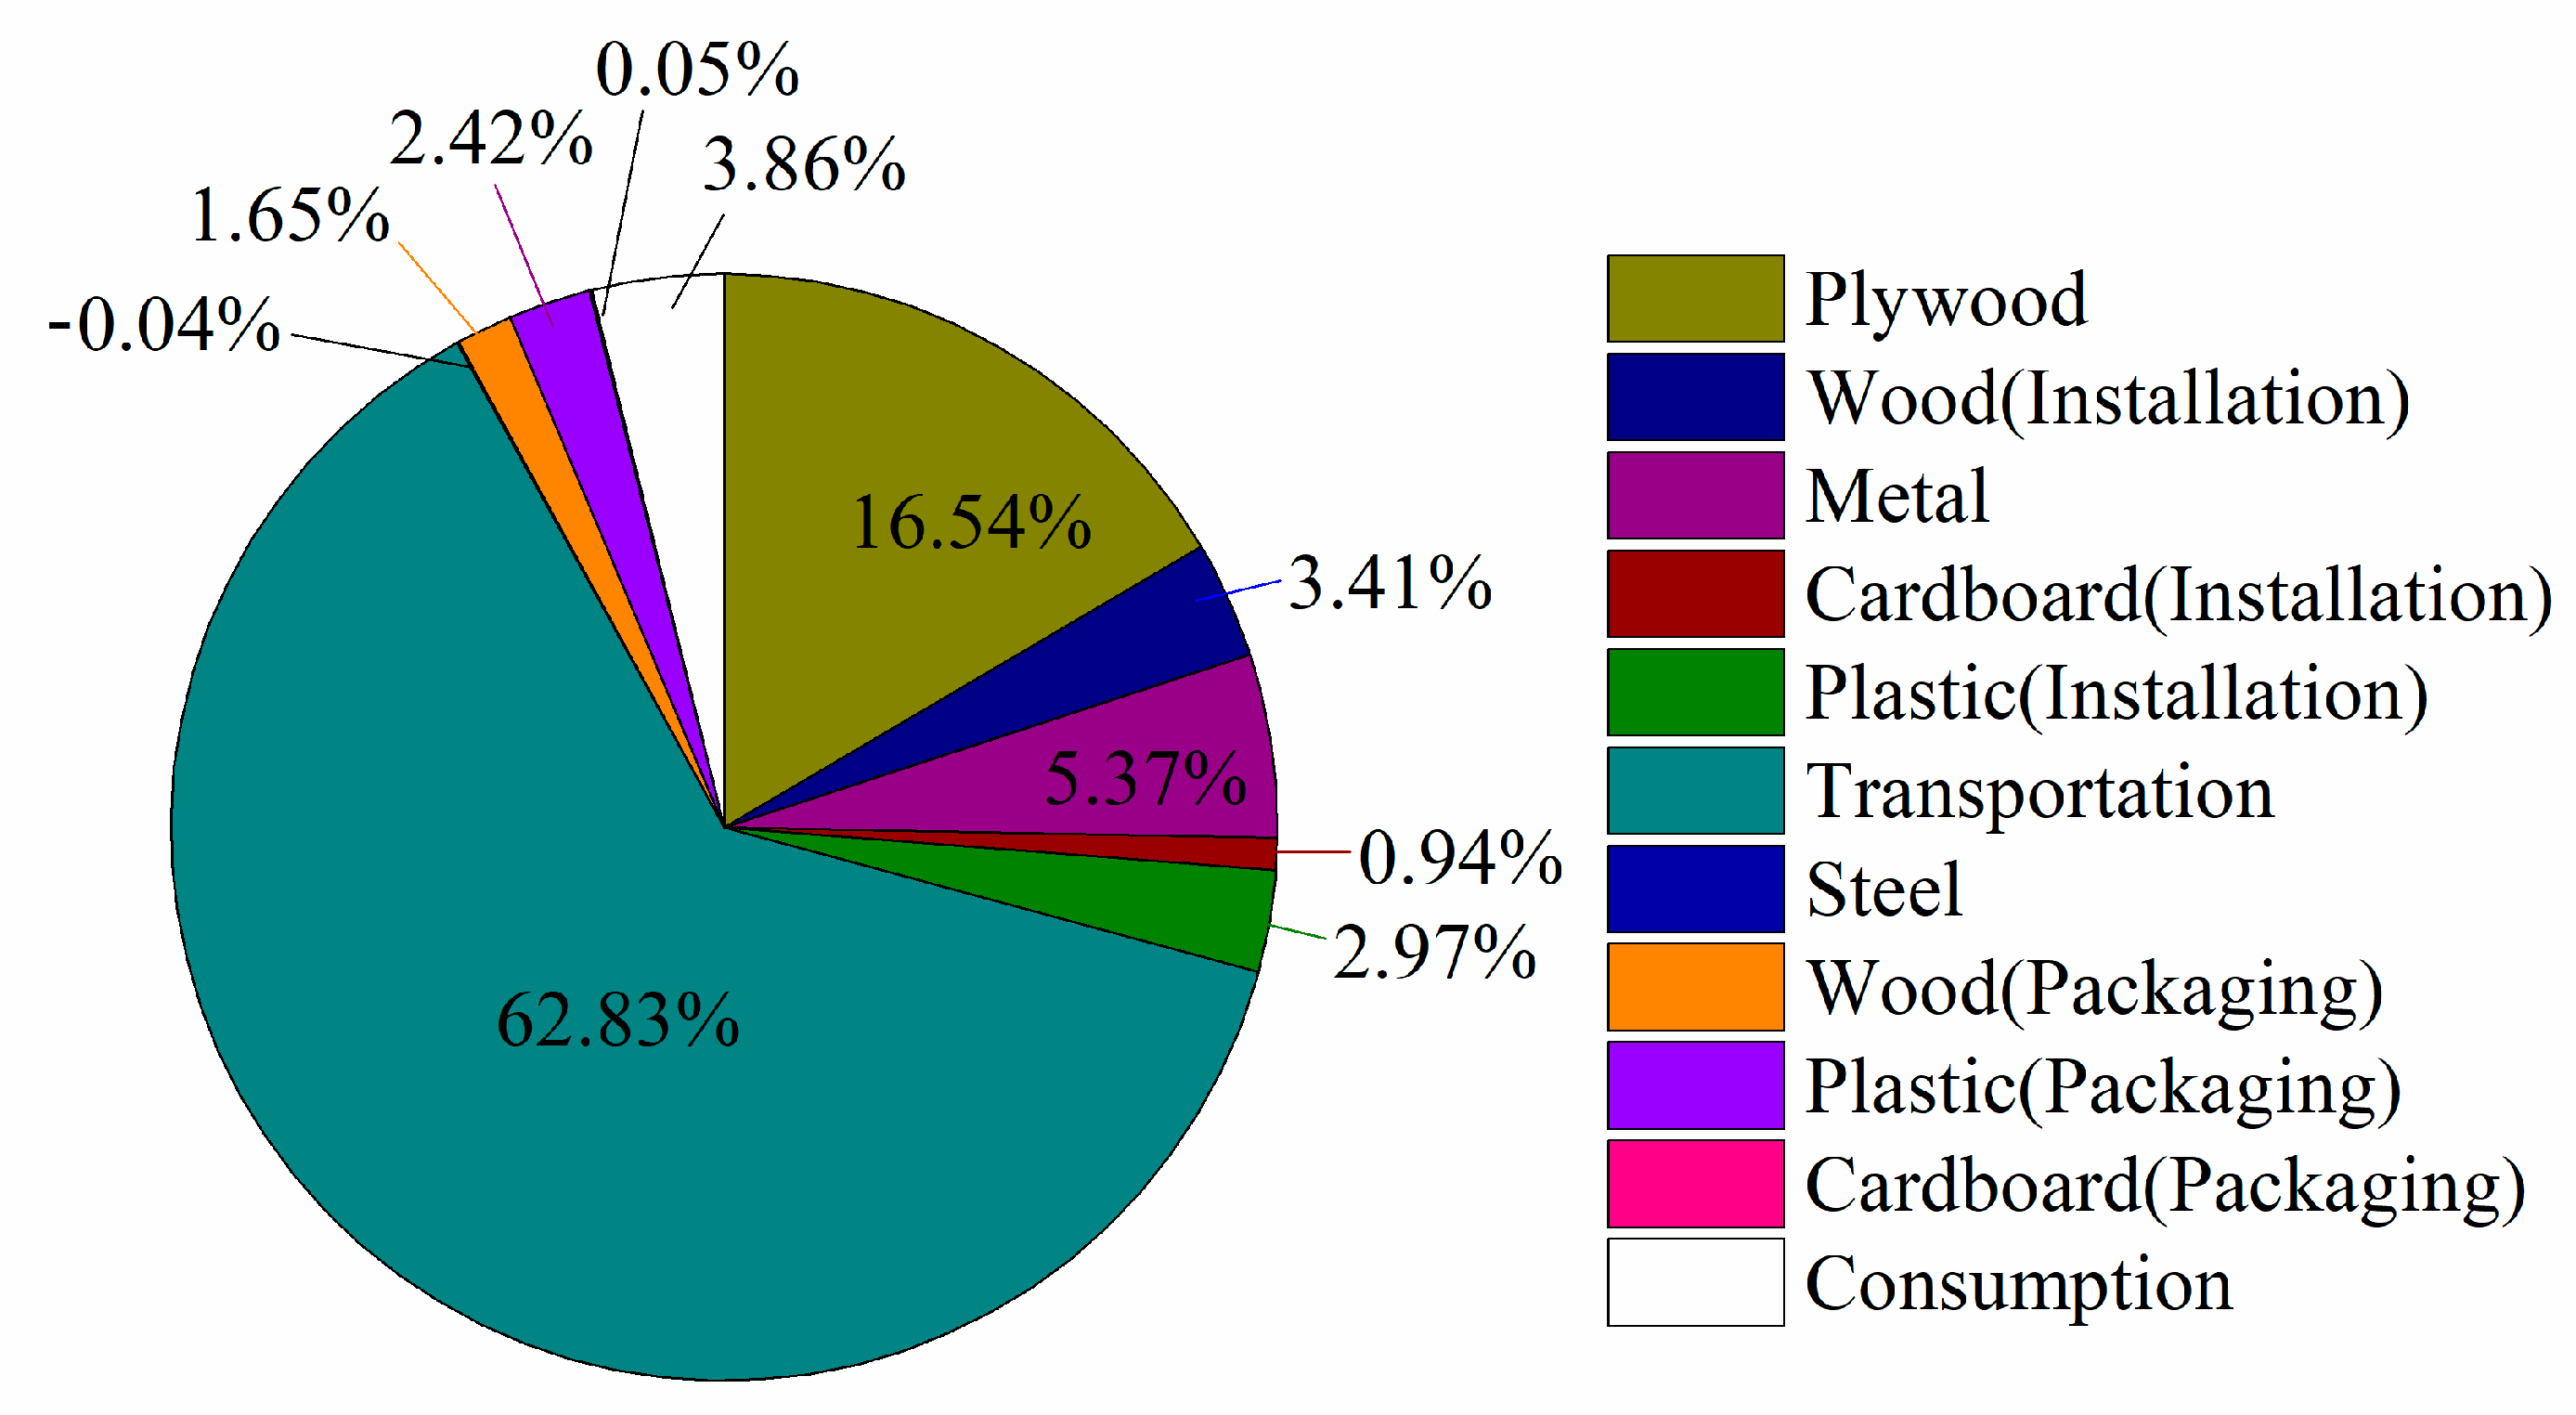
5.2. Carbon Dioxide Emissions Composition in Product Installation Stage

Figure 4 depicts the carbon dioxide emission percentage of the product installation stage. It was found that the carbon dioxide emissions from the transportation part of the elevator accounted for a larger share of the carbon dioxide emissions, which was 62.83%. The guiding device of the elevator and the parts module of the pit contributed significantly to the carbon emissions during transportation, which produced carbon emissions of 206.15 kgCO2 and 138.63 kgCO2, respectively. The largest percentage of carbon dioxide emissions from transportation was due to the heavier weight of the elevator modules and longer transportation distances. Plywood was a close second in terms of the percentage of carbon dioxide emissions during this stage.

5.3. Composition of Carbon Dioxide Emissions in the Operation and Maintenance Stage

Based on the energy consumption of the experimental test, the final annual energy consumption of the elevators was 2867.12 9 kW·h/year, which emitted 42303.23 kgCO2. The baseline carbon emissions of the operational stage were 15.41 kgCO2/t·km. The carbon dioxide emissions accounted for 98.91% of the total carbon dioxide emissions during this stage. Moreover, carbon dioxide emissions in the maintenance stage only accounted for 1.09%. Figure 5 depicts the carbon dioxide emissions and their proportion of all carbon sources at the maintenance stage. It shows that the replacement parts in the maintenance process caused unavoidable carbon dioxide emissions from the raw materials, manufacturing, installation and transportation. The carbon dioxide emissions of low-alloy steel in the process accounted for 58.63%, about 288.13 kgCO2, whereas waste and auxiliary materials, such as lubricants and plywood, had lower carbon footprints

5.4. Composition of Carbon Dioxide Emissions during the Demolition and Scrapping Stage

Figure 6 depicts percentage of the carbon dioxide emissions in the demolition and scrapping stage. Recycling metal material resulted in a reduction of 195.21 kgCO2 in carbon dioxide emissions, or −58.58% of the total emissions. Waste transport produced 145.5 kgCO2, which accounted for 43.66%. The carbon dioxide emissions from plastic, rubber and wood incineration were 345.17 kgCO2. The carbon dioxide emissions from inert and hazardous waste landfills only accounted for 19.03%. Thus, this shows that the carbon reduction from recycling waste was extremely low. Improving waste recycling provides a critical idea to effectively reduce carbon dioxide emissions throughout the life cycle of the elevators.

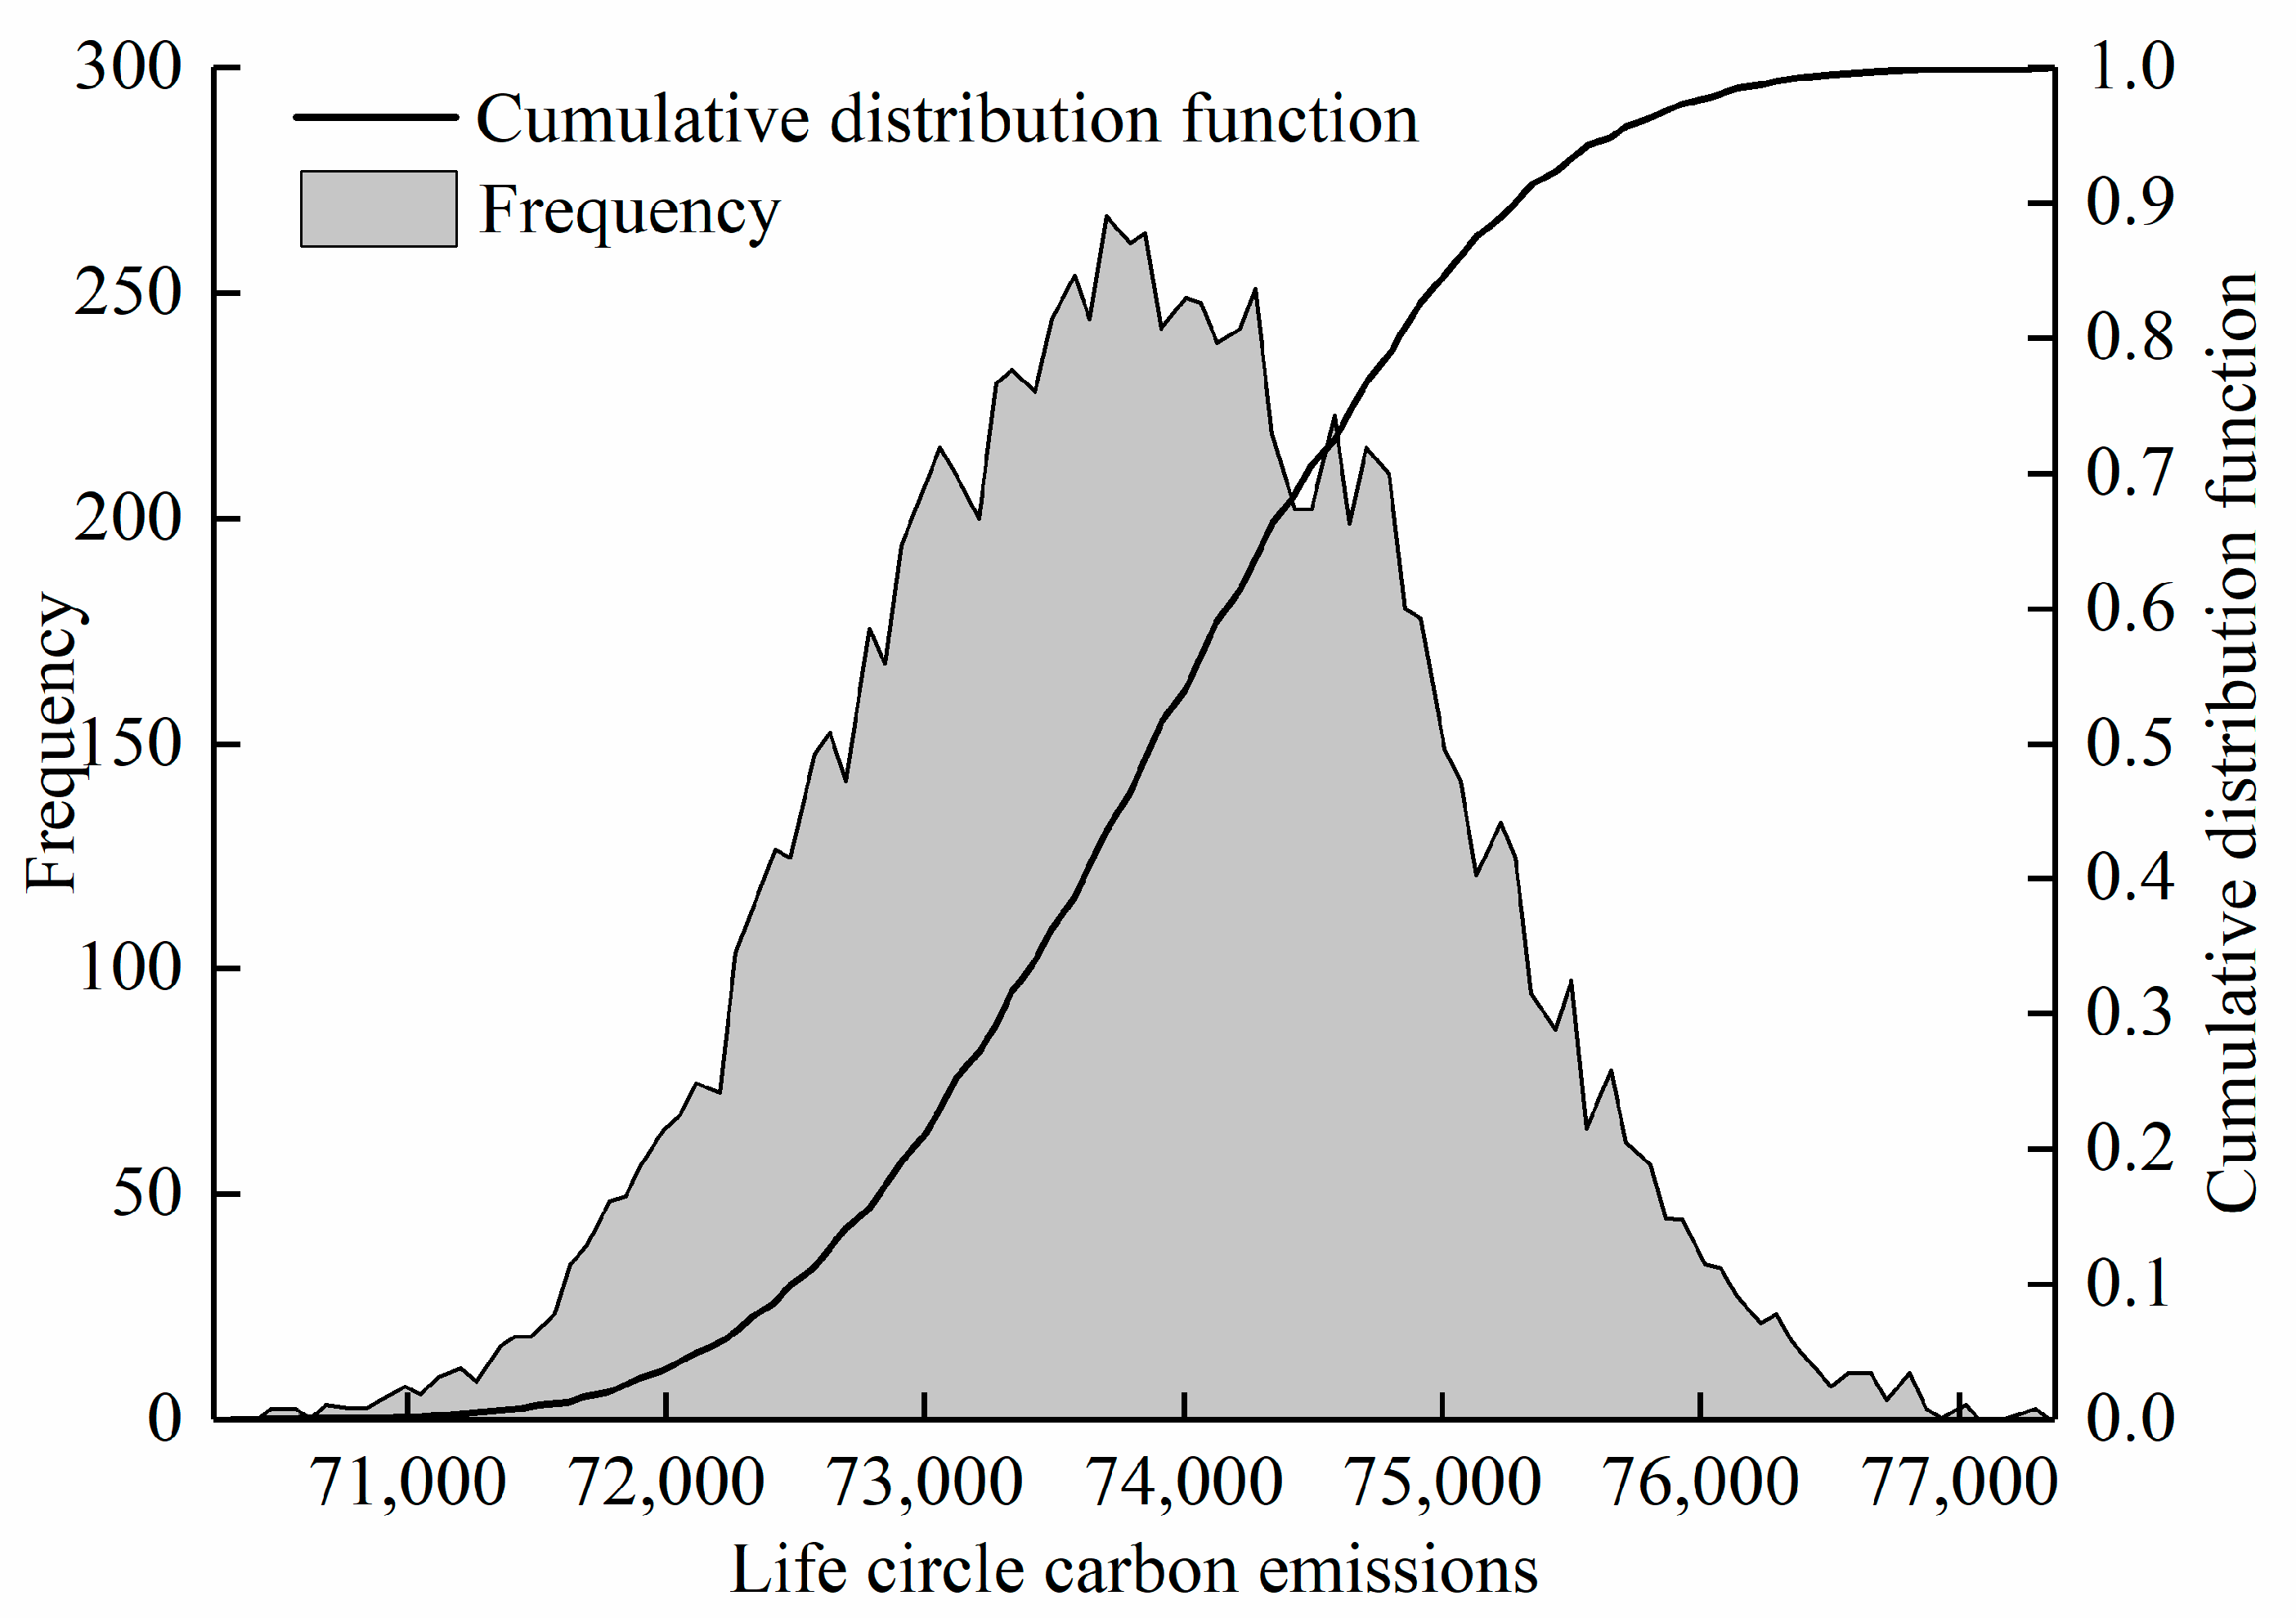
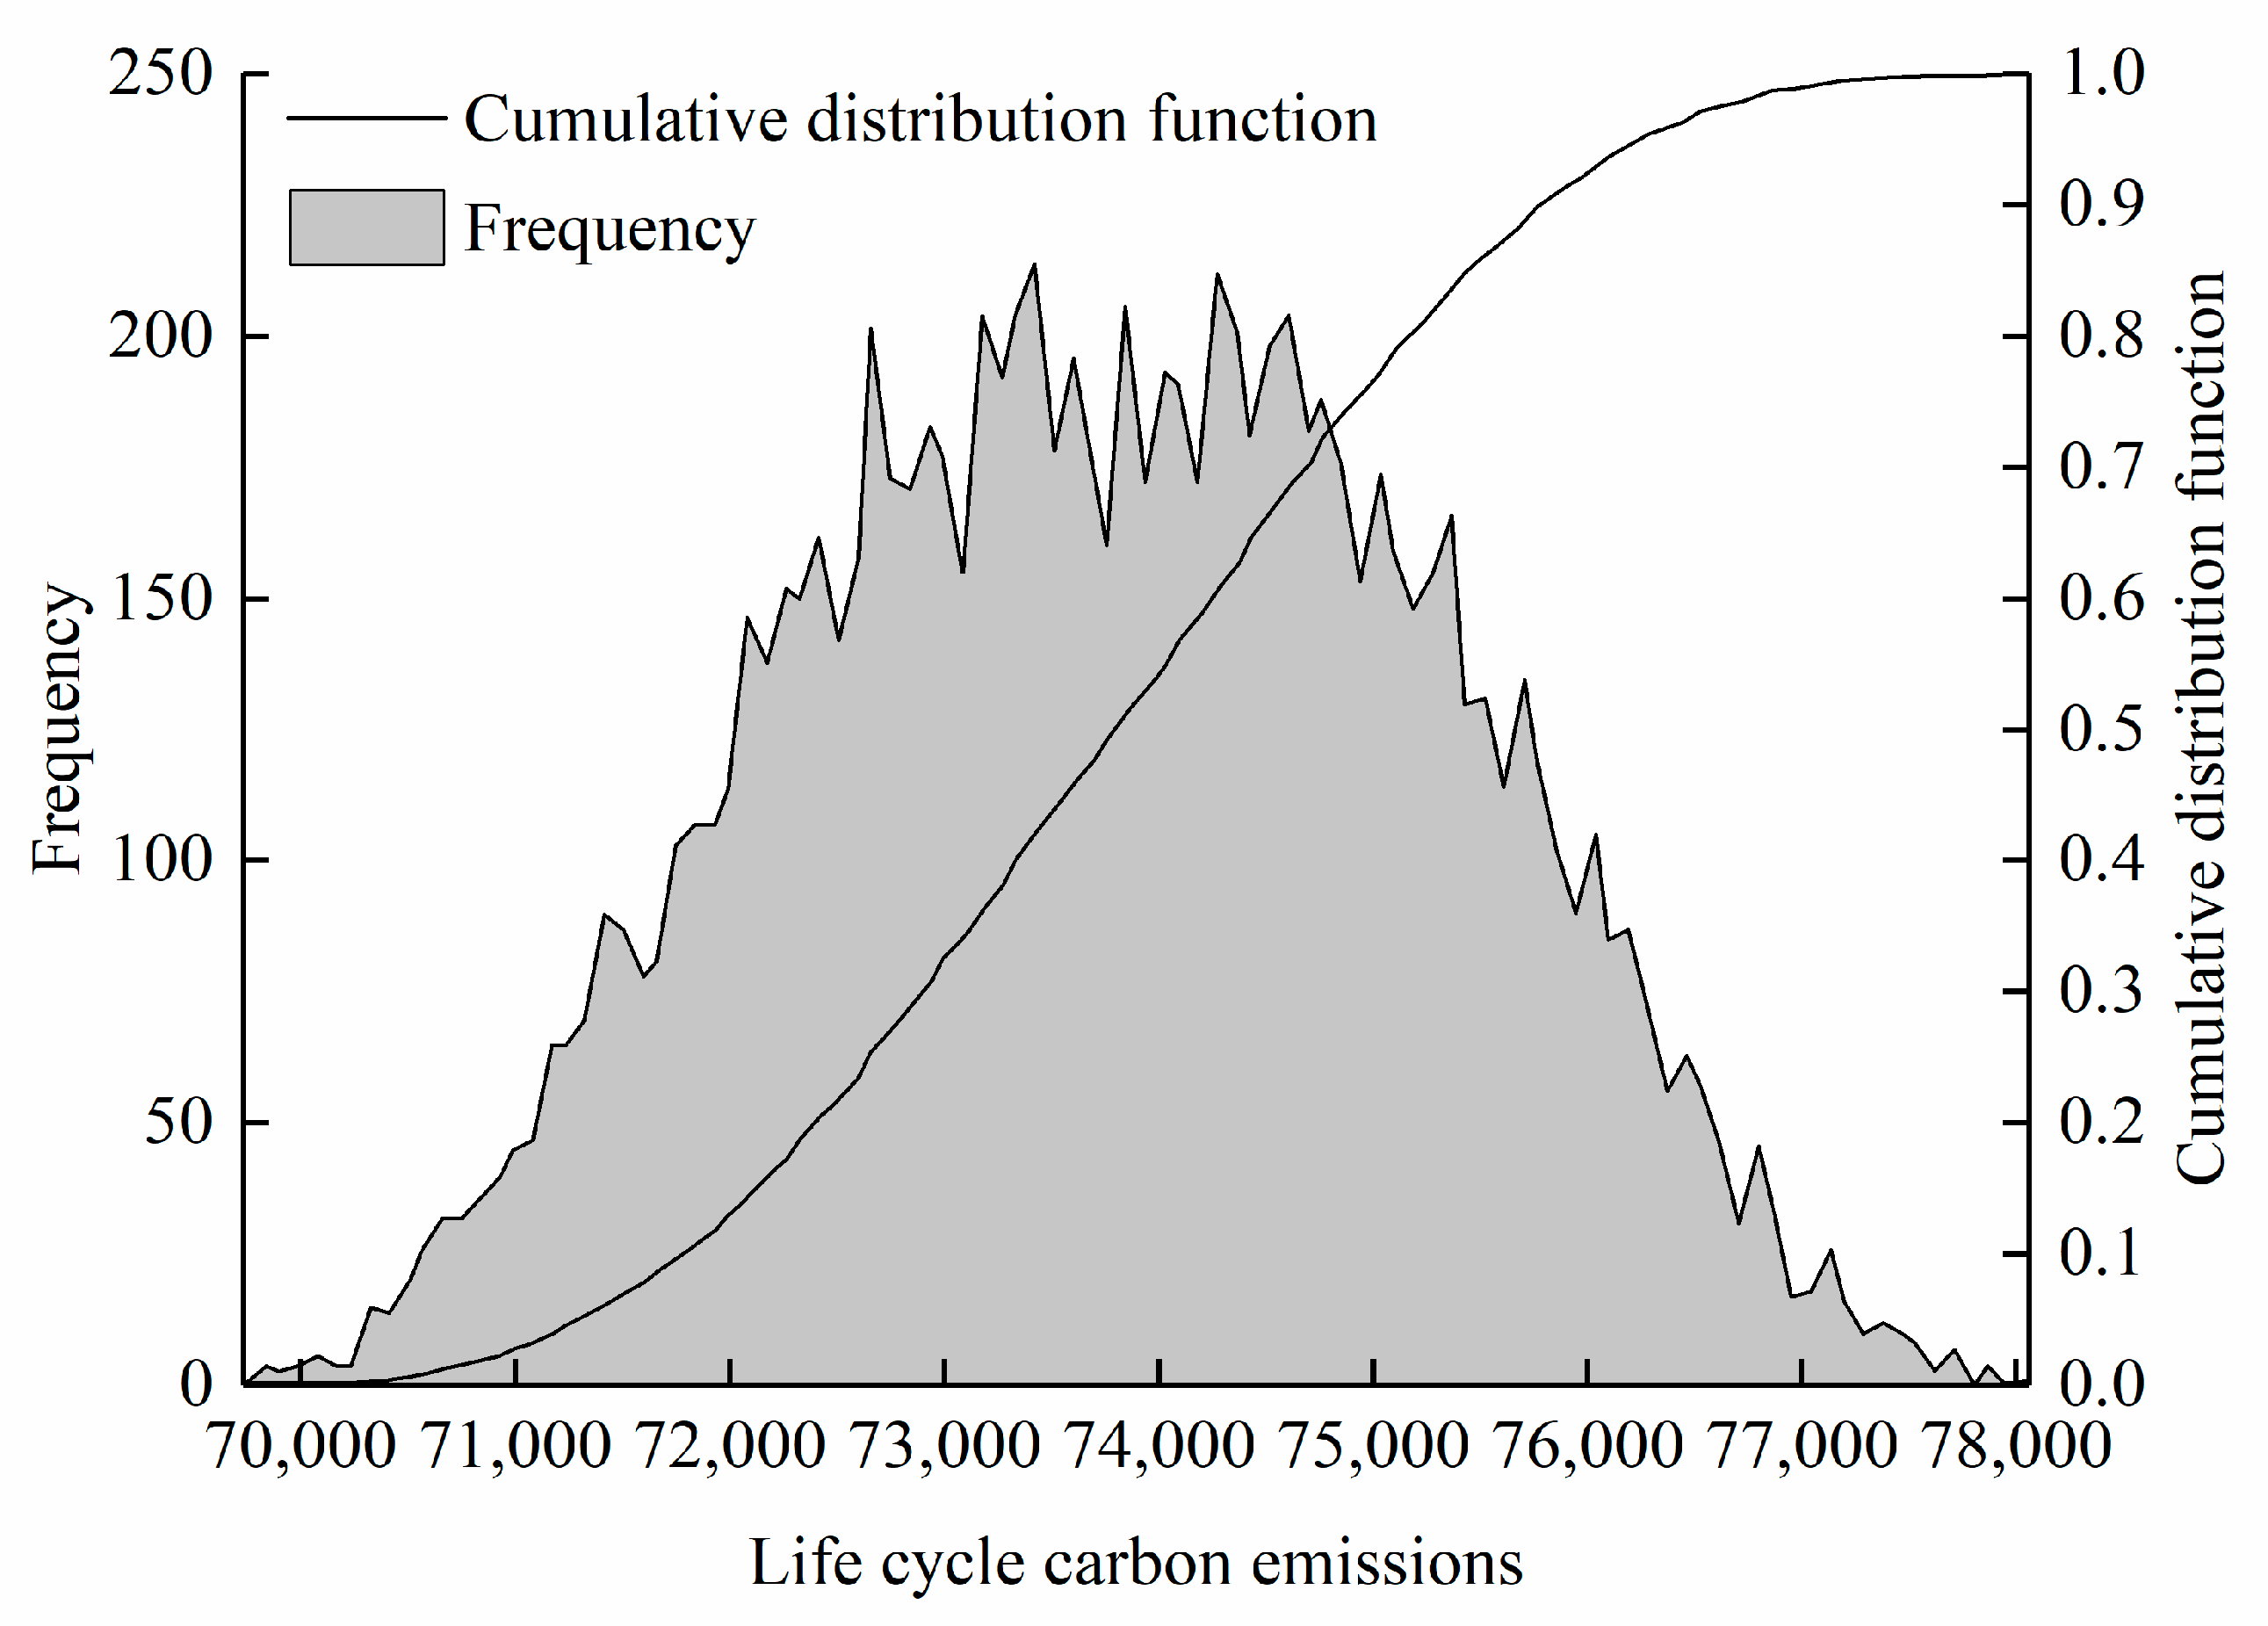
5.5. Life Cycle Carbon Dioxide Emissions Assessment Analysis

The total carbon dioxide emissions and the carbon dioxide emissions per unit ton·kilometer (kgCO2/t·km) were used to assess the carbon dioxide emissions of the life cycle for the elevator. According to Equation (1), the overall carbon dioxide emissions of the life cycle were about 73,812.01 kgCO2. The annual carbon dioxide emissions per ton·kilometer were about 27.18 kgCO2/t·km, which was calculated using Equation (2). The annual carbon dioxide emissions per ton·kilometer over the life cycle of the elevator may be used to assess the potential for sustainable application of the elevator. Global warming is a composite indicator for life cycle impact assessment. The primary gas that affects global warming is carbon dioxide. Therefore, the carbon dioxide emission of elevators was able to evaluate the life cycle environment or sustainability impact assessment of elevators to a certain extent. All calculation results are shown in Table 4.
The operation and maintenance stage had the highest carbon emissions in the life cycle, accounting for 57.32%. This was followed by 41.32% during the production and manufacturing stage. The installation stage and dismantling and scrapping stage had negligible impacts, at only 0.92% and 0.45%, respectively. In the operation and maintenance stage, the largest carbon emissions were derived from the electricity consumption during the operation stage at 15.41 kgCO2/t·km, accounting for 98.91% of emissions in this stage. During the production and manufacturing stage, the carbon emissions from raw material acquisition was 11.07kgCO2/t·km, accounting for 98.58% of the carbon emission during this stage. Therefore, the strongest measures that can be used involve reducing the energy consumption of the operation and optimizing the production process or reducing the carbon emissions of raw materials so that the environmental impact of elevators is greatly reduced.

6. Life Cycle Sensitivity Analysis and Carbon Reduction Strategy

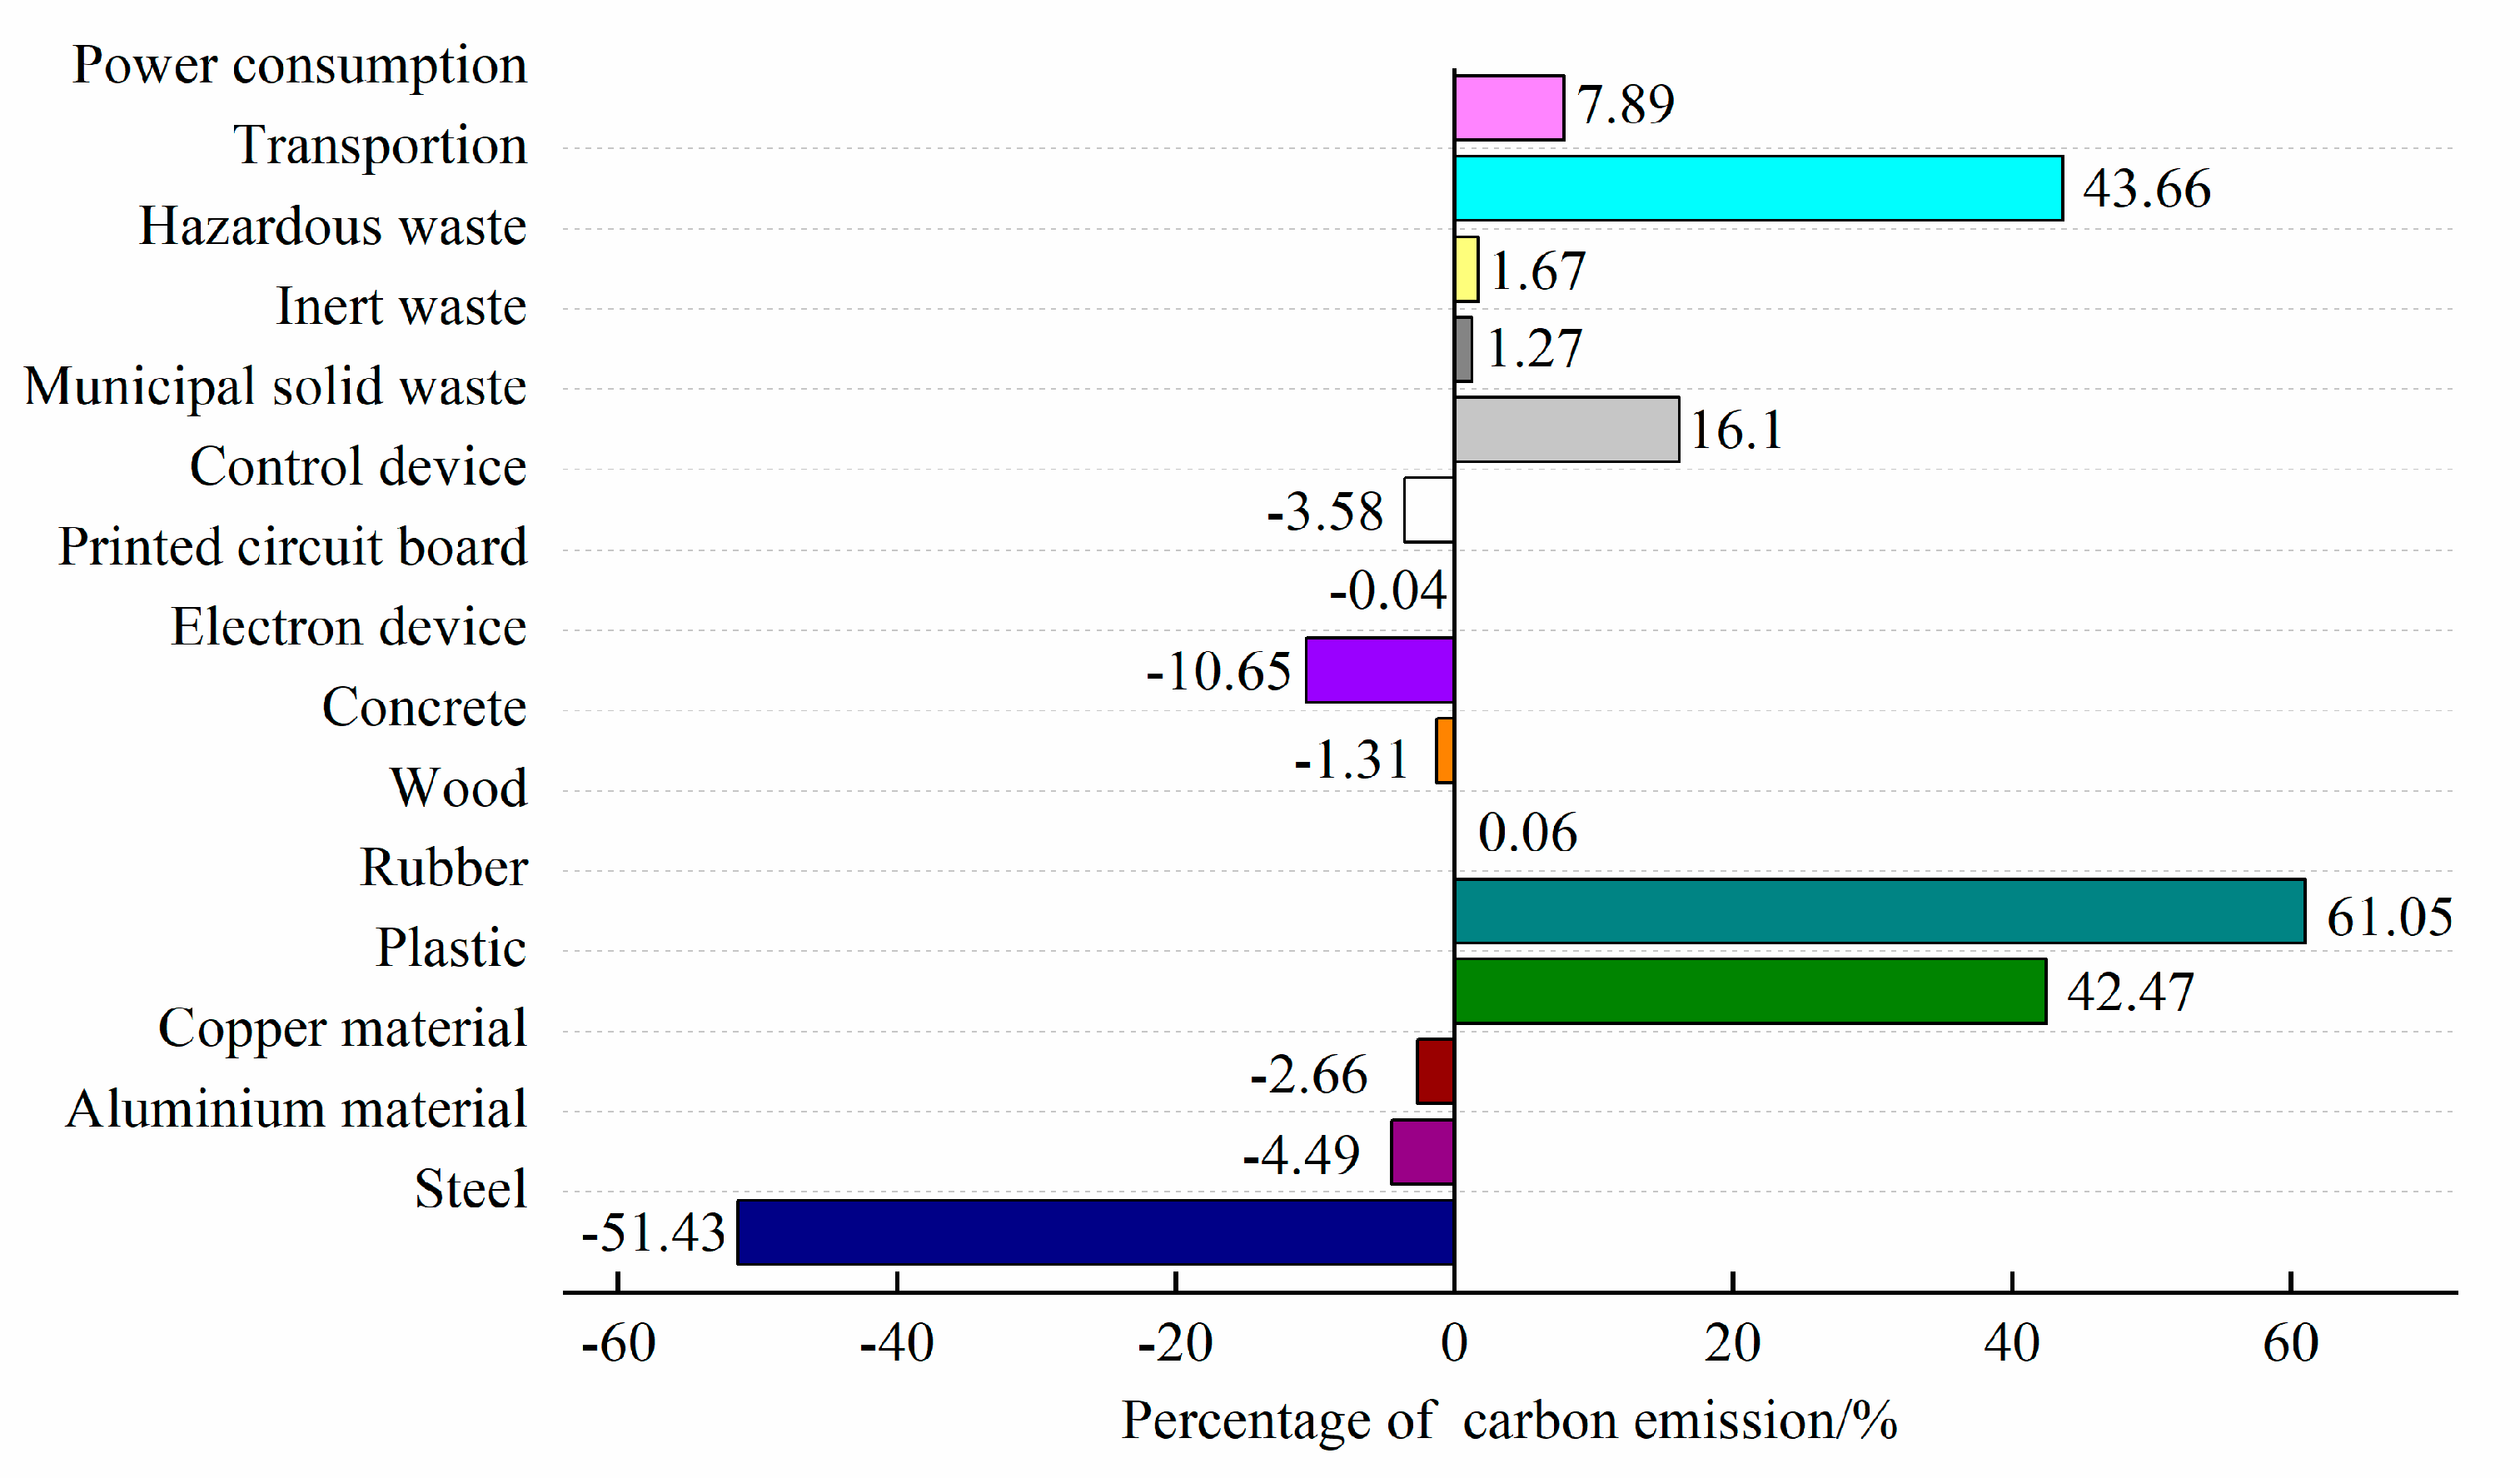
6.1. Life Cycle Sensitivity Analysis

The uncertainty of the characteristic parameters in the inventory analysis may have an impact on the results of the LCIA. The carbon dioxide emissions composition of the life cycle of the elevator was detailed in the previous section. The sensitivity of the characteristic parameters that account for a large share of carbon emissions should be paid attention to because of their uncertainty. Therefore, a sensitivity analysis of characterization factors was conducted in this study to properly propose energy-saving and carbon emission reduction measures.
The key characteristic parameters are listed in Table 5. As indicated in Table 5, when the characterization factors of the elevator were separately floated by ±10% and ±20%, all the carbon dioxide emissions of the life cycle were obtained in the new scenario. When comparing them with the life cycle carbon dioxide emissions of the original scenario, the results indicate that there was no significant change after and before floating the wood and alkyd paint variables. The eight variables polyvinyl chloride, copper, synthetic rubber, PC plastic, concrete, cast iron, aluminum and jute fiber had very little effect on the carbon dioxide emissions and the sensitivity after floating. The fluctuation of transportation distance also has little impact on carbon dioxide emissions in the life cycle. The reason was that the transportation distance was relatively short. Moreover, parts transportation and waste disposal of elevator equipment were all completed in the city or the neighboring cities. The cumulative carbon dioxide emissions of the life cycle changed significantly after the floating because the electric energy had the largest sensitivity coefficient, which was 0.5732. Great floating changes also took place in the three variables printed circuit boards, low-alloy steel and chromium steel. The order of the influence was electricity > printed circuit boards > low-alloy steel > chrome steel > aluminum > transportation, etc.
According to the above local sensitivity analysis, the changes in the four input parameters, namely, the quantity of low-alloy steel, printed circuit board, chromium steel and the power consumption, had significant impacts on the carbon dioxide emissions assessment of the life cycle. In contrast, the findings of the assessment were only slightly impacted by the sensitivity of the other parameters. The uncertainty in these four crucial sensitive parameters on the carbon dioxide emission assessment was further analyzed to assess the credibility of these findings. The uncertainties of these four parameters were determined based on the reliability of the activity level data sources, the errors arising from the model calculation and the literature, as shown in Table 6. The uncertainty analysis was simulated by the Monte Carlo method based on Crystal Ball software 10,000 times. The probability distribution of all essential sensitive parameters obeyed the triangular or uniform distribution. Finally, all the carbon dioxide emission distribution of the life cycle under each characteristic was determined.
Figure 7 depicts the uncertainty analysis result of the triangular distribution. The result indicates that the cumulative carbon dioxide emissions of the life cycle were 73,812.01 kgCO2. The 95% confidence interval was essentially distributed between 71,736.55 kgCO2 and 75,881.74 kgCO2 when the distribution of critical sensitivity parameters was characterized by a triangular distribution. The median confidence interval was 73,797.37 kgCO2. The coefficient of variation was 1.45%. Figure 8 depicts a uniform distribution uncertainty analysis result. When the distribution characteristics of the critical sensitivity parameters were uniformly distributed, the calculation results reveal that the 95% confidence interval was distributed between 70,962.36 kgCO2 and 76,718.93 kgCO2 with a median of 73,838.44 kgCO2 and a coefficient of variation of 2.04%. Therefore, the inventory data for low-alloy steel, printed circuit boards, chrome steel and electricity consumption could correctly evaluate the LCIA carbon dioxide emission results.

6.2. Carbon Reduction Strategy

Resources and energy were consumed during each stage of the elevator. As the production and operation stages accounted for the largest contribution of carbon dioxide emissions, they have the greatest potential for emission reduction accordingly energy conservation and sustainable application strategies should start from these two stages.
The materials consumed in the production stage accounted for more than 40% of the total carbon emissions during the life cycle. Furthermore, the carbon emissions of low-alloy steel, chromium steel, printed circuit boards and aluminum exceeded 90% of the total carbon emissions during this stage. Therefore, the consumption of materials had a significant impact on carbon emissions. Therefore, the consumption of materials had a greater impact on carbon emissions and should be regarded as a key breakthrough in reducing carbon emissions and improving sustainable application potential. Maximizing the recyclability of materials from a life cycle perspective saves resources and reduces environmental impacts. In addition, the development of new production technologies and processes for materials should be strengthened to reduce the production loss rate and the carbon emission factor of materials.
According to the previous analysis of CO2 emissions composition, it is clear that power consumption in the operation stage is the key focus of energy savings and carbon reduction in elevators. It is a good choice for an elevator to have an energy feedback device to reduce its energy consumption. Furthermore, the use of energy-efficient traction motors improves the power factor, thereby greatly increasing energy utilization. In addition, the carbon emissions factor of electricity can be lowered by applying renewable energy sources, which, in turn, reduces the CO2 emissions. Finally, the scheduling mode of the elevator can be optimized to reduce the number of starting and braking operations, which greatly improves the operating efficiency of the elevator, and thus, reduces its energy consumption.

7. Conclusions

The life cycle of an elevator has an influence on the environment. The scope of the elevator system should consider greenhouse gas emissions from the inputs and outputs of each stage. The inventory of the carbon dioxide emissions of the elevator was constructed for each stage based on an LCA. This systematic approach measures and mitigates the environmental impact of elevators and promotes sustainable development. A new benchmark assessment indicator, namely, annual carbon dioxide emission per unit ton·kilometer, was proposed to evaluate the environmental impact of elevators of different types and sizes within the elevator industry.
The total carbon dioxide emission of the traction elevator was 73,812.01 kgCO2. The carbon dioxide emission per ton·kilometer was 27.18 kgCO2/t·km. Among the four stages of life, the largest amount of CO2 was emitted during the operation and maintenance stage of the elevator, which accounted for 57.31%. This was followed by the manufacturing stage, which accounted for 41.31%. The largest CO2 emissions were 15.58kgCO2/t·km, which occurred during the operation and maintenance stage. The second largest CO2 emissions from raw material was 11.23 kgCO2/t·km, which was during the production and manufacturing stage.
The results of the sensitivity analysis of elevator carbon dioxide emissions show that the energy and the material (printed circuit boards, low-alloy steel, chrome steel) had the greatest impact on the carbon dioxide emissions. The impact of these crucial sensitivity variables was in the following order: electricity > printed circuit board > low-alloy steel > chrome steel > aluminum > transportation. Based on the LCIA and sensitivity analysis, a series of measures were proposed to reduce carbon emissions, such as improving the material recycling rate, reducing the carbon emission factor of materials, applying energy feedback devices, utilizing renewable energy sources, and optimizing the scheduling mode during the production and operation stages. The calculation methodology of the carbon emissions and the scope of the elevator system can provide a theoretical reference for further sustainability research. Furthermore, the LCI and LCIA of the case elevator in this study provide practical insights for carbon reduction and sustainable application throughout the life cycle. Although the global warming of CO2 emissions was evaluated in the study, some indicators of life cycle impact assessment have not yet been realized. Therefore, the evaluation of other indicators will be further improved in future research.

Author Contributions

Y.D.: methodology, investigation, data curation and writing—original draft; C.L.: conceptualization and review and editing; L.G.: investigation and software; X.C.: resources, conceptualization, methodology and validation; W.H.: conceptualization, methodology and validation. All authors have read and agreed to the published version of the manuscript.

Funding

This research was funded by financial support from the Natural Science Foundation of China, grant number 51566002.

Institutional Review Board Statement

Not applicable.

Informed Consent Statement

Not applicable for studies not involving humans.

Data Availability Statement

The data used in the study have been published in the text.

Conflicts of Interest

The authors declare no conflict of interest.

Appendix A

Table A1. Elevator technical specifications.
CategoryReference Value
Main purposePassenger transportation
Drive typeGearless traction
Rated load capacity1000 kg
Rated speed1.6 m/s
Number of stops15 floors
Travel height45 m
Internal dimensions of the elevator car2.1 m × 1.6 m × 1.4 m
Days of operation per year365 days
Category of application4
Service life25 years
Recommended applicationsResidential buildings, offices, hospitals, hotels, airports, shopping centers, etc.

Appendix B

Table A2. Carbon dioxide emissions factors from auxiliary materials and electric power in the production and manufacturing stage.
Material NameQuantityCarbon Dioxide Emissions Factor Material NameQuantityCarbon Dioxide Emissions Factor
Acetylene0.004 kg6.47 kgCO2/kgLiquid argon0.552.69 kgCO2/kg
Lubricants0.731 kg1.43 kgCO2/kgLiquid nitrogen10.140.48 kgCO2/kg
Organic material0.48 kg1.89 kgCO2/kgLiquid oxygen0.361.2 kgCO2/kg
Solder paste0.12 kg39.48 kgCO2/kgElectric power686.64 kW·h0.5839 kgCO2/kW·h
Table A3. Carbon dioxide emissions factors from manufacturing phase waste in the production and manufacturing stage.
Material NameQuantity (kg)Carbon Dioxide Emissions Factor
(kgCO2/kg)
Processing Method
Plastic10.032.38Incineration
Wood 0.700.0977Incineration
Cu−2.022.48Recycle
Fe−313.190.0304Recycle
Inert gases60.540.0053Landfill
Al−2.590.53Recycle
Municipal solid waste6.820.52Incineration
Electronic devices3.080.055Dismantling
Table A4. Quantity and carbon dioxide emissions factors of major packaging materials in the installation stage.
Material NameQuantity
(kg)
Carbon Dioxide Emissions Factor
(kgCO2/kg)
Material NameQuantity
(kg)
Carbon Dioxide Emissions Factor
(kgCO2/kg)
Plywood512.2080.22Cardboard10.450.61
Wood2380.0977Plastic6.922.92
Metal20.920.061Others0.37——

Appendix C

Table A5. Carbon dioxide emissions from the transportation of the elevator modules.
Elevator ModuleWeight
(kg)
Transport LocationTransport Distance
(km)
Mechanical modules464Suzhou–Kunshan Distribution Center332
Guiding device1892.5Tianjin–Kunshan Distribution Center1205
Shaft equipment847.7Suzhou–Kunshan Distribution Center37
Hanger and safety system521.68Shanghai–Kunshan Distribution Center80
Pit1247.82Tianjin–Kunshan Distribution Center1229
Carriage1601.03Suzhou–Kunshan Distribution Center30
Electrical system22.69Nantong–Kunshan Distribution Center196
Signal system157.98Nantong–Kunshan Distribution Center201
Elevator hall door1617.314Suzhou–Kunshan Distribution Center37
Door operating system357.88Suzhou–Kunshan Distribution Center37
Transportation to installation site8930.23Kunshan Distribution Center—installation locations60

References

  1. Huang, L.Z.; Krigsvoll, G.; Johansen, F.; Liu, Y.P.; Zhang, X.L. Carbon emission of global construction sector. Renew. Sustain. Energy Rev. 2018, 81, 1906–1916. [Google Scholar] [CrossRef]
  2. Company, B.P. BP Statistical Review of World Energy. Available online: https://www.bp.com/en/global/corporate/news-and-insights/press-releases/bp-statistical-review-of-world-energy-2021-a-dramatic-impact-on-energy-markets.html (accessed on 20 October 2022).
  3. Al-Kodmany, K. Tall Buildings and Elevators: A Review of Recent Technological Advances. Buildings 2015, 5, 1070–1104. [Google Scholar] [CrossRef]
  4. Liu, H.P.; Liu, K.; Sun, B.N. Analysis of Energy Management Strategy for Energy-Storage Type Elevator Based on Supercapacitor. In Proceedings of the 11th IEEE International Conference on Compatibility, Power Electronics and Power Engineering (CPE-POWERENG), Cadiz, Spain, 4–6 April 2016; IEEE: Cadiz, Spain, 2016; pp. 175–180. [Google Scholar]
  5. Makar, M.; Pravica, L.; Kutija, M. Supercapacitor-Based Energy Storage in Elevators to Improve Energy Efficiency of Buildings. Appl. Sci. 2022, 12, 7184. [Google Scholar] [CrossRef]
  6. China Elevator Association. 2023–2029 China Elevator Industry Industry Chain Panoramic Survey and Development Strategy Consulting Report. Available online: https://mbd.baidu.com/newspage/data/landingsuper?urlext=%7B%22cuid%22%3A%22gOHRagicHflOiHfS_uHCagPqugHa2aOgPvqt_u3HtKk0qqSB%22%7D&isBdboxFrom=1&pageType=1&sid_for_share=&context=%7B%22nid%22%3A%22news_9422246288446752277%22%7D (accessed on 6 January 2023).
  7. Barney, G.; Lorente, A. Simplified Energy Calculations for Elevators Based on ISO/DIS 25745-2. In Proceedings of the Symposium on Lift and Escalator Technologies, Northampton, UK, 26 September 2013; The CIBSE Lifts Group: London, UK, 2013; Volume 3, pp. 10–19. [Google Scholar]
  8. Keys, L.K. Design for manufacture; design for the life-cycle; systems life-cycle engineering. In Proceedings of the Fifth IEEE/CHMT International Electronic Manufacturing Technology Symposium, 1988, Design-to-Manufacturing Transfer Cycle, Lake Buena Vista, FL, USA, 10–12 October 1988; pp. 62–72. [Google Scholar]
  9. Blengini, G.A. Life cycle of buildings, demolition and recycling potential: A case study in Turin, Italy. Build. Environ. 2009, 44, 319–330. [Google Scholar] [CrossRef]
  10. Anshebo, M.A.; Mengesha, W.J.; Sokido, D.L. Developing a Green Building Assessment Tool for Ethiopia. Heliyon 2022, 8, e10569. [Google Scholar] [CrossRef]
  11. Xu, X.; Xu, P.; Zhu, J.; Li, H.; Xiong, Z. Bamboo construction materials: Carbon storage and potential to reduce associated CO2 emissions. Sci. Total Environ. 2022, 814, 152697. [Google Scholar] [CrossRef]
  12. Sartori, T.; Drogemuller, R.; Omrani, S.; Lamari, F. A schematic framework for Life Cycle Assessment (LCA) and Green Building Rating System (GBRS). J. Build. Eng. 2021, 38, 102180. [Google Scholar] [CrossRef]
  13. Cuéllar-Franca, R.M.; Azapagic, A. Environmental impacts of the UK residential sector: Life cycle assessment of houses. Build. Environ. 2012, 54, 86–99. [Google Scholar] [CrossRef]
  14. Pan, W.; Li, K.; Teng, Y. Rethinking system boundaries of the life cycle carbon emissions of buildings. Renew. Sustain. Energy Rev. 2018, 90, 379–390. [Google Scholar] [CrossRef]
  15. Blengini, G.A.; Di Carlo, T. The changing role of life cycle phases, subsystems and materials in the LCA of low energy buildings. Energy Build. 2010, 42, 869–880. [Google Scholar] [CrossRef]
  16. Ingrao, C.; Messineo, A.; Beltramo, R.; Yigitcanlar, T.; Ioppolo, G. How can life cycle thinking support sustainability of buildings? Investigating life cycle assessment applications for energy efficiency and environmental performance. J. Clean. Prod. 2018, 201, 556–569. [Google Scholar] [CrossRef]
  17. Azzouz, A.; Borchers, M.; Moreira, J.; Mavrogianni, A. Life cycle assessment of energy conservation measures during early stage office building design: A case study in London, UK. Energy Build. 2017, 139, 547–568. [Google Scholar] [CrossRef]
  18. Atmaca, A.; Atmaca, N. Carbon footprint assessment of residential buildings, a review and a case study in Turkey. J. Clean. Prod. 2022, 340, 130691. [Google Scholar] [CrossRef]
  19. Chau, C.K.; Leung, T.M.; Ng, W.Y. A review on Life Cycle Assessment, Life Cycle Energy Assessment and Life Cycle Carbon Emissions Assessment on buildings. Appl. Energy 2015, 143, 395–413. [Google Scholar] [CrossRef]
  20. Hao, J.L.; Cheng, B.; Lu, W.; Xu, J.; Wang, J.; Bu, W.; Guo, Z. Carbon emission reduction in prefabrication construction during materialization stage: A BIM-based life-cycle assessment approach. Sci. Total Environ. 2020, 723, 137870. [Google Scholar] [CrossRef]
  21. Barkhausen, R.; Rostek, L.; Miao, Z.C.; Zeller, V. Combinations of material flow analysis and life cycle assessment and their applicability to assess circular economy requirements in EU product regulations. A systematic literature review. J. Clean. Prod. 2023, 407, 137017. [Google Scholar] [CrossRef]
  22. Adak, M.F.; Duru, N.; Duru, H.T. Elevator simulator design and estimating energy consumption of an elevator system. Energy Build. 2013, 65, 272–280. [Google Scholar] [CrossRef]
  23. Vodopija, A.; Stork, J.; Bartz-Beielstein, T.; Filipič, B. Elevator group control as a constrained multiobjective optimization problem. Appl. Soft Comput. 2022, 115, 108277. [Google Scholar] [CrossRef]
  24. Bahn, H.; Cho, K.; Choi, H. An Energy-Efficient Elevator Operating System that Considers Sensor Information and Electricity Price Changes in Smart Green Buildings. J. Model. Optim. 2019, 11, 1–7. [Google Scholar]
  25. Ang, J.H.; Yusup, Y.; Zaki, S.A.; Salehabadi, A.; Ahmad, M.I. Comprehensive Energy Consumption of Elevator Systems Based on Hybrid Approach of Measurement and Calculation in Low- and High-Rise Buildings of Tropical Climate towards Energy Efficiency. Sustainability 2022, 14, 4779. [Google Scholar] [CrossRef]
  26. Zubair, M.U.; Zhang, X. Explicit data-driven prediction model of annual energy consumed by elevators in residential buildings. J. Build. Eng. 2020, 31, 101278. [Google Scholar] [CrossRef]
  27. Zhang, J.; Zong, Q. Energy-saving scheduling optimization under up-peak traffic for group elevator system in building. Energy Build. 2013, 66, 495–504. [Google Scholar] [CrossRef]
  28. Khonjun, S.; Pitakaso, R.; Sethanan, K.; Nanthasamroeng, N.; Pranet, K.; Kaewta, C.; Sangkaphet, P. Differential Evolution Algorithm for Optimizing the Energy Usage of Vertical Transportation in an Elevator (VTE), Taking into Consideration Rush Hour Management and COVID-19 Prevention. Sustainability 2022, 14, 2581. [Google Scholar] [CrossRef]
  29. Rotger-Griful, S.; Jacobsen, R.H.; Brewer, R.S.; Rasmussen, M.K. Green lift: Exploring the demand response potential of elevators in Danish buildings. Energy Res. Soc. Sci. 2017, 32, 55–64. [Google Scholar] [CrossRef]
  30. Barney, G.C.; Loher, A.G. Elevator Electric Drives: Concepts and Principles, Controls and Practice; International Association of Elevator Engineers by Ellis Horwood: New York, NY, USA, 1990; ISBN 0132614626. [Google Scholar]
  31. Barney, G. Energy Models for Elevators. In Proceedings of the 1st Symposium on Lift and Escalator Technologies, Northampton, UK, 29 September 2011; Volume 1, pp. 25–34. [Google Scholar]
  32. Daniel, C.; Forth, J.; Arthur, W.; Eric, H.; Douglas, R.; Martin, H. Methods and Apparatus for Retrieving Energy Readings from an Energy Monitoring Device. U.S. Patent 7089089B2, 8 August 2006. [Google Scholar]
  33. Chan, C.Y.B. Elevator Drive Systems Energy Consumption Study Report—UBC Social Ecological Economic Development Studies (SEEDS); University of British Columbia: Vancouver, BC, Canada, 2012; p. 125. [Google Scholar]
  34. Bannister, P.; Bloomfield, C.; Chen, H. Empirical prediction of office building lift energy consumption. In Proceedings of the Building Simulation 2011, 12th Conference of International Building Performance Simulation Association, Sydney, Australia, 14–16 November 2011; pp. 2635–2642. [Google Scholar]
  35. Tukia, T.; Uimonen, S.; Siikonen, M.-L.; Hakala, H.; Donghi, C.; Lehtonen, M. Explicit method to predict annual elevator energy consumption in recurring passenger traffic conditions. J. Build. Eng. 2016, 8, 179–188. [Google Scholar] [CrossRef]
  36. Tukia, T.; Uimonen, S.; Siikonen, M.-L.; Donghi, C.; Lehtonen, M. Modeling the aggregated power consumption of elevators—The New York city case study. Appl. Energy 2019, 251, 113356. [Google Scholar] [CrossRef]
  37. Association of German Engineers. VDI 4707 Guideline—Lifts Energy Efficiency; Association of German Engineers: Düsseldorf, Germany, 2007. [Google Scholar]
  38. Huijbregts, M.A.J. Application of uncertainty and variability in LCA. Part I: A general framework for the analysis of uncertainty and variability in life cycle assessment. Int. J. Life Cycle Assess. 1998, 3, 273–280. [Google Scholar] [CrossRef]
  39. Huijbregts, M.A.J. Part II: Dealing with parameter uncertainty and uncertainty due to choices in life cycle assessment. Int. J. Life Cycle Assess. 1998, 3, 343–351. [Google Scholar] [CrossRef]
  40. Marsh, E.; Allen, S.; Hattam, L. Tackling uncertainty in life cycle assessments for the built environment: A review. Build. Environ. 2023, 231, 109941. [Google Scholar] [CrossRef]
  41. ISO 14040:2006; Environmental Management—Life Cycle Assessment—Principles and Framework. ISO: Geneva, Switzerland, 2006.
  42. Hoxha, E.; Habert, G.; Chevalier, J.; Bazzana, M.; Le Roy, R. Method to analyse the contribution of material’s sensitivity in buildings’ environmental impact. J. Clean. Prod. 2014, 66, 54–64. [Google Scholar] [CrossRef]
  43. Goulouti, K.; Padey, P.; Galimshina, A.; Habert, G.; Lasvaux, S. Uncertainty of building elements’ service lives in building LCA & LCC: What matters? Build. Environ. 2020, 183, 106904. [Google Scholar]
  44. ISO 15686-8:2008; Buildings and Constructed Assets—Service Life Planning—Part 8: Reference Service Life and Service-Life Estimation. ISO: Geneva, Switzerland, 2008.
  45. Pannier, M.-L.; Schalbart, P.; Peuportier, B. Comprehensive assessment of sensitivity analysis methods for the identification of influential factors in building life cycle assessment. J. Clean. Prod. 2018, 199, 466–480. [Google Scholar] [CrossRef]
  46. Lu, H.R.; El Hanandeh, A.; Gilbert, B.P. A comparative life cycle study of alternative materials for Australian multi-storey apartment building frame constructions: Environmental and economic perspective. J. Clean. Prod. 2017, 166, 458–473. [Google Scholar] [CrossRef]
  47. Nowrouzi, M.; Abyar, H.; Younesi, H.; Khaki, E. Life cycle environmental and economic assessment of highly efficient carbon-based CO2 adsorbents: A comparative study. J. CO2 Util. 2021, 47, 101491. [Google Scholar] [CrossRef]
  48. ISO 14044:2006; Environmental Management—Life Cycle Assessment—Requirements and Guidelines. ISO: Geneva, Switzerland, 2006.
  49. National Pollutant Inventory. Emission Estimation Technique Manual for Gas Supply; NPI: Canberra City, Australia, 1999. Available online: https://www.dcceew.gov.au/sites/default/files/documents/fgassup.pdf (accessed on 16 May 2022).
  50. Intergovernmental Panel on Climate Change. 2006 IPCC Guidelines for National Greenhouse Gas Inventories; IPCC: Geneva, Switzerland, 2006.
  51. Chen, Y.; Shen, H.; Wang, J.y.; Zhao, W.k.; Pan, Z.j.; Wang, X.h.; Xiao, Y.j. Real-Time Calculation of Carbon Emissions in County-Level Administrative Regions Based on ‘Energy Brain’. J. Shanghai Jiao Tong Univ. 2022, 56, 1111–1117. [Google Scholar]
  52. Pechlivanidis, I.G.; Jackson, B.M.; McIntyre, N.R.; Wheater, H.S. Catchment scale hydrological modelling: A review of model types, calibration approaches and uncertainty analysis methods in the context of recent developments in technology and applications. Glob. Nest J. 2011, 13, 193–214. [Google Scholar]
  53. Castillo, J.N.; Resabala, V.F.; Freire, L.O.; Corrales, B.P. Modeling and sensitivity analysis of the building energy consumption using the Monte Carlo method. Energy Rep. 2022, 8, 518–524. [Google Scholar] [CrossRef]
  54. ISO 25745-2:2015(E); Energy Performance of Lifts, Escalators and Moving Walks —Part 2: Energy Calculation and Classification for Lifts (Elevators). ISO: Geneve, Switzerland, 2015.
  55. GB/T24041-2000; Environmental Management—Life Cycle Assessment—Goal and Scope Definition and Inventory Analysis. GB/T: Beijing, China, 2000.
  56. Ecoinvent Database, version 3.9.1; Ecoinvent 3.4 database; Swiss Centre for Life Cycle Inventories: Zurich, Switzerland, 2022.
Figure 1. Carbon dioxide emissions framework of the elevator in different stages.
Sustainability 15 13133 g001
Figure 2. Monte Carlo simulation method.
Sustainability 15 13133 g002
Figure 3. The percentages of carbon dioxide emissions in the manufacturing stage.
Sustainability 15 13133 g003
Figure 4. The percentage of the carbon dioxide emissions at the product installation stage.
Sustainability 15 13133 g004
Figure 5. Carbon dioxide emissions and shares during the maintenance stage.
Sustainability 15 13133 g005
Figure 6. Percentage of the carbon dioxide emissions during the demolition and scrapping stage.
Sustainability 15 13133 g006
Figure 7. Uncertainty analysis of the triangular distribution.
Sustainability 15 13133 g007
Figure 8. Uncertainty analysis of the uniform distribution.
Sustainability 15 13133 g008
Table 1. Carbon dioxide emission factors of the raw materials.
Material NameQuantity
(kg)
Carbon Dioxide Emissions Factor
(kgCO2/kg)
Material NameQuantity (kg)Carbon Dioxide Emissions Factor
(kgCO2/kg)
SrCO30.3751.51 Glass fiber1.1412.58
Low alloy steel 4631.5492.04Electric wires29.874.06
Polyvinyl chloride97.11.99 Control switches0.1818.46
Cu40.7084.15 Silicone resin103.25
Epoxy resin 1.7194.14Reactive silicon0.0061.81
Printed circuit board28.083351.02Plastic extruded board2.7949.98
Synthetic rubber 71.5332.82 PP plastic8.572.06
Chrome steel 1421.185.03 Paint coating31.348.09
Mg1.430.79PC plastic12.6217.87
Electron device 12.8835.64Acrylic0.888.49
Al51.94320.74Polyester resin0.63.12
Concrete 12100.0912Permanent magnets446.23
Cast iron211.131.89 White Kraft paper0.651.67
Plywood 0.006411.75Nylon 61.958.1
Jute fiber70.620. 7 Nylon 660.059.37
Lubricants7.071.43Iron ore0.80.12
Battery leads1.11.26H2SO40.8070.16
Bronze0.0065.2CaCO30.9071.69
Adhesive tape2.1324.69ABS plastic0.4074.55
Ethylene-vinyl acetate copolymer0.12.17
Table 2. Carbon dioxide emissions factors and treatment methods of packaging material waste.
Material NameQuantity (kg)Carbon Dioxide Emissions Factor
(kgCO2/kg)
Processing Method
Steel−20.920.0113Recycle
Wood750.20.015Incineration
Plastic6.922.38Incineration
Cardboard10.450.0322Incineration
Table 3. Carbon dioxide emissions from waste and recyclable waste.
Material NameQuantity (kg)Carbon Dioxide Emissions Factor
(kgCO2/kg)
Processing Method
Steel−5637.40.0304Recycle
Al−46.750.32Recycle
Cu−20.160.44Recycle
Plastic59.472.38Incineration
Rubber64.383.16Incineration
Wood 12.680.015Incineration
Concrete−10890.004Recycle
Electronic device −110.940.32Recycle
Printed circuit boards−3.780.0315Recycle
Control devices−11.591.06Recycle
Municipal solid waste103.180.52Incineration
Inert waste795.510.0053Landfill
Hazardous waste25.240.22Landfill
Table 4. Elevator carbon dioxide emissions from each stage of the whole life cycle (25 years).
StageCarbon Dioxide Emissions (kgCO2)Carbon Dioxide Emissions per Ton-Kilometer (kgCO2/t·km)
Production and manufacturing stage30,494.1411.23
installation stage679.180.25
Operation and maintenance stage42,303.2315.58
Dismantling and scrapping stage333.240.12
Total carbon dioxide emissions73,812.0127.18
Table 5. Life cycle resource/energy key input variables for ±10% and ±20% floating results.
Parameter Name (Unit)Carbon Dioxide Emissions after Floating (kgCO2)Sensitivity Factor
−20%−10%010%20%
Wood (kg)73,807.3673,809.6973,812.0173,814.3473,816.660.0003
PC plastic (kg)73,792.1573,802.1573,812.0173,822.0173,831.880.0013
Printed circuit boards (kg)71,840.4772,826.3173,812.0174,797.8575,783.550.1336
Alkyd paint (kg)73,793.0573,802.6073,812.0173,821.5673,830.970.0013
Low-alloy steel (kg)71,922.3472,867.2473,812.0174,756.9275,701.680.1280
Jute fiber73,782.3573,797.1873,812.0173,826.8473,841.670.0020
Aluminum (kg)73,596.5573,704.3573,812.0173,919.8174,027.470.0146
Cast iron (kg)73,732.2073,772.1873,812.0173,851.9873,891.820.0054
Concrete (kg)73,789.9473,801.0473,812.0173,823.1173,834.080.0015
Synthetic rubber (kg)73,771.6773,791.9173,812.0173,832.2573,852.360.0027
Chrome steel (kg)72,382.3073,097.2373,812.0174,526.9375,241.720.0968
Copper (kg)73,778.2273,795.1973,812.0173,828.9773,845.800.0023
Polyvinyl chloride (kg)73,773.3673,792.7673,812.0173,831.4073,850.660.0026
Transportation (km)73,696.7273,754.3773,812.0173,869.6573,927.300.0078
Electricity (kW·h)65,349.5969,580.8073,812.0178,043.2282,274.430.5732
Table 6. Uncertainty-analysis-related data.
Parameter NameValueUncertainty
Low-alloy steel4631.55±10%
Printed circuit boards28.08±10%
Chrome steel1421.18±10%
Electricity72,464.64±5%
Disclaimer/Publisher’s Note: The statements, opinions and data contained in all publications are solely those of the individual author(s) and contributor(s) and not of MDPI and/or the editor(s). MDPI and/or the editor(s) disclaim responsibility for any injury to people or property resulting from any ideas, methods, instructions or products referred to in the content.

